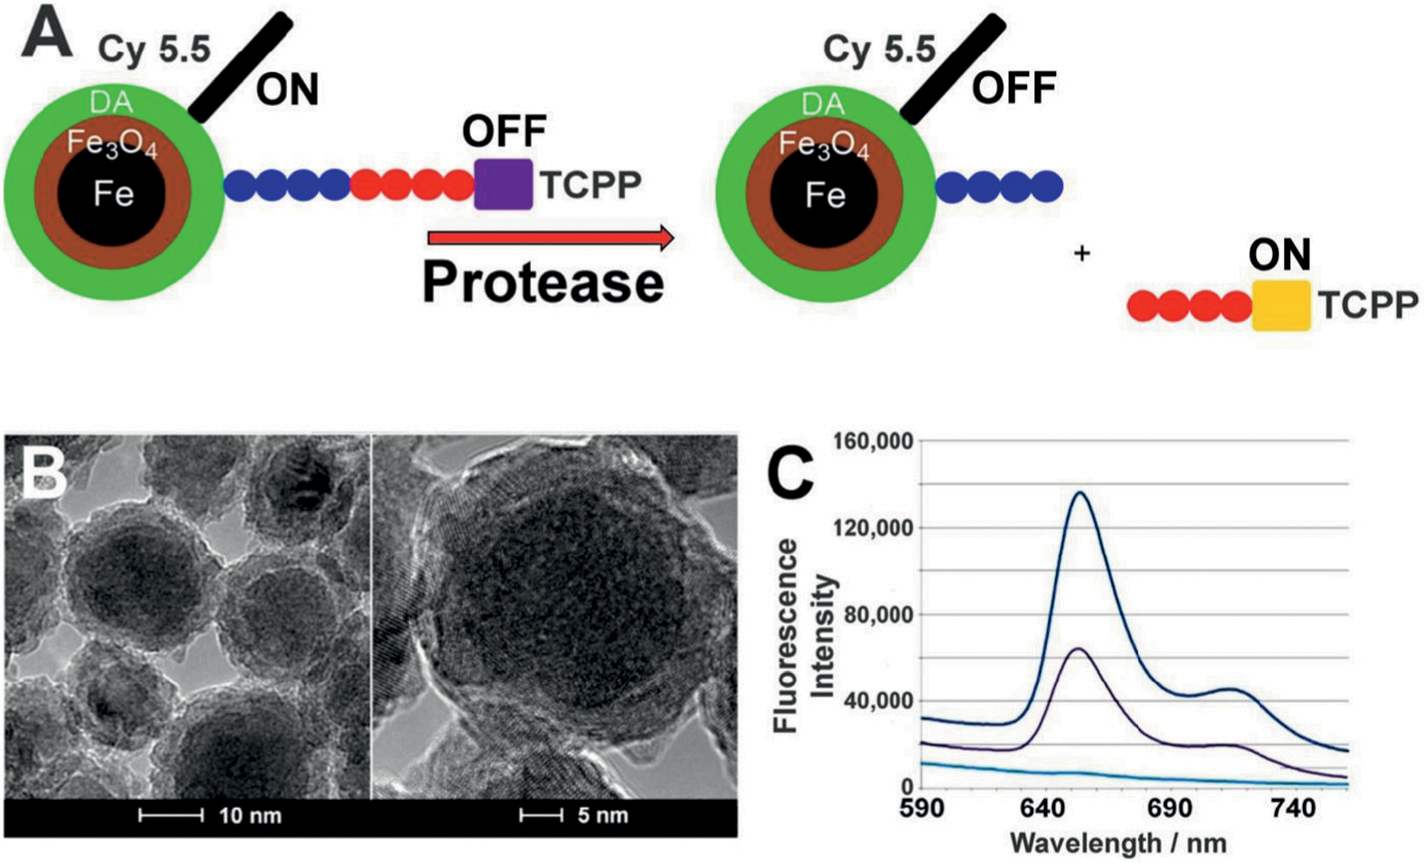
Figure 1.

(A) Design principles of a nanobiosensor for protease detection. The OFF mode (left side schematic) occurs when distance between fluorophore TCPP (tetrakis-carboxyphenyl-porphyrin), Fe/Fe3O4 nanoparticle, and FRET-acceptor cyanine (Cy) 5.5C is reduced; upon cleavage of the oligopeptide tether by a suitable protease present, this distance increases and leads to an increase in fluorescence intensity, which is called the ON mode (right side schematic). Blue and red colored circles indicate consensus sequences, as explained in Table 2. (B) TEM and HRTEM of dopamine-coated Fe/Fe3O4 core/shell nanoparticles showing basic core (darker areas) and shell (lighter areas) structure. (C) Typical emission spectra occurring from the nanosensor for MMP-13 after 1 h of incubation at 37 °C (λexc = 421 nm). Lower light blue line: buffer; middle black line: nanosensor; higher dark blue line: nanosensor after incubation with MMP-13.19
