

Abstract
Tumor endothelial cells (TECs) promote tumor angiogenesis and regulate cytotoxic T cells in the tumor microenvironment. However, the roles of TECs for tumor‐infiltrating T‐cell in hepatocellular carcinoma (HCC) is still unknown. Here, we aimed to investigate how TECs influenced tumor growth and immune responses of HCC focusing on CD8+ T‐cell infiltration and exhaustion. First, TECs were isolated from subcutaneous HCC tumors with murine HCC cell lines (BNL‐T) with magnetic selection of CD31+ cells, and normal endothelial cells (NECs) were isolated from normal liver. Second, immunocompetent mice were injected with BNL‐T alone, BNL‐T + NECs, or BNL‐T + TECs for tumor formation, and the functions and exhaustion of tumor‐infiltrating CD8+ T cells were evaluated. The mice injected with BNL‐T + TEC showed rapid tumorigenesis and a decrease in the number of infiltrating CD8+ T cells. In addition, the percentage of CD8+ T‐cell exhaustion was significantly higher in tumors from the administration of BNL‐T + TEC. Third, the next‐generation sequencing on TECs was performed to identify mRNAs that might be a novel treatment target. The molecule of glycoprotein nonmetastatic melanoma protein B (GPNMB) was identified and the functions of GPNMB was analyzed by silencing of GPNMB expression using small interfering RNAs. The silencing of GPNMB expression in TECs induced the suppression of tumor growth and T‐cell exhaustion. In conclusion, TECs induced tumor‐infiltrating T‐cell exhaustion via GPNMB expression and GPNMB might be a novel therapeutic target in HCC.
Keywords: GPNMB, immune suppression, liver cancer, tumor endothelial cell, tumor microenvironment
Tumor endothelial cells induced exhaustion in tumor‐infiltrating T cells by upregulating GPNMB; therefore, GPNMB might be a novel therapeutic target in hepatocellular carcinoma.
Abbreviations
- AFP
alpha‐fetoprotein
- BNL
BNL 1ME A.7R.1
- EC
endothelial cell
- GPNMB
glycoprotein nonmetastatic melanoma protein B
- GSEA
gene set enrichment analysis
- HCC
hepatocellular carcinoma
- ICAM‐1
intercellular cell adhesion molecule‐1
- LAG‐3
lymphocyte activation gene‐3
- MACS
magnetic‐activated cell sorting
- NEC
normal endothelial cell
- NES
normalized enrichment score
- PD‐1
programmed cell death‐1
- PD‐L1
programmed cell death ligand‐1
- ROS
reactive oxygen species
- TEC
tumor endothelial cell
- TIM‐3
T‐cell immunoglobulin and mucin domain‐containing protein 3
- TME
tumor microenvironment
- TNF‐α
tumor necrosis factor alpha
- VCAM‐1
vascular cell adhesion molecule‐1
- VEGF
vascular endothelial growth factor
- VEGFR1
vascular endothelial growth factor receptor 1
- VEGFR2
vascular endothelial growth factor receptor 2
- ZO‐1
zonula occludens‐1
1. INTRODUCTION
Hepatocellular carcinoma accounts for nearly all primary liver cancers. It is the fourth most common cause of cancer‐related death worldwide. Treatment options for HCC include surgical resection, radiofrequency ablation, trans‐arterial chemoembolization, and systemic chemotherapy. Recently, the combination of an anti‐programmed cell death ligand‐1 (PD‐L1) inhibitor and a VEGF inhibitor has shown clinically meaningful benefits for patients with unresectable HCC. 1 Currently, the field of immunotherapy with VEGF inhibitors is rapidly growing, but the mechanism underlying the anti‐tumor effects provided by immunotherapy combined with anti‐angiogenic therapy remains unclear. 2 , 3 , 4
Tumor blood vessels in the TME play important roles in solid tumor progression, and act as gatekeepers for tumor cells to metastasize to distant organs. 5 The characteristics and functions of TECs in tumor blood vessels are different from those of NECs in normal blood vessels. Indeed, compared with NECs, TECs have different morphology, altered blood flow, enhanced permeability, and structural abnormalities, due to differences in cell‐to‐cell connection and pericyte attachment. 3 , 6 , 7 Recent studies have reported that TECs could facilitate the escape of cancer cells from immune surveillance and induce cancer progression. In HCC, when TECs were functionally and structurally normalized, CD8+ T cells became activated and T‐cell infiltration increased. 8 The mechanism by which TECs facilitate immune escape remains unclear, but several studies have indicated that metabolic changes in the TME were related to CD8+ T‐cell expression of immune checkpoint proteins and CD8+ T‐cell exhaustion. 9 , 10 , 11 Cytotoxic T cells comprise an essential component of protective host immunity against malignant tumors. However, prolonged exposure to cognate antigens attenuates the effector capacity of T cells and limits their therapeutic potential. This process, known as T‐cell exhaustion, is involved in T‐cell dysfunction, tolerance, and senescence. 12
In the present study, we investigated the influence of TECs on HCC tumor growth and the host immune response, in vitro and in vivo. We compared TECs to NECs for their effects on CD8+ T‐cell functions, with a focus on T‐cell exhaustion. We performed next‐generation sequencing on TECs and NECs to investigate potential treatment targets, and we identified glycoprotein nonmetastatic melanoma protein B (GPNMB) as a candidate target. Finally, we investigated the effects of targeting GPNMB in TECs.
2. MATERIALS AND METHODS
2.1. Reagents
We purchased BSA from Sigma‐Aldrich and ProLong Glass Antifade Mountant with NucBlue™ Stain from Thermo Fisher Scientific.
2.2. Cell line and culture conditions
Experiments were performed with the BNL 1 ME A.7R.1 murine HCC cell line (American Type Tissue Culture Collection). Cells were maintained in high‐glucose DMEM (Nacalai Tesque), supplemented with 10% FBS (Invitrogen, Life Technologies), and cultivated in a humidified incubator at 37°C with 5% CO2.
A new, highly tumorigenic HCC cell line (BNL‐T) was established as previously described. 13 We injected a suspension of 5 × 10⁶ BNL cells in a volume of 100 μl into mice. At 3 or 4 weeks after the injection, subcutaneous tumors were harvested, minced, then incubated with collagenase type I. Dissociated tumor cells were placed in DMEM in a 10‐cm dish and incubated until they reached confluency. Then, tumor cells were again injected subcutaneously into mice. We repeated this procedure for three cycles. The original HCC cell line was designated BNL, and the HCC cells obtained after three cycles were designated BNL‐T.
2.3. Animal experiments
Animal experiments were performed with 8‐week‐old male BALB/cAJcl‐nu/nu immunodeficient mice and BALB/cAJcl immunocompetent mice (CLEA). To produce tumors in vivo, we injected mice with 5 × 10⁶ BNL cells subcutaneously. To obtain TECs and NECs, we harvested subcutaneous BNL tumors or healthy livers of BALB/cAJcl‐nu/nu mice, respectively, and isolated endothelial cells as previously reported. 14 CD31+ cells were plated and grown in Endothelial Cell Growth Medium 2‐MV (Lonza) in a humidified incubator. For in vivo tumor experiments, we subcutaneously injected BALB/c immunocompetent mice (n = 15 per group) with: 5 × 10⁵ BNL‐T cells (BNL‐T group), 4.5 × 10⁵ BNL‐T cells + 5 × 10⁴ NECs (BNL‐T + NEC group), or 4.5 × 10⁵ BNL‐T cells + 5 × 10⁴ TECs (BNL‐T + TEC group). Tumor volume (V) was determined three times per week with the formula V = d2 × D/2, where d was the minor tumor diameter and D was the major tumor diameter. This study was approved by the Animal Experiments Committee, Osaka University (approval number, 02‐065‐001).
2.4. Flow cytometry
Tumor endothelial cells and NECs were detached with trypsin–EDTA. Then, all cells were incubated with anti‐CD31 and anti‐CD105 antibodies. Subcutaneous tumors were minced and incubated using a Tumor dissociation kit (Miltenyi Biotec). After washing, single‐cell suspensions were filtered and incubated with anti‐CD4, anti‐PD‐1, anti‐CD45, anti‐TCRβ, anti‐CD8, anti‐T‐cell immunoglobulin and mucin domain‐containing protein 3 (anti‐Tim‐3), and Live/dead antibodies. All antibodies were purchased from BioLegend. These cells were analyzed using a FACS Calibur flow cytometer (BD Biosciences) and FACS Diva™ software (BD Biosciences). For the cell evaluation method, viable cells were gated from tumor cells, CD45‐positive cells were gated, lymphocytes were gated by size, doublets were removed, TCRβ‐positive CD3 cells were gated, and the percentages of CD4 and CD8 in CD3 cells were evaluated, followed by gating with CD8, and the percentages of PD‐1 positive and Tim‐3 positive cells in CD8 cells was evaluated.
2.5. Western blotting
Western blot analysis was performed as previously described. 15 The following primary antibodies used were: anti‐VEGFR1, anti‐VEGFR2, anti‐CD31 (Abcam); anti‐VE‐cadherin, anti‐ZO‐1 (zonula occludens‐1), anti‐β‐actin (Sigma‐Aldrich), and anti‐α‐fetoprotein (AFP, R&D systems); Vascular cell adhesion molecule‐1 (VCAM‐1, Cell Signaling Technology); intercellular cell adhesion molecule‐1 (ICAM‐1, Proteintech). Horseradish peroxidase (HRP)‐bound anti‐rabbit IgG (GE Healthcare Biosciences) and the ECL Prime Western Blotting Detection kit (GE Healthcare Biosciences) were also used for observation.
2.6. In vitro functional assays
Tube formation was analyzed as previously described. 16 Briefly, diluted Matrigel (Corning) was placed in each well of a 24‐well plate. Tumor‐cell viability was assessed using the CCK‐8 assay (Dojindo), as previously described. 17 Cell migration of NECs and TECs was evaluated by using the Radius™ 24‐Well Cell Migration Assay (Collagen I Coated; Cell Biolabs). Briefly, each cell line (5 × 10⁵ cells/well) was incubated in a 24‐well plate. Then, cell migration was observed into the cleared area using the ImageJ/Fiji® plugin “Wound Healing Tool.” Wound closure was expressed as the ratio of the percentages of wound‐closing areas, measured in high‐power fields.
2.7. Immunofluorescence staining
Immunofluorescence staining was performed as previously described. 18 Cells were stained with anti‐CD31 antibody (Dianova), anti‐CD8a antibody (Abcam), anti‐Ki67 antibody (Abcam), and anti‐GPNMB antibody (Bioss antibody). After counterstaining with DAPI, slides were evaluated under a fluorescence microscope (BZ‐X700; Keyence).
2.8. Evaluation of tumor‐infiltrating CD8+ T‐cell function and metabolism
Tumors were minced and dissociated using the Tumor dissociation kit. Tumor‐infiltrating CD8+ T cells were purified with antibody‐coated magnetic beads (CD8 [TIL] MicroBeads mouse, Miltenyi Biotec). ELISpot assays were performed as previously described. 19 Briefly, tumor‐infiltrating CD8+ T cells were sorted and plated at 6 × 10⁴ cells/well in 96‐well plates coated with anti‐interferon (IFN)‐γ antibodies (AN18; Mabtech). Tumor‐infiltrating CD8+ T cells were stimulated with BNL‐T (2 × 10⁴ cells), medium alone (negative control), or concanavalin A (positive control; Cayman Chemical). Each condition was tested in duplicate wells. Spots were counted using computer‐assisted image analysis (ELISpot analyzer; Cellular Technology). The total production of ROS was assessed using a ROS assay kit (Dojindo). Briefly, tumor cells were sorted to isolate tumor‐infiltrating CD8+ T cells. ROS production was determined using a fluorescence microscope (BZ‐X700; Keyence).
2.9. RNA sequencing and data analysis
An RNA library was prepared with a TruSeq stranded mRNA Library prep kit (Illumina), according to the manufacturer's instructions. Sequencing was performed on an Illumina NovaSeq 6000 platform in 101‐bp, paired‐end mode. Sequenced reads were mapped to mouse reference genome sequences (mm10) using TopHat v2.0.13, in combination with Bowtie2 v.2.2.3 and SAMtools v.0.1.19. The number of fragments per kilobase of exon per million mapped fragments (FPKMs) was calculated using Cufflinks v.2.2.1. We normalized mRNA expression data, and the values were expressed as logarithms, with 2 as the base (i.e., log2). We excluded mRNAs that were undetectable. Candidate target mRNAs were defined as those that showed more than a five‐fold difference between NEC and TEC expression levels.
2.10. GSEA
We analyzed mRNA expression levels to determine associations between TEC or NEC gene expression profiles and previously defined mouse gene expression profiles by performing a GSEA. 20 Biologically defined gene sets were obtained from the Molecular Signatures Database v7.4 (http://software.broadinstitute.org/gsea/msigdb/index.jsp).
2.11. Quantitative reverse transcription‐polymerase chain reaction
qRT‐PCR was performed as previously described. 21 Briefly, cDNA was synthesized using a Reverse Transcription System (Promega). qRT‐PCR was performed on an Applied Biosystems® ViiA™7 Real‐Time PCR System (Thermo Fisher Scientific). Amplification products were quantified with the THUNDERBIRD® SYBR qPCR Mix (TOYOBO). Each gene expression level was normalized to the expression of GAPDH, an endogenous control.
2.12. Small interfering RNA in TECs
We downregulated GPNMB expression in TECs by transfecting with 5 nM ssiRNA (Life Technologies) and Lipofectamine RNAiMAX reagent (Invitrogen), according to the manufacturer's instructions. As a control, we transfected TECs with Scrambled siRNA (Life Technologies). 18 We analyzed transfected TECs with functional, cell wound‐healing, and tube formation assays. We also tested the effects of GPNMB‐siRNA‐transfected TECs on in vivo tumor formation. Briefly, we injected 4.5 × 10⁵ BNL‐T cells + 5 × 10⁴ transfected TECs subcutaneously into each mouse (n = 10 per group).
2.13. Statistical analysis
Continuous variables were compared using Mann–Whitney U‐tests or Student's t tests. Statistical analyses were performed with JMP software version 15.0 (SAS Institute Inc.) and R version 3.6.2 (http://www.R‐project.org/).
3. RESULTS
3.1. NEC and TEC isolation and functional assessments
To compare the characteristics of NEC and TEC, each one was isolated from tumor or normal livers. Both TECs and NECs showed high expression levels of CD31 and CD105 that were specific markers for endothelial cells (Figure 1A). In western blotting, TECs, NECs, and BNL cells showed similar high expression levels of VEGFR1 and ZO‐1, which are well known as endothelial receptor and adhesion markers. Only BNL cells showed strong expression of AFP that was a specific marker for HCC (Figure 1B). These results suggested that we had successfully separated NEC and TEC from the tumors.
FIGURE 1.
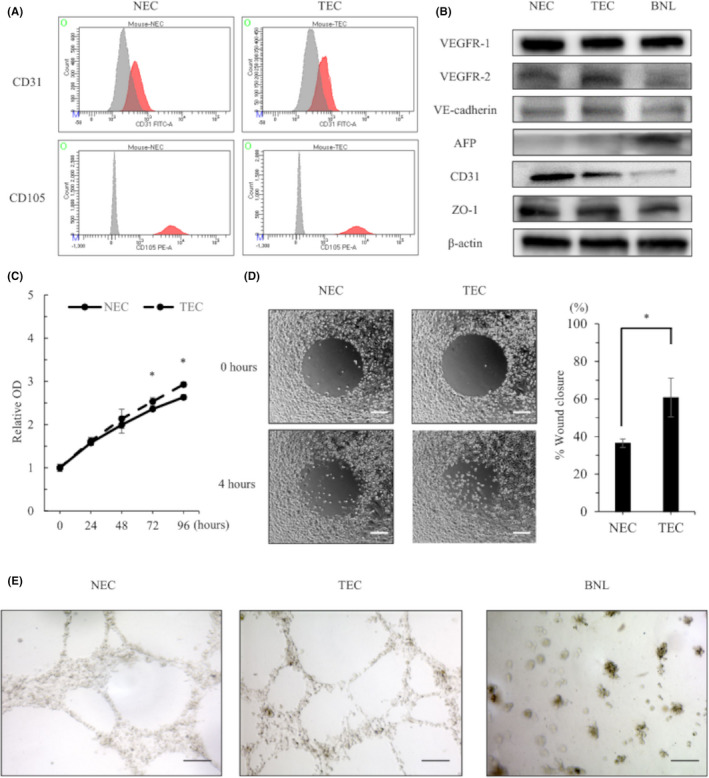
Characteristic and functional analysis for isolated TECs and NECs in vitro. (A) Flow cytometry results show CD31 and CD105 expression on TECs and NECs. The red line indicates the expression level of each protein. The gray line indicates the expression of an isotype control. (B) Western blot results in NECs, TECs, and BNL cells. (C) Proliferation of NECs and TECs. (D) NEC and TEC migration. (Right panel) Quantification of the wound closure rate. Scale bars: 200 μm. (E) Tube formation in isolated NECs, TECs, and BNL cells. Scale bars: 50 μm. *p < 0.05, ‡ p < 0.005, § p < 0.001
Compared with NECs, TECs showed greater proliferative ability (Figure 1C) and migration activity in wound‐healing assays (36.4% vs. 60.8%, p = 0 0.0031; Figure 1D). In tube‐forming assays, NECs and TECs formed round tubes characteristic of cultured endothelial cells, but BNL cells did not exhibit tube formation (Figure 1E). Therefore, cultured TECs and NECs maintained endothelial cell properties after cell isolation.
3.2. A highly tumorigenic cell line (BNL‐T) established with in vivo selection
The HCC parental cell line (BNL) showed a high rate of tumorigenesis (80%) in immunodeficient mice. However, in immunocompetent mice, the tumorigenesis rate was relatively low (60%) 2 weeks after injection. 14 To create a highly tumorigenic HCC cell line, we applied in vivo selection methods. After three cycles of selection, a novel, highly tumorigenic cell line (BNL‐T) was established. The BNL‐T‐cell line exhibited morphology similar to that of BNL cells. The BNL‐T cells formed subcutaneous tumors at a high rate (100%) and showed rapid tumor growth compared with BNL cells. Moreover, compared with BNL cells, BNL‐T cells showed significantly greater proliferation (p = 0.0039), invasiveness, and migration (Figure S1A‐C).
3.3. NEC and TEC tumorigenesis in a subcutaneous tumor model
We subcutaneously injected BNL‐T cells, alone, or combined with NECs or TECs (5 × 10⁴ cells). The total number of injected cells in each group was adjusted to 5 × 10⁵ cells. The BNL‐T + TEC group exhibited rapid tumorigenesis compared with the BNL‐T and BNL‐T + NEC groups (Figure 2A). When tumor tissues were stained with anti‐CD31 antibody to detect tumor vessels, the BNL‐T + TEC group showed significantly larger numbers of vessels (32.4/field) compared with the BNL‐T and BNL‐T + NEC groups (25.2 and 26.8/field, respectively, p < 0.001; Figure 2B). The proportion of Ki‐67‐positive cells was significantly larger in the BNL‐T + TEC group (36.3%) than in the BNL‐T and BNL‐T + NEC groups (15.8% and 18.3%, respectively; p < 0.001; Figure 2C). Notably, double immunofluorescence CD31 and CD8 staining demonstrated significantly fewer tumor‐infiltrating CD8+ T cells in the BNL‐T + TEC group (8.2 cells/field), compared with the BNL‐T and BNL‐T + NEC groups (11.6 and 11.8 cells/field, respectively; p = 0.004; Figure 2D).
FIGURE 2.
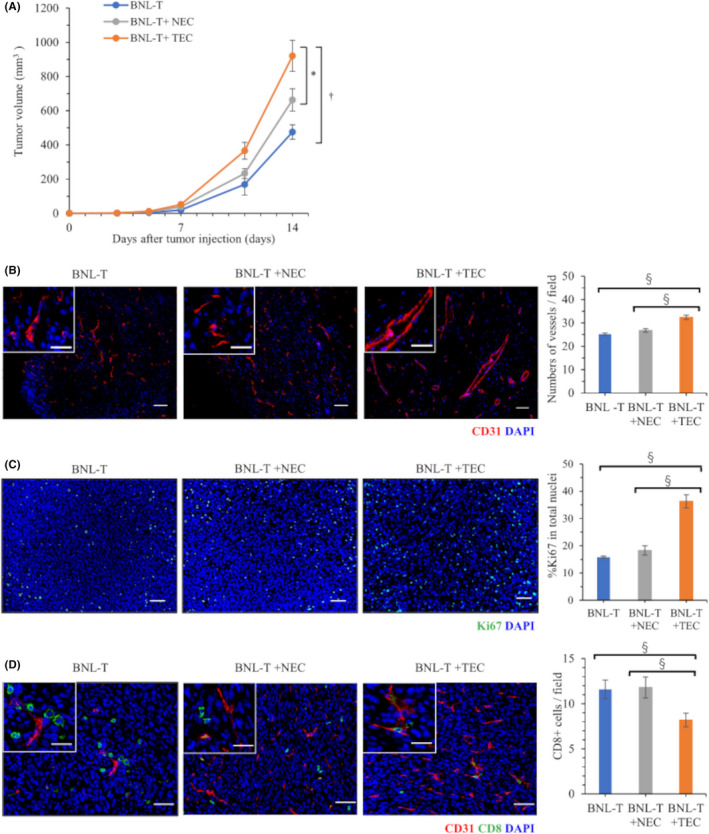
Differences in tumorigenesis between NECs and TECs in a subcutaneous tumor model. (A) Volumes of tumors grown in mice subcutaneously injected with BNL‐T alone, BNL‐T + NEC, or BNL‐T + TEC. (B) Immunofluorescence images of CD31 staining in tumor tissues. Nuclei were counterstained with DAPI. Scale bars: high‐power field, 20 μm; low‐power field: 50 μm. (Right panel) Quantification of vessel numbers. (C) Representative immunofluorescence images of cells stained for Ki‐67. Nuclei were counterstained with DAPI. Scale bars: 50 μm. (Right panel) Proportions of Ki‐67‐positive cells among the total number of cells with intact nuclei. (D) Double immunofluorescence staining of CD31 and CD8 in each group. (Right panel) Quantification of the numbers of tumor‐infiltrating CD8+ T cells. Scale bars: high‐power field, 20 μm; low‐power field, 50 μm. *p < 0.05, ‡ p < 0.005, § p < 0.001
3.4. TECs induced tumor‐infiltrating CD8+ T‐cell exhaustion
Flow cytometry revealed that the proportion of CD8+ T cells among the CD3+ cells was significantly lower in BNL‐T + TEC tumors (6.4%) than in BNL‐T and BNL‐T + NEC tumors (10.1% and 10.5%, respectively; p < 0.01). Accordingly, the mean number of tumor‐infiltrating CD8+ T cells per unit weight was significantly lower in BNL‐T + TEC tumors (1.30/mg) compared with BNL‐T and BNL‐T + NEC tumors (1.88 and 1.90/mg, respectively; p = 0.0020; Figure 3A). In contrast, the proportions of CD4 in CD3 did not significantly differ among the three tumors (17.6%, 18.8% and 18.4% in BNL‐T, BNL‐T + NEC and BNL‐T + TEC, respectively, p = 0.789). To evaluate the exhaustion of CD8+ T cells, we assessed the proportions of PD‐1+Tim‐3+CD8+ T cells among CD8+ T cells, that were well applied for T‐cell exhaustion markers. 22 , 23 The proportions of PD‐1+Tim‐3+CD8+ T cells among CD8+ T cells were significantly higher in BNL‐T + TEC tumors (31.2%) compared with BNL‐T and BNL‐T + NEC tumors (0.2% and 2.9%, respectively; p = 0.004; Figure 3B).
FIGURE 3.
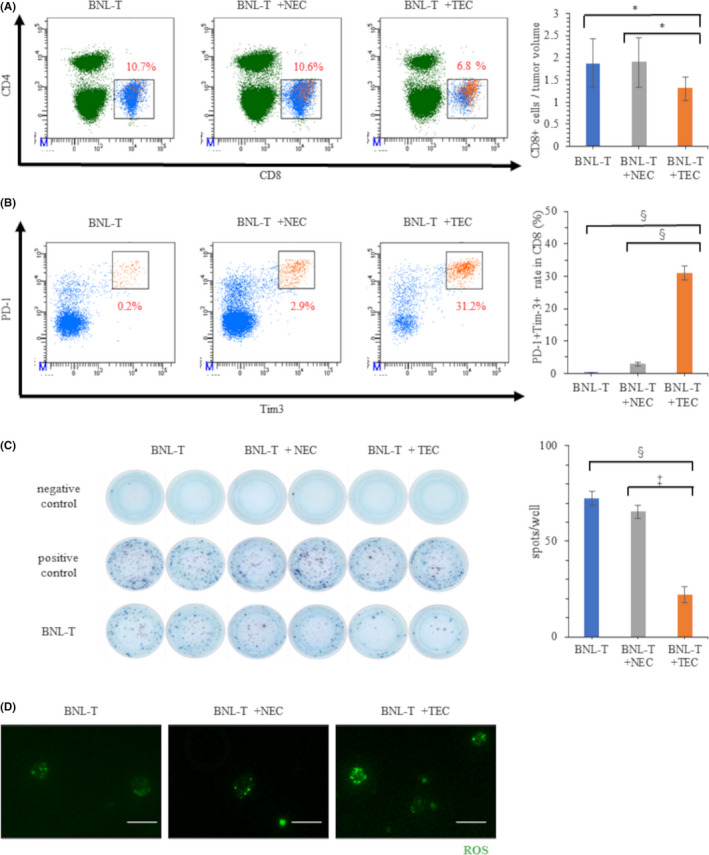
Characteristics and functions of tumor‐infiltrating CD8+ T cells. (A) Percentages of CD8+ T cells in tumor tissues from mice injected with BNL‐T alone, BNL‐T + NEC, or BNL‐T + TEC. (Right panel) The numbers of CD8+ T cells per tumor weight in each group. (B) Percentages of PD‐1+Tim‐3+ T cells among all CD8+ T cells in each group. (Right panel) Quantification of the proportion of PD‐1+Tim‐3+ T cells among all CD8+ T cells. (C) Representative ELISpot results show IFN‐γ production in CD8+ T cells isolated from each tumor served as the target cells. Medium alone served as the negative control, and concanavalin A served as the positive control. (Right panel) Quantification of the number of spots in each well. (D) ROS production in tumor‐infiltrating CD8+ T cells in each group. Scale bars: 50 μm. *p < 0.05, ‡ p < 0.005, § p < 0.001
We investigated IFN‐γ production with ELISpot assays, in which CD8+ T cells sorted from BNL‐T tumors were used as target cells. The results showed that CD8+ T cells sorted from BNL‐T + TEC tumors produced significantly less IFN‐γ (22 spots, p = 0.002), compared with CD8+ T cells sorted from BNL‐T (74 spots) and BNL‐T + NEC (66 spots) tumors (Figure 3C). These results indicated that the tumor‐infiltrating CD8+ T cells from BNL‐T + TEC tumors were exhausted and produced low levels of IFN‐γ against the BNL‐T cells. Then, we measured total ROS production to evaluate metabolic deficiencies in tumor CD8+ T cells. We found that ROS accumulated in CD8+ T cells from BNL‐T + TEC tumors. The total ROS production was lower in CD8+ T cells from BNL‐T and BNL‐T + NEC tumors than in CD8+ T cells from BNL‐T + TEC tumors (Figure 3D).
3.5. Transcriptome analysis of NECs and TECs with next‐generation sequencing
Based on the preceding results, we suspected that TECs played important roles in tumor growth and T‐cell exhaustion in HCC. We also hypothesized that specific molecules expressed by TECs affected the TME and led to CD8+ T‐cell exhaustion. To identify candidate molecules, we performed a transcriptome analysis of NECs and TECs with next‐generation sequencing. We identified 42 mRNAs that showed greater than five‐fold differences between NECs and TECs (Figure 4A). To investigate functional differences between NECs and TECs, we performed a GSEA with the NEC and TEC RNA sequence data. The GSEA results showed that TECs were more highly correlated than NECs to the IFN‐γ response target‐gene set and the regulation of acute inflammatory response target‐gene set (Figure 4B).
FIGURE 4.
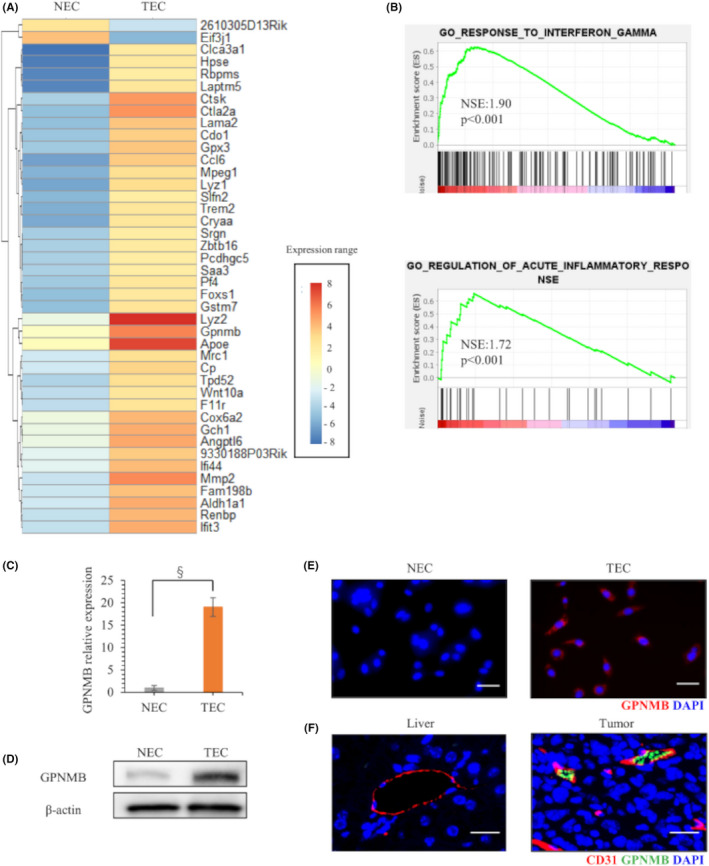
Next‐generation sequencing detection of upregulated mRNA expression in TECs. (A) Heatmap analysis shows selected mRNAs with more than five‐fold differences in expression between NECs and TECs. (B) GSEA of NEC and TEC sequence data. (C) qRT‐PCR results show baseline GPNMB expression in NECs and TECs. (D) Western blot results show GPNMB protein expression in NECs and TECs. (E) Immunofluorescence GPNMB staining in NECs and TECs. Nuclei were counterstained with DAPI. Scale bars: 50 μm. (F) Double immunofluorescence CD31 and GPNMB staining in normal liver and in tumor cells from mice injected with BNL‐T + TEC. Scale bars: 50 μm. *p < 0.05, ‡ p < 0.005, § p < 0.001
Focusing on the genes reported for tumor immunity among the 42 genes, GPNMB was examined because it had the largest fold change among the reported gene groups. The GPNMB mRNA expression level in TECs was upregulated by over 15‐fold, compared with GPNMB expression in NECs (Figure 4C). Western blotting and immunocytochemical staining confirmed that GPNMB expression was upregulated in the cytoplasm of TECs (Figure 4D,E). Double immunofluorescence staining of CD31 and GPNMB demonstrated that GPNMB was expressed in tumor blood vessels, but not in normal blood vessels of normal liver (Figure 4F).
3.6. Downregulating TEC GPNMB expression reduced proliferation and migration in vitro
By downregulating GPNMB with siRNAs (siGPNMB‐1 and siGPNMB‐2), GPNMB expression was significantly suppressed to 10%–15%, compared with GPNMB expression in TECs transfected with scrambled siRNA (siScramble; Figure 5A). Western blotting confirmed the suppression of GPNMB protein expression (Figure 5B). Proliferation was inhibited in TECs transfected with siGPNMB‐1 or siGPNMB‐2, to ~20–30% of the levels observed in TECs transfected with siScramble (Figure 5C). The wound‐healing assay showed that TEC migration was significantly interrupted by downregulating GPNMB expression; wound closure was 33.4% in cells transfected with siGPNMB‐1, 34.2% in cells transfected with siGPNMB‐2, and 56.5% in cells transfected with siScramble (p < 0.001; Figure 5D, Figure S2A). Tube formation assays demonstrated that the length of tubes in TECs was found to be significantly shortened by suppressing the GPNMB expression; the average tube length was 4750 μm in cells transfected with siGPNMB‐1, 4567 μm in cells transfected with siGPNMB‐2, and 7500 μm in cells transfected with siScramble (Figure S2B). In western blotting, the expression of adhesion factors, ICAM‐1 and VCAM‐1, was increased by suppressing GPNMB expression in TECs (Figure 5B).
FIGURE 5.

GPNMB downregulation with siRNA in TECs and the effects on tumorigenesis. (A) qRT‐PCR results show GPNMB expression in TECs after transfection with siScramble, siGPNMB‐1, or siGPNMB‐2. (B) Western blot results in TECs after transfection with siScramble, siGPNMB‐1, or siGPNMB‐2. (C) TEC proliferation after knocking down GPNMB expression. (D) TEC migration after knocking down GPNMB expression. (E) Volumes of tumors grown in mice subcutaneously injected with BNL‐T + NEC or BNL‐T + TECs transfected with siScramble, siGPNMB‐1, or siGPNMB‐2. (F) Immunofluorescence images of CD31 staining in tumor tissues from mice injected with BNL‐T + TECs transfected with siScramble, siGPNMB‐1, or siGPNMB‐2. Nuclei were counterstained with DAPI. Scale bars: high‐power field, 20 μm, low‐power field, 50 μm. (Right panel) Quantification of vessel numbers. (G) Representative immunofluorescence images of Ki‐67 staining in tumor tissues from mice injected with BNL‐T + TEC after knocking down GPNMB expression. Nuclei are counterstained with DAPI. Scale bars: 50 μm. (Right panel) Quantification of Ki‐67‐positive rates among all cells with intact nuclei. (H) Double immunofluorescence images of CD31 and CD8 staining in a tumor from a mouse injected with BNL‐T + TEC after knocking down GPNMB expression. (Right panel) Quantification of the numbers of infiltrating CD8+ T cells. Scale bars: high‐power field, 20 μm, low‐power field, 50 μm. *p < 0.05, ‡ p < 0.005, § p < 0.001
3.7. GPNMB downregulation in TECs inhibited tumor growth and suppressed T‐cell exhaustion
Next, we examined the effects of downregulating GPNMB in TECs in vivo. We subcutaneously injected mice with BNL‐T + NECs or BNL‐T + TECs transfected with siScramble, siGPNMB‐1, or siGPNMB‐2. Tumorigenesis was slower in mice injected with BNL‐T + siGPNMB‐1‐transfected TECs, or BNL‐T + siGPNMB‐2‐transfected TECs, compared with mice injected with BNL‐T + NECs or BNL‐T + siScramble‐transfected TECs (Figure 5E). We counted the numbers of vessels that expressed CD31 in harvested subcutaneous tumors. We found significantly fewer vessels in the BNL‐T + siGPNMB‐1 TEC group (24.2/field) and the BNL‐T + siGPNMB‐2 TEC group (24.8/field), compared with the BNL‐T + siScramble TEC group (35.6/field, p < 0.001; Figure 5F). The proportions of Ki‐67‐positive proliferating TECs decreased by downregulating GPNMB. TEC proliferation rates were 19.2%, 18.9% and 38.5%, after transfection with siGPNMB‐1, siGPNMB‐2, and siScramble, respectively (p < 0.001; Figure 5G). Double immunofluorescence CD31 and CD8 staining showed that the number of tumor‐infiltrating CD8+ T cells was significantly higher in BNL‐T + siGPNMB‐1 TEC tumors (12.0/field) and BNL‐T + siGPNMB‐2 TEC tumors (11.6/field), compared with BNL‐T + siScramble TEC tumors (7.8/field; p < 0.001; Figure 5H).
3.8. Functional changes in tumor‐infiltrating CD8+ T cells after suppressing GPNMB expression
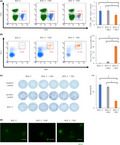
Flow cytometry demonstrated that the ratios of CD8+ T cells to CD3+ cells were not significantly different in tumors from mice injected with BNL‐T + siScramble TECs (6.0%), BNL‐T + siGPNMB‐1 TECs (5.5%), and BNL‐T + siGPNMB‐2 TECs (6.5%; p = 0.332). However, the number of tumor‐infiltrating CD8+ T cells per unit weight was significantly higher in tumors from mice injected with BNL‐T + siGPNMB‐1 TECs (1.52/mg) or BNL‐T + siGPNMB‐2 TECs (2.67/mg), compared with tumors from mice injected with BNL‐T + siScramble TECs (1.27/mg; p = 0.014). The proportions of exhausted CD8+ T cells, based on PD‐1 and Tim‐3 expression, were significantly lower in tumors from mice injected with BNL‐T + TECs transfected with siGPNMB‐1 (17.1%) or siGPNMB‐2 (9.8%), compared with tumors from mice injected with BNL‐T + TECs transfected with siScramble (31.3%, p < 0.001; Figure 6A). The IFN‐γ ELISpot assays showed that significantly more CD8+ T cells were present in tumors from mice injected with BNL‐T + TECs transfected with siGPNMB‐1 (87 spots) or siGPNMB‐2 (86 spots) compared with tumors from mice injected with BNL‐T + TECs transfected with siScramble (22 spots, p < 0.001; Figure 6B). These results indicated that downregulating GPNMB expression in TECs inhibited T‐cell exhaustion and restored IFN‐γ production. Moreover, downregulating TEC GPNMB expression reduced cytoplasmic ROS accumulation in CD8+ T cells from tumors in mice injected with BNL‐T + TECs transfected with siGPNMB‐1 or siGPNMB‐2 (Figure 6C).
FIGURE 6.
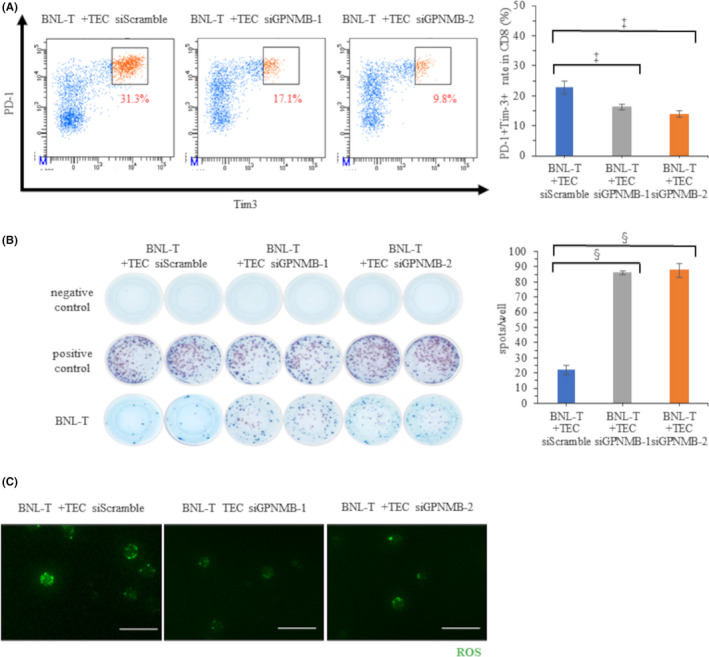
Characteristics and functions of tumor‐infiltrating CD8+ T cells after GPNMB downregulation in TECs. (A) Percentages of PD‐1+Tim‐3+ T cells among all CD8+ T cells in tumor tissues from mice injected with BNL‐T + transfected TECs. (Right panel) Quantification of PD‐1+Tim‐3+ TEC rates among all CD8+ T cells in each tumor. (B) Representative ELISpot images show IFN‐γ production in CD8+ T cells isolated from mice injected with BNL‐T + transfected TECs. (Right panel) Quantification of the number of spots in each well. (C) Total ROS production in tumor‐infiltrating CD8+ T cells isolated from mice injected with BNL‐T + transfected TECs. Scale bars: 50 μm. *p < 0.05, ‡ p < 0.005, § p < 0.001
4. DISCUSSION
This study demonstrated that TECs induced tumor‐infiltrating CD8+ T‐cell exhaustion in HCC (Figure 3). Our next‐generation sequencing results revealed that GPNMB could serve as a novel treatment target (Figures 4 and 5). Indeed, we demonstrated that downregulating GPNMB suppressed tumor growth and T‐cell exhaustion (Figure 6).
Our findings suggested two mechanisms by which TECs could facilitate cancer‐cell escape from immune surveillance. First, double immunofluorescence staining of CD31 and CD8 expression showed that TECs prevented cytotoxic T cells from migrating and infiltrating into cancer tissues from tumor vessels. Previous studies have shown that TEC alters the expression of cell adhesion molecules such as ICAM‐1, VCAM‐1, and E‐selectin. 24 Another study showed that the administration of immune checkpoint inhibitors increased the expression of ICAM‐1 and VCAM‐1 in TEC and increased the number of cytotoxic T cells infiltrating the tumor in breast cancer. 25 The expression of ICAM‐1 and VCAM‐1 in TECs play an important role in the suppression of cytotoxic T‐cell mobilization and the promotion of immunosuppressive cell infiltration into tumors in the tumor microenvironment. 26 , 27 In our study, we found that the suppression of the expression of GPNMB in TECs induced the expression of ICAM‐1 and VCAM‐1 and the infiltration of CD8+ T cells into the tumor (Figure 5). These results indicated that TECs might promote the escape of cancer cells from immune surveillance via GPNMB.
The second potential mechanism for TECs facilitating immune escape was that TECs induced tumor‐infiltrating CD8+ T‐cell exhaustion. TECs were also shown to impact TME immunogenicity by actively guiding circulating immune cells into the tumor stroma and executing immune regulatory properties themselves, such as T‐cell activation and antigen‐presenting functions. 28 Cell exhaustion is a state of T‐cell dysfunction that arises during chronic infections and cancer. It is characterized by poor T‐cell effector functions, sustained expression of inhibitory receptors, and a transcriptional state distinct from that observed in functional effector or memory T cells. However, the mechanisms that cause T‐cell exhaustion are not completely understood. 29 CD8+ T‐cell exhaustion probably develops with the integration of multiple factors in the inflammatory and tissue microenvironments, such as persistent antigen exposure, soluble immunosuppressive mediators, and immune checkpoint molecules. In turn, T‐cell exhaustion upregulates the expression of multiple inhibitory receptors, such as PD‐1, Tim‐3, and lymphocyte activation gene‐3. 12 Furthermore, recent reports have indicated that altered intracellular metabolism, such abnormal mitochondrial metabolism, which leads to ROS accumulation, was strongly related to T‐cell exhaustion. 30 We found significant increases in the rates of PD‐1+Tim‐3+ T cells in tumors from mice injected with BNL‐T + TEC. This finding suggested that TECs might influence the CD8+ T‐cell upregulation of PD‐1 and Tim‐3 expression. Infiltrating CD8+ T cells isolated from tumors with BNL‐T + TEC exhibited low IFN‐γ production in response to BNL‐T cells and elevated ROS production (Figure 3). These results indicated that TECs induced exhaustion in tumor‐infiltrating T cells, in a direct or indirect manner.
Our transcriptome analysis with next‐generation sequencing revealed that GPNMB was highly expressed in TECs from HCC tumors compared with NECs from healthy liver. Moreover, downregulating GPNMB expression in TECs suppressed tumor growth and facilitated recovery from CD8+ T‐cell exhaustion in our mouse model (Figures 5 and 6). These results indicated that GPNMB in TECs might serve as a promising treatment target. GPNMB is a type I transmembrane glycoprotein with homology to the pMEL17 precursor, a melanocyte‐specific protein. GPNMB is physiologically expressed in some cell types, especially macrophages and monocytes. The expression of GPNMB is known to be regulated by inflammatory stimuli such as interferon‐γ via the ERK/MERK and Akt/PI3K pathways. 31 , 32 , 33 GPNMB was overexpressed in numerous cancers, including breast cancer and melanoma, and it was often correlated with a metastatic phenotype. 34 A previous study has shown that, in a B16 melanoma tumor model, TECs expressed immunosuppressive PD‐L1, and by cell‐to‐cell contact, via the PD‐1/PD‐L1 pathway, TECs regulated the immune response of tumor antigen‐specific cytotoxic T cells. 35 Another study showed that TECs in melanoma expressed GPNMB, which inhibited T‐cell activation by negatively regulating the tumor response to immune checkpoint inhibitors through syndecan‐4. 36 , 37 T‐cell inactivation allowed melanoma cells to evade immunological recognition and destruction. Moreover, a blockade of GPNMB restored the integrity of T cells, attenuated tumor growth, and increased IFN‐γ levels in the TME. 38 Accordingly, high levels of circulating GPNMB in blood from patients with cancer were associated with resistance to immune checkpoint inhibitor therapy. 36 Therefore, GPNMB plays important roles in regulating the immune response to cancer. Consistent with those studies, the present study demonstrated that GPNMB expression in TECs regulated tumor‐infiltrating T‐cell exhaustion and the immune response to HCC. Consequently, GPNMB showed promise as a potential target in cancer treatments.
T‐cell exhaustion is a broad term that describes the response of T cells to chronic antigen stimulation in chronic viral infections and malignant tumors. 39 Exhausted T cells comprise three subsets, including progenitor T cells, intermediate T cells, and terminal T cells. 40 , 41 , 42 Exhausted progenitor T cells showed an intermediate degree of PD‐1 expression but no Tim‐3 expression. Exhausted progenitor T cells could differentiate into exhausted intermediate T cells, control tumor growth, and respond to anti‐PD‐1 therapy. Exhausted intermediate T cells also exhibited intermediate PD‐1 expression, no Tim‐3 expression, and were responsive to PD‐1 blockade treatment. Exhausted terminal T cells exhibited high PD‐1 and Tim‐3 expression, ROS accumulation (due to abnormal intracellular metabolism), no cytokine production, and no response to PD‐1 blockade treatment. 11 In the present study, we showed that TECs led to tumor‐infiltrating T‐cell exhaustion. We classified these exhausted T cells as terminal T cells, based on their high expression of PD‐1 and Tim‐3, low IFN‐γ production, and ROS accumulation. PD‐1 blockade treatment efficacy is closely related to the degree of T‐cell exhaustion; the subpopulation of exhausted terminal T cells showed little response to anti‐PD‐1 therapy. 43 Our study demonstrated that downregulating GPNMB expression in TECs reduced the fraction of exhausted terminal CD8+ T cells and increased IFN‐γ production (Figure 6B). These results suggested that combining anti‐GPNMB therapy with anti‐PD‐1 treatment might show promise as a therapy for HCC.
The treatment modalities for HCC have included surgical resection, ablation, trans‐arterial chemoembolization, and systemic chemotherapy. The recent development of antimolecular targeted therapy has brought the several chemotherapeutic regimens for HCC. 44 However, long‐term use of these therapies for HCC induced resistance to chemotherapy. Alternatively, immunotherapy may be an attractive therapeutic option for HCC, because an inflammatory TME was associated with improved survival. 45 Previous studies have shown that intertumoral accumulation of infiltrating cytotoxic T cells was a prognostic factor in HCC. 46 Recently, studies on TECs have generated a widely held hypothesis that tumor vasculature is highly abnormal and dysfunctional; this impairs the ability of immune cells to penetrate solid tumors. The normalization of tumor vasculature might potentiate immunotherapy efficacy by enhancing tissue perfusion and improving immune effector cell infiltration. Furthermore, tumor vessel normalization might increase the infiltration and activation of CD8+ T cells. 47 Our results showed that TECs facilitated tumor growth and progression by promoting CD8+ T‐cell exhaustion and inhibiting CD8+ T‐cell infiltration. We showed that TEC GPNMB expression led to immune suppression by inducing T‐cell exhaustion, but knocking down GPNMB expression led to the recovery of CD8+ T‐cell infiltration and IFN‐γ production. Hypervascular HCC tumors exhibited crosstalk between vascular cells and immune cells; therefore, a treatment modality that combines immune therapy and anti‐angiogenic agents could be a reasonable, promising treatment strategy for HCC.
In conclusion, we showed that TECs induced tumor‐infiltrating T‐cell exhaustion via GPNMB expression. These findings suggested that GPNMB in the tumor vasculature might serve as a novel therapeutic target in HCC treatments.
DISCLOSURES
The authors of this manuscript declare no conflict of interest associated with this study.
Supporting information
Fig S1
Fig S2
Supplementary Material
ACKNOWLEDGMENTS
We acknowledge the NGS core facility of the Genome Information Research Center at the Research Institute for Microbial Diseases of Osaka University for support in RNA sequencing and data analysis.
Sakano Y, Noda T, Kobayashi S, et al. Tumor endothelial cell‐induced CD8+ T‐cell exhaustion via GPNMB in hepatocellular carcinoma. Cancer Sci. 2022;113:1625–1638. doi: 10.1111/cas.15331
Funding information
The authors received no specific funding for this work
REFERENCES
- 1. Finn RS, Qin S, Ikeda M, et al. Atezolizumab plus Bevacizumab in unresectable hepatocellular carcinoma. N Engl J Med. 2020;382:1894‐1905. [DOI] [PubMed] [Google Scholar]
- 2. Shigeta K, Datta M, Hato T, et al. Dual programmed death receptor‐1 and vascular endothelial growth factor receptor‐2 blockade promotes vascular normalization and enhances antitumor immune responses in hepatocellular carcinoma. Hepatology. 2020;71:1247‐1261. [DOI] [PMC free article] [PubMed] [Google Scholar]
- 3. Nagl L, Horvath L, Pircher A, Wolf D. Tumor endothelial cells (TECs) as potential immune directors of the tumor microenvironment ‐ new findings and future perspectives. Front Cell Dev Biol. 2020;8:766. [DOI] [PMC free article] [PubMed] [Google Scholar]
- 4. Solimando AG, Summa S, Vacca A, Ribatti D. Cancer‐associated angiogenesis: the endothelial cell as a checkpoint for immunological patrolling. Cancers (Basel). 2020;12(11):3380. [DOI] [PMC free article] [PubMed] [Google Scholar]
- 5. Folkman J. Role of angiogenesis in tumor growth and metastasis. Semin Oncol. 2002;29:15‐18. [DOI] [PubMed] [Google Scholar]
- 6. Auerbach R, Akhtar N, Lewis RL, Shinners BL. Angiogenesis assays: problems and pitfalls. Cancer Metastasis Rev. 2000;19:167‐172. [DOI] [PubMed] [Google Scholar]
- 7. Jain RK. Molecular regulation of vessel maturation. Nat Med. 2003;9:685‐693. [DOI] [PubMed] [Google Scholar]
- 8. Itoh S, Yoshizumi T, Yugawa K, et al. Impact of immune response on outcomes in hepatocellular carcinoma: association with vascular formation. Hepatology. 2020;72:1987‐1999. [DOI] [PubMed] [Google Scholar]
- 9. Lyu J, Yang EJ, Shim JS. Cholesterol trafficking: an emerging therapeutic target for angiogenesis and cancer. Cells. 2019;8(5):389. [DOI] [PMC free article] [PubMed] [Google Scholar]
- 10. Ma X, Bi E, Lu Y, et al. Cholesterol induces CD8(+) T cell exhaustion in the tumor microenvironment. Cell Metab. 2019;30:143‐156.e145. [DOI] [PMC free article] [PubMed] [Google Scholar]
- 11. Franco F, Jaccard A, Romero P, Yu YR, Ho PC. Metabolic and epigenetic regulation of T‐cell exhaustion. Nat Metab. 2020;2:1001‐1012. [DOI] [PubMed] [Google Scholar]
- 12. Khan O, Giles JR, McDonald S, et al. TOX transcriptionally and epigenetically programs CD8(+) T cell exhaustion. Nature. 2019;571:211‐218. [DOI] [PMC free article] [PubMed] [Google Scholar]
- 13. Yokota Y, Noda T, Okumura Y, et al. Serum exosomal miR‐638 is a prognostic marker of HCC via downregulation of VE‐cadherin and ZO‐1 of endothelial cells. Cancer Sci. 2021;112(3):1275‐1288. [DOI] [PMC free article] [PubMed] [Google Scholar]
- 14. Matsumoto K, Noda T, Kobayashi S, et al. Inhibition of glycolytic activator PFKFB3 suppresses tumor growth and induces tumor vessel normalization in hepatocellular carcinoma. Cancer Lett. 2021;500:29‐40. [DOI] [PubMed] [Google Scholar]
- 15. Kondo M, Nagano H, Wada H, et al. Combination of IFN‐alpha and 5‐fluorouracil induces apoptosis through IFN‐alpha/beta receptor in human hepatocellular carcinoma cells. Clin Cancer Res. 2005;11:1277‐1286. [PubMed] [Google Scholar]
- 16. Matsuda K, Ohga N, Hida Y, et al. Isolated tumor endothelial cells maintain specific character during long‐term culture. Biochem Biophys Res Comm. 2010;394:947‐954. [DOI] [PubMed] [Google Scholar]
- 17. Mukai Y, Yamada D, Eguchi H, et al. Vitamin D supplementation is a promising therapy for pancreatic ductal adenocarcinoma in conjunction with current chemoradiation therapy. Ann Surg Oncol. 2018;25:1868‐1879. [DOI] [PubMed] [Google Scholar]
- 18. Shinke G, Yamada D, Eguchi H, et al. Role of histone deacetylase 1 in distant metastasis of pancreatic ductal cancer. Cancer Sci. 2018;109:2520‐2531. [DOI] [PMC free article] [PubMed] [Google Scholar]
- 19. Fujita S, Wada H, Jungbluth AA, et al. NY‐ESO‐1 expression and immunogenicity in esophageal cancer. Clin Cancer Res. 2004;10:6551‐6558. [DOI] [PubMed] [Google Scholar]
- 20. Kitagawa A, Masuda T, Takahashi J, et al. KIF15 expression in tumor‐associated monocytes is a prognostic biomarker in hepatocellular carcinoma. Cancer Genomics Proteomics. 2020;17:141‐149. [DOI] [PMC free article] [PubMed] [Google Scholar]
- 21. Mikamori M, Yamada D, Eguchi H, et al. MicroRNA‐155 controls exosome synthesis and promotes gemcitabine resistance in pancreatic ductal adenocarcinoma. Sci Rep. 2017;7:42339. [DOI] [PMC free article] [PubMed] [Google Scholar]
- 22. Sakuishi K, Apetoh L, Sullivan JM, Blazar BR, Kuchroo VK, Anderson AC. Targeting Tim‐3 and PD‐1 pathways to reverse T cell exhaustion and restore anti‐tumor immunity. J Exp Med. 2010;207:2187‐2194. [DOI] [PMC free article] [PubMed] [Google Scholar]
- 23. Schietinger A, Greenberg PD. Tolerance and exhaustion: defining mechanisms of T cell dysfunction. Trends Immunol. 2014;35:51‐60. [DOI] [PMC free article] [PubMed] [Google Scholar]
- 24. Uldry E, Faes S, Demartines N, Dormond O. Fine‐tuning tumor endothelial cells to selectively kill cancer. Int J Mol Sci. 2017;18:1401. [DOI] [PMC free article] [PubMed] [Google Scholar]
- 25. Fukumura D, Kloepper J, Amoozgar Z, Duda DG, Jain RK. Enhancing cancer immunotherapy using antiangiogenics: opportunities and challenges. Nat Rev Clin Oncol. 2018;15:325‐340. [DOI] [PMC free article] [PubMed] [Google Scholar]
- 26. Hendry SA, Farnsworth RH, Solomon B, Achen MG, Stacker SA, Fox SB. The role of the tumor vasculature in the host immune response: implications for therapeutic strategies targeting the tumor microenvironment. Front Immunol. 2016;7:621. [DOI] [PMC free article] [PubMed] [Google Scholar]
- 27. Carman CV, Martinelli R. T lymphocyte‐endothelial interactions: emerging understanding of trafficking and antigen‐specific immunity. Front Immunol. 2015;6:603. [DOI] [PMC free article] [PubMed] [Google Scholar]
- 28. Georganaki M, van Hooren L, Dimberg A. Vascular targeting to increase the efficiency of immune checkpoint blockade in cancer. Front Immunol. 2018;9:3081. [DOI] [PMC free article] [PubMed] [Google Scholar]
- 29. Augustin RC, Delgoffe GM, Najjar YG. Characteristics of the tumor microenvironment that influence immune cell functions: hypoxia, oxidative stress, metabolic alterations. Cancers (Basel). 2020;12(12):3802. [DOI] [PMC free article] [PubMed] [Google Scholar]
- 30. Scharping NE, Rivadeneira DB, Menk AV, et al. Mitochondrial stress induced by continuous stimulation under hypoxia rapidly drives T cell exhaustion. Nat Immunol. 2021;22:205‐215. [DOI] [PMC free article] [PubMed] [Google Scholar]
- 31. Ripoll VM, Irvine KM, Ravasi T, Sweet MJ, Hume DA. Gpnmb is induced in macrophages by IFN‐gamma and lipopolysaccharide and acts as a feedback regulator of proinflammatory responses. J Immunol. 1950;2007(178):6557‐6566. [DOI] [PubMed] [Google Scholar]
- 32. Saade M, Araujo de Souza G, Scavone C, Kinoshita PF. The role of GPNMB in inflammation. Front Immunol. 2021;12:674739. [DOI] [PMC free article] [PubMed] [Google Scholar]
- 33. Tanaka H, Shimazawa M, Kimura M, et al. The potential of GPNMB as novel neuroprotective factor in amyotrophic lateral sclerosis. Sci Rep. 2012;2:573. [DOI] [PMC free article] [PubMed] [Google Scholar]
- 34. Maric G, Rose AA, Annis MG, Siegel PM. Glycoprotein non‐metastatic b (GPNMB): a metastatic mediator and emerging therapeutic target in cancer. Onco Targets Ther. 2013;6:839‐852. [DOI] [PMC free article] [PubMed] [Google Scholar]
- 35. Taguchi K, Onoe T, Yoshida T, Yamashita Y, Tanaka Y, Ohdan H. Tumor endothelial cell‐mediated antigen‐specific T‐cell suppression via the PD‐1/PD‐L1 pathway. Mol Cancer Res. 2020;18:1427‐1440. [DOI] [PubMed] [Google Scholar]
- 36. Chung JS, Ramani V, Kobayashi M, et al. DC‐HIL/Gpnmb is a negative regulator of tumor response to immune checkpoint inhibitors. Clin Cancer Res. 2020;26:1449‐1459. [DOI] [PubMed] [Google Scholar]
- 37. Tomihari M, Chung JS, Akiyoshi H, Cruz PD Jr, Ariizumi K. DC‐HIL/glycoprotein Nmb promotes growth of melanoma in mice by inhibiting the activation of tumor‐reactive T cells. Cancer Res. 2010;70:5778‐5787. [DOI] [PMC free article] [PubMed] [Google Scholar]
- 38. Kobayashi M, Chung JS, Beg M, et al. Blocking monocytic myeloid‐derived suppressor cell function via anti‐DC‐HIL/GPNMB antibody restores the in vitro integrity of T cells from cancer patients. Cancer Res. 2019;25:828‐838. [DOI] [PMC free article] [PubMed] [Google Scholar]
- 39. Blank CU, Haining WN, Held W, et al. Defining ‘T cell exhaustion'. Nat Rev Immunol. 2019;19:665‐674. [DOI] [PMC free article] [PubMed] [Google Scholar]
- 40. Philip M, Fairchild L, Sun L, et al. Chromatin states define tumour‐specific T cell dysfunction and reprogramming. Nature. 2017;545:452‐456. [DOI] [PMC free article] [PubMed] [Google Scholar]
- 41. Im SJ, Hashimoto M, Gerner MY, et al. Defining CD8+ T cells that provide the proliferative burst after PD‐1 therapy. Nature. 2016;537:417‐421. [DOI] [PMC free article] [PubMed] [Google Scholar]
- 42. Utzschneider DT, Charmoy M, Chennupati V, et al. T cell factor 1‐expressing memory‐like CD8(+) T cells sustain the immune response to chronic viral infections. Immunity. 2016;45:415‐427. [DOI] [PubMed] [Google Scholar]
- 43. Miller BC, Sen DR, Al Abosy R, et al. Subsets of exhausted CD8(+) T cells differentially mediate tumor control and respond to checkpoint blockade. Nat Immunol. 2019;20:326‐336. [DOI] [PMC free article] [PubMed] [Google Scholar]
- 44. Kudo M, Finn RS, Qin S, et al. Lenvatinib versus sorafenib in first‐line treatment of patients with unresectable hepatocellular carcinoma: a randomised phase 3 non‐inferiority trial. Lancet. 2018;391:1163‐1173. [DOI] [PubMed] [Google Scholar]
- 45. Pedroza‐Gonzalez A, Verhoef C, Ijzermans JN, et al. Activated tumor‐infiltrating CD4+ regulatory T cells restrain antitumor immunity in patients with primary or metastatic liver cancer. Hepatology. 2013;57:183‐194. [DOI] [PubMed] [Google Scholar]
- 46. Schoenberg MB, Hao J, Bucher JN, et al. Perivascular tumor‐infiltrating leukocyte scoring for prognosis of resected hepatocellular carcinoma patients. Cancers (Basel). 2018;10:389. [DOI] [PMC free article] [PubMed] [Google Scholar]
- 47. Huang Y, Kim BYS, Chan CK, Hahn SM, Weissman IL, Jiang W. Improving immune‐vascular crosstalk for cancer immunotherapy. Nat Rev Immunol. 2018;18:195‐203. [DOI] [PMC free article] [PubMed] [Google Scholar]
Associated Data
This section collects any data citations, data availability statements, or supplementary materials included in this article.
Supplementary Materials
Fig S1
Fig S2
Supplementary Material