Abstract
Six phages (ΦCP6-1 to ΦCP6-6) that are commonly found in the phytosphere of sugar beet (Beta vulgaris var. Amethyst) were investigated, and their relative impacts on their host (Serratia liquefaciens CP6) were compared. There were fundamental differences between the two most abundant predators of CP6 (ΦCP6-1 and ΦCP6-4). Like ΦCP6-2 and ΦCP6-5, ΦCP6-1 belonged to the family Siphoviridae, while ΦCP6-4 exhibited the morphology of the family Podoviridae. The other phages were members of the family Myoviridae. DNA-DNA cross-hybridization revealed that ΦCP6-1 and ΦCP6-4 had little common DNA, although all of the other phages exhibited some genetic similarity. Like ΦCP6-2, ΦCP6-3, and ΦCP6-5, ΦCP6-1 was capable of forming a lysogenic association with its host, while ΦCP6-4 and ΦCP6-6 appeared to be entirely virulent. Single-step growth curve experiments revealed that ΦCP6-4 had a much shorter latent period and a smaller burst size than ΦCP6-1. Also, ΦCP6-1 could transduce a number of host chromosomal markers with transfer frequencies of 2.9 × 10⁻⁹ to 3.9 × 10⁻⁷, whereas ΦCP6-4 could not transduce S. liquefaciens CP6 genes. When viewed in the context of the strikingly different temporal niches of these phages, our data provide an insight into how bacteriophage interactions with their hosts might reflect the natural ecology of bacteriophages. Our data also illustrate how the potential for gene transfer changes over time in an environment that supports several different phages.
Bacteriophages are ubiquitous in nature, and it has been suggested that they are environmentally important both in controlling bacterial numbers and in facilitating bacterial gene transfer (6, 7, 12, 15). By their very nature, phages are likely to be most prevalent in environments where there is a high density of metabolically active bacteria. One such environment is the plant phytosphere, which is known to support a wide diversity of bacterial species (19). Many of the phytosphere bacteria have a significant impact on plant health, and so the ecology of these bacteria and their predators, such as phages, is of interest. Many of the phytosphere bacteria are also considered possible candidates for genetic engineering for use in agriculture, and so the gene-transferring potential of their indigenous phages is also worthy of consideration.
Serratia liquefaciens is a typical phytosphere bacterium that is found on a wide range of plants (10) and is known to have beneficial antifungal properties (11). In a study of the phytosphere of field-grown sugar beets in 1994 and 1996, we monitored the in situ temporal dynamics of a population of six phages, ΦCP6-1 to ΦCP6-6, capable of preying on the indigenous bacterium S. liquefaciens CP6 (5). These abundant phages, which have also been found in high numbers during subsequent years (unpublished data), were notable in that they exhibited distinct temporal fluctuations, including what appeared to be a temporal succession between phages ΦCP6-1 and ΦCP6-4 (5). In this study, we investigated these phages further in order to improve our understanding of their in situ ecology. We identified fundamental morphological, genetic, and physiological differences among the six phages, particularly between phages ΦCP6-1 and ΦCP6-4, and our results provided an insight into how the characteristics of the phages might determine their natural ecology.
MATERIALS AND METHODS
Bacteria and bacteriophages.
The bacteria used in this study (Table 1) were stored in 50% glycerol at −80°C and, when necessary, were maintained on nutrient agar (Oxoid catalog no. CM3) supplemented with the appropriate antibiotics (100 μg of rifampin per ml, 100 μg of kanamycin per ml, 100 μg of spectinomycin per ml, 2,000 μg of streptomycin per ml).
TABLE 1.
Bacterial strains used in this study
| S. liquefaciens strain | Relevant phenotypea | Additional information | Source or reference |
|---|---|---|---|
| CP6 | Wild type | Sugar beet phytosphere isolate | 5 |
| CP6RS | Rifr Strepr | Spontaneous antibiotic-resistant mutant of CP6 | This study |
| CP6Sp | Spr | Spontaneous antibiotic-resistant mutant of CP6 | This study |
| CP6K | Kmr | Kanamycin resistance introduced by transposon mutagenesis through mating wild-type strain CP6 with Escherichia coli 12.1 λpir(pBSL118)b | This study |
| CP6KZY | Kmr | Kanamycin resistance introduced by transposon mutagenesis through mating wild-type strain CP6 with Escherichia coli S17/1 λpir(pTT5KZY)c | This study |
The phages used were phages ΦCP6-1 to ΦCP6-6 (5). Lysates of these phages were stored in 50% glycerol at −80°C. Short-term stock preparations were maintained at 4°C. Phage lysates were titrated by using the overlay agar method of Adams (3). Overlay agar consisted of 0.65% (wt/vol) bacteriological agar (Oxoid catalog no. L11) and 1.3% (wt/vol) nutrient broth (Oxoid catalog no. CM1); nutrient agar plates were used as the base medium plates. Fresh overnight cultures of wild-type S. liquefaciens CP6 were used as the host inoculum unless otherwise stated.
Assessing the impact of an aging bacterial lawn on plaque production.
At time zero, an overnight culture of S. liquefaciens CP6 having a known cell density was used to inoculate overlay agar plates, which were then incubated at 25°C. At hourly intervals thereafter and as the resulting bacterial lawns developed, 5-μl portions of ∼109-PFU ml−1 lysates of each of the six phages were dropped onto the plates. This was done for 12 h, after which the plates were incubated for an additional 12 h until the bacterial lawns had fully grown, and then the full extent of the lysis induced by each lysate aliquot was assessed.
Other overlay plates were used to monitor the growth of the CP6 lawns over the experimental period; that is, at the same hourly intervals, a sterile 11-mm-diameter cork borer was used to cut agar disks from three replicate plates, and the agar disks were then separately vortex mixed in 5 ml of sterile quarter-strength Ringer’s solution (QSR) (Oxoid catalog no. BR52) for 1 min each. The bacteria in these suspensions were counted by drop plating dilutions onto nutrient agar.
TEM of phages.
Formvar-carbon-coated transmission electron microscopy (TEM) grids (diameter, 3 mm; 300 mesh) supporting phage lysates were negatively stained with 2% (wt/vol) potassium phosphotungstate (pH 6.6) and dried. The grids were examined with a transmission electron microscope. Digital images that were produced from TEM photographic negatives and Sigma Scan Pro Image Analysis software (Jandel Scientific Ltd.) were used to measure phage dimensions.
Restriction fragment length polymorphism (RFLP) analysis, cross-hybridization, and genome sizing.
Bacteriophage DNA was extracted by a proteinase K method and was resuspended in TE buffer after isopropanol precipitation (8, 17). The phage DNA was cut with restriction enzyme EcoRI, ClaI, HindIII, BamHI, EcoRV, or SalI as recommended by the manufacturer (Promega). The resulting preparations were electrophoresed (along with HindIII-cut lambda phage DNA [Sigma catalog no. D-9780]) on 0.7% agarose gels at 0.13 to 0.32 V cm−2, and their restriction profiles were compared.
EcoRI-cut DNA proved to be the most suitable DNA for sizing purposes, with all of the restriction bands falling in the range of the ladder. For each phage we prepared three replicate digests, from which band sizes were calculated by comparison with the lambda standards by using regression analysis (16). The gels were subsequently Southern blotted (17) and probed with digoxigenin (DIG)-labelled EcoRI-digested phage DNA (total genome) that was prepared and used (under high-stringency conditions) as recommended by the manufacturer (Boehringer Mannheim).
Transduction experiments with lysates.
Generalized transducing lysates were prepared for all six phages by using the kanamycin-resistant strain S. liquefaciens CP6KZY as the donor and were titrated to confirm that the counts for each phage was approximately 109 PFU ml−1. Nutrient broth cultures of S. liquefaciens CP6RS were mixed with each transducing lysate at a multiplicity of infection (i.e., ratio of bacteria to phage) of either 1:10 or 1:1. The control was CP6RS mixed with sterile nutrient broth.
Mixtures were vortex mixed, and 100-μl samples of each mixture were pipetted onto separate nutrient agar plates. After incubation at 25°C for 24 h, the resulting bacteria were harvested and resuspended in 5 ml of sterile QSR. The resulting bacterial suspensions were then plated onto nutrient agar in order to determine total viable counts and onto nutrient agar supplemented with kanamycin in order to determine transductant counts. After the plates were incubated for up to 48 h, counts were determined, and the transductant phenotype was confirmed by replica plating colonies onto fresh transductant plates and replica plating colonies onto CP6-inoculated overlay agar to check for lysogeny. Transfer frequencies were then calculated by dividing the number of confirmed transductants by the total viable count. In making this calculation we assumed that the rates of replication of transductants and nontransductants were equivalent during the 24-h mating period. A 24-h mating period was used instead of shorter incubation periods so that the resulting multiplication of transductants would increase the detection of transductants above a background of spontaneous mutations.
Five replicate mating experiments were carried out in this way for each phage. Mating experiments were also carried out between lysates from S. liquefaciens CP6K and recipient S. liquefaciens CP6RS (two replicates) and between lysates from CP6RS and recipient CP6KZY (three replicates). In the latter experiments the transfer of rifampin resistance and the transfer of streptomycin resistance were assessed separately by spread plating the mating mixture onto nutrient agar supplemented with either rifampin or streptomycin, as appropriate.
Lysogen isolation and phage classification on the basis of superinfection immunity.
Putative lysogens were isolated from the centers of individual plaques and, after purification, were assessed for phage production in order to confirm their identities. The lysogens were then checked for sensitivity to the six phages, both to confirm their immunity to further infection by the same phage and as a means of phage classification. Overnight cultures of the lysogens and a wild-type CP6 control were used to inoculate separate overlay agar plates, which were then challenged with lysates of the six phages. After overnight incubation at 15°C, the ability of each phage lysate to lyse each lysogen was assessed.
Transduction experiments with lysogens.
Ten ΦCP6-1 lysogens of S. liquefaciens CP6RS were grown overnight to densities of around 109 CFU ml−1 and then mixed with equal quantities of an overnight culture of S. liquefaciens CP6Sp. From these mixtures, 100-μl samples were drop plated onto separate nutrient agar plates. After incubation for 24 h at 25°C, the resulting bacterial growth was harvested and suspended in QSR. Donor, recipient, and transductant counts were then determined after 48 h of incubation at 30°C by plating appropriate dilutions onto nutrient agar containing rifampin and streptomycin, nutrient agar containing spectinomycin, and nutrient agar containing spectinomycin and streptomycin.
Single-step growth curve experiments.
Single-step growth curve experiments were carried out for each phage at 30°C, as described by Adams (3). The temperature-sensitive phage ΦCP6-3 was also assayed at 25°C. The resulting time series data were plotted by using the Origin 3.0 computer package (MicroCal Software, Inc., Northampton, Mass.), and a sigmoidal line of best fit was calculated for each plot by using the Boltzman equation. The average burst size per infected host and the average latent period, along with the associated 95% confidence intervals, were then calculated from the resulting sigmoidal curves. The velocity constant k, a measure of the adsorption efficiency of each phage, was calculated as described by Adams (3).
Statistics.
Mean transfer frequencies were compared by performing an analysis of variance (ANOVA) after log transformation and testing the assumptions of ANOVA (9); calculations were carried out by using the Minitab, version 9.0, computer package (Minitab Inc., University Park, Pa.). The minimum significant differences at the 95% confidence level were calculated from ANOVA tables as described by Fry (9). Confidence interval notches (95%) for plotted medians were calculated as described by Velleman and Hoaglin (21).
RESULTS
Plaque morphology and the impact of bacterial lawn age on plaque production.
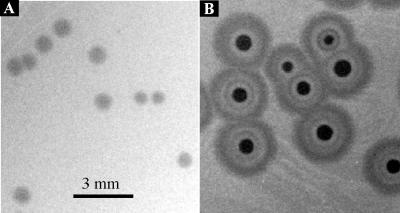
ΦCP6-1 (Fig. 1A) was typical of five of the six phages in producing plaques which, once visible, did not increase in diameter with further incubation. ΦCP6-4, in contrast (Fig. 1B), was unusual because it produced plaques with concentric rings whose diameters continued to increase until the bacterial lawn had fully matured.
FIG. 1.
Plaque morphologies of phages ΦCP6-1 (A) and ΦCP6-4 (B) on overlay plates after 48 h of incubation at 15°C.
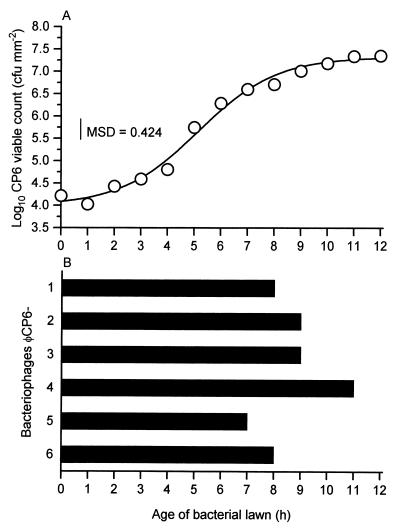
We quantified this variation by dropping lysates of each phage onto lawns of different ages and recording the degrees of subsequent lysis. Every hour, as bacterial lawns of S. liquefaciens CP6 developed (Fig. 2A), lysates of each phage were pipetted onto overlay plates. All of the lysates added up to 7 h after initiation of the CP6 lawn produced visible zones of lysis. However, after this, there was a difference in the abilities of the phages to lyse the lawns (Fig. 2B). Most noticeably, only ΦCP6-4 was still capable of forming visible zones of lysis 11 h after initiation of the lawn, by which time the bacterial cells had moved into the stationary phase (Fig. 2A).
FIG. 2.
Abilities of bacteriophages to visibly lyse lawns of S. liquefaciens CP6 of different ages. (A) Growth of the bacterial lawns over the 12-h experimental period. MSD, minimum significant difference. (B) Maximum time during which each of the six phages was still capable of forming visible zones of lysis on the lawns. Note that the two replicate experiments gave identical results.
Bacteriophage morphology.
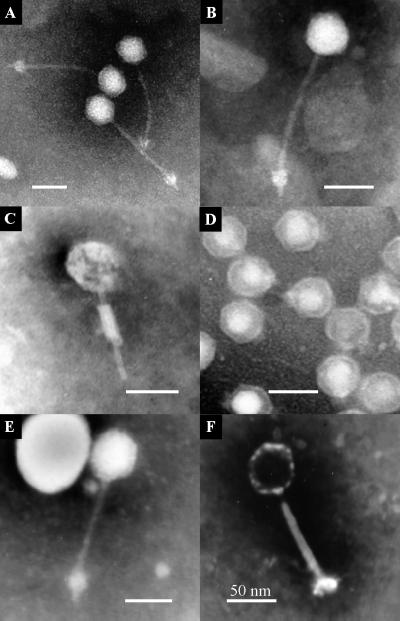
The phages were members of either the family Siphoviridae, the family Myoviridae, or the family Podoviridae (Fig. 3). The dimensions of the phages are shown in Table 2. Except for ΦCP6-2 and ΦCP6-4, the head capsid dimensions of the phages differed significantly (P < 0.05). Both the head capsid length and the head capsid width varied significantly (P < 0.05) and proportionally (r = 0.97). The difference was most apparent in head capsid length, which ranged from 39.97 nm (ΦCP6-2) to 61.30 nm (ΦCP6-6). Among the five long-tailed phages, tail lengths did not differ significantly (P < 0.05) except for ΦCP6-3, whose tail was significantly shorter than the tails of the other phages.
FIG. 3.
Contrasting morphologies of S. liquefaciens CP6 phages ΦCP6-1 to ΦCP6-6 (A to F, respectively), as determined by TEM.
TABLE 2.
Genome sizes and overall dimensions of the six bacteriophages
| Phage | DNA size (kb)a | Family | Size (nm)b
|
||
|---|---|---|---|---|---|
| Head capsid
|
Tail length | ||||
| Length | Width | ||||
| ΦCP6-2 | 40.4 ± 0.38 | Siphoviridae | 39.97 ± 1.24 (12)c | 40.92 ± 1.31 (12) | 135.04 ± 5.40 (12) |
| ΦCP6-5 | 41.8 ± 0.68 | Siphoviridae | 55.13 ± 0.98 (7) | 50.99 ± 1.64 (7) | 138.62 ± 8.47 (6) |
| ΦCP6-1 | 43.6 ± 0.73 | Siphoviridae | 46.11 ± 1.31 (13) | 42.21 ± 0.97 (13) | 129.70 ± 3.06 (12) |
| ΦCP6-4 | 44.2 ± 1.21 | Podoviridae | 40.91 ± 0.43 (11) | 41.03 ± 1.61 (11) | 12.35 ± 3.07 (4) |
| ΦCP6-3 | 49.5 ± 0.64 | Myoviridae | 51.08 ± 0.50 (9) | 45.18 ± 1.05 (9) | 67.82 ± 2.38 (7) |
| ΦCP6-6 | 82.8 ± 4.71 | Myoviridae | 61.30 ± 4.66 (12) | 52.73 ± 3.22 (10) | 121.69 ± 13.36 (6) |
Genome sizes were calculated by using three EcoRI restriction profiles. The values are means ± standard deviations.
The values are medians ± 95% confidence intervals around the medians, as calculated by the method of Velleman and Hoaglin (21); the data obtained enabled a pairwise statistical comparison of the group medians to be made at the 95% confidence level.
The numbers in parentheses are numbers of replicates.
RFLP analysis, cross-hybridization, and genome size.
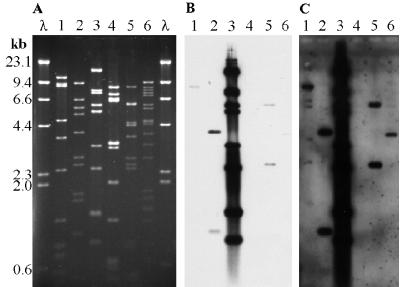
An RFLP analysis performed with six restriction enzymes confirmed that all six phages were distinct. EcoRI-cut DNA (Fig. 4A) proved to be the most suitable DNA for sizing purposes, and the data obtained demonstrated that the sizes of the phage genomes ranged from 40.4 to 82.8 kb (Table 3). A moderately positive correlation (r = 0.730) was found between the genome sizes and the head capsid sizes. When ΦCP6-5 was removed from consideration, the positive correlation was even greater (r = 0.950).
FIG. 4.
(A) EcoRI restriction digests of phages ΦCP6-1 to ΦCP6-6 (lanes 1 to 6, respectively) electrophoresed on a 0.7% agarose gel. (B) Southern blot of the same gel probed with DIG-labelled ΦCP6-3 DNA after 30 min of exposure to photographic film. (C) Southern blot shown in panel B after 24 h of exposure. Lanes λ contained a HindIII-cut lambda ladder.
TABLE 3.
Results of single-step growth curve experimentsa
| Phage | Variables determined from plots of experimental data
|
||||
|---|---|---|---|---|---|
| Latent period (min) | Burst size
|
k (10−9 ml min−1) | |||
| Avg | 95% Confidence interval
|
||||
| Lower | Upper | ||||
| ΦCP6-1 | 99.0 ± 2.0b | 224 | 126 | 355 | 2.9 |
| ΦCP6-2 | 104.8 ± 1.3 | 174 | 126 | 246 | 1.1 |
| ΦCP6-3 | 93.5 ± 1.6 | 65 | 46 | 93 | 2.0 |
| ΦCP6-4 | 35.4 ± 0.7 | 40 | 32 | 49 | 1.7 |
| ΦCP6-5 | 108.5 ± 1.6 | 41 | 32 | 53 | 6.1 |
| ΦCP6-6 | 99.5 ± 3.0 | 18 | 12 | 27 | 5.3 |
Most experiments were carried out at 30°C; the only exceptions were the temperature-sensitive phage ΦCP6-3 experiments, in which the incubation temperature was 25°C.
Average ± 95% confidence interval.
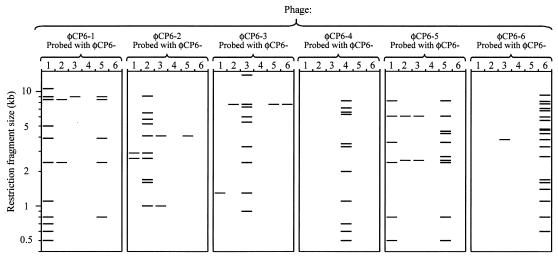
The EcoRI restriction digests were subsequently Southern blotted and probed with DIG-labelled DNA from each of the six phages (Fig. 4B and 5). Probing revealed moderate levels of cross-homology among ΦCP6-1, ΦCP6-2, ΦCP6-3, and ΦCP6-5, and the level of homology between ΦCP6-1 and ΦCP6-5 was particularly high (possibly up to one-half of the genome). There was also a small amount of genetic homology between ΦCP6-3 and ΦCP6-6 (<3.8 kb). ΦCP6-4 exhibited no homology with any of the other phages (Fig. 5).
FIG. 5.
Summary of DNA-DNA cross-hybridization experiments. Each panel shows the results obtained with a different phage. The EcoRI-cut genome of each phage was separately probed with DNA from each of the six phages, including itself. Thus, in each panel there are six columns, each showing the band pattern produced when the digest was probed with a particular labelled phage. When a phage was probed with itself, the full digest pattern, as shown in Fig. 4A, was revealed.
Gene transfer experiments with generalized transducing lysates.
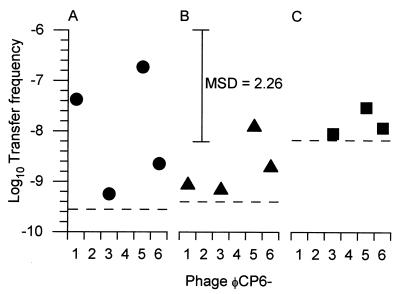
Detectable levels of transducing particles were successfully produced with both S. liquefaciens CP6KZY and S. liquefaciens CP6RS (Fig. 6). However, phage lysates produced with S. liquefaciens CP6K did not contain any detectable transducing particles for the phenotype being studied (i.e., kanamycin resistance) regardless of the phage used and in spite of the fact that CP6K had the same kanamycin-resistant phenotype as CP6KZY.
FIG. 6.
Transfer frequencies of generalized transducing lysates of all six phages. The following three phenotypic markers were investigated: kanamycin resistance (A), streptomycin resistance (B), and rifampin resistance (C). The symbols indicate the mean transfer frequencies (i.e., the numbers of transductants per recipient bacterium) recorded for each marker. The dashed lines show the limits of detection for each marker. MSD, minimum significant difference.
All of the phages except ΦCP6-2 and ΦCP6-4 had detectable gene transfer frequencies (Fig. 6), and the frequencies ranged from 1.7 × 10⁻⁹ to 6.9 × 10⁻⁷. No significant difference in transfer frequencies was detected when the two multiplicities of infection used were compared (P = 0.986). With one exception, there were no significant differences in the resulting mean frequencies regardless of the phage or phenotype studied (Fig. 6) (P > 0.05). The one exception was ΦCP6-5, which transferred kanamycin resistance from CP6KZY with a mean transfer frequency significantly higher than the mean transfer frequency for either ΦCP6-3 transferring kanamycin or streptomycin resistance or ΦCP6-1 transferring streptomycin resistance (Fig. 6) (P < 0.05).
Lysogen isolation and phage classification on the basis of superinfection immunity.
Obtaining lysogens by stabbing phage plaques was not always straightforward, and numerous false-positive lysogens were isolated. Apparently resistant bacteria were isolated from a plaque, yet they ultimately turned out to be sensitive to further phage infection and thus were neither lysogens nor resistant mutants. Nevertheless, lysogens of ΦCP6-1, ΦCP6-2, ΦCP6-3, and ΦCP6-5 were eventually obtained. When these lysogens were used in superinfection immunity tests, they were found to be insensitive to further infection by the same phage, yet they were still prone to lysis by the remaining five phages, which confirmed that they were members of separate species.
Transduction experiments with lysogens.
Three of the 10 ΦCP6-1 lysogens of S. liquefaciens CP6RS successfully transduced streptomycin resistance with transfer frequencies of 9.5 × 10⁻¹⁰, 2.9 × 10⁻⁹, and 4.8 × 10⁻⁹. The limit of detection was 4.8 × 10⁻¹⁰.
Single-step growth curve experiments.
The results of the single-step growth curve experiments are summarized in Table 3. No correlation was detected between latent period and burst size (r = 0.304), yet surprisingly, a distinct positive correlation was detected between latent period and phage tail length (r = 0.927) and between the velocity constant and head capsid size (r = 0.886). No other positive correlations were detected.
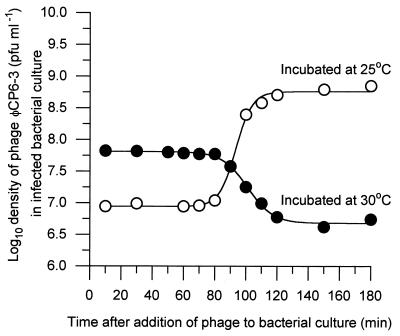
All single-step growth curve experiments were initially carried out at 30°C. However, at this temperature, ΦCP6-3 failed to replicate and instead there was a sigmoidal decrease in the titer as the experiment progressed, compared to the more typical sigmoidal increase exhibited by the other phages (Fig. 7). However, if the incubation temperature was reduced to 25°C, ΦCP6-3 was able to complete its infection cycle (Table 3 and Fig. 7).
FIG. 7.
Single-step growth curve obtained for phage ΦCP6-3 when it was incubated at 30°C (●) compared with the single-step growth curve obtained at 25°C (○). The Boltzman equation was used to produce the sigmoidal curves.
DISCUSSION
Ninety-six percent of all phages investigated in the last 40 years have turned out to be members of either the Siphoviridae, the Myoviridae, or the Podoviridae (2). It was, therefore, not surprising to find that the phages used in this study belong to one of these three morphological families. The host ranges of these families have been shown to encompass bacteria belonging to no less than 9 (Podoviridae), 10 (Myoviridae), and 11 (Siphoviridae) separate Bergey groups (14). Such a wide diversity of bacterial hosts highlights the polyphyletic nature of these taxa, a nature which prevents any automatic assumption of genetic relatedness between members of the same family.
Nevertheless, it is interesting that practically all of the genetic homology detected among our six phages occurred among viruses belonging to the same family. Much of the cross-homology was slight, except for the cross-homology between ΦCP6-1 and ΦCP6-5. These two members of the Siphoviridae were found to share a substantial amount of DNA, up to a possible maximum of 18.1 kb, yet they were clearly different from one another, as shown by physiological differences in burst size, latent period, and ability to coinfect the same type of bacterial cells without mutual inhibition. Intriguingly, ΦCP6-5 also had a significantly larger head capsid than ΦCP6-1, even though its genome was 4.1% smaller. The amount of cross-hybridization exhibited by ΦCP6-1 and ΦCP6-5 either indicates common ancestry or is evidence of genetic recombination.
The very nature of phage biology is such that for recombination to occur between phages, a host cell must be coinfected by more than one phage. A lysogenic association between phage and host inevitability increases the chance for coinfection, and thus temperate phages are likely to be particularly prone to recombination events. It is interesting, therefore, that the cross-hybridizing phages ΦCP6-1, ΦCP6-2, ΦCP6-3, and ΦCP6-5 are all temperate phages. In the same vein, it is noteworthy that ΦCP6-4 and CP6-6, which exhibited little or no homology, were both entirely virulent.
Our study showed that there are significant differences in overall phage dimensions, even for phages belonging to the same family. Why should there be these size differences? Are size differences arbitrary consequences of mutation, or do they reflect, either directly or indirectly, a specific evolutionary change? A difference in head capsid size could reflect the need to package different amounts of DNA, and with this hypothesis in mind, we assessed whether such a relationship could be established among our six phages. As our results show, a moderately positive correlation was detected between these two parameters. This led us to conclude that there is some sort of relationship between head size and genome size. Interestingly, if ΦCP6-5 was excluded from consideration, the correlation was highly positive, suggesting that either ΦCP6-5 has an abnormally small genome for its head capsid or some other, unknown factor is also involved.
The present study revealed some fundamental differences in comparative burst sizes, latent periods, and adsorption coefficients for the six CP6 phages. While these differences were determined with incubation conditions that did not mimic environmental conditions (i.e., temperature, bacterial numbers, etc.), they do indicate that there are fundamental physiological differences among the phages. The differences are especially interesting when they are viewed from the perspective of the previously reported in situ population dynamics of the phages (5), particularly the population dynamics of ΦCP6-1 (a member of the Siphoviridae) and ΦCP6-4 (a member of the Podoviridae). We previously demonstrated that over a 9-month experimental period, the six phages varied in relative abundance. We also noted that there was an apparent temporal succession between the two most dominant phages, ΦCP6-1 and ΦCP6-4.
Specifically, between days 48 and 78 after sowing, there was a dramatic increase in the abundance of ΦCP6-1, and this phage became the most abundant phage during this time and was found on more than two-thirds of all of the plants sampled. This presence was maintained until day 141, after which there was a sharp drop in abundance which coincided with an equally dramatic increase in the level of ΦCP6-4, so that by day 216, 9 of every 10 plants sampled harbored this phage (5). Such differences in temporal distribution suggest that ΦCP6-1 and ΦCP6-4 are adapted to two distinctly different temporal niches in the sugar beet phytosphere.
In the present study we identified ΦCP6-1 as a temperate phage with an average burst size of 224 virions per infected cell and a mean latent period of 99 min when it was grown at 30°C. In contrast, ΦCP6-4 was found to be virulent and, under equivalent conditions, had a latent period that was almost one-third that of ΦCP6-1 and a burst size that was also considerably smaller.
Previous research revealed the potential importance of latent period, burst size, and the ability to produce lysogens as “strategies” by which a phage might optimize its ability to survive in nature (1, 18, 22). Stewart and Levin (18) proposed that virulence had a selective advantage over lysogeny only in those environments in which high numbers of physiologically suitable host bacteria are found, all else being equal. Abedon (1) and Wang et al. (22) applied optimal foraging theory to phages and discussed the possible importance of the latent period and burst size for phage survival; these authors hypothesized that a strategy consisting of a short latent period and a small burst size could optimize a phage’s chances of survival in environments in which the numbers of physiologically suitable host bacteria are high. In contrast, these authors proposed that a long latent period and a large burst size could provide a selective advantage when susceptible host bacteria are scarce.
Viewed from this perspective, the early dominance of phage ΦCP6-1 and the prevalence of ΦCP6-4 late in the growing season might reflect an increase in the number of metabolically active S. liquefaciens CP6 cells in the phytosphere as the plants mature. Whether the observed temporal succession between ΦCP6-1 and ΦCP6-4 does indeed reflect such a change in the host remains to be determined but, if proven, would be a useful validation of this theoretical approach.
The strikingly different plaque morphologies of ΦCP6-1 and ΦCP6-4 undoubtedly reflect the differences in burst size, latent period, and virulence. However, the plaque development observed also highlighted another intriguing difference between the two phages, namely, the ability of ΦCP6-4 to continue encroaching into the developing bacterial lawn long after ΦCP6-1 plaques stopped growing and to eventually produce plaques surrounded by numerous concentric rings. This difference was quantified by our lawn aging experiment (Fig. 2), which illustrated the capacity of ΦCP6-4 to visibly lyse a bacterial population that was further into stationary phase than any of the other phages studied.
Our experimental approach is obviously limited in identifying the possible causes of the difference observed. This difference could be due to ΦCP6-4 being able to infect older cells or more slowly growing cells. It may be that ΦCP6-4 is able to induce excretion of a polysaccharide-degrading enzyme. Or the data may merely reflect a combination of short latent period and virulence, which enables ΦCP6-4 to infect more bacteria and to do so more visibly, while cells are still susceptible. Nevertheless, our findings highlight an alternative hypothesis concerning why the apparent temporal succession between ΦCP6-1 and ΦCP6-4 was observed. Bacteria are more likely to grow slowly during the winter than during the summer when the beets are growing and so perhaps releasing more organic material into the rhizosphere. Perhaps ΦCP6-1 is dominant in the summer because it is better at exploiting actively growing cells and ΦCP6-4 is dominant in the winter because it is better at exploiting slowly growing bacteria.
A physiological feature which is of evolutionary importance is transducing ability. Gene transfer mediated by bacteriophages could be of great significance to the environment. Four of the six phages tested here were shown to be capable of transduction, and with one exception (ΦCP6-5) these phages transduced to roughly the same degree regardless of the phenotype. It is worth noting that our inability to detect transduction of rifampin resistance by ΦCP6-1 was most likely due to a combination of a low transfer frequency and a high limit of detection rather than to any intrinsic difference between this phage and the other transducing phages. Indeed, all of the transfer frequencies recorded were somewhat low (around 107 to 109 for phage lysates and 1 to 2 orders of magnitude less when lysogens were involved). So while it is clearly possible for these phages to mediate gene transfer among CP6 strains in situ, the probability of such events occurring within a fixed time period is potentially very low. This is not to say that the gene transfer role of the phages has no significance in situ; under propitious circumstances consequential genetic exchanges need only occur once to have an impact. However, our findings do imply that the likelihood that such events occur in a given time period is very low.
We must also acknowledge that our perception of the gene transfer potential of phages in general was inevitably biased by our choice of phages and host. This study also showed that successful detection of transduction depends on the “correct” choice of phenotype for transfer. S. liquefaciens CP6KZY and S. liquefaciens CP6K were both produced directly from the wild-type strain, but the former strain allowed phages to consistently transduce the kanamycin gene, while the latter did not.
ACKNOWLEDGMENTS
This work was supported by Ministry of Agriculture Fisheries and Food grant RG0112.
We thank Susan Norris and Mike Turner for technical assistance and the electron microscopy unit at the Central Veterinary Laboratory, Surrey, United Kingdom, for the use of facilities.
REFERENCES
- 1.Abedon S T. Selection for bacteriophage latent period length by bacterial density: a theoretical examination. Microb Ecol. 1989;18:79–88. doi: 10.1007/BF02030117. [DOI] [PubMed] [Google Scholar]
- 2.Ackermann H-W. Frequency of morphological phage descriptions in 1995. Arch Virol. 1996;141:209–218. doi: 10.1007/BF01718394. [DOI] [PubMed] [Google Scholar]
- 3.Adams M H. Bacteriophages. New York, N.Y: Interscience Publishers; 1959. [Google Scholar]
- 4.Alexeyev M F, Shokolenko I N, Croughan T P. New mini-Tn5 derivatives for insertion mutagenesis and genetic engineering in Gram-negative bacteria. Can J Microbiol. 1995;41:1053–1055. doi: 10.1139/m95-147. [DOI] [PubMed] [Google Scholar]
- 5.Ashelford K E, Day M J, Bailey M J, Lilley A K, Fry J C. In situ population dynamics of bacterial viruses in a terrestrial environment. Appl Environ Microbiol. 1999;65:169–174. doi: 10.1128/aem.65.1.169-174.1999. [DOI] [PMC free article] [PubMed] [Google Scholar]
- 6.Bergh Ø, Børsheim K Y, Bratbak G, Heldal M. High abundance of viruses found in aquatic environments. Nature. 1989;340:467–468. doi: 10.1038/340467a0. [DOI] [PubMed] [Google Scholar]
- 7.Bratbak G, Heldal M, Norland S, Thingstad F. Viruses as partners in spring bloom microbial trophodynamics. Appl Environ Microbiol. 1990;56:1400–1405. doi: 10.1128/aem.56.5.1400-1405.1990. [DOI] [PMC free article] [PubMed] [Google Scholar]
- 8.Day M J, Marchesi J R. Transduction in the aquatic environment. In: Akkermans A D L, van Elsas J D, de Bruijn F J, editors. Molecular microbial ecology manual. Dordrecht, The Netherlands: Kluwer Academic Publishers; 1996. pp. 1–21. [Google Scholar]
- 9.Fry J C. One-way analysis of variance. In: Fry J C, editor. Biological data analysis. Oxford, United Kingdom: IRL Press; 1992. pp. 1–39. [Google Scholar]
- 10.Grimont P A D, Grimont F. The genus Serratia. Annu Rev Microbiol. 1978;32:221–248. doi: 10.1146/annurev.mi.32.100178.001253. [DOI] [PubMed] [Google Scholar]
- 11.Kalbe C, Marten P, Berg G. Strains of the genus Serratia as beneficial rhizobacteria of oilseed rape with antifungal properties. Microbiol Res. 1996;151:433–439. doi: 10.1016/S0944-5013(96)80014-0. [DOI] [PubMed] [Google Scholar]
- 12.Kokjohn T A, Miller R V. Gene transfer in the environment: transduction. In: Fry J C, Day M J, editors. Release of genetically engineered and other microorganisms. Cambridge, United Kingdom: Cambridge University Press; 1992. pp. 54–81. [Google Scholar]
- 13.Lilley A K, Bailey M J. The acquisition of indigenous plasmids by a genetically marked pseudomonad population colonizing the sugar beet phytosphere is related to local environmental conditions. Appl Environ Microbiol. 1997;63:1577–1583. doi: 10.1128/aem.63.4.1577-1583.1997. [DOI] [PMC free article] [PubMed] [Google Scholar]
- 14.Murphy F A, Fauquet C M, Bishop D H L, Ghabrial S A, Jarvis A W, Martelli G P, Mayo M O, Summers M D. Virus taxonomy: classification and nomenclature of viruses. Sixth report of the International Committee on Taxonomy of Viruses. New York, N.Y: Springer-Verlag; 1995. [Google Scholar]
- 15.Proctor L M, Fuhrman J A. Viral mortality of marine bacteria and cyanobacteria. Nature. 1990;343:60–62. [Google Scholar]
- 16.Rochelle P A, Fry J C, Day M J, Bale M J. An accurate method for estimating the sizes of small and large plasmids and DNA fragments by gel electrophoresis. J Gen Microbiol. 1986;132:53–59. doi: 10.1099/00221287-132-1-53. [DOI] [PubMed] [Google Scholar]
- 17.Sambrook J, Fritsch E F, Maniatis T. Molecular cloning: a laboratory manual. 2nd ed. Cold Spring Harbor, N.Y: Cold Spring Harbor Laboratory Press; 1989. [Google Scholar]
- 18.Stewart F M, Levin B R. The population biology of bacterial viruses: why be temperate. Theor Popul Biol. 1984;26:93–117. doi: 10.1016/0040-5809(84)90026-1. [DOI] [PubMed] [Google Scholar]
- 19.Thompson I P, Bailey M J, Fenlon J S, Fermor T R, Lilley A K, Lynch J M, McCormack P J, McQuilken M P, Purdy K J, Rainey P B, Whipps J M. Quantitative and qualitative seasonal changes in the microbial community from the phyllosphere of sugar beet (Beta vulgaris) Plant Soil. 1993;150:177–191. [Google Scholar]
- 20.Timms-Wilson T, Ellis R, Dyke K, Bailey M J. Pseudomonas ’97 abstracts. VIth International Congress on Pseudomonas: Molecular Biology and Biotechnology, Madrid. 1997. Reporter genes and immunological methods for monitoring inocula activity and persistence in the rhizosphere of a biological control agent; p. 181. [Google Scholar]
- 21.Velleman P F, Hoaglin D C. Applications, basics, and computing of exploratory data analysis. Boston, Mass: Duxbury Press; 1981. [Google Scholar]
- 22.Wang I-N, Dykhuizen D E, Slobodkin L B. The evolution of phage lysis timing. Evol Ecol. 1996;10:545–558. [Google Scholar]


