

Abstract
Effective ways to measure employee job satisfaction are fraught with problems of scale, misrepresentation, and timeliness. Current methodologies are limited in capturing subjective differences in expectations, needs, and values at work, and they do not lay emphasis on demographic differences, which may impact people’s perceptions of job satisfaction. This study proposes an approach to assess job satisfaction by leveraging large-scale social media data. Starting with an initial Twitter dataset of 1.5M posts, we examine two facets of job satisfaction, pay and supervision. By adopting a theory-driven approach, we first build machine learning classifiers to assess perceived job satisfaction with an average AUC of 0.84. We then study demographic differences in perceived job satisfaction by geography, sex, and race in the U.S. For geography, we find that job satisfaction on Twitter exhibits insightful relationships with macroeconomic indicators such as financial wellbeing and unemployment rates. For sex and race, we find that females express greater pay satisfaction but lower supervision satisfaction than males, whereas Whites express the least pay and supervision satisfaction. Unpacking linguistic differences, we find contrasts in different groups’ underlying priorities and concerns, e.g., under-represented groups saliently express about basic livelihood, whereas the majority groups saliently express about self-actualization. We discuss the role of frame of reference and the “job satisfaction paradox”, conceptualized by organizational psychologists, in explaining our observed differences. We conclude with theoretical and sociotechnical implications of our work for understanding and improving worker wellbeing.
Keywords: job satisfaction, demographic differences, sex, gender, race, geography, Twitter, social media, macroeconomic constructs, workplace
1. INTRODUCTION
Every economy strives to ensure that the demand for employment is met, because jobs are not just a source of income, but also an avenue for people to learn, grow, and prosper. Organizations and policymakers increasingly recognize that promoting worker wellbeing is not merely good for the worker, it can also improve organizational outcomes [42]. Therefore, these stakeholders seek to foster a healthy work environment by offering a vibrant work culture, equal opportunities for all, platforms to learn new skills, and miscellaneous other benefits [91]. Job satisfaction is the primary indicator of worker wellbeing, that captures whether workers are doing well at work, and is closely associated with positive work experiences, job performance, and career success [17, 21, 73, 89, 114]. While job satisfaction is known to positively impact one’s performance and wellbeing, job dissatisfaction could result in decreased motivation and commitment, resulting in poorer outcomes [35, 74, 103]. For these reasons, countries seek to assess population-level worker wellbeing to complement economic indicators, and job satisfaction is a critical component [43].
However, assessing job satisfaction suffers from challenges. Current practices include conducting self-report surveys. These methods are expensive, intrusive, time-consuming, lack the temporal granularity to be actionable, and have substantially low response rates (9% within the U.S.) [8, 12, 144]. When conducted within an organization, respondents’ privacy concerns are amplified, leading to social desirability and non-response biases, and under-representation of counter-views or less popular opinions [55, 75]. Typical job satisfaction measures summarize multi-dimensional information into a single metric, however, individuals lay varying importance to different aspects of jobs [149]. Cultural differences in people from varying geographic locales, race, and sex, may also drive distinct beliefs and perceptions of one’s workplace [46, 149]. When these nuances are not captured in existing summative approaches of assessing job satisfaction, it may lead to inaccurate conclusions regarding fairness, equity, and inclusiveness at workplaces. Moreover, organizational psychologists have argued that such surveys may suffer from the limitation of “oversimplification of social reality” [115], and may misrepresent or suppress the voices of the underrepresented and historically disadvantaged groups in the workforce, or their varied and unique experiences [150].
This paper is motivated by the growing interest in understanding worker wellbeing at scale, as well as by the observations in organizational science that differences in perceived job satisfaction lie in individual differences in beliefs about careers, opportunities, concerns, and livelihood across demographics. We leverage social media data to infer and study job satisfaction, since it enables candid self-disclosure of personal and social experiences, and can provide us with inexpensive, naturalistic, and non-intrusive open-ended data to measure worker wellbeing, particularly people’s perceived job satisfaction. This paper targets the following research aims:
Aim 1: To assess perceived job satisfaction via social media data.
Aim 2: To study demographic differences in perceived job satisfaction by geography, sex, and race.
Aim 3: To examine linguistic differences in job satisfaction expressions between majority and minority demographic groups in the workforce.
Recognizing that job satisfaction is a multi-faceted construct [145], we focus on two facets, pay and supervision satisfaction. Pay forms a crucial element, as individuals often consider pay as the most important aspect of their satisfaction [82]. Supervisor support is important in influencing individuals’ wellbeing and can serve as a coping resource against stressors [139]. Our work collects over one million Twitter posts related to self-expressed pay and supervision satisfaction. For our first aim, we adopt a theory-driven approach to expert-annotate 12,000 pay-related and 11,000 supervision-related posts on 1) their relevance to job satisfaction, and consequently, 2) the valence (positive or negative) of posts relevant to job satisfaction. We use the annotated data to build machine learning classifiers (average AUC of 0.84) to infer perceived job satisfaction at scale.
For the second aim, by focusing on U.S. based Twitter posts, we examine the demographic differences in perceived job satisfaction by geography, sex, and race. For geography, we compare job satisfaction on Twitter against state-wise macroeconomic and worker wellbeing indicators, finding convergent validity for our measurement. We investigate the relationship between perceived job satisfaction and sex, race, and sex-race intersections. For sex, we find that females show greater pay satisfaction but lower supervision satisfaction than males, and for race, we find racial minorities are more likely to show greater job satisfaction (in both facets) than Whites. We address our third research aim by examining if social media language of different demographic groups explains differences in the underlying priorities, concerns, and nuances that may affect their perceived job satisfaction. We find that under-represented minorities largely express concerns regarding basic livelihood and alternate income sources, whereas the historically privileged majorities express concerns regarding self-actualization, professional development, and career opportunities.
We situate our findings in the literature on worker wellbeing concerns, demographic differences, frame of reference effects, and the well-known “job satisfaction paradox” [28, 72]. Our work reveals how social media can function as a naturalistic data source to delineate multi-faceted workplace concerns. We discuss the implications for understanding and improving workplace wellbeing, while accounting for underlying demographic (i.e., sex, race, geography) differences. We revisit what job satisfaction may mean to different people based on their (minority/majority) identities. To conclude, we outline socio-technical interventions that can correct for biases due to differing expectations and subjective interpretations of workplace experiences.
Privacy, Ethics, and Reflexivity.
Because our work uses publicly accessible Twitter data without any interaction with individuals whose data is analyzed, it did not qualify for ethics board approval. However, we are committed to securing the privacy of the individuals in our dataset. This paper uses de-identified data for analyses and presents paraphrased quotes to reduce traceability, yet provide context in readership. We recognize the privacy and ethical sensitivities of our study since we work with location, sex, and race attributes of social media users. We acknowledge that our work considers only binary sex (male / female) and only the four major races in the U.S. This is primarily because of the limits of state-of-the-art demographic attribute inference algorithms. The concepts surrounding demographic groups also lack clear agreement, as there is no widely agreed-upon guideline for sex and race representation in the scholarly literature. Our work can be argued to be non-inclusive of certain marginalized communities or potentially reinforcing stereotypes about certain demographic groups. However, as a team comprising social computing and organizational psychology researchers who hold diverse gender, racial, and cultural identities, we intend to showcase this work as a feasibility study of using social media to unpack underlying cross-demographic differences in the perception of a workplace wellbeing metric (job satisfaction). We believe our proposed methods can be extended to study other minority identities in the future and identify the broader societal and structural factors contributing to the perceived differences. Section 8 discusses the ethical implications and limitations further.
2. RELATED WORK
2.1. Job Satisfaction: Definition and Measurement
One of the early definitions of job satisfaction is credited to Locke who describes it as a pleasurable or positive emotional state resulting from the appraisal of one’s job or job experiences [95]. While many researchers consider job satisfaction to be an attitude towards one’s job [18], more recently Weiss deconstructed it to include evaluative judgments, affective experiences, and beliefs about jobs [149]. Job satisfaction is widely studied in organizational sciences [62] and is related to employee stress [17], affect [31], performance [73], and turnover [24].
Although researchers and practitioners agree on the importance of job satisfaction, there are some notable differences in how it has been operationalized and measured [145]. Job satisfaction has been measured using a variety of instruments, including global instruments for jobs in general, instruments for specific jobs, and instruments that tap multiple facets of job satisfaction [61, 116]. Over the years, researchers have been increasingly recognizing the importance of addressing the multifaceted nature of job satisfaction, as reflected in scales such as the Job Diagnostic Survey [61] and the Job Descriptive Index (JDI) [64]. The homogeneous nature of each facet, and their independence from other facets, makes it possible to independently study the effects of macroeconomic factors and workplace conditions on each facet. The JDI is the most widely used assessment of job satisfaction, and encompasses multiple facets, including but not limited to: the work itself, pay, promotion opportunities, supervision, and colleagues [64]
Researchers have studied and compared the reliability and validity of different job satisfaction surveys [7, 145, 149]. Scholars note that survey questions may not only be responded “carelessly” [86], but also, because of their underlying parsimonious design, may not be interpreted the same way across individuals and groups, which may bias survey response. More pertinently, the use of survey methods for assessing job satisfaction at the population-level is limited. It is costly to implement it at scale to assess job satisfaction with high temporal granularity (e.g., to estimate day-to-day changes). Further, Pew survey estimates that response rates for surveys are very low (9% within the U.S.) [8, 12, 144] and will get lower as time passes due to the use of caller ID and spam protection. This leads to concerns of representativeness at large. Our work explores a different method to address the issue of understanding population-level job satisfaction. We capture people’s naturalistic, self-motivated and self-initiated expressions on social media to quantify their perceived job satisfaction. By grounding our assessment in a theory-driven approach that captures facet-wise job satisfaction, and validating it with macroeconomic indicators, we illustrate its potential as a proactive tool to inform interventions for improving workplace wellbeing.
2.2. Antecedents and Determinants of Job Satisfaction
Given that we are interested in uncovering how different demographic groups express their perception of job satisfaction on social media, we review prior research that has identified factors associated with job satisfaction. Adopting a comprehensive approach, Agho et al. discussed several determinants of job satisfaction. These encompass distributive justice, supervisory support, organizational labor market, integration and coordination among coworkers, and pay [3]. Other determinants of job satisfaction include organizational constraints [111], role constructs [83], work-family conflict [14], work values [85], and work schedules [47]. While job satisfaction has primarily been studied at the individual level, macroeconomic conditions affect job satisfaction as well. For instance, higher unemployment rates lead to increased demands among the workers that remain employed, resulting in lower job satisfaction [22, 137]. Further, average income levels in an area affect overall job satisfaction [22], as greater income provides workers in that area with a resource that helps them cope and protects them from other stressors [118].
A body of research in this space also highlights group-level differences in job satisfaction across demographic groups [19, 104]. Kaiser conducted a large-scale survey to understand job satisfaction across Europe and found that women reported significantly higher job satisfaction than men, despite women being more disadvantaged in the workforce of the countries considered in the survey [84]. Prior work found evidence of a job satisfaction paradox among under-represented, disadvantaged minorities at work — these include the apparent inconsistency that women express greater job satisfaction than men [28, 88], and Blacks more than Whites [11], despite them possessing worse objective employment outcomes and conditions, measured in terms of pay, quality of life, and living conditions [133, 135, 143]. Similarly, an early work by Hulin found that job satisfaction was higher in relatively disadvantaged areas, explaining the counter-intuitive result based on the different frames of references of the participants [72]. Focusing on geographical differences, Hulin studied job satisfaction of people employed in the same job but at different locations, finding that 1) in relatively advantaged areas, the job paid poorly compared to available alternatives, and the participants’ frame of reference suggested the job was a poor one, whereas 2) in relatively disadvantaged areas, the job paid quite well, and the participants suggested the job was a good one [72].
The above studies have focused on differential expectations as a prime determinant of these demographic differences in job satisfaction. Indeed, theory regarding the job satisfaction paradox has focused on workers’ expectations as the likely cause of the paradox [27]. A man and woman with the same jobs and expectations would be expected to report identical job satisfaction, but Clark argued that women’s expectations are lower than men’s for a variety of reasons, including traditional gender roles [27]. Along the lines of these differences in perception, Usui found that while women primarily focus on the pay and not the job amenities, men tend to appreciate both [143]. Also, work values differ significantly across genders as men prioritize promotion prospects, pay and security, whereas women greatly value good relations with managers, work itself, work hours, and the ability to use one’s own initiative [27, 133]. In the case of ethnic minorities, studies have found Hispanics in the U.S. to be more satisfied than Whites, given that some of them compare their present income to their potential income in their country of origin [59, 92].
Our work examines the demographic differences in perceived job satisfaction expressions on social media. Social media data allows us to investigate linguistic cues that may be associated with factors contributing to one’s perceived job satisfaction. By examining the language differences, our work provides insights into the disparities in priorities and concerns of different demographic groups that affect their frame of reference when perceiving job satisfaction.
2.3. Assessing Job Satisfaction and Worker Wellbeing using Social Media
Over a decade ago, John et al. envisioned that online interactions would rigorously evolve over the years, where the individual and collective power of people to contribute and share content, experiences, ideas, expertise, etc. would open up new research opportunities to study social constructs and sociological functioning [79]. A growing body of research has used social media data to advance our understanding of wellbeing [32, 40, 122, 128]. Compared to surveys, social media provides an unobtrusive means to study longitudinal, real-time, and naturalistic data at scale [56].
Related to workplace wellbeing in particular, several studies in CSCW and HCI have leveraged web and social media data to study employee behavior [26, 40, 71, 78, 99]. Ehrlich and Shami studied employees’ motivations for using social media [48]. Employees interact and share opinions, and express work practices on both internal and external social media platforms availing platform affordances and design [140, 154, 155]. Prior studies report that social media use positively correlates with workplace wellbeing [65, 120]. A series of studies at IBM examined employee engagement on social media [44, 106, 107, 129]. A variety of language and network dynamic approaches have investigated workplace wellbeing constructs, including employee engagement [106, 129], affect [40], social pulse [130], reputation [76], role constructs [125], workplace culture [39, 60]. Recently, within the context of the ongoing pandemic, Das Swain et al. studied how social media and ubiquitous technologies can assist the wellbeing and productivity of remote workers [37].
These studies reveal the value of using unobtrusive data sources in multi-dimensional evaluation of worker wellbeing. In recent work, Jaidka et al. compared several approaches of social media language based inferences against population-scale wellbeing estimates [77]. With respect to employee job satisfaction, Hernandez et al. adopted dictionary-based methods to measure city-level job satisfaction on Twitter [70], while Llorente et al. examined national-level unemployment with Twitter data [94]. Recently, Foong et al. studied gender differences in pay expectations [52], and Maaranen and Tienari studied hyper-masculinity in work cultures via social media [97]. As noted earlier, conventional techniques focus on smaller samples of the population and are not representative of different subpopulations. Building on the above literature, our study bridges this gap by offering a scalable approach for assessing job satisfaction. Our study further elucidates demographic differences in perceptions of job satisfaction as reflected in social media language. We gain insights on job-related concerns around geography, sex, and race, which collectively contribute to CSCW’s long-standing interest in building technologies to improve workplace experiences.
3. COLLECTING SOCIAL MEDIA DATA ON JOB SATISFACTION EXPRESSIONS
This paper studies perceived job satisfaction as expressed on social media, particularly Twitter. Twitter is one of the most popular social media platforms [58], and its public-facing, micro-blogging based design enables candid self-disclosure and self-expressions [50]. For the purpose of the study,we collect Twitter posts based on a list of pay and supervision related search terms curated using keywords present in the Job Desriptive Index (JDI) and the Job in General Scale (JIG) [9, 64]. Table 1 reports the seed keywords for our data collection, corresponding to the two facets of job satisfaction that we study-pay and supervision. Using these seed keywords, we employ the Twitter API to collect a total of 939,101 posts containing keywords related to pay satisfaction and 573,554 posts containing keywords related to supervision satisfaction. These posts pertain to the period between January 2012 and December 2019 and were posted by 855,508 unique users (mean=1.77 posts per user). We also collect each user’s name, location, and description. To give the reader a broad sense of our dataset, we present example word-trees in Fig. 1 which show examples of post snippets of how people express about “raise” and “boss” on Twitter. For example, we find expressions around “pay raise”, “raise of taxes”, and “raise of minimum wage”, and around “my/our boss is [..]”.
Table 1.
Seed keywords used to collect Twitter data on job satisfaction expressions.
| Facet | Seed Keywords |
|---|---|
| Pay | pay raise, my raise, my pay, my salary, my income, my wage, got a raise, my bonus, got a bonus, my wages, get a raise, get a bonus, hourly pay, bump in pay |
|
| |
| Supervision | my boss, my supervisor, my director, team lead, my team lead, my manager, my director, my foreman, my mngr, my mgr, my ceo |
Fig. 1.

Example word-trees built around “raise” and “boss” on snippets of Twitter posts in our dataset. The font sizes are proportionate with relative occurrence.
4. AIM 1: MEASURING PERCEIVED JOB SATISFACTION ON TWITTER
4.1. Annotating Job Satisfaction on Twitter
In the absence of labeled ground-truth social media data on job satisfaction expressions, we adopt a theory-driven annotation approach grounded in organizational science. We manually annotate a random sample of 1.5% of our entire dataset: 12,000 Twitter posts related to pay and 10,000 posts related to supervision. Two coauthors, who are industrial-organizational psychologists, designed a short frame of reference training for undergraduate research assistants, employed as annotators. The training started with defining and describing job satisfaction and its facets of pay and supervision satisfaction. Example scales for pay and supervision satisfaction facets were presented, including the Minnesota Satisfaction Questionnaire [148] and the Job Descriptive Index [64]. We explained the annotation scheme to the annotators, who then participated in practice coding and received feedback. After the two annotators completed their coding, consensus was reached through discussion by the two industrial-organizational psychologists. On this initial curated dataset, our annotation approach included two further tasks on each post — 1) labeling relevance (binary labels of relevant or irrelevant, to remove noisy posts unrelated to job satisfaction), and 2) labeling valence (if a post expresses positive or negative pay/supervision satisfaction).
Table 2 shows example posts, labeled relevant and irrelevant in our dataset. For annotating post relevance, the raters show a high agreement of 92% for pay and 93% for supervision satisfaction. Out of the initial sample of 12,000 pay-related posts, we find 2,244 (19%) posts to be relevant, and out of the initial sample of 11,000 supervision-related posts, we find 1,337 (12%) posts to be relevant. The same Table 2 also shows valence annotations for the relevant posts. For valence, the raters again show a high agreement of 92% for pay satisfaction and 93% for supervision satisfaction posts. We find a reasonably balanced distribution of positive and negative posts in our hand-labeled dataset — 1,112:1,132 for the 2,244 relevant pay satisfaction posts and 759:578 for the 1,337 relevant supervision satisfaction posts.
Table 2.
Example posts excerpts along with their relevance and valence annotation.
| Example Post | Relevance | Valence |
|---|---|---|
| Pay-Related | ||
| how the fuck have I spent 90% of my pay in 2 days | Not Relevant | NA |
| I just remembered my bonus funds are reset for this semester | Not Relevant | NA |
|
| ||
| I got overtime on this paycheck...We get a bonus on next paycheck.#WinWin | Relevant | Positive |
| it may be years untilthe day, my dreams will match up with my pay | Relevant | Negative |
| Supervision-Related | ||
| I jut said I forged my mom’s signature In front of my supervisor | Not Relevant | NA |
| God Bless all Small Businesses all work hard because Jesus is our Boss IJN Amen | Not Relevant | NA |
|
| ||
| I LOVE my supervisor! | Relevant | Positive |
| I cannot decide who do I hate the most among my father, my supervisor, and my ex. | Relevant | Negative |
4.2. Building A Machine Learning Classifier of Job Satisfaction
To infer perceived job satisfaction in social media expressions at scale, we draw on natural language analysis techniques to build machine learning classifiers on the annotated dataset. We describe our approach, features, and models below.
4.2.1. Machine Learning Features.
Inspired from several prior works in social media language [77, 123, 124, 128], our work uses three kinds of features:
Open-Vocabulary (n-grams).
Open-vocabulary features have enabled several prediction studies capturing rich linguistic expressions and descriptions of experiences [128]. These features are based on keywords/phrases and their co-occurrences. We use the top 500 most frequent n-grams (n=1,2,3).
Psycholinguistic Attributes (LIWC).
Linguistic Inquiry and Word Count (LIWC) is a lexicon of keywords grouped into a variety of psycholinguistic categories (50 in total) [136]. These categories encompass affect, cognition and perception, interpersonal focus, temporal references, lexical density and awareness, biological, personal, and social concerns.
Sentiment.
Because our work concerns identifying satisfaction and dissatisfaction in language, we include sentiment of text as a feature. We use Stanford CoreNLP’s deep learning based sentiment analysis library [98] to label sentiment of a post as positive, negative, and neutral.
4.2.2. Modeling Approach.
Using the above features, we train machine learning models for both relevance and valence classification separately for the pay and supervision satisfaction data. We consider multiple classifiers including Logistic Regression, K-Nearest Neighbors (KNN), Support Vector Machine (SVM), Random Forest, Adaboost, and Multilayered Perceptron (MLP) models. We conduct grid search and 𝑘-fold (𝑘=5) cross-validation for parameter tuning and evaluating our models. We use K-best univariate statistical scoring model using mutual information to obtain relative importance and statistical significance of features in our machine learning classifiers.
4.2.3. Classifying Pay Satisfaction.
Table 3 reports the accuracy metrics of pay-related job satisfaction predictions. The SVM classifier performs the best in case of both relevance (area under receiver operating charateristic curve, AUC = 0.81) as well as valence (AUC = 0.89) classifications (refer Fig. 2 for ROC curves). We use these classifiers to label our entire dataset. The relevance classifier labeled 6.07% (56,977 out of 939,101) posts as relevant, out of which, the valence classifier labeled 18,428 posts as positive (pay satisfaction) and 38,549 posts as negative (pay dissatisfaction).
Table 3.
Median metrics of pay satisfaction classifiers in k-fold (k=5) cross-validation.
| Model | Relevance | Valence | ||||
|---|---|---|---|---|---|---|
|
| ||||||
| Precision | Recall | AUC | Precision | Recall | AUC | |
| Logistic Reg. | 0.73 | 0.72 | 0.80 | 0.80 | 0.80 | 0.89 |
| KNN | 0.81 | 0.63 | 0.70 | 0.72 | 0.72 | 0.81 |
| SVM (Linear) | 0.73 | 0.73 | 0.81 | 0.80 | 0.80 | 0.89 |
| Random Forest | 0.83 | 0.65 | 0.80 | 0.72 | 0.74 | 0.82 |
| AdaBoost | 0.83 | 0.66 | 0.80 | 0.79 | 0.79 | 0.87 |
| MLP | 0.81 | 0.67 | 0.77 | 0.76 | 0.76 | 0.86 |
Fig. 2.

ROC curves of pay satisfaction classifiers.
Table 4 reports the top features of the pay satisfaction classifiers. We find keywords contextually related to pay, e.g., bonus, get raise. The presence of LIWC: 1st person pronoun indicates that instead of capturing more general commentary on workplace pay, the classifier can capture self-expressions of pay satisfaction, e.g., “y’all, i am excited to share that i got a raise and bonus at my job today!”. Some of these features also appear in the valence classifier, along with emotional and affective keywords, as revealed by the prevalence of sentiment and LIWC: Anger features, e.g., “it just makes me superrr angry to see so much taxes deducted out of my pay check”. The valence classifier is also dominated by LIWC categories of achievement, causation, and relative, which may suggest how people psycholinguistically express needs, earnings, and competitiveness at work, e.g., “i do have a problem because i need to do 2–3 jobs to achieve a living wage”.
Table 4.
Top features of paysatisfaction classifier.
| Relevance | Valence |
|---|---|
| bless, bonus, check, constantly, get bonus, get raise, got raise today, income, income tax, pay, pay check, pay raise, raise today, LIWC: (1st P., Work), reduce, tax, today, week | food, increasing, need, pay, reduce, salary, spend, taxes, wage, LIWC: (Anger, Causation, 1st P. Pl., 2nd P., Fu. Tense, Aux. Verb, Relative, Achievement), Sentiment: (Pos., Neg.) |
4.2.4. Classifying Supervision Satisfaction.
Table 5 reports the performance metrics of supervision-related job satisfaction accuracy. The SVM models again perform the best in both relevance (AUC = 0.80) and valence (AUC = 0.87) classification. Fig. 3 shows the ROC curve of the supervision-satisfaction classifier. After labeling the posts related to supervision satisfaction, we obtain 17.78% (99,139 out of 573,554) relevant posts. Out of these 99,139 relevant posts, 37,305 posts express supervision-satisfaction, and the remaining 61,834 posts express supervision-dissatisfaction.
Table 5.
Median metrics of supervision satisfaction classifiers in k-fold (k=5) cross-validation.
| Model | Relevance | Valence | ||||
|---|---|---|---|---|---|---|
|
| ||||||
| Precision | Recall | AUC | Precision | Recall | AUC | |
|
|
|
|||||
| Logistic Reg. | 0.73 | 0.72 | 0.80 | 0.80 | 0.80 | 0.89 |
| KNN | 0.81 | 0.63 | 0.70 | 0.72 | 0.72 | 0.81 |
| SVM (Linear) | 0.73 | 0.73 | 0.81 | 0.80 | 0.80 | 0.89 |
| Random Forest | 0.83 | 0.65 | 0.80 | 0.72 | 0.74 | 0.82 |
| AdaBoost | 0.83 | 0.66 | 0.80 | 0.79 | 0.79 | 0.87 |
| MLP | 0.81 | 0.67 | 0.77 | 0.76 | 0.76 | 0.86 |
Fig. 3.

ROC curves of supervision satisfaction classifiers.
Table 6 reports the top features of the supervision-related satisfaction classifier. We observe descriptive keywords about individuals, including profane connotations e.g., ass, bitch, cool. The valence classifier shows the presence of emotional and career growth related keywords, e.g., “I just hate it to ask leave from my supervisor. Hate this shit that takes so much out of me” and “My manager is proud that the customer commended my work! I can enjoy the rest of the day.”.
Table 6.
Top features of supervision satisfaction classifier.
| Relevance | Valence |
|---|---|
| ass, awesome, bitch, boss, congratulations, ceo, early, gave, go home, hiring, job like, leave, love, lunch, proud, seriously, shift, shit, supervisor gave, team, team lead, tied team, told | amazing, best, bitch, boss, cool, congrats, fired, fuck, happy, hate, like, love, proud, shit, LIWC: (Anger, N. Affect, Swear, Negation, Quantifier, Achievement), Sentiment: (Pos., Neg.) |
5. PREPARING TWITTER DATA ON JOB SATISFACTION BY DEMOGRAPHICS
Our second and third research aims focus on studying the differences in the perception of job satisfaction by demographics (geographical location, sex, and race). We limit our work at the level of the states of U.S., consider binary sexes of male and female, and four major racial groups in the U.S. — 1) Whites or Caucasians (Whites), 2) Blacks or African-Americans (Blacks), 3) Hispanics or Latino (Hispanics), and 4) Asians and Pacific Islanders (APIs) [1]. As per the U.S. Bureau of Labor Statistics (BLS: www.bls.gov) and by most conventional standards, the minorities and underrepresented demographic groups in the U.S. labor force are predominantly females and racial minority groups [138]. For the purposes of our study, we identify and label Twitter posts by demographic groups. We draw upon prior work and use manual validations to semi-automatically label geographical location, sex, and race in our dataset [34, 41, 57, 105]. For the ease of exposition, we elaborately describe our approach of labeling demographics in the Appendix A.
By limiting our study to U.S.-only posts, we obtain a set of 21,506 pay-related posts and 32,335 supervision-related posts shared by unique individual usernames (Fig. 4a). For U.S.-only posts, we label the sex and race of 49,426 and 31,195 individual usernames respectively (Fig. 4b and Fig. 4c).
Fig. 4.

Distribution of Twitter posts from the U.S. by geography, sex, and race.
6. AIM 2: PERCEPTION OF JOB SATISFACTION ACROSS DEMOGRAPHICS
We next move on to our second research aim to investigate the perception of job satisfaction (as inferred via social media data) along geography. As described above, our machine learning classifiers were used to machine label our datasets with expressed job satisfaction. Fig. 5 shows pay and supervision satisfaction expressed as the proportion of positive (valence) job satisfaction posts over total number of posts throughout the U.S. – i.e., greater magnitudes indicate greater number of posts that express positive job satisfaction. We find that state-wise pay and supervision satisfaction both show a Pearson’s correlation (r) of 0.21, revealing similar direction of variability geographically, yet relative independence given the low magnitude of r.
Fig. 5.

Distribution of perceived job satisfaction (proportion of satisfied (positive valence) Twitter posts) by U.S. states. Darker colors indicate greater job satisfaction aggregated at state-level.
6.1. Job Satisfaction with respect to Macroeconomic Data by Geography
We now examine how perceived job satisfaction on social media varies by different geographical locations in a macroeconomic context, i.e., if our measurement of job satisfaction from online data reflects offline variations in measures of labor economics and worker wellbeing. We expect Twitter-based job satisfaction to exhibit similar relationships with macroeconomic conditions that self-reported job satisfaction does. However, prior research has not examined how these relationships differ by satisfaction facet (i.e., pay and supervision). Drawing on the literature on the interplay between job satisfaction and subjective wellbeing, we consider a variety of indicators.
To study the relationship of these indicators with perceived job satisfaction on social media, we conduct correlation and regression analyses. We separately aggregate pay and supervision satisfaction (valence) values for each state by normalizing on the number of Twitter posts from that state. We compute the Pearson’s correlation (r) between pay and supervision satisfaction per state against the macro-economic indicators. We further test this correlational relationship by controlling for Twitter use per state. We use regression models that treat macroeconomic measures as dependent variables, control for Twitter penetration rank [2], and use aggregated job satisfaction measures per state as independent variables. Each linear regression models consist of 46 degrees of freedom. We use correlation and linear regression because these provide interpretable associations for conditionally monotonic relationships with outcome variables of interest (macroeconomic indicators, in this case) [40, 125]. Along with a brief description and our rationale for conducting each of these tests, we discuss our observations below:
Job Satisfaction.
We examine the relationship of Twitter-based job satisfaction with survey-based job satisfaction. We obtain survey-based job satisfaction data from the Gallup Healthways Index [138], a nationally representative survey conducted on over 500K workers in the U.S., measuring job satisfaction as a binary variable that we aggregated to a 0 to 1 scale at state level. Since these metrics purport to measure similar constructs (i.e., overall job satisfaction or its facets), this test can be considered a test of convergent validity [5, 113] and hence, we would expect a positive correlation between the two measures. We find that Twitter-based pay satisfaction positively correlates (r=0.25, p=0.01) with job satisfaction (Fig. 6a), whereas Twitter-based supervision satisfaction shows no significant correlation with job satisfaction (𝑝=0.11). Similar relationship is also reflected in the regression model (R2=0.44, P=1.02×10⁻⁵) where pay satisfaction shows a significant positive coefficient (0.14, P=0.01).
Fig.6.

Perceived job satisfaction on Twitter by geography.
Financial Wellbeing.
We examine the relationship between Twitter-based job satisfaction and financial wellbeing. We use state-wise financial wellbeing data published by Gallup [132, 138], which measures the percentage of people in an area who consider themselves financially excellent/good (against fair/poor). We would expect pay satisfaction to have a positive association with financial wellbeing [109], whereas there is no clear theoretical relationship between supervision satisfaction and financial wellbeing. Our results indicate that Twitter-based measure of pay satisfaction shows a high positive correlation (r=0.29, p=0.03, Fig. 6b) with significance, while supervision satisfaction shows no significant correlation (p=0.69) with financial wellbeing. The regression model (R2=0.14, p=9.82×10⁻³) confirms the significance and positive coefficient for pay satisfaction (10.14, p=0.02).
Employees’ Strengths.
Employees’ Strengths Index is a measure of the extent to which one is able to use (or not use) their strengths at work everyday, with higher scores indicating higher agreement with the statement, “At work, do you get to use your strengths to do what you do best every day, or not?” [134]. We obtain U.S. state-wise employee strengths from Gallup Employee Engagement survey [134]. We find a strong positive correlation of pay satisfaction (r=0.48, p=0.01, Fig. 6c). The regression model (R2=0.26, p=2.81×10⁻⁴) confirms the significance and positive coefficient for pay satisfaction (0.08, p=0.01). However, we find that supervision satisfaction shows no significant relationship with employees’ strength (p=0.14), contrary to prior work that found that employees’ strength increases when managers focus on employees’ strengths and positive characteristics, as opposed to their weaknesses and negative characteristics [134].
Unemployment Rate.
Unemployment is a critical construct in macroeconomics and social science [146], and it has historically shared an interesting relationship with job satisfaction, varying over time, place, and context [24]. Unemployment is closely associated with employee retention and turnover, which are important correlates of job satisfaction [149]. We use state-wise unemployment rates (as percentages), averaged over seven years (2012–19), published by the Bureau of Labor Statistics (www.bls.gov). We find that while supervision satisfaction shows no significant correlation (p=0.77), pay satisfaction shows a significantly high negative correlation (r=−0.46, p=8.84×10⁻⁵, Fig. 6d) with unemployment rate. The regression model (R2=0.35, p=2.27×10⁻⁵) confirms the significance and negative coefficient for pay satisfaction (−8.78, p=3.87×10⁻³). This finding aligns with prior work that postulates that job satisfaction negatively correlates with unemployment: As unemployment rates decrease, workers can charge a premium for their labor and have a more alternative job opportunities, leading to greater job satisfaction [4].
Family Income.
A state’s true median family income corresponds to family income adjusted for cost of living. We obtain this data from the Current Population Survey jointly sponsored by the U.S. Census Bureau and the U.S. Bureau of Labor Statistics. This data quantifies state-wise true median family income on a continuous scale of USDs [20]. Conceptually, we would expect pay satisfaction to be relevant and bear a positive relationship with median family income. Our data agree with this expectation as Twitter-based pay satisfaction shows a positive correlation (r=0.1 3, = 0.03).On the other hand, supervision satisfaction shows a negative correlation (r=−0.18, p = 0.02), Fig. 6e ) with median family income. There gression model (R2 = 0.10, p = 0.01) confirms the significance and signs of coefficients for pay (64.13, p=0.05) and supervision (−76. 80, p=0.01) satisfaction. These relationships could be a reflection of peoples self-expression towards management, super vision, and work culture in high-paying jobs, consistent with the literature that suggests high paying jobs bear the burden of greater stress, unhappiness with management, and worse work-life balance [119].
Poverty Levels.
We obtain state-wise percent age population inpoverty from the U.S. Census Bureau [20]. Similar to family income, we expect poverty levels to bear a negative relationship with pay satisfaction because greater levels of poverty indicate lower pay [110]. We find that pay satisfaction expectedly shows a negative correlation (r = −0.20, p = 0.01), and supervision satisfaction interestingly shows a positive correlation (r = 0.20, p = 0.01) with state-wise poverty levels. T h e regression model (R2 = 0.11, = 0.04) agrees with the significance and signs of coefficients for pay (−16.72, p=9.60×10⁻³) and supervision (14.23, p=0.01) satisfaction. These trends somewhat agree with what we observed for the family income variable above.
6.2. Differences in Perceived Job Satisfaction by Sex and Race
We now examine differences in perceived job satisfaction across sex and race in the workforce. We obtain face t-wise job satisfaction grouped and aggregated based on demographic groups of sex,race, and the inter section of sex and race for U.S. based Twitter users in our dataset. We note that a Shapiro-Wilk’s normality test on the pay valence data reveals W=0.61, p<0.05, and the same for supervision reveals W = 0.64, p<0.05, therefore, rejecting the null hypothesis that the job satisfaction data is normally distributed. That is, we cannot assume the data to be normally distributed. We assess differences in pay and supervision satisfaction across groups by conducting Kruskal-Wallis H tests which do not assume normality in distribution of the data [101]. We also estimate the statistics of Cohen’s d and confidence intervals (Cl). We note that some of these statistics may seem to be low in magnitude, however we have discussed the plausible reasons, yet, applicability of these measurements in Section 8.1.
6.2.1. Sex.
In the case of pay (Fig. 7a), on average, males express lower pay satisfaction than females on Twitter. The average satisfaction for males is 0.35 (std.=0.47) and for females is 0.39 (std.=0.48). A statistical significance in pay satisfaction difference based on sex is revealed by a Kruskal-Wallis test (H=30.55, p<0.05, df= 1). An effect size estimate however reveals small difference between the groups (Cohen’s d=0.07), 95% CI=[0.01, 0.09]).
For supervision satisfaction (Fig. 7b), we observe a reverse pattern, i.e., on average, males express higher supervision satisfaction than females. Supervision satisfaction for males averages at 0.36 (std.=0.48) and that for women averages at 0.33 (std.=0.47). This difference between two groups is significant as per Kruskal-Wallis test (H=26.47, p<0.05, df= 1). An effect size estimate reveals small difference between the groups (Cohen’s d=0.06), 95% CI=[0.03, 0.08]).
6.2.2. Race.
From the perspective of racial groups, for pay satisfaction (Fig. 7c), Whites express lower pay satisfaction than the racial minorities on social media. The average satisfaction for Whites is 0.36 (std.=0.48) and that for racial minorities at workforce is 0.39 (std.=0.48), among which, the average satisfaction of Blacks is 0.36, Hispanics is 0.42, and Asian and Pacific Islanders (APIs) is 0.39. Pay satisfaction difference between racial majority (Whites) and minorities (other races) shows small effect size (Cohen’s d=0.07, 95% CI=[0.01, 0.10]). We also find a significant difference in job satisfaction across all racial groups as per Kruskal-Wallis test (H=11.53, p<0.05, df-3), showing that perceived pay satisfaction significantly varies by race.
In supervision satisfaction (Fig. 7d), Whites express lower satisfaction than the racial minorities. The average supervision satisfaction for Whites is 0.33 (std.=0.46), and that for other races is 0.39 (std.=0.49), among which, average satisfaction of Blacks is 0.39, Hispanics is 0.41, and APIs is 0.37. Supervision satisfaction difference between racial majority (Whites) and minorities shows an effect size Cohen’s d=0.14 with 95% CI=[0.08, 0.17]). The Kruskal-Wallis test reveals a significant difference in supervision satisfaction across all four racial groups (H=53.90, P<0.001, df =3).
Fig. 7.

Aggregated job satisfaction across demographic groups. Aggregation numbers are essentially proportion of Twitter posts that express satisfaction per group. (e) and (f) also show statistical significance as per Kruskal-Wallis H-test with * p<0.05, ** p<0.01, *** p<0.001
6.2.3. Sex and Race.
Finally, we examine perceived job satisfaction with respect to the intersectionality of sex and race. Fig. 7e shows the differences in pay satisfaction in intersectionalities. We find that females express greater (pay) satisfaction than males in their respective racial group for all races. An exception is in the case of Blacks (where there is no significant difference though). For racial groups with significant differences as per Kruskal-Wallis H test (P<0.05), expressed difference is greatest in APIs (Cohen’s d=0.22, H=7.94, p=4.84×10⁻⁴), followed by Hispanics (Cohen’s d=0.14, H=3.74, P=0.04) and Whites (Cohen’s d=0.06, H=4.59, P=0.03). Across all the sex-race intersectionalities, we observe Hispanic-females express greatest pay satisfaction (mean=0.46), and API-males express the lowest (mean=0.34).
Next, Fig. 7f shows the differences in supervision satisfaction in intersectionalities. For all races, females express lower (supervision) satisfaction than males in corresponding racial groups, but this difference is significant only in Blacks and Whites as per Kruskal-Wallis 𝐻-test (P<0.05). We find significant differences in Blacks (Cohen’s d=0.11, H=2.46, P=0.01) and Whites (Cohen’s d=0.10, H=37.26, P=1.04×10⁻⁹), and non-significant differences in Hispanics (Cohen’s d=0.05, H=0.93, P=0.33) and APIs (Cohen’s d=0.05, H=0.57, P=0.45). We observe Black-males and Hispanic-males to be most satisfied (mean=0.42), and White females to be least satisfied (mean=0.30) with supervision.
6.2.4. Interpreting sex and race differences.
Literature reports several contrasts in the perception of job satisfaction among minorities and historically disadvantaged groups. We compare our findings against the existing theoretical and empirical work in organizational psychology.
Several prior studies have found job satisfaction differences favoring women [28, 84], referred as the gender-job satisfaction paradox [135]. These studies argue that women have lower expectations from work, making them relatively more satisfied than men. Our study finds divergent gender differences depending on job satisfaction facet — women are more satisfied with their pay, but women are less satisfied with their supervision. This finding can help inform the gender job satisfaction paradox, as men and women may weigh the various factors that affect job satisfaction differently when reporting global job satisfaction [28, 135]. However, we do note that certain other studies have found no sex differences in overall job satisfaction levels [152]. Since these studies consider job satisfaction as a single macro construct and often rely on single-item scales, such measurement may mask differences in facet-level job satisfaction, as studied here.
Regarding race, most studies in the U.S. context have compared the job satisfaction of Black and White workers, respectively as ethnic minorities and majorities in the workforce [81, 147]. One group of studies found the Black workers to be more satisfied, arguing that the history of and prevailing racial discrimination causes Black workers to have lower aspirations than White workers [11, 54]. In contrast, a meta-analysis found that White workers tend to have higher job satisfaction [90], where the difference is moderated by job complexity or the amount of problem solving and discretion required by the position. Specifically, White workers tend to have higher job satisfaction in complex jobs, whereas Black workers tend to have higher job satisfaction in low complexity jobs. High complexity jobs tend to pay higher [23], so, workers may be less likely to risk those rewards by expressing dissatisfaction online. As mentioned in Section 2, prior work found ethnic minorities (e.g., Hispanics in the U.S.) to be more satisfied if they compare their present income (in the U.S.) against potential income in country of origin [59, 92]. If the above results hold for other demographic groups, they may explain why we observe lower job satisfaction for White workers than any other racial group.
7. AIM 3: LINGUISTIC DIFFERENCES IN JOB SATISFACTION EXPRESSIONS
Now, we dissect the factors that may be driving the observed perceived job satisfaction by demographics. To examine the linguistic differences in job satisfaction expressions, we employ an unsupervised language modeling technique, the Sparse Additive Generative Model (SAGE) [49]. Given any two documents, SAGE finds distinguishing keywords comparing the parameters of two logistically parameterized-multinomial models with self-tuned regularization to control the tradeoff between frequent and rare terms. We employ SAGE to identify n-grams (n=1,2,3) that distinguish the posts of different demographic groups (low vs. high geographical unemployment regions, males vs. females in sex, and Whites vs. minority races). The magnitude of SAGE value of an n-gram signals the degree of its “uniqueness”. SAGE allows us to explore how demographic groups differently and saliently express job satisfaction on Twitter. We contextualize job satisfaction expressions within the literature on frame of reference and attitudes of demographic groups [67].
7.1. Linguistic Expression Differences by Geography
We examine if job satisfaction expressions on social media reveal differences in the underlying concerns and values of geographic locations varying in employment opportunities. Using a median split, we identify states with low and high unemployment rates, which may also distinguish states on other correlated factors such as income, employment opportunities, and standard of living. We compile two groups of Twitter posts — one originating from low unemployment states, and another originating from high unemployment states, and run SAGE on these two datasets.
Table 7 shows the top keywords as per SAGE that are salient in the Twitter posts originating from low and high unemployment states. For low unemployment states, we find keywords relating to job positions (supervisor, manager candidate, program supervisor, executives, coordinator), career benefits and growth (healthwelfare, reviewing, certified, trained, succeed), and food and luxury (coffee shop, booz, culinary, alcohol, breakfast). On the other hand, keywords from high unemployment states include rights (rights, voting, freedom), income opportunities (hiring apply, extra money, pension), and other hardships (homelessness, lowincome, unpaid).
Table 7.
Top salient n-grams (n=1,2,3) in job satisfaction posts across unemployment rates (SAGE [49]).

|
The above examples suggest that people in low unemployment states generally have more gentrified concerns relating to work and self-actualization, e.g., “Yayy! i was just promoted to assistant manager and received a substantial pay raise!”, whereas people in high unemployment states typically express concerns about basic needs and rights, e.g., “Can’t afford to live solo or move, after a decade of no income and fighting homelessness every few months, I’m grateful about what I have, but some extra income would allow me to run the AC in summer without worrying about electric.” These observations support prior findings on the discrepancies in human needs, opportunities, and subjective wellbeing, with respect to varying socio-economic and historical factors [33]. The job satisfaction expressions on social media reflect socioeconomic and demographic disparities in job-related priorities and, consequently, perceived job satisfaction.
7.2. Linguistic Expression Differences by Sex
Prior work extensively studied the factors that lead to sex-based disparities in job satisfaction(Section 2), and we examine if these are captured in people’s job satisfaction expressions on social media. Table 8 shows group-wise most salient n-grams: here positive SAGE score reveals a greater (and more distinctive) presence in the posts by males, whereas a negative score reveals a greater presence in the posts by females. We find that the salient keywords used by males are dominated by financial keywords (wealth, tax, pay cut, capital gains) and political keywords (rights, gun, federal government, unions, wage laws). On the other hand, salient keywords used by females include prosocial concerns and interpersonal relationships (maternity leave, husband, supportive, hospitality, boyfriend), harassment (toxic workplace, sexually, harassed, touched, abused), clothing (bra, outfit, clothes, wear), and emotional/affective keywords (scare, emotional, stressful, screamed).
Table 8.
Top salient n-grams (n=1,2,3) in job satisfaction posts across sexes (SAGE [49]).

|
Our findings align with prior work that found women report more negative emotions and stress in job satisfaction surveys [138]. For instance, a female person expressed, “such a stressful and anxiety filled week, yesterday I found a 1200 per month student loan bill, they think I make way more than i did a year ago, it is not doable for me”. Females also saliently express workplace climate issues, particularly relating to sexual harassment and toxic workplaces [97], e.g., “I love the work in my job but my manager makes it toxic” and “my boss just touched my upper thigh. this job is no longer worth it”. These expressions reveal the nuanced and latent discriminations against women at work, e.g., “if you are a woman and you get a raise or a nice laptop, men will automatically assume you must be sexually favoring your boss coz women just can’t be good at their job to deserve a raise!” Keywords such as hourly shift, extra income, barista may correspond to women engaging in supplementary sources of income for the household, e.g., “the part time position hired me! doesn’t pay a lot, but the extra income will help so much! soon, i’ll sort out the amount of freelancing i can do on top of it.” Together, these observations reveal gender disparities in personal and employment characteristics [27, 88].
7.3. Linguistic Expression Differences by Race
Prior work has found differences in perceived job satisfaction by race or ethnicity (see Related Work). Whites are known to associate themselves with more non-material job rewards at work [141]. In contrast, according to Hagedorn, “minority workers are likely to meet with race-related stressors [...]. The nature and extent of the stressors are complex and depend on numerous factors such as the racial composition of surrounding staff—both coworkers and supervisors [...] as well as situational salience, the level of distinctiveness, and interpretation of token status experienced by the worker” [63].
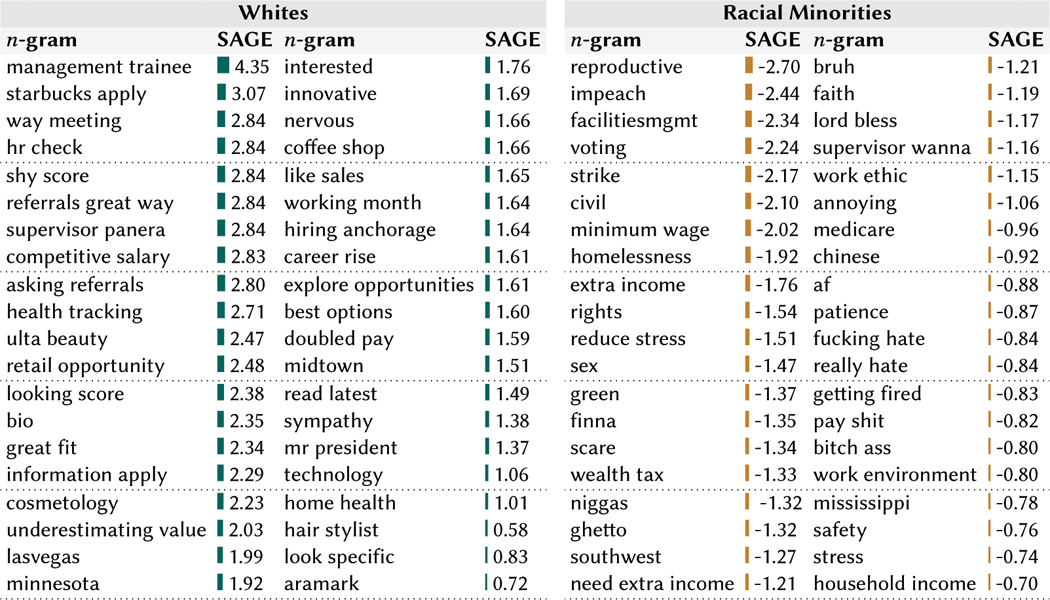
Table 9 shows the salient n-grams used by racial majorities (Whites) and minorities (other races) in the U.S. workforce. Here, a positive SAGE score represents a greater (and more distinctive) presence in the posts by Whites, whereas a negative score represents a greater presence in the posts by racial minority groups. We find that the salient keywords used by Whites are dominated by career opportunities and growth (referrals, career rise, doubled pay, competitive salary) and organizational positions (management trainee, retail opportunity, hiring). On the other hand, salient keywords used by racial minorities include basic needs (homelessness, medicare, household income), and rights (voting, strike, civil, wealth tax). We also find that the keywords used by racial minorities share commonalities with that used by people in high unemployment states (Table 7), which is plausibly due to the correlation between socio-economic status and racial distribution in the U.S. [6].
Table 9.
Top salient n-grams (n=1.2,3) in job satisfaction posts across racial groups (SAGE [49]).
|
The relatively disadvantaged status of racial minorities in the U.S. is reflected in more posts about basic rights and needing extra income. This is evident in posts such as, “niggas not like it when $15 minimum wage and milk cost $38/g” and “the minimum wage spoiled me coz I just been looking for a side job until I secure my full time and this is the ghetto”. In contrast, keywords related to interests and career largely occur in posts by Whites, e.g., “I tripled my income by leaving my job, my family legacy is to financially be in the position for the worthy. They need to be intellectual, passionate, innovative and, resourceful!”. These observations align with prior work that found Black workers attach more value to wage and job security, whereas White workers attach more value to intrinsically satisfying aspects of work [131].
8. DISCUSSION
8.1. Theoretical Implications
Social Media: A New Lens for Understanding Labor Economics and Worker Wellbeing.
This study assesses job satisfaction and examines its demographic disparities via a previously unexplored, inexpensive, and unobtrusive data source, social media data. Because social media data consists of people’s self-initiated and candid self-expressions, this data provides us with a new and rich lens to examine critical questions of labor economics and helps us understand worker wellbeing beyond traditional mechanisms — survey instruments have been criticized as representing a biased and overly simplistic view of reality, and they often fail to provide an accurate assessment of the position of minorities in connection to the topic of interest [115]. The large-scale availability of public social media data provides opportunities to understand population-level worker wellbeing constructs over space, time, and demographic groups, both retrospectively and prospectively.
Job Satisfaction as a Theoretical Construct, Dissected by Demographics, Facets, and Language.
Summarily, this study opens up interest in conceptualizing job satisfaction as a theoretical construct and identifying its correlates. Weiss noted job satisfaction might be impacted by the differences in belief, even among those with similar roles, responsibilities, and working conditions [148]. Indeed, different frames of reference for what makes satisfactory job conditions and rewards may drive many demographic differences in job satisfaction observed in the literature [29]. Leveraging social media self-expressions helps us to gauge the values and expectations of different demographic groups. In particular, by examining the linguistic differences in perceived job satisfaction, we observe how the minorities in the workforce largely express concerns related to needs and survival, whereas the majority group’s concerns are driven at self-actualization and career growth.
Our work illustrates the importance of studying facet-level job satisfaction rather than overall job satisfaction. We make distinct observations for different facets: pay and supervision satisfaction. Essentially, our findings indicate that different facets of job satisfaction have different causes and consequences. For example, when examining geographic differences in job satisfaction, some of our observations are intuitive and well-aligned with the literature. This includes the finding that perceived pay satisfaction (on Twitter) positively correlates with financial wellbeing and family income [109]. At the same time, we also find that higher family income does not necessarily translate to greater supervision satisfaction.
Similarly, for sex, we notice contrasting trends of satisfaction between pay and supervision, i.e., females are more likely to express positively about pay, but negatively about supervision than males on social media. Therefore, facet-wise examination of job satisfaction also provides newer insights regarding the job satisfaction paradox (discussed below). By drilling into the linguistic differences across demographic groups, our study disambiguates the concerns of disadvantaged groups. For example, females saliently use “toxic workplace”, and racial-minorities or those in high-unemployment regions use words corresponding to basic livelihood and survival needs, such as “homelessness” and “household income”.
Notably, many of the effects we observed were small in terms of Cohen’s d; however, we argue this does not diminish the impact or meaningfulness of our findings. First, we would not expect the differences to be large, given that no work has clearly revealed one demographic group to have systematically superior job satisfaction to another across occupations and contexts (e.g., see [13] for a recent meta-analysis and [138] for a representative survey analysis). Second, small effects that occur persistently across the duration of one’s career and that simultaneously affect millions of people can generate large practical effects considering the pervasiveness of work and the importance of job satisfaction for wellbeing. For example, a Cohen’s 𝑑 of 0.06 (the effect size describing the difference between male and female supervision satisfaction in our work) indicates that approximately 54% of the lower scoring group have job satisfaction below the mean of the higher scoring group [102]. Considering there are approximately 120 million full-time employees in the U.S. [16], this could translate into supervision dissatisfaction for millions of females. In other words, small effects like those observed here illustrate pervasive and widespread practical effects both in terms of generating these differences and in impacting demographic groups disadvantaged by the societal barriers and structures that give rise to such differences.
Job Satisfaction Paradox and Demographic Disparities.
Although studies have found that minorities’ jobs are often “worse” in terms of pay, hiring and firing, promotion opportunities, representation, harassment, and so on, they tend to report favorably in job satisfaction surveys [27]. This is known as the job satisfaction paradox [27, 135], as introduced earlier in the paper. Researchers have been unable to delineate the effect of self-desirability and response bias in these findings. Further, many studies cannot distinguish if this effect is due to minorities’ (e.g., women’s) low expectations or majorities’ (e.g., men’s) high expectations, and if self-selection bias may cause “happier” minorities (e.g., women) to participate in job satisfaction surveys [27]. Our work can be considered as complementary information to illuminate the underpinnings of this paradox: by leveraging social media data, this work not only examines the demographic differences of job satisfaction, but also uncovers how these differences may change when examined per facet (in Aim 2), as well as the priorities and concerns that affect the demographic groups differently (in Aim 3).
We find that, despite the strengths of social media in overcoming typical biases of self-reported surveys, the (job satisfaction) paradox is also observable in social media expressions. This suggests that frame of reference effects and differences in priorities and expectations, not necessarily survey measurement biases, contribute to this paradox [28, 84, 90]. Comprehensive models of satisfaction drawn from equity theory, social comparison, and discrepancy theory, suggest that pay satisfaction is determined by the difference in what one receives against what one thinks they should receive [45, 69, 93]. Accordingly, we could hypothesize that historically under-represented demographic groups in workforce have lower expectation or majorities have greater expectation, either or both of which would result in greater perceived job satisfaction among minorities.
Prior work explains job satisfaction based on relative individual expectations, priorities, and values [27, 90]. These factors could explain greater satisfaction for racial minorities than Whites, and greater pay satisfaction for females than males. For instance, for the same job, women’s expectations are argued to be lower than men [27]. The priorities that drive the perception of job satisfaction can widely vary – women are known to value intrinsic aspects of work, whereas men prioritize the extrinsic aspects of work (such as pay and promotion) [27, 108]. Clark noted that the gender differential in perceived job satisfaction might eventually disappear as women continue to gain equality at work. However, our study reveals that such differential still exists, i.e., perceived job satisfaction (for pay) on social media is higher for historically disadvantaged groups. We provide support for other recent findings in CSCW that women “still ask for less” at work [52].
Person-Centric Approaches in Organizational Science.
Together, our study shows that specific factors drive the above noted demographic differences in perceived job satisfaction (Aim 3). This aligns with person-centric approaches in organizational science [38, 153], where the goal is to understand the distinct experiences of workers. Essentially, our insights can facilitate not only a deeper understanding on the causes of job satisfaction or dissatisfaction for specific demographic groups, but can also enable the specific design of work for different individuals to promote higher wellbeing; for example, addressing the issue of toxicity in the workplace for women, or addressing issues of pay and basic livelihood for racial-minorities. Further, our work can inspire re-designing existing worker wellbeing questionnaires in organizational science, to capture differences of individual, contextual, and societal characteristics. These approaches will help elicit underlying disparities in worker needs and values, and accordingly make us rethink the ways with which we can address concerns such as sex and race inequity in workforce.
8.2. Practical and Technological Implications
Proactive, Granular, Scalable Assessment Tools for Worker Wellbeing.
Despite evidence of pay gaps and social disparities in workplaces, it is often difficult to assess or even realize such differences at finer granularities, as also noted in Section 2. This could be due to several factors, including habituation and the lack of empirical evidence suggesting otherwise. To this end, our work reveals social, demographic, and spatio-temporal indicators of worker wellbeing along with facet-wise quantifiable differences. These can be valuable insights for organizations and stakeholders, allowing a richer and nuanced understanding of job satisfaction. Our work can help build tools that quantify and capture job satisfaction (and similar worker wellbeing constructs) on a continuous and real-time basis, across and within organizations, job sectors, and employer types [37]. These tools can help identify the (often) unknown causes of employee dissatisfaction. In this way, our work advances the vision proposed in prior work on gauging employee affect and social pulse [40, 130], and using these insights to build dashboards for human resource and personnel management. Such dashboards can help guide interventions to support and empower under-represented groups with strategies that enhance their wellbeing, such as encouraging an inclusive organizational culture, and making employees feel more welcomed and intrinsically motivated at work.
Supporting Worker Rights Advocacy.
Our work bears implications for labor organizations and other stakeholders engaging in worker rights advocacy. These stakeholders can gather a more nuanced understanding of perceptions of employee satisfaction by leveraging this paper’s approaches, and by drawing upon participatory design and feminist approaches [10] to ensure individuals’ lived experiences can complement assessments made from large-scale (social media) data. In turn, this can help to develop more long-term and robust solutions of employee concerns, such as employee-aligned incentive mechanisms and efforts to enforce a more “employee-first” culture as the primary driver of organizational performance, rather than a “shareholder-first” or “profit-first” culture. In essence, our work can inspire advocacy for organizational strategies that seek to minimize demographic biases in workplaces [68], and also value diversity and pluralism by acknowledging and understanding the distinctive needs of different individuals and groups.
8.3. Ethical, Policy, and Social Implications
Traditionally, job satisfaction has been viewed as a holistic measure for understanding the quality of work for individuals and collectives based on demographics, work sectors, and salary brackets [3, 149]. Job satisfaction is also used as an indicator of the progress and development of socio-geographic demographics [137, 138]. Our work reveals that existing summative, parsimonious measurements may not normalize across individuals and groups. As we strive for equitable workplaces, it is essential to focus on addressing disproportionate satisfaction across demographics.
While one could argue that “satisfaction” is the most critical aspect, we argue that “fairness” and “equity” components cannot be ignored at work — attributes that are frequently not captured in existing job satisfaction assessment tools. Although our measure of job satisfaction also does not quantify fairness and equity directly, our findings support arguments that a worker should be paid a salary that they deserve, and not just what they are satisfied with. This is because, as our results show, satisfaction is a function of people’s expectation. These differing expectations are, in turn, confounded by historical and societal factors, in addition to people’s self-evaluation of their ability and effort at work (e.g., women expect lesser than men for similar jobs [52]). Again, while the issue of unequal pay needs to be addressed, it is also impertinent to encourage equal expectations of pay. However, these considerations raise questions surrounding who should decide and ensure fairness and equity across workers, seeking to curb existing demographic disparities. We suggest that employee rights protection agencies and law-making bodies can prepare guidelines for auditing worker wellbeing beyond pay-related satisfaction, by accounting for the hitherto unaccounted for underpinnings of demography, as could be revealed by the approach in this paper.
We also hope our work will provide data-driven insights for informed policy decisions and aid in prioritizing wellbeing interventions within and across demographics, as highlighted to be a significant need by Danis et al. [36]. By accounting for people’s voices (as naturalistically expressed on social media), our work motivates employee autonomy and more employee-facing approaches by organizations and stakeholders. However, we do recognize that highlighting worker concerns stratified by demography may reinforce some of the existing sex- and race-based stereotypes and stereotype-based biases [68]. For example, prior work has highlighted that studies which suggest “poor but happy” kind of results might lead to increased support for the status quo, and undermine efforts to mitigate disparities at work [87]. To this end, we recognize that our analyses could be misused for selective and non-inclusive recruiting in organizations. We, therefore, suggest caution in how our findings are interpreted and our algorithms are potentially deployed.
We additionally note some ethical implications from a methodology perspective. Our work uses social media data curated over demographic groups for which we relied on methodologies proposed in prior work [41, 105]. However, we do realize that these approaches for demographic attribute inference have limitations. We reiterate (from Section 1) that sex and race are complex constructs, and the considered groups in our work are not exhaustive. Our work suffers from concerns raised by Schlesinger et al. in HCI research: considering only majorly represented groups may normalize them, and not considering minor-represented groups may marginalize them [127]. This paper shows the feasibility of studying demographic disparities in perceived job satisfaction, and is a step towards uncovering related challenges posed to demographic groups who have historically been discriminated against in the society at large, and the workforce in particular. Future work could adapt our methodology to look at more nuanced conceptualizations of the sex and race constructs.
From a methodology perspective, we further recognize the ethical complexities associated with automatically inferring people’s work experiences. There are lingering questions about the circumstances under which such inferences should be made, and, what should be our best practices. These questions are particularly salient because many people appropriate social media for candid self-disclosures [126], in this case, around their sometimes deeply personal workplace experiences. While our algorithms rely on public social media data whose (de-identified) analysis does not require informed consent according to ethics boards’ guidelines, we recognize the possibility of some expectation mismatches between social media users’ own conceptualization of their data and inferences on their data without their consent [51]. The factors that motivate people’s use of social media and enable their candid self-disclosure may be confounded with their perceptions of being monitored. Moreover, people may have reservations as to who uses these algorithms — they may not be comfortable having employers access their social media activity, as it can raise questions surrounding workplace surveillance [55]. In fact, if these algorithms are put into place unscrupulously, some people may start “gaming the system” by posting artificial job satisfaction expressions to get better pay, similar to manipulations of reviews on customer satisfaction [96].
These above factors and their potential risks and benefits need to be carefully evaluated before algorithms making inferences about offline critical outcomes (here job and workplace wellbeing) using online data, are used in practice. Finally, we note that despite their limitations, survey-based methodologies have certain advantages that other sources of data cannot capture. Therefore, our work is not to be interpreted as a substitute for surveys, and it primarily targets to provide complementary information and to address some limitations of current assessment methodologies.
8.4. Limitations and Future Directions
As mentioned earlier, many existing survey instruments are noted for their inability to adequately represent the voices of minorities [30, 117]. While social media, due to their wide adoption [58], may overcome this issue, it also presents other challenges as a data source [113]. Prior work has highlighted the biases of social media studies in terms of population and demographic representation [80, 121], and our work is no exception. Audience design and context collapse issues on social media [15, 100] might not minimize the prevailing stigma associated with minority sex and race, thereby deterring them from expressing freely and publicly on such platforms. These choices may in turn lead to biases in the manner in which we measure their perceived job satisfaction.
Given that our work assesses differences in job satisfaction at state-level only, it would be interesting to note how the differences vary as per social media in finer detail, such as county- and metropolitan- or urban vs. rural demographics. We acknowledge that minority status does not explain job satisfaction alone, and several other factors influence perceived job satisfaction of a person. To name a few, these factors include quality and complexity of work, socio-economic status, educational level, and intrinsic traits. Future longitudinal studies may be able to examine how people’s life experiences are associated with their job satisfaction expressions.
On a related note, we recognize that social media data is not immune to additional biases such as self-selection and self-censorship [142]. Our work can only capture voices of those who express on social media, or even broadly those who are on social media. In fact, there is already a digital divide in social media use, where the population is skewed towards young adults and people in white-collar jobs [25]. Some of the constraints that inhibit candid self-expressions offline may also be applicable to social media, e.g., people may not be comfortable about sharing their workplace experiences online due to privacy concerns or surveillance by current and potential employers. We also note there is digital inequity with respect to the use of social media data — certain regions and groups are socio-economically disadvantaged and may not be well representative on the social media data considered. Again, we acknowledge that despite adopting normalization strategies and conducting statistical significance tests, small sample sizes in certain states or populations (in our study) may incorporate unobserved biases. Future work can address some of these challenges by recruiting large, representative samples of social media users. Similarly, a single platform cannot provide a complete picture; different platforms (such as Facebook, Reddit, Twitter, instant messaging services) have unique design strengths and weaknesses, both in terms of their respective norms and affordances, as well as who uses them.
Finally, although our data spans a long-term retrospective period, we cannot make nowcasting or causal claims. Future work can explore related problems of worker wellbeing using cross-platform data. Our work lays the foundation for future research which can draw on critical race and feminist theories [10, 112], to study societal and structural factors driving the causes and consequences of workplace perceptions across demographics and characteristics such as age, gender identity, sexual orientation, economic status, social class, age, religious affiliation, nationality, and ability status.
9. CONCLUSION
This paper leveraged social media data to assess job satisfaction at the population-level in a scalable manner, and then examined demographic differences in perceived job satisfaction by geography, sex, and race. We assessed two facets of job satisfaction, pay and supervision satisfaction using Twitter data. First, we used a theory-driven annotation approach to build our training data, and then, developed machine learning classifiers that identified perceived job satisfaction with an average AUC of 0.84. With respect to demographics, for geography, we examined the relationship of our measure of perceived job satisfaction with state-level macroeconomic measures in the U.S., finding construct validity in our measurement. With respect to sex and race, we found contrasting associations for both pay and supervision satisfaction, e.g., females expressed greater pay satisfaction but lower supervision satisfaction. Finally, we found that social media language explained demographic differences in underlying priorities and needs of these groups. For instance, the concerns of under-represented groups largely centered around basic livelihood and alternate income sources, whereas those of historically privileged groups consisted of self-actualization and professional growth. Our work contributes to improving our understanding of workplace wellbeing broadly, and demographic differences in particular.
CCS Concepts:
• Human-centered computing → Empirical studies in collaborative and social computing; Social media; • Applied computing → Psychology.
ACKNOWLEDGMENTS
This research is partly supported by a gift from Mozilla (RK677) to De Choudhury. We thank Madison Syvester, Samuel Carroll, Amel Chekili, Mya Findley, Qunishia Carter, Caroline Mello, Michael Clark for building the annotated job satisfaction dataset. We thank Andrea Hu, Dong Whi Yoo, Sindhu Ernala, Sachin Pendse, Vedant Das Swain, and Qiaosi Wang for their help and feedback.
Permission to make digital or hard copies of all or part of this work for personal or classroom use is granted without fee provided that copies are not made or distributed for profit or commercial advantage and that copies bear this notice and the full citation on the first page. Copyrights for components of this work owned by others than ACM must be honored. Abstracting with credit is permitted. To copy otherwise, or republish, to post on servers or to redistribute to lists, requires prior specific permission and/or a fee. Request permissions from permissions@acm.org.
A. APPENDIX
A.1. Labeling Geographic Location in Twitter Posts
Drawing on prior work, we adopt a two-step approach [41, 57, 105] to label a post with a geographic location. First, if the post is already geo-coded, then we directly use the the coordinates for reverse geo-encoding to obtain the state and country of the user. Second, in cases where the posts are not geo-coded, we look for location in the user’s self-described location and description field. These locations can either be in natural language form (name of city, state, country) or in geo-coordinate form. We use standard automated approaches of reverse geo-mapping from a given location name [105]. Following this, two coauthors manually browsed through each of these labeled and unlabeled user locations, and they corrected and modified any mis-classifications, with an agreement of 98.8%, resolving disagreements with mutual discussions.
By limiting our study to U.S.-only posts, we label the location (U.S. state) of 21,506 pay-related posts and 32,335 supervision-related posts by unique individual usernames. Figure 4a summarizes the distribution of Twitter posts by states in the contiguous U.S. We observe a higher density of posts from California and Texas. We find a significant correlation (Pearson’s r =0.97) between the number of posts per state and the population of the respective state. In addition, we compare the state-wise occurrences of posts and state-wise penetration of Twitter as per survey normalized with U.S. Census Bureau data [2], to find a significant correlation (Pearson’s r =0.72). These correlation tests show weak location-wise representation of real-world and social media population.
A.2. Labeling Sex and Race in Twitter Posts
To label sex and race of the individuals who posted job satisfaction related posts, we again adopt a two-step approach. Because Twitter does not necessarily provide sex and race information, we inferred sex and race using the following two-step techniques, inspired by prior work in computational social science and social computing [34, 41, 53, 66, 105, 151].
First, we compare the names of individuals against the database of names since 1880, as reported by the U.S. Social Security Administration and the database of names per the 2010 U.S. census data [105]. We use these lists to match first names with the most probable sex, and last names with the most probable race. This step helps us label 60% names with sex, and 40% names with race. We note that this approach allows us to label only binary sexes of male and female, and four races in the U.S., White, Black, Hispanic, and APIs.
Second, two coauthors manually browsed through the description field of the remaining users, looking for mentions of sex or race. We used explicit self-reports of sex or race in the description. In addition, if the user self-describes themselves as a mother or wife (with keywords such as mom, mother, wife, etc.), or as a father or husband (keywords such as husband, father, dad), we assign their gender as female and male respectively. The annotators agree in 97.1% cases, and like before resolve disagreements with mutual discussions.
Finally, we label our dataset with sex of 49,426 individual usernames (Fig. 4b) and race of 31,195 individual usernames (Fig. 4c).
Contributor Information
KOUSTUV SAHA, Georgia Institute of Technology, USA.
ASRA YOUSUF, Georgia Institute of Technology, USA.
LOUIS HICKMAN, Purdue University, USA.
PRANSHU GUPTA, Georgia Institute of Technology, USA.
LOUIS TAY, Purdue University, USA.
MUNMUN DE CHOUDHURY, Georgia Institute of Technology, USA.
REFERENCES
- [1].2018. Census Data and API Identities. https://www.api-gbv.org/resources/census-data-api-identities/
- [2].2018. Twitter Ranking: Which States Twitter the Most? allbusiness.com/twitter-ranking-which-states-twitter-the-most-12329567-1.html
- [3].Agho Augustine O, Mueller Charles W, and Price James L. 1993. Determinants of employee job satisfaction: An empirical test of a causal model. Human relations 46, 8 (1993), 1007–1027. [Google Scholar]
- [4].Akerlof George A, Rose Andrew K, Yellen Janet L, Ball Laurence, and Hall Robert E. 1988. Job switching and job satisfaction in the US labor market. Brookings papers on economic activity 1988, 2 (1988), 495–594. [Google Scholar]
- [5].American Educational Research Association, American Psychological Association, National Council on Measurement in Education, Joint Committee on Standards for Educational, and Psychological Testing (US). 1999. Standards for educational and psychological testing. Amer Educational Research Assn. [Google Scholar]
- [6].American Psychology Association et al. 2016. Ethnic and racial minorities & socioeconomic status. [Google Scholar]
- [7].Aziri Brikend. 2011. Job Satisfaction: A Literature Review. Management Research & Practice 3, 4 (2011). [Google Scholar]
- [8].Baldauf Artur, Reisinger Heribert, and Moncrief William C. 1999. Examining motivations to refuse in industrial mail surveys. Journal of the Market Research Society 41, 3 (1999), 345–354. [Google Scholar]
- [9].Balzer William K, Smith Patricia Cain, and Kravitz David A. 1990. User’s manual for the Job Descriptive Index (JDI) and the Job in General (JIG) scales. Department of Psychology, Bowling Green State University. [Google Scholar]
- [10].Bardzell Shaowen. 2010. Feminist HCI: taking stock and outlining an agenda for design. In Proceedings of the SIGCHI conference on human factors in computing systems. 1301–1310. [Google Scholar]
- [11].Bartel Ann P. 1981. Race differences in job satisfaction: A reappraisal. The Journal of Human Resources (1981). [Google Scholar]
- [12].Baruch Yehuda and Holtom Brooks C. 2008. Survey response rate levels and trends in organizational research. Human relations 61, 8 (2008), 1139–1160. [Google Scholar]
- [13].Batz-Barbarich Cassondra, Tay Louis, Kuykendall Lauren, and Cheung Ho Kwan. 2018. A meta-analysis of gender differences in subjective well-being: estimating effect sizes and associations with gender inequality. Psychological Science 29, 9 (2018), 1491–1503. [DOI] [PubMed] [Google Scholar]
- [14].Bedeian Arthur G, Burke Beverly G, and Moffett Richard G. 1988. Outcomes of work-family conflict among married male and female professionals. Journal of management 14, 3 (1988), 475–491. [Google Scholar]
- [15].Bernstein Michael S, Bakshy Eytan, Burke Moira, and Karrer Brian. 2013. Quantifying the invisible audience in social networks. In Proceedings of the SIGCHI conference on human factors in computing systems. ACM, 21–30. [Google Scholar]
- [16].BLS. 2020. U.S. Bureau of Labor Statistics. https://www.bls.gov//
- [17].Bogg Janet and Cooper Cary. 1995. Job satisfaction, mental health, and occupational stress among senior civil servants. Human relations 48, 3 (1995), 327–341. [Google Scholar]
- [18].Brief Arthur P. 1998. Attitudes in and around organizations. Vol. 9. Sage. [Google Scholar]
- [19].Brown Donna and McIntosh Steven. 1998. If you’re happy and you know it... job satisfaction in the low wage service sector. Number 405. Centre for Economic Performance, London: School of Economics and Political; .... [Google Scholar]
- [20].US Census Bureau. 2017. Annual Social and Economic Supplement of the Current Population Survey (CPS). (2017). [DOI] [PMC free article] [PubMed] [Google Scholar]
- [21].Burke Michael J, Brief Arthur P, George Jennifer M, Roberson Loriann, and Webster Jane. 1989. Measuring affect at work: confirmatory analyses of competing mood structures with conceptual linkage to cortical regulatory systems. Journal of personality and social psychology 57, 6 (1989), 1091. [DOI] [PubMed] [Google Scholar]
- [22].Cahill Kevin E, McNamara Tay K, Pitt-Catsouphes Marcie, and Valcour Monique. 2015. Linking shifts in the national economy with changes in job satisfaction, employee engagement and work–life balance. J. Behav. Exp. Econ. (2015). [Google Scholar]
- [23].Carraher Shawn Mand Buckley M Ronald. 1996. Cognitive complexity and the perceived dimensionality of pay satisfaction. Journal of Applied Psychology 81, 1 (1996), 102. [Google Scholar]
- [24].Carsten Jeanne Mand Spector Paul E. 1987. Unemployment, job satisfaction, and employee turnover: A meta-analytic test of the Muchinsky model. Journal of applied psychology 72, 3 (1987), 374. [Google Scholar]
- [25].Pew Research Center. 2016. The state of American jobs. [Google Scholar]
- [26].Chancellor Stevie and Counts Scott. 2018. Measuring Employment Demand Using Internet Search Data. In Proc. CHI. [Google Scholar]
- [27].Clark Andrew E. 1996. Job satisfaction in Britain. British journal of industrial relations 34, 2 (1996), 189–217. [Google Scholar]
- [28].Clark Andrew E. 1997. Job satisfaction and gender: why are women so happy at work? Labour economics (1997). [Google Scholar]
- [29].Clark Andrew Eand Oswald Andrew J. 1996. Satisfaction and comparison income. Journal of public economics (1996). [Google Scholar]
- [30].Connelly Roxanne, Gayle Vernon, and Lambert Paul S. 2016. Ethnicity and ethnic group measures in social survey research. Methodological Innovations 9 (2016), 2059799116642885. [Google Scholar]
- [31].Connolly James J and Viswesvaran Chockalingam. 2000. The role of affectivity in job satisfaction: A meta-analysis. Personality and individual differences 29, 2 (2000), 265–281. [Google Scholar]
- [32].Conway Mike and O’Connor Daniel. 2016. Social media, big data, and mental health: current advances and ethical implications. Current opinion in psychology 9 (2016), 77–82. [DOI] [PMC free article] [PubMed] [Google Scholar]
- [33].Robert Costanza, Brendan Fisher, Saleem Ali, Caroline Beer, Lynne Bond, Roelof Boumans, Danigelis Nicholas L Jennifer Dickinson, Carolyn Elliott, Joshua Farley, et al. 2007. Quality of life: An approach integrating opportunities, human needs, and subjective well-being. Ecological economics 61, 2–3 (2007), 267–276. [Google Scholar]
- [34].Culotta Aron, Nirmal Ravi Kumar, and Jennifer Cutler. 2015. Predicting the Demographics of Twitter Users from Website Traffic Data.. In AAAI, Vol. 15. Austin, TX, 72–8. [Google Scholar]
- [35].Currall Steven C, Towler Annette J, Judge Timothy A, and Kohn Laura. 2005. Pay satisfaction and organizational outcomes. Personnel psychology 58, 3 (2005), 613–640. [Google Scholar]
- [36].Danis DR Marion, Kotwani MS Namrata, Garrett DR Joanne, Rivera MS Ivonne, Davies-Cole DR John, and Carter-Nolan DR Pamela. 2010. Priorities of low-income urban residents for interventions to address the socio-economic determinants of health. Journal of health care for the poor and underserved 21, 4 (2010), 1318. [DOI] [PMC free article] [PubMed] [Google Scholar]
- [37].Das Swain Vedant, Saha Koustuv, Abowd Gregory D, and De Choudhury Munmun. 2020. Social Media and Ubiquitous Technologies for Remote Worker Wellbeing and Productivity in a Post-Pandemic World. In Proceedings of 2020 IEEE 2nd International Conference on Cognitive Machine Intelligence (CogMI). [Google Scholar]
- [38].Das Swain Vedant, Saha Koustuv, Rajvanshy Hemang, Sirigiri Anusha, Gregg Julie M, Lin Suwen, Martinez Gonzalo J, Mattingly Stephen M, Mirjafari Shayan, Mulukutla Raghu, et al. 2019. A Multisensor Person-Centered Approach to Understand the Role of Daily Activities in Job Performance with Organizational Personas. Proc. IMWUT (2019). [Google Scholar]
- [39].Das Swain Vedant, Saha Koustuv, Reddy Manikanta D, Rajvanshy Hemang, Abowd Gregory D, and De Choudhury Munmun. 2020. Modeling Organizational Culture with Workplace Experiences Shared on Glassdoor. In Proceedings of the 2020 CHI Conference on Human Factors in Computing Systems. [Google Scholar]
- [40].De Choudhury Munmunand Counts Scott. 2013. Understanding affect in the workplace via social media. In Proc. CSCW. [Google Scholar]
- [41].De Choudhury Munmun, Sharma Sanket S, Logar Tomaz, Eekhout Wouter, and Nielsen René Clausen. 2017. Gender and cross-cultural differences in social media disclosures of mental illness. In Proc. CSCW. [Google Scholar]
- [42].De Neve Jan-Emmanuel, Diener Ed, Tay Louis, and Xuereb Cody. 2013. The objective benefits of subjective well-being. World happiness report (2013). [Google Scholar]
- [43].Diener Ed and Seligman Martin EP. 2004. Beyond money: Toward an economy of well-being. Psychological science in the public interest 5, 1 (2004), 1–31. [DOI] [PubMed] [Google Scholar]
- [44].DiMicco Joan, Millen David R, Geyer Werner, Dugan Casey, Brownholtz Beth, and Muller Michael. 2008. Motivations for social networking at work. In Proc. CSCW. [Google Scholar]
- [45].Dreher George F. 1980. Salary satisfaction and community costs. Industrial Relations: A Journal of Economy and Society (1980), 340–344. [Google Scholar]
- [46].Eagly Alice Hand Koenig Anne M. 2006. Social Role Theory of Sex Differences and Similarities: Implication for Prosocial Behavior. Lawrence Erlbaum Associates Publishers. [Google Scholar]
- [47].Eberhardt Bruce J and Shani Abraham B. 1984. The effects of full-time versus part-time employment status on attitudes toward specific organizational characteristics and overall job satisfaction. Academy of Management Journal 27, 4 (1984), 893–900. [PubMed] [Google Scholar]
- [48].Ehrlich Kate and Shami N Sadat. 2010. Microblogging inside and outside the workplace. In ICWSM. [Google Scholar]
- [49].Eisenstein Jacob, Ahmed Amr, and Xing Eric P. 2011. Sparse additive generative models of text. (2011). [Google Scholar]
- [50].Ernala Sindhu Kiranmai, Labetoulle Tristan, Bane Fred, Birnbaum Michael L, Rizvi Asra F, Kane John M, and De Choudhury Munmun. 2018. Characterizing audience engagement and assessing its impact on social media disclosures of mental illnesses. In ICWSM. [Google Scholar]
- [51].Fiesler Casey and Proferes Nicholas. 2018. “Participant” perceptions of Twitter research ethics. Social Media+ Society (2018). [Google Scholar]
- [52].Foong Eureka, Vincent Nicholas, Hecht Brent, and Gerber Elizabeth M. 2018. Women (still) ask for less: Gender differences in hourly rate in an online labor marketplace. PACM HCI CSCW (2018). [Google Scholar]
- [53].Ford Denae, Harkins Alisse, and Parnin Chris. 2017. Someone like me: How does peer parity influence participation of women on stack overflow?. In 2017 IEEE symposium on visual languages and human-centric computing (VL/HCC). [Google Scholar]
- [54].Gavin Jand Ewen R. 1974. Racial differences in job attitudes and performance: Some theoretical considerations and empirical findings. Personnel Psychology (1974). [Google Scholar]
- [55].Ghoshray Saby. 2013. Employer surveillance versus employee privacy: The new reality of social media and workplace privacy. N. Ky. L. Rev. 40 (2013), 593. [Google Scholar]
- [56].Golder Scott Aand Macy Michael W. 2011. Diurnal and seasonal mood vary with work, sleep, and daylength across diverse cultures. Science 333, 6051 (2011), 1878–1881. [DOI] [PubMed] [Google Scholar]
- [57].Graham Mark, Hale Scott A, and Gaffney Devin. 2014. Where in the world are you? Geolocation and language identification in Twitter. The Professional Geographer 66, 4 (2014), 568–578. [Google Scholar]
- [58].Greenwood Shannon, Perrin Andrew, and Duggan Maeve. 2016. Demographics of Social Media Users in 2016. pewinternet.org/2016/11/11/social-media-update-2016/. Accessed: 2017-02-12. [Google Scholar]
- [59].Guerrero Laura and Posthuma Richard A. 2014. Perceptions and behaviors of Hispanic workers: a review. Journal of Managerial Psychology 29, 6 (2014), 616–643. [Google Scholar]
- [60].Guy Ido, Ronen Inbal, Zwerdling Naama, Zuyev-Grabovitch Irena, and Jacovi Michal. 2016. What is Your Organization ‘Like’?: A Study of Liking Activity in the Enterprise. In Proc. CHI. [Google Scholar]
- [61].Hackman J Richardand Oldham Greg R. 1975. Development of the job diagnostic survey. J. Appl. Psychol. (1975). [Google Scholar]
- [62].Hackman J Richard and Oldham Greg R. 1976. Motivation through the design of work: Test of a theory. Organizational behavior and human performance 16, 2 (1976), 250–279. [Google Scholar]
- [63].Hagedorn Linda Serra. 2000. Conceptualizing faculty job satisfaction: Components, theories, and outcomes. New directions for institutional research 2000, 105 (2000), 5–20. [Google Scholar]
- [64].Hanisch Kathy A. 1992. The Job Descriptive Index revisited: Questions about the question mark. Journal of Applied psychology 77, 3 (1992), 377. [Google Scholar]
- [65].Hanna Brittany, Kee Kerk F, and Robertson Brett W. 2017. Positive impacts of social media at work: Job satisfaction, job calling, and Facebook use among co-workers. In SHS web of conferences, Vol. 33. EDP Sciences, 00012. [Google Scholar]
- [66].Hannák Anikó, Wagner Claudia, Garcia David, Mislove Alan, Strohmaier Markus, and Wilson Christo. 2017. Bias in online freelance marketplaces: Evidence from taskrabbit and fiverr. In Proc. CSCW. [Google Scholar]
- [67].Harter James K, Schmidt Frank L, Killham Emily A, and Agrawal Sangeeta. 2009. Q12 meta-analysis: The relationship between engagement at work and organizational outcomes. Omaha, NE: Gallup; (2009). [Google Scholar]
- [68].Heilman Madeline E. 2012. Gender stereotypes and workplace bias. Research in organizational Behavior (2012). [Google Scholar]
- [69].Heneman Herbert G IIIand Schwab Donald P. 1985. Pay satisfaction: Its multidimensional nature and measurement. International journal of Psychology 20, 1 (1985), 129–141. [DOI] [PubMed] [Google Scholar]
- [70].Hernandez Ivan, Newman Daniel A, and Jeon Gahyun. 2015. Twitter analysis: Methods for data management and a word count dictionary to measure city-level job satisfaction. In Big Data at Work. Routledge, 78–128. [Google Scholar]
- [71].Hickman Louis, Saha Koustuv, De Choudhury Munmun, and Tay Louis. 2019. Automated tracking of components of job satisfaction via text mining of twitter data. In ML Symposium, SIOP. [Google Scholar]
- [72].Hulin Charles L. 1966. Effects of community characteristics on measures of job satisfaction. Journal of Applied Psychology 50, 2 (1966), 185. [DOI] [PubMed] [Google Scholar]
- [73].Iaffaldano Michelle Tand Muchinsky Paul M. 1985. Job satisfaction and job performance: A meta-analysis. Psychological bulletin 97, 2 (1985), 251. [Google Scholar]
- [74].Greenberg J. 1990. Yesterday, Today, and Tomorrow. Journal of Management 16 (2) (1990), 399–432. [Google Scholar]
- [75].Jacobson Willow Sand Tufts Shannon Howle. 2013. To post or not to post: Employee rights and social media. Review of public personnel administration 33, 1 (2013), 84–107. [Google Scholar]
- [76].Jacovi Michal, Guy Ido, Kremer-Davidson Shiri, Porat Sara, and Aizenbud-Reshef Netta. 2014. The perception of others: inferring reputation from social media in the enterprise. In Proc. CSCW. [Google Scholar]
- [77].Jaidka Kokil, Giorgi Salvatore, Schwartz H Andrew, Kern Margaret L, Ungar Lyle H, and Eichstaedt Johannes C. 2020. Estimating geographic subjective well-being from Twitter: A comparison of dictionary and data-driven language methods. Proceedings of the National Academy of Sciences 117, 19 (2020), 10165–10171. [DOI] [PMC free article] [PubMed] [Google Scholar]
- [78].Jhaver Shagun, Cranshaw Justin, and Counts Scott. 2019. Measuring Professional Skill Development in U.S. Cities Using Internet Search Queries. In ICWSM. [Google Scholar]
- [79].John Ajita, Adamic Lada, Davis Marc, Nack Frank, Shamma David A, and Seligmann Doree D. 2008. The future of online social interactions: what to expect in 2020. In Proc. WWW. [Google Scholar]
- [80].Johnson Isaac, Connor McMahon Johannes Schöning, and Hecht Brent. 2017. The Effect of Population and” Structural” Biases on Social Media-based Algorithms: A Case Study in Geolocation Inference Across the Urban-Rural Spectrum. In Proceedings of the 2017 CHI conference on Human Factors in Computing Systems. 1167–1178. [Google Scholar]
- [81].Jones Allan P, James Lawrence R, Bruni John R, and Sells SB. 1977. Black-white differences in work environment perceptions and job satisfaction and its correlates. Personnel Psychology 30, 1 (1977), 5–16. [Google Scholar]
- [82].Judge Timothy A, Piccolo Ronald F, Podsakoff Nathan P, Shaw John C, and Rich Bruce L. 2010. The relationship between pay and job satisfaction: A meta-analysis of the literature. Journal of Vocational Behavior (2010). [Google Scholar]
- [83].Kahn Robert L, Wolfe Donald M, Quinn Robert P, Snoek J Diedrick, and Rosenthal Robert A. 1964. Organizational stress: Studies in role conflict and ambiguity. (1964). [Google Scholar]
- [84].Kaiser Lutz C. 2007. Gender-job satisfaction differences across Europe: An indicator for labour market modernization. International Journal of Manpower 28, 1 (2007), 75–94. [Google Scholar]
- [85].Kalleberg Arne L. 1977. Work values and job rewards: A theory of job satisfaction. Am. Sociol. Rev (1977). [Google Scholar]
- [86].Kam Chester Chun Sengand Meyer John P. 2015. How careless responding and acquiescence response bias can influence construct dimensionality: The case of job satisfaction. Organizational Research Methods 18, 3 (2015), 512–541. [Google Scholar]
- [87].Kay Aaron C and Jost John T. 2003. Complementary justice: effects of” poor but happy” and” poor but honest” stereotype exemplars on system justification and implicit activation of the justice motive. Journal of personality and social psychology 85, 5 (2003), 823. [DOI] [PubMed] [Google Scholar]
- [88].Kifle Temesgen, Kler Parvinder, and Shankar Sriram. 2014. Are women really that happy at work? Australian evidence on the ‘contented female’. Applied economics 46, 7 (2014), 686–697. [Google Scholar]
- [89].Knight Dee K, Crutsinger Christy, and Kim HaeJung. 2006. The impact of retail work experience, career expectation, and job satisfaction on retail career intention. Clothing and Textiles Research Journal 24, 1 (2006), 1–14. [Google Scholar]
- [90].Koh Chee Wee, Shen Winny, and Lee Tiffany. 2016. Black–white mean differences in job satisfaction: A meta-analysis. Journal of Vocational Behavior 94 (2016), 131–143. [Google Scholar]
- [91].Kuoppala Jaana, Anne Lamminpää Juha Liira, and Vainio Harri. 2008. Leadership, job well-being, and health effects—a systematic review and a meta-analysis. Journal of occupational and environmental medicine 50, 8 (2008). [DOI] [PubMed] [Google Scholar]
- [92].Lankau Melenie Jand Scandura Terri A. 1996. An examination of job attitudes of white, black, and Hispanic nurses in a public hospital. International Journal of Public Administration 19, 3 (1996), 377–398. [Google Scholar]
- [93].Lawler EL. 1971. Pay and organization effectiveness: A psychological view. NY: McGraw Hill; (1971). [Google Scholar]
- [94].Llorente Alejandro, Garcia-Herranz Manuel, Cebrian Manuel, and Moro Esteban. 2015. Social media fingerprints of unemployment. PloS one 10, 5 (2015). [DOI] [PMC free article] [PubMed] [Google Scholar]
- [95].Locke Edwin A. 1969. What is job satisfaction? Organizational behavior and human performance 4, 4 (1969), 309–336. [Google Scholar]
- [96].Luca Michael and Zervas Georgios. 2016. Fake it till you make it: Reputation, competition, and Yelp review fraud. Management Science 62, 12 (2016), 3412–3427. [Google Scholar]
- [97].Maaranen Anna and Tienari Janne. 2020. Social media and hyper-masculine work cultures. Gender, Work & Organization; (2020). [Google Scholar]
- [98].Manning Christopher, Surdeanu Mihai, Bauer John, Finkel Jenny, Bethard Steven, and McClosky David. 2014. The Stanford CoreNLP natural language processing toolkit. In Proc. ACL. [Google Scholar]
- [99].Mark Gloria, Shamsi T Iqbal Mary Czerwinski, Johns Paul, Sano Akane, and Lutchyn Yuliya. 2016. Email duration, batching and self-interruption: Patterns of email use on productivity and stress. In Proc. CHI. [Google Scholar]
- [100].Marwick Alice Eand Boyd Danah. 2011. I tweet honestly, I tweet passionately: Twitter users, context collapse, and the imagined audience. New media & society 13, 1 (2011), 114–133. [Google Scholar]
- [101].McKight Patrick Eand Najab Julius. 2010. Kruskal-wallis test. The corsini encyclopedia of psychology (2010), 1–1. [Google Scholar]
- [102].McLeod SA. 2019. What does effect size tell you. Simply psychology (2019). [Google Scholar]
- [103].Miceli Marcia Pand Mulvey Paul W. 2000. Consequences of satisfaction with pay systems: Two field studies. Industrial Relations: A Journal of Economy and Society 39, 1 (2000), 62–87. [Google Scholar]
- [104].Miller GVF and Travers CJ. 2005. Ethnicity and the experience of work: Job stress and satisfaction of minority ethnic teachers in the UK. International Review of Psychiatry 17, 5 (2005), 317–327. [DOI] [PubMed] [Google Scholar]
- [105].Mislove Alan, Lehmann Sune, Ahn Yong-Yeol, Onnela Jukka-Pekka, and Rosenquist J Niels. 2011. Understanding the demographics of Twitter users. In Fifth international AAAI conference on weblogs and social media. [Google Scholar]
- [106].Mitra Tanushree, Muller Michael, Shami N Sadat, Golestani Abbas, and Masli Mikhil. 2017. Spread of Employee Engagement in a Large Organizational Network: A Longitudinal Analysis. PACM HCI CSCW (2017). [Google Scholar]
- [107].Muller Michael, Shami N Sadat, Guha Shion, Masli Mikhil, Geyer Werner, and Wild Alan. 2016. Influences of peers, friends, and managers on employee engagement. In Proc. GROUP. [Google Scholar]
- [108].Neil Cecily C and Snizek William E. 1987. Work values, job characteristics, and gender. Sociological Perspectives (1987). [Google Scholar]
- [109].Netemeyer Richard G, Warmath Dee, Fernandes Daniel, and Lynch John G Jr. 2018. How am I doing? Perceived financial well-being, its potential antecedents, and its relation to overall well-being. J. Consum. Res. (2018). [Google Scholar]
- [110].Nolan Brian and Marx Ive. 1999. Low pay and household poverty. Technical Report. LIS Working Paper Series. [Google Scholar]
- [111].O’Connor Edward J, Peters Lawrence H, Rudolf Cathy J, and Pooyan Abdullah. 1982. Situational constraints and employee affective reactions: A partial field replication. Group & Organization Studies 7, 4 (1982), 418–428. [Google Scholar]
- [112].Ogbonnaya-Ogburu Ihudiya Finda, Smith Angela DR, To Alexandra, and Toyama Kentaro. 2020. Critical Race Theory for HCI. In Proceedings of the 2020 CHI Conference on Human Factors in Computing Systems. 1–16. [Google Scholar]
- [113].Olteanu Alexandra, Castillo Carlos, Diaz Fernando, and Kiciman Emre. 2019. Social data: Biases, methodological pitfalls, and ethical boundaries. Frontiers in Big Data 2 (2019), 13. [DOI] [PMC free article] [PubMed] [Google Scholar]
- [114].Ostroff Cheri. 1992. The relationship between satisfaction, attitudes, and performance: An organizational level analysis. Journal of applied psychology 77, 6 (1992), 963. [Google Scholar]
- [115].Pedersen Duncan. 1990. Qualitative and quantitative: two styles of viewing the world or two categories of reality? (1990). [Google Scholar]
- [116].Pelsma Dennis M, Richard George V, Harrington Robert G, and Burry Judith M. 1989. The quality of teacher work life survey: A measure of teacher stress and job satisfaction. Meas. Eval. Couns. Dev. (1989). [Google Scholar]
- [117].Perez Caroline Criado. 2019. Invisible Women: Exposing data bias in a world designed for men. Random House. [DOI] [PMC free article] [PubMed] [Google Scholar]
- [118].Probst Tahira M, Sinclair Robert R, Sears Lindsay E, Gailey Nicholas J, Black Kristen Jennings, and Cheung Janelle H. 2018. Economic stress and well-being: Does population health context matter? Journal of Applied Psychology (2018). [DOI] [PubMed] [Google Scholar]
- [119].Rad Ali Mohammed Mosadeghand De Moraes Ailson. 2009. Factors affecting employees’ job satisfaction in public hospitals: Implications for recruitment and retention. Journal of General Management 34, 4 (2009), 51–66. [Google Scholar]
- [120].Robertson Brett Wand Kee Kerk F. 2017. Social media at work: The roles of job satisfaction, employment status, and Facebook use with co-workers. Computers in Human Behavior 70 (2017), 191–196. [Google Scholar]
- [121].Ruths Derek and Pfeffer Jürgen. 2014. Social media for large studies of behavior. Science 346, 6213 (2014), 1063–1064. [DOI] [PubMed] [Google Scholar]
- [122].Saha Koustuv, Bayraktaraglu Ayse Elvan, Campbell Andrew, Chawla Nitesh V, De Choudhury Munmun, DMello Sidney K, Dey Anind K, Gao Ge, Gregg Julie M, Jagannath Krithika, Mark Gloria, Martinez Gonzalo J, Mattingly Stephen M, Moskal Edward, Sirigiri Anusha, Striegel Aaron, and Yoo Dong Whi. 2019. Social Media as a Passive Sensor in Longitudinal Studies of Human Behavior and Wellbeing. In CHI Ext. Abstracts. ACM. [Google Scholar]
- [123].Saha Koustuv and De Choudhury Munmun. 2017. Modeling stress with social media around incidents of gun violence on college campuses. PACM Human-Computer Interaction CSCW (2017). [Google Scholar]
- [124].Saha Koustuv, Kim Sang Chan, Reddy Manikanta D, Carter Albert J, Sharma Eva, Haimson Oliver L, and De Choudhury Munmun. 2019. The language of LGBTQ+ minority stress experiences on social media. PACM HCI CSCW (2019). [DOI] [PMC free article] [PubMed] [Google Scholar]
- [125].Saha Koustuv, Reddy Manikanta D, Mattingly Stephen, Moskal Edward, Sirigiri Anusha, and De Choudhury Munmun. 2019. Libra: On linkedin based role ambiguity and its relationship with wellbeing and job performance. Proceedings of the ACM on Human-Computer Interaction 3, CSCW (2019), 1–30. [Google Scholar]
- [126].Saha Koustuv, Seybolt Jordyn, Mattingly Stephen M, Aledavood Talayeh, Konjeti Chaitanya, Gonzalo J Martinez Ted Grover, Mark Gloria, and De Choudhury Munmun. 2021. What Life Events are Disclosed on Social Media, How, When, and By Whom? Proc. CHI (2021). [Google Scholar]
- [127].Ari Schlesinger W Edwards Keith, and Grinter Rebecca E. 2017. Intersectional HCI: Engaging identity through gender, race, and class. In Proceedings of the 2017 CHI Conference on Human Factors in Computing Systems. 5412–5427. [Google Scholar]
- [128].Schwartz H Andrew, Eichstaedt Johannes C, Kern Margaret L, et al. 2013. Personality, gender, and age in the language of social media: The open-vocabulary approach. PloS one 8, 9 (2013), e73791. [DOI] [PMC free article] [PubMed] [Google Scholar]
- [129].Shami N Sadat, Muller Michael, Pal Aditya, Masli Mikhil, and Geyer Werner. 2015. Inferring employee engagement from social media. In Proceedings of the 33rd Annual ACM Conference on Human Factors in Computing Systems. [Google Scholar]
- [130].Shami N Sadat, Yang Jiang, Panc Laura, Dugan Casey, Ratchford Tristan, Rasmussen Jamie C, Assogba Yannick M, Steier Tal, Soule Todd, Lupushor Stela, et al. 2014. Understanding employee social media chatter with enterprise social pulse. In Proceedings of the 17th ACM conference on Computer supported cooperative work & social computing. [Google Scholar]
- [131].Shapiro E Gary. 1977. Racial differences in the value of job rewards. Social Forces 56, 1 (1977), 21–30. [Google Scholar]
- [132].Skopec Laura, Musco Thomas, and Sommers Benjamin D. 2014. A potential new data source for assessing the impacts of health reform: evaluating the Gallup-Healthways Well-Being Index. In Healthcare, Vol. 2. Elsevier, 113–120. [DOI] [PubMed] [Google Scholar]
- [133].Sloane Peter Jand Williams Hector. 2000. Job satisfaction, comparison earnings, and gender. Labour 14, 3 (2000). [Google Scholar]
- [134].Sorenson Susan. 2014. How employees’ strengths make your company stronger. Gallup Business Journal (2014). [Google Scholar]
- [135].Sousa-Poza Alfonsoand Sousa-Poza Andrés A. 2000. Taking another look at the gender/job-satisfaction paradox. Kyklos 53, 2 (2000), 135–152. [Google Scholar]
- [136].Tausczik Yla Rand Pennebaker James W. 2010. The psychological meaning of words: LIWC and computerized text analysis methods. Journal of language and social psychology 29, 1 (2010), 24–54. [Google Scholar]
- [137].Tay Louis and Harter James K. 2013. Economic and labor market forces matter for worker well-being. Applied Psychology: Health and Well-Being 5, 2 (2013), 193–208. [DOI] [PubMed] [Google Scholar]
- [138].Tay L, Ng V, Kuykendall L, and Diener E. 2014. Demographic factors and worker well-being: An empirical review using representative data from the United States and across the world. Research in Occupational Stress and Well-Being; (2014). [Google Scholar]
- [139].Terry Deborah J, Nielsen Michelle, and Perchard Linda. 1993. Effects of work stress on psychological well-being and job satisfaction: The stress-buffering role of social support. Australian Journal of Psychology 45, 3 (1993), 168–175. [Google Scholar]
- [140].Thom Jennifer and Millen David R. 2012. Stuff IBMers Say: Microblogs as an Expression of Organizational Culture. In Sixth International AAAI Conference on Weblogs and Social Media. [Google Scholar]
- [141].Tuch Steven Aand Martin Jack K. 1991. Race in the workplace: Black/White differences in the sources of job satisfaction. Sociological Quarterly 32, 1 (1991), 103–116. [Google Scholar]
- [142].Tufekci Zeynep. 2014. Big questions for social media big data: Representativeness, validity and other methodological pitfalls. In Eighth International AAAI Conference on Weblogs and Social Media. [Google Scholar]
- [143].Usui Emiko. 2008. Job satisfaction and the gender composition of jobs. Economics Letters 99, 1 (2008), 23–26. [Google Scholar]
- [144].Van de Mortel Thea F et al. 2008. Faking it: social desirability response bias in self-report research. Australian Journal of Advanced Nursing, The 25, 4 (2008), 40. [Google Scholar]
- [145].Van Saane N, Sluiter Judith K, Verbeek JHAM, and Frings-Dresen MHW. 2003. Reliability and validity of instruments measuring job satisfaction—a systematic review. Occupational medicine 53, 3 (2003), 191–200. [DOI] [PubMed] [Google Scholar]
- [146].Warr Peter. 1987. Work, unemployment, and mental health. Oxford University Press. [Google Scholar]
- [147].Weaver Charles N. 1980. Job satisfaction in the United States in the 1970s. Journal of applied Psychology (1980). [Google Scholar]
- [148].Weiss David J, Dawis Rene V, and England George W. 1967. Manual for the Minnesota satisfaction questionnaire. Minnesota studies in vocational rehabilitation (1967). [Google Scholar]
- [149].Weiss Howard M. 2002. Deconstructing job satisfaction: Separating evaluations, beliefs and affective experiences. Human resource management review 12, 2 (2002), 173–194. [Google Scholar]
- [150].Williams Maxine. 2017. Numbers take us only so far. HBR’S 10 MUST (2017), 37. [Google Scholar]
- [151].Wiswall Matthew and Zafar Basit. 2018. Preference for the workplace, investment in human capital, and gender. The Quarterly Journal of Economics 133, 1 (2018), 457–507. [DOI] [PMC free article] [PubMed] [Google Scholar]
- [152].Witt L Alanand Nye Lendell G. 1992. Gender and the relationship between perceived fairness of pay or promotion and job satisfaction. Journal of Applied psychology 77, 6 (1992), 910. [DOI] [PubMed] [Google Scholar]
- [153].Woo Sang Eun, Jebb Andrew T, Tay Louis, and Parrigon Scott. 2018. Putting the “person” in the center: Review and synthesis of person-centered approaches and methods in organizational science. Organizational Research Methods 21, 4 (2018), 814–845. [Google Scholar]
- [154].Zhang Hui, De Choudhury Munmun, and Grudin Jonathan. 2014. Creepy but inevitable?: the evolution of social networking. In Proceedings of the 17th ACM conference on Computer supported cooperative work & social computing. [Google Scholar]
- [155].Zhao Dejin and Rosson Mary Beth. 2009. How and why people Twitter: the role that micro-blogging plays in informal communication at work. In Proceedings of the ACM 2009 international conference on Supporting group work. ACM. [Google Scholar]