

Summary
Seed morphology and quality of cultivated soybean (Glycine max) have changed dramatically during domestication from their wild relatives, but their relationship to selection is poorly understood. Here, we describe a semi‐dominant locus, ST1 (Seed Thickness 1), affecting seed thickness and encoding a UDP‐D‐glucuronate 4‐epimerase, which catalyses UDP‐galacturonic acid production and promotes pectin biosynthesis. Interestingly, this morphological change concurrently boosted seed oil content, which, along with up‐regulation of glycolysis biosynthesis modulated by ST1, enabled soybean to become a staple oil crop. Strikingly, ST1 and an inversion controlling seed coat colour formed part of a single selective sweep. Structural variation analysis of the region surrounding ST1 shows that the critical mutation in ST1 existed in earlier wild relatives of soybean and the region containing ST1 subsequently underwent an inversion, which was followed by successive selection for both traits through hitchhiking during selection for seed coat colour. Together, these results provide direct evidence that simultaneously variation for seed morphology and quality occurred earlier than variation for seed coat colour during soybean domestication. The identification of ST1 thus sheds light on a crucial phase of human empirical selection in soybeans and provides evidence that our ancestors improved soybean based on taste.
Keywords: seed morphology, oil content, domestication, inversion, selective sweep
Introduction
The long history of artificial selection that shaped modern crops has led to new physiological and morphological traits. Crops are distinguished from their wild progenitors by changes collectively referred to as the domestication syndrome which include loss of seed dormancy, reduced seed bloom and altered seed morphology (Doebley et al., 2006; Olsen and Wendel, 2013; Wang et al., 2018; Wang et al., 2020; Zhang et al., 2018a, 2018b). There are over 2000 plant species domesticated and a range of structures are the targets of domestication. Seeds are the crop organs primarily harvest‐targeted during domestication, as well as the ultimate products of modern breeding (Rosegrant and Cline, 2003). Several studies have explored the molecular basis of soybean domestication for hard‐seededness linked to permeability (GmHs1‐1), seed bloom (Bloom1, B1), dormancy (Stay‐Green, G) and seed coat colour (Inhibitor, I) (Liu et al., 2020; Sun et al., 2015; Wang et al., 2018; Xie et al., 2019; Zhang et al., 2018a, 2018b). Soybean is one of the most successfully domesticated legumes, providing >25% of protein and >56% of oil consumed by humans and animals worldwide (Wilson, 2008). Compared to its wild relative Glycine soja, cultivated soybean is characterized by longer, wider and thicker seeds with higher nutrient contents (Carter et al., 2004), which satisfy the demands of modern people for high‐yield and good‐quality better.
Especially, there are some pleiotropic genes, which provide a vast pool of variations for more than one physiological and morphological trait, can directly or indirectly improve the yield and quality (Dong et al., 2014; Lu et al., 2017). Indeed, numerous quantitative trait loci (QTLs) associated with independent agronomic traits have been described, and in some cases, QTLs controlling distinct agronomic traits have been mapped to the same or overlapping physical intervals, which were caused by pleiotropism or close linkage hitchhiking (Fang et al., 2017; Kong et al., 2018; Shook et al., 2020; Zhang et al., 2010). Nonetheless, how quantitative variation at individual, linked and interacting loci affects agronomic traits has not been fully explored.
Here, we investigated the genetic basis for changes in seed shape displayed by soybean varieties, combining genome‐wide association studies (GWAS) and map‐based cloning. We demonstrated that ST1, encoding UDP‐D‐glucuronate 4‐epimerase, was responsible for the transition of soybean seeds from a flat to a round shape and regulated oil content by catalysing the biosynthesis of UDP‐galacturonic acid and participating in the glycolytic pathway, thus improving soybean quality. An analysis of structural variation at the ST1 locus further suggested a selection model involving hitchhiking with the inversion of a chromosomal segment controlling seed coat colour, explaining why the seeds of cultivars tend to be yellow and round. Our results offer a molecular understanding of the co‐selection of traits regulating seed shape, oil content and coat colour and may open new avenues for the simultaneous improvement of seed quality and productivity in soybean.
Results
Identification of a locus controlling seed thickness
Seeds undergo numerous morphological changes during development to reach their final length, width and thickness, making seed size a complex trait that cannot be accurately described by a single parameter. To better capture seed characteristics, we calculated ratios between seed length and width, width and thickness, and length and thickness from a diversity panel of 302 resequenced soybean accessions: 60 wild strains, 89 landraces and 153 cultivated soybeans (Table S1). Most of them were collected from across the Huanghuai region of China (Lu et al., 2020), where soybean was domesticated from G. soja, thus representing the genomic diversity (Figure 1a). Phylogenomic and principal‐component analyses of all resequenced accessions using all shared single‐nucleotide polymorphisms (SNPs) as input revealed the evolutionary landscape of the diversity panel, with improved cultivars being more closely related to landraces than to wild soybeans (Figure S1a,b). In all three sets of accessions, linkage disequilibrium (r 2) decreased with increasing physical distance between SNPs (Figure 1c).
Figure 1.

GWAS for length to thickness ratio of seeds in soybean diversity panels. (a) Geographic origins of a newly assembled 302‐accession diversity panel. The map was drawn using ArcGIS v.10.3 software for desktop (https://desktop.arcgis.com/en/). (b,c), GWAS scan for length to thickness ratio of seeds using data from the 302‐accession panel grown in Wuhan and Guangzhou, China in 2019. Q‐Q plot for GWAS results of length to thickness ratio.
We performed GWAS using the length/width, width/thickness and length/thickness ratios of seeds from all accessions planted in Wuhan and Guangzhou, low‐latitude regions whose growth conditions are conducive to soybean maturity. In particular, the detection of length/thickness ratio in the same region of chromosome 8 across different environments indicates the underlying locus (referred to hereafter as Seed Thickness 1, ST1) and therefore make a robust and important contribution to seed morphology in soybean (Figure 1b,c, Figure S1d, S2a–d and S3a,b).
Positional cloning of ST1 and functional validation
To map ST1, we developed a recombinant inbred line (RIL) population of 163 soybean lines derived from a cross between the round and yellow‐seeded variety GR8836 and the flat and black‐seeded variety Xiaoheidou (XHD). The two seed phenotypes were equally represented across the RIL population, consistent with the segregation pattern of a single locus (χ² = 1.9139, P = 1.67E–1) (Figure S3c,d and S4a–e). We genotyped a subset of 55 informative RILs by specific‐locus amplified fragment sequencing (SLAF‐seq) (Table S2), resulting in a mapping interval of 906.4 kb on chromosome 8 by single‐marker analysis. We then developed a residual heterozygous inbred population and narrowed down the location of ST1 to an 84.50‐kb region between markers SNP 3 and Indel 2, predicted to contain seven open reading frames (ORFs) based on the Zhonghuang 13 (ZH13) reference genome (Shen et al., 2018) (Table S3). Comparison of the GR8836 and XHD coding sequences only identified polymorphisms in ORF2 (Glyma.08g108900), ORF3 (Glyma.08g109000) and ORF4 (Glyma.08g109100). Among a 4‐bp deletion (TGTG) within ORF4 in the XHD background was predicted to introduce a premature stop codon, creating a truncated protein lacking functional domain (Figure. 2a,b).
Figure 2.

Map‐based cloning of ST1. (a) The comparison of seed shape between GR8836 and Xiaoheidou (XHD). (b) The ST1 locus was detected on chromosome 8 and the interval was narrowed to a 84.5‐kb region between marker SNP3 and Indel2. The numbers below the bars indicated the number of recombinants. Glyma.08g109100 was the candidate gene. (c–e) The seed phenotype of the Kefeng1 control and the transgenic seed pTF101‐ST1: (c) seed length; (d) seed width; (e) seed thickness. (f–g) The seed phenotype of the Williams82 control and the transgenic seed CRISPR (CasST1): (f) seed length; (g) seed width; (h) seed thickness. (i–l) Comparison of the seed traits between the transgenic seed and Kefeng1: (i) seed length; (j) seed width; (k) seed thickness; (l) length to thickness ratio of seed; (m–p) comparison of the seed traits between the CRISPR gene editing plant and Williams82: (m) 100 seed weight; (n) seed length; (o) seed width; (p) seed thickness. All data are mean ± SD. The Student’s t‐test was used.
Weighted gene correlation network analysis (WGCNA) of GR8836 and XHD was performed, and the dendrogram displayed that the genes were clustered into 21 modules with different expression patterns. We analyzed the relationship between the modules and seed shape parameters by calculating the correlation value of module eigengenes (ME) for each module using Pearson’s correlation coefficients. Although ORF2 and ORF3, within the MEdarkgreen and MEmagenta modules, respectively, showed no correlation with any seed trait (P > 0.05), ORF4 in the MEblack module was significantly correlated with seed thickness (P < 0.05) (Figure S5a,b).
To test whether ORF4 confers a round seed phenotype, we first introduced a transgene consisting of the ST1 coding sequence from the round‐seeded cultivar GR8836 driven by the cauliflower mosaic virus (CaMV) 35S promoter into Arabidopsis. Analysis of five independent T2 transgenic lines showed that the transgenic Arabidopsis had longer, wider and thicker seeds than the control plants (Figure S6a–e).
To expand this analysis to soybean, we introduced the entire ORF4 locus from GR8836 into the flat‐seeded soybean variety Kefeng 1. The seed length, thickness and width of T2 transgenic plants increased by 3.8%, 7.9% and 5.5%, respectively, relative to non‐transgenic controls (Figure 2c–e, i‐k). The length/thickness ratio also decreased significantly (6.5%), reflecting greater roundness, relative to non‐transgenic seeds, while the 100‐seed weight increased significantly (22.5%; Figure 2l,m).
Furthermore, we used CRISPR/Cas9 to target ST1 in the cultivar Williams 82. PCR genotyping and sequencing of independent plants showed 2‐bp deletions in the target site, and caused a frameshift and then an early‐stop translation (Figure S7). Complete loss of ST1 function in the mutant significantly decreased seed length, width and thickness (Figure 2f‐h, n‐p). Thus, we demonstrated that Glyma.08g109100 was a candidate gene for ST1.
ST1 affects seed size through the pectin biosynthesis pathway
Plant cell walls are highly complex structures composed of structural proteins, enzymes and various polysaccharides (Keegstra, 2010), including pectin, which plays a vital role in plant primary cell walls (Mohnen, 2008; Saffer, 2018; Thakur et al., 1997). ST1 encodes a UDP‐glucose 4‐epimerase that converts UDP‐glucuronic acid into UDP‐galacturonic acid, which is then further converted into pectin precursors. Histological examination revealed that ST1 transgenic soybean seeds contain more and larger cells than non‐transgenic seeds (Figure 3a–c). We therefore measured UDP‐glucuronic acid (UGluA) and UDP‐galacturonic acid (UGalA) levels in pTF101‐ST1 transgenic lines and their non‐transgenic controls: UGluA content was significantly lower, and UGalA content higher, in ST1 transgenic seeds compared to control non‐transgenic seeds (Figure 3d,e). Together, these results indicated that ST1 plays an important role in converting UGluA to UGalA for pectin biosynthesis, and may thus determine seed shape by regulating cell division and expansion patterns in soybean (Figure 3j).
Figure 3.

Effects of ST1 on seed size and oil content. (a) Paraffin section and histological analysis on Kefeng1 and the transgenic seed pTF101‐ST1, bar = 200 μm. (b) Comparison of average cell number along the longitudinal axis between transgenic seedpTF101‐ST1 and Kefeng1control. (c) Cell size of seed. (d–h) Comparison of the metabolite between the transgenic seed pTF101‐ST1 and Kefeng1 control: (d) UDP glucuronic acid; (e) UDP galacturonic acid; (f) oil content; (g) glycerol‐3‐phosphate; (h) triglyceride. (i) ST1 catalyses the glycolysis pathway and contributes to oil biosynthesis, which is required for oil accumulation. (j) Proposed working model of the role of ST1 in the regulation seed shape and oil content in soybean. ST1 catalyses the UDP‐glucuronic acid and contributes to pectin biosynthesis, which is required for cell proliferation and expansion. In addition, ST1 catalyses the glycolysis and contributes to oil biosynthesis, which is required for oil accumulation. All data are mean ± SD. The Student’s t‐test was used.
ST1 affects oil accumulation through the glycolytic pathway
Interestingly, QTLs underlying seed oil content were previously identified by GWAS and QTL research, which including the mapping region of ST1 (Yan et al., 2019; Zhang et al., 2018a, 2018b). Coincidently, seeds harvested from ST1 transgenic lines had higher oil content than those from control non‐transgenic Kefeng 1 seeds (Figure 3f), which accumulated more triglycerides than non‐transgenic seeds in Arabidopsis (Figure S6f), suggesting that ST1 promotes oil accumulation in seeds. ST1 is predicted to contain a nicotinamide adenine dinucleotide (NAD)‐binding domain, NAD being a key coenzyme within metabolic networks converted from NADH by dehydrogenases from multiple metabolic pathways, such as glycolysis and lipid biosynthesis (Selles Vidal et al., 2018). To investigate the molecular basis of this effect, we performed a transcriptome sequencing (RNA‐seq) analysis on non‐transgenic seeds and ST1 transgenic Kefeng 1 seeds. We detected 13 865 differentially expressed genes (DEGs), comprising 6606 up‐ and 7259 down‐regulated genes, in the ST1 transgenic lines relative to their non‐transgenic controls. Kyoto Encyclopedia of Genes and Genomes (KEGG) pathway enrichment analysis suggested that these DEGs were overrepresented along the glycolytic pathway (Figure S8a). RNA‐seq data showed that the ST1 has strong correlations with a large number of genes involved in glycolysis biosynthesis, signalling, transport, and metabolism, which were significantly increased in the ST1 transgenic lines compared with control non‐transgenic Kefeng 1 plants (Figure S8b). The essential lipid biosynthesis precursor triacylglycerol is synthesized by esterification of glycerol‐3‐phosphate during glycolysis. Triacylglycerol and glycerol‐3‐phosphate contents were higher in ST1 transgenic soybean seeds than non‐transgenic controls, respectively (Figure 3g,h); the oil content of soybean seeds was determined using a nuclear magnetic resonance (NMR) analyser showing that the distribution of oil within seeds, transgenic lines had higher oil content than control (Figure 3i), suggesting that ST1 increases oil content by indirectly affecting glycolytic levels and then affecting key metabolites in the fatty acid metabolic pathway (Figure 3j).
ST1 underwent selection during soybean domestication
To analyse sequence variation at the ST1 locus, we chose a great deal of soybean material more comprehensively across a diversity panel comprising 1209 soybean accessions, including 122 wild accessions, 542 landraces and 545 cultivated soybeans (Table S1), identifying 10 ST1 haplotypes (Figure 4a). The H1 haplotype was by far the most frequent (83.0%, 1003 of 1209) and was associated with round seeds with high oil content. The (C to T) polymorphism within the CDS of ST1 was found to be perfectly associated with the phenotypic difference in seed shape and oil content among the 302 accessions (Figure 4b), suggesting that the (C to T) point mutation was causative for the phenotypic transition. This polymorphism was predicted to affect the structure of the protein (Figure 4c), cause the protein structure folding and further prevents the binding of conserved domains. The H1 haplotype (referred to as ST1T ) with round/high oil content seeds harboured one primary polymorphism at nucleotide 203 of the ST1 coding sequence, while H3 haplotype (referred to as ST1C ) was associated with flat/lower oil content seeds. All haplotypes except H1 and H3 haplotype are collectively referred to as ST1Fs , based on the phenotypic data collected in Wuhan and Guangzhou (Figure 4d–f). Notably, oil content increased gradually from wild varieties to landraces and then improved cultivars (Figure 4g).
Figure 4.

Identification of ST1 functions site. (a) Haplotypes of ST1. (b) Association between sequence variations surrounding the ST1 locus and phenotypic difference in seed shape. (c) Predicted protein structural difference between ST1‐H1 and ST1‐H3. (d,e) Length to thickness ratio of seeds in haplotypes of ST1T , ST1C and ST1Fs from the 302‐accession panel grown in Wuhan and Guangzhou, China in 2019. (f) Oil content of seeds in haplotypes of ST1T , ST1C and ST1Fs from the 302‐accession panel grown in Guangzhou, China in 2019. (g) Oil content in wild soybeans, landraces and improved cultivars from the 302‐accession panel grown in Guangzhou, China in 2019. All data are mean ± SD. The Student’s t‐test was used.
One phenomenon aroused the interests of us and has been kept noticed and touched for a long time that round and high oil content soybean usually have yellow seed coat. Extensive research has been performed on the I locus, this locus with extensive epigenetics and silencing mechanism involvement, and an unstable transposon‐induced locus with a high reversion frequency (Todd and Vodkin, 1993; Todd and Vodkin, 1996; Tuteja et al., 2004; Tuteja and Vodkin, 2008; Tuteja et al., 2009; Woodworth, 1921; Zhou et al., 2015). Coincidentally, the ST1 locus was located within an ~160‐kb selective sweep region, a region that also contained the I locus, which controls the pigmentation of the seed coat by inversion (Figure 5a). In agreement with the fact that the frequency of the ST1T allele was only 22% in wild soybeans but increased to 83% in landraces and 99% among improved cultivars (Figure 5b), to validate ST1 as a target of selection, we calculated nucleotide diversity (π) and Tajima’s D statistics, indicative of strong selection on ST1 (Figure S9a,b). Accordingly, we introduced the expressed sequenced tag (EST) Gm‐c1069‐6017, which can cause posttranscriptional gene silencing of the I locus (Xie et al., 2019), to Kefeng 1 with black seed coat, and obtained five transgenic lines with non‐pigmented seed coat. There were no significant differences in length/thickness ratio and oil content in the T0 and T1 transgenic lines, showing that the I locus does not affect either seed shape or oil content (Figure 5c–e and Figure S0a–c).
Figure 5.
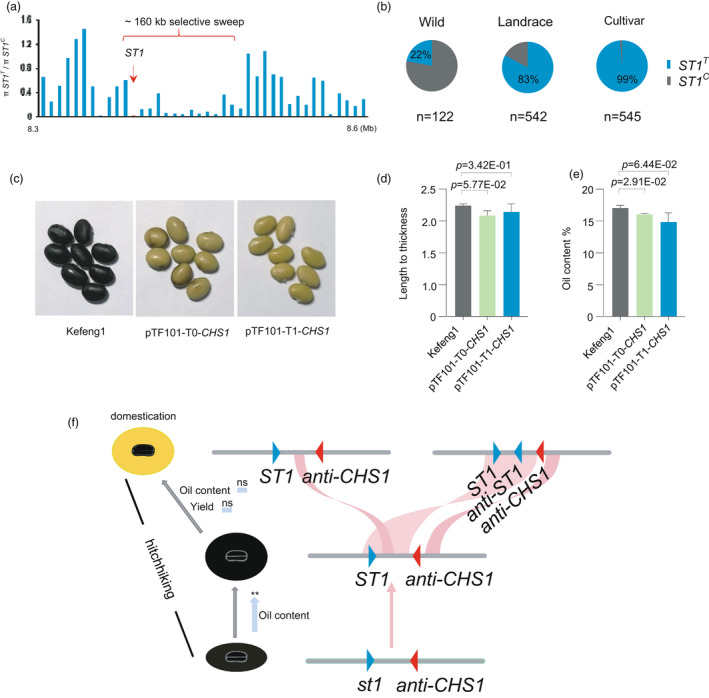
Phenotypic comparison between control and control yellow coat seed gene. (a) Selective sweep was calculated by the ratio of nucleic diversity π of genes between the accessions possessing ST1C allele and ST1T allele of each gene in the genomic region of ST1 using the panel of 122 wild soybeans, 542 landraces and 545 improved cultivars. (b) Proportions of ST1T and ST1C alleles within each of the three germplasm groups. Data are from the panel of 146 wild soybeans, 575 landraces and 574 improved cultivars. (c) Phenotypic comparison between control and T0 seeds with the colour transgene and T1 seeds with the colour transgene. (d) Length to thickness ratio of seed; (e) Oil content. (f) Evolutionary process of ST1. All data are mean ± SD. The Student’s t‐test was used.
By using 880 soybean cultivars that have seed shape, coat colour and seed oil content information available in the Chinese germplasm information system (Table S1), we found that cultivars with flat seeds tend to have a lower oil content relative to those with round seeds, which is consistent with the fact that seed oil content is often positively correlated with seed weight. By contrast, the oil contents of yellow round and black round soybean seeds did not show a statistically significant difference, further indicating that selection for seed coat colour is independent of oil content (Figure S11a,b).
To further explore the selection relationship between ST1 and the I locus, we compared the genomic regions encompassing ST1 between the genomes of the soybean PI 562565, PI 549046 and the reference ZH13 and confirmed the rearrangements described for the CHALCONE SYNTHASE cluster that gave rise to the anti‐CHS1 locus. We also noticed that the inverted genomic fragment contains ST1, forming an anti‐ST1 locus upstream from the CHS cluster. This anti‐ST1 harbours the H1 haplotype (ST1T ), demonstrating that the ST1T allele existed before the inversion occurred (Figure S12a). The large number of SVs from 29 independently de novo assembled genomes enabled us to clarify clearer evolutionary processes between ST1 and the I locus. Of the 29 accessions, three wild soybeans and landrace SoyL02 exhibited ST1C allele and black seed coat colour, one wild soybean and the other cultivated soybeans exhibited ST1T allele and yellow seed coat colour. Phylogenetic analyses using polymorphism around the I locus showed that the 29 accessions could be classified into five major haplotypes (H1‐H5), with accessions with black seed coat as earliest formed haplotype of H1 and ST1T has been existed in W01, the evidence amply confirms our point of view (Figure S12b). Meanwhile, the oil content and yield of H2 were no significant difference from that of H3‐H5 respectively, confirming that the anti‐ST1 does not affect oil content (Figure S11c). These results imply that ST1 selection was imposed on seed shape and seed quality before seed coat colour was selected during soybean domestication. Further suggested a selection involving hitchhiking with the inversion of a chromosomal segment controlling seed coat colour, possibly explaining why soybean cultivars tend to have round and high oil content yellow seeds (Figure 5f,g). And the appearance of soybean seeds has been modified simultaneously during domestication.
Discussion
Legumes domestication is one of the earliest technological innovations in agricultural history, resulting in seed, the ultimate target organ for human selection and modern crop improvement, changing largely in morphology (Sedivy et al., 2017; Xing and Zhang, 2010). However, agronomic traits never change singly but always inextricably, which was caused by pleiotropism or close linkage hitchhiking (Dong et al., 2014; Lu et al., 2017). Many seemingly unrelated QTLs related to seed thickness, oil content, yield, branches, and seed coat colour in soybean were located at a genomic interval of 7 to 9 Mb on chromosome 8 in previous studies (Hina et al., 2020; Patil et al., 2018; Zhang et al., 2017, 2018a), strongly implying that the loci controlling these traits are inextricably linked whether in chromosome position or function. Seed thickness gene ST1 not only contributes to pectin biosynthesis, resulting in plumper seeds but also affects the glycolytic pathway, ultimately increasing oil content. The high allele frequency of haplotype H1 (STT ) of ST1 in landraces and improved soybeans was more than wilds suggests that ST1 has undergone selection. The soybeans with yellow seed coat have been more extensively promoted in modern agriculture, and are also considered to have been driven by selective pressures. Both the ST1 and the seed coat colour locus I were defined to an ~160 kb ‘selective sweep’ region shaped by soybean domestication, and ST1 hitchhiked in an inversion at the locus I controlling seed coat colour, suggesting that it has been selected at least twice. ST1 was selected and fixed during the domestication of the seed coat colour. It highlights the vital importance of seed coat colour in soybean domestication and implies that a pleiotropic QTL locus improves the efficiency of selection and improvement. Understanding the relationship between morphology and quality traits and the order of gene domestication help to accelerate the process of the simultaneous breeding of crop.
Methods
Plant materials
The 163 lines of F10:11 recombinant inbred line (RIL) population derived from a cross between soybean cultivars GR8836 and XHD were obtained from Jilin University and used for initial mapping. For fine‐mapping, 895 F2:3 lines from an F2 population derived from a cross between line W1112 (isolated from the RIL population above) and cultivar GR8836 were used. The mapping population and the soybean parental lines were grown from 2017 to 2019 in the field at the Shangzhuang experimental station of China Agricultural University, Beijing (40° 08′ N, 116° 10′ E). Seeds were sown 0.2 m apart in 35‐m long rows, with 0.5 m between rows, at the beginning of June and seeds of the next generation were harvested in October. Transgenic plants were grown in a greenhouse (10 h dark/14 h light, 25 °C). A diversity panel consisting of 302 wild soybeans, landraces and improved cultivars whose genomes were sequenced were grown in both Wuhan (30° 52′ N, 114° 31′ E) and Guangzhou (23° 16′ N, 113° 23′ E) under natural growth conditions for phenotyping and GWAS analysis.
Phenotyping
The dimensions of at least 20 randomly chosen fully dry seeds per accession were measured with an electronic digital calliper to determine seed thickness, width and length. Several ratios were calculated to better characterize soybean seed shape: length/width, width/thickness and length/thickness, which reflected seed roundness best. Based on the distribution of the length/thickness ratio measured from the diversity panel harvested in Wuhan and Guangzhou (Figure S3a,b), a cut‐off of 1.5 was applied to distinguish flat seeds (<1.5) from round seeds (>1.5). Using this cut‐off, seeds from the F10:11 RIL population segregated equal proportions of flat and round seeds (Figure S3c,d), indicating that the trait is controlled by a single locus in this population. Transgenic Arabidopsis seeds were photographed under a stereomicroscope (Leica) with a SPOT‐RT digital camera attached to a computer. Seed length, thickness and width were measured using the ImageJ software (Abràmoff et al., 2004). Data were recorded from five individual plants with at least ten seeds per plant. The oil content of soybean seeds was determined using a nuclear magnetic resonance (NMR) analyser (Munz et al., 2016). Each seed sample was weighed and placed in an NMR tube and measured against a calibration curve to determine oil content. Magnetic resonance imaging (MRI) was used to analyse the distribution of oil within seeds and document changes in soybean seed morphology.
Molecular mapping
Specific‐locus amplified fragment sequencing (SLAF‐seq) was implemented to develop high‐density molecular markers for 52 informative lines from the RIL population. A major QTL mapping to chromosome 8 was identified by single‐marker analysis (Li et al., 2009a,b) based on resequencing results. Additional insertion/deletion (indel) markers and SNP markers were designed to identify recombinants in the fine‐mapping population. Finally, the genomic location of the ST1 locus was defined by two molecular markers, SNP3 and Indel2, using two recombinants (Figure 1d).
GWAS for length/thickness ratio of seeds
A set of 3 582 767 high‐quality single‐nucleotide polymorphisms (SNPs) from a previous study (Fang et al., 2017) were used for GWAS, using length/thickness, length/width and width/thickness ratios measured in 302 accessions with a minor allele frequency (MAF) of >=0.05. The efficient mixed‐model association expedited (EMMAX) algorithm (Li et al., 2009a,b) was used to perform association analyses. Kinship was developed with all SNPs. The significance threshold was set as 1/n (where n refers to the total SNP number). Principal‐component analysis was performed with the smartpca program that is part of the EIGENSOFT package (Felsenstein, 1989). Linkage disequilibrium (LD) was calculated for each subgroup with SNPs (MAF >=0.05) by PLINK software (Purcell et al., 2007).
DNA and RNA extraction, PCR, RT‐PCR, sequencing and alignment
Genomic DNA was isolated from fresh trifoliate leaves by the CTAB method (Doyle, 1991). Total RNA was extracted from seeds at the R6 growth stage with the StarSpin HiPure Plant RNA Mini Kit (GenStar). Removal of contaminating genomic DNA and first‐strand synthesis were performed with the StarScriptII First‐strand cDNA Synthesis Mix With gDNA Remover (GenStar) according to the manufacturer’s instructions. Primers used for PCR, RT‐PCR and sequencing are listed in Table S4. DNA and protein sequence alignments were conducted with DNAMAN software version 8.0 (Lynnon Biosoft, Quebec City, Canada).
Plasmid construction and transformation
A genomic fragment for candidate gene ST1 (Glyma.08g109100) consisting of 2.5 kb of sequence upstream of the start codon, the entire coding region and 1.5 kb of sequence downstream of the stop codon was PCR amplified from GR8836 genomic DNA and introduced into the pTF101‐Gene vector (carrying the glufosinate resistance Bar gene encoding phosphinothricin acetyltransferase), in place of the cauliflower mosaic virus (CaMV) 35S promoter. A genomic fragment harbouring the subtilisin coding region and anti‐CHS1 was PCR‐amplified from GR8836 genomic DNA, with primers designed using as template the expressed sequence tag (EST) Gm‐c1069‐6017 (Xie et al., 2019), which was derived from soybean cultivar Williams 82, which has a yellow seed coat. The resulting PCR amplicon was then introduced into the pTF101‐Gene vector in place of the 35S promoter. All constructs were confirmed by sequencing, introduced into Agrobacterium (Agrobacterium tumefaciens) strain GV3101 and transformed into the black coat soybean accession Kefeng 1. The 1482‐bp ST1 coding sequence was amplified from GR8836 genomic DNA and subsequently cloned into the pGFP1300 vector downstream of a modified 35S promoter. The resulting construct was introduced into Agrobacterium strain GV3101 and used for Arabidopsis (Col‐0) transformation using the floral dip method (Bent, 2006). The presence of the constructs in transgenic plants was confirmed by PCR and sequencing of the PCR fragment with specific primers. All primers used for vector construction are listed in Table S4.
The target was designed using the online tools CRISPRP v2.0 (http://crispr.hzau.edu.cn/cgi‐bin/CRISPR2/CRISPR) based on their GC content and putative off‐target sites. The 20‐bp target sequence was designed in the conserved region of ST1. The target sequence was synthesized and cloned into pBlu gRNA (containing U6 promoter) at BbsI site, the generating construct was then digested with EcoRI, the fragment containing gRNA was transferred to CRISPR/Cas9 binary vector. For determining the mutations in the target gene, fragments flanking the target site were amplified by PCR using the primers and the PCR products were purified for Sanger sequencing to detect potential mutations (Figure S7).
Measurements of metabolite contents
The mature seeds of non‐transgenic and Kefeng 1 transformants were ground into powder in liquid nitrogen and then 1 mL of phosphate‐buffered saline (PBS, pH = 7.4) was added. The mixture was centrifuged at 12 000 g for 25 min at 4°C. Quantitative analysis of metabolite concentrations (UDP‐glucuronic acid, UDP‐galacturonic acid, glycerol‐3‐phosphate and triglycerides) was performed with an ELISA test kit (R&D Systems). UDP‐D‐glucuronate 4‐epimerase activity was determined spectrophotometrically based on the change in absorbance at 450 nm, using UDP‐glucuronic acid as substrate.
Paraffin sections
Seeds harvested at the green (R6) pod stage were collected and dehydrated in a 1:1 mixture consisting of xylene and 70% ethanol for 1 h at 55 °C. Seeds were then embedded in a paraffin‐xylene solution and sectioned as longitudinal series. Sections were then stained with periodic acid Schiff reagent (PAS) and observed under a light microscope. After staining with haematoxylin, rinsing and dehydration, piece can be sealed with neutral gum. Ultra‐thin sections were produced for microscopic examination, image acquisition and analysis.
Protein structural and phylogenetic analysis
Three‐dimensional structures of ST1 and related proteins were predicted with the I‐TASSER server (Yang et al., 2015). A protein sequence alignment and phylogenetic tree were constructed with MEGA 7.0. The phylogenetic tree was generated with 1000 bootstrap values with the maximum‐likelihood method and the Jones‐Taylor‐Thornton (JTT) model (Kumar et al., 2016).
RNA sequencing
Total RNA was extracted from seeds at the R5, R6, R7 stage of growth from GR8836 and XHD lines as well as seeds at the R6 stage from non‐transgenic and transgenic Kefeng 1 lines with three biological replicates. Total RNA was extracted from seeds at the R6 stage of growth from non‐transgenic and transgenic Kefeng 1 lines, with three biological replicates. Paired‐end libraries were constructed and sequenced using an Illumina HiSeq2500 at Anoroad Company (China). Cuffdiff was used to calculate FPKM (fragments per kilobase of exon per million mapped reads) values for each gene and identify differentially expressed genes (DEGs) with a fold change >=2 and a false discovery rate <0.05. Kyoto Encyclopedia of Genes and Genomes (KEGG) pathway enrichment analysis was performed using KOBAS 3.0 (Bu et al., 2021).
Weighted gene coexpression network analysis (WGCNA)
WGCNA was performed using the WGCNA package in R (Langfelder and Horvath, 2008). The data of RNA sequencing of GR8836 and XHD as described before was used to classify highly correlated mRNAs into different coexpression modules. We assessed the weighted coexpression relationship among all dataset subjects in an adjacency matrix using the pairwise Pearson correlation. To find biologically significant modules, module eigengenes were used to calculate the correlation coefficient with the three morphology phenotypes. The results were presented using heat maps based on correlation coefficients, with deeper colour representing higher correlation. Specifically, red showed a positive correlation and green showed a negative correlation (Figure S5a,b).
Whole‐genome sequence comparison
The sequence aligner MUMmer (Marcais et al., 2018) (version 3.23) was used to compare genomic sequences over candidate intervals between soybean accessions Heihe No.43 and PI562565, and between Zhonghuang 13 (ZH13) and PI562565. NUCmer (‐ P) is used to align the genome sequences, and delta filter (‐ R) is used to filter the alignment results. Show‐coords (‐ R ‐ C ‐ L) is used to generate the anchor coordinate results of sequence matching. The visualization of the result is based on second development, expands configuration file, adjusts gene location and direction labelling, and finally highlights sequence inversion.
Nucleotide‐diversity analyses and molecular evolution
The 1209 soybean accessions, including 122 wild accessions, 542 landraces and 545 cultivated soybeans, were resequenced to find mutation sites in the coding region. Ten ST1 haplotypes were identified and named H1–H10 (Figure 3a). Nucleotide diversity (π) for the genes located on chromosome 8 was calculated using the SNP data from resequenced soybean accessions (wild, landraces and cultivars) as previously described (Lu et al., 2020). Both SNPs with <10% missing data or MAF <5% were filtered out to ensure the quality of the data. The selective sweep surrounding the ST1 region was identified as previously described (Olsen et al., 2006). The ratio between nucleotide diversity among soybean accessions carrying the ST1 T allele and those carrying the ST1C allele was used to identify regions with significantly lower levels of genomic diversity. Genes with π ST1 <0.002 were excluded from the selective sweep analysis. Tajima’s D, the probability of the sequence departure from a neutral evolution model was calculated with VCFtools (Danecek et al., 2011; Wang et al., 2017).
Conflict of interest
The authors declare no competing interests.
Author contributions
LS and FK conceived and designed the research. CF, LW and YW generated the natural population and RIL population. JL, YZ, RM and WH performed the experiments with input from ZY, QS, XD and YH. WH, JH and LS wrote the manuscript. All authors read and approved the final manuscript.
Supporting information
Figure S1 Characterization and GWAS for length to thickness ratio of seeds in soybean diversity panels.
Figure S2 Characterization of phenotype and GWAS for length to width ratio and width to thickness ratio of seeds in soybean diversity panels.
Figure S3 Characterization for length to thickness ratio of seeds in soybean diversity panels.
Figure S4 Comparison of the seed traits between GR8836 and XHD.
Figure S5 mRNA coexpression modules identified by WGCNA.
Figure S6 Phenotypes of Arabidopsis Col and ST1 transgenic seeds.
Figure S7 ST1 sequence alignment.
Figure S8 KEGG and correlation analysis.
Figure S9 Selection analysis of ST1.
Figure S10 Phenotypic comparison between control and control yellow coat seed gene.
Figure S11 Comparison of oil content.
Figure S12 Selection relationship between ST1 and CHS1.
Table S1 Summary of all soybean accessions.
Table S2 Single marker analysis in Chr08.
Table S3 Predicted gene list in the mapped 84.5kb genomic region in the reference genome of ZH13 of ST1 locus.
Table S4 Primers used in this study.
Acknowledgements
This work was supported by the National Natural Science Foundation of China (grant nos. 31871708 and 32072089 to L.S.), the National Key Research and Development Program of China (grant no. 2018YFD0100903), the Recruitment Program of Global Experts, the Recruitment Program of Global Experts and the Fundamental Research Funds for the Central Universities.
Li, J. , Zhang, Y. , Ma, R. , Huang, W. , Hou, J. , Fang, C. , Wang, L. , Yuan, Z. , Sun, Q. , Dong, X. , Hou, Y. , Wang, Y. , Kong, F. and Sun, L. (2022) Identification of ST1 reveals a selection involving hitchhiking of seed morphology and oil content during soybean domestication. Plant Biotechnol. J., 10.1111/pbi.13791
Contributor Information
Ying Wang, Email: wangying2009@jlu.edu.cn.
Fanjiang Kong, Email: kongfj@gzhu.edu.cn.
Lianjun Sun, Email: sunlj@cau.edu.cn.
References
- Abràmoff, M.D. , Magalhães, P.J. and Ram, S.J. (2004) Image processing with ImageJ. Biophoton. Int. 11, 36–42. [Google Scholar]
- Bent, A. (2006) Arabidopsis thaliana floral dip transformation method. Methods Mol. Biol. 343, 87–103. [DOI] [PubMed] [Google Scholar]
- Bu, D. , Luo, H. , Huo, P. , Wang, Z. , Zhang, S. , He, Z. , Wu, Y. et al. (2021) KOBAS‐i: intelligent prioritization and exploratory visualization of biological functions for gene enrichment analysis. Nucleic Acids Res. 49, W317–W325. [DOI] [PMC free article] [PubMed] [Google Scholar]
- Carter, T.E. , Nelson, R.L. , Sneller, C.H. and Cui, Z.L. (2004) Genetic diversity in soybean. In Soybeans: Improvement, Production and Uses, ( Shibles, R.M. , Harper, J.E. , Wilson, R.F. and Shoemaker, R.C. , eds), Ch. 8. pp. 303–416. Hoboken, NJ: John Wiley and Sons. [Google Scholar]
- Danecek, P. , Auton, A. , Abecasis, G. , Albers, C.A. , Banks, E. , DePristo, M.A. , Handsaker, R.E. , Lunter, G. , Marth, G.T. , Sherry, S.T. , McVean, G. , Durbin, R. and Genomes Project Analysis, G. (2011) The variant call format and VCFtools. Bioinformatics, 27, 2156–2158. [DOI] [PMC free article] [PubMed] [Google Scholar]
- Doebley, J.F. , Gaut, B.S. and Smith, B.D. (2006) The molecular genetics of crop domestication. Cell, 127, 1309–1321. [DOI] [PubMed] [Google Scholar]
- Dong, Y. , Yang, X. , Liu, J. , Wang, B.H. , Liu, B.L. and Wang, Y.Z. (2014) Pod shattering resistance associated with domestication is mediated by a NAC gene in soybean. Nat. Commun. 5, 3352. [DOI] [PubMed] [Google Scholar]
- Doyle, J.J. (1991) DNA protocols for plants‐CTAB total DNA isolation. In Molecular Techniques in Taxonomy, ( Hewitt, G.M. , Johnston, A.W.B. and Young, J.P.W. , eds), pp. 283–293. Berlin, Germany: Springer Verlag. [Google Scholar]
- Fang, C. , Ma, Y. , Wu, S. , Liu, Z. , Wang, Z. , Yang, R. , Hu, G. et al. (2017) Genome‐wide association studies dissect the genetic networks underlying agronomical traits in soybean. Genome Biol. 18, 161. [DOI] [PMC free article] [PubMed] [Google Scholar]
- Felsenstein, J. (1989) PHYLIP‐Phylogeny Inference Package (version 3.2). Cladistics, 5, 164–166. [Google Scholar]
- Hina, A. , Cao, Y. , Song, S. , Li, S. , Sharmin, R.A. , Elattar, M.A. , Bhat, J.A. et al. (2020) High‐Resolution Mapping in Two ril populations refines major "QTL Hotspot" regions for seed size and shape in soybean (Glycine max L.). Int. J. Mol. Sci. 21, 1040. [DOI] [PMC free article] [PubMed] [Google Scholar]
- Keegstra, K. (2010) Plant cell walls. Plant Physiol. 154, 483–486. [DOI] [PMC free article] [PubMed] [Google Scholar]
- Kong, L. , Lu, S. , Wang, Y. , Fang, C. , Wang, F. , Nan, H. , Su, T. et al. (2018) Quantitative trait locus mapping of flowering time and maturity in soybean using next‐generation sequencing‐based analysis. Front. Plant Sci. 9, 995. [DOI] [PMC free article] [PubMed] [Google Scholar]
- Kumar, S. , Stecher, G. and Tamura, K. (2016) MEGA7: Molecular Evolutionary Genetics Analysis Version 7.0 for Bigger Datasets. Mol. Biol. Evol. 33, 1870–1874. [DOI] [PMC free article] [PubMed] [Google Scholar]
- Langfelder, P. and Horvath, S. (2008) WGCNA: an R package for weighted correlation network analysis. BMC Bioinformatics, 9, 559. [DOI] [PMC free article] [PubMed] [Google Scholar]
- Li, H. , Handsaker, B. , Wysoker, A. , Fennell, T. , Ruan, J. , Homer, N. , Marth, G. , Abecasis, G. , Durbin, R . and Genome Project Data Processing, S. (2009a) The sequence alignment/map format and SAMtools. Bioinformatics, 25, 2078–2079. [DOI] [PMC free article] [PubMed] [Google Scholar]
- Li, Q. , Zheng, G. , Liang, X. and Yu, K. (2009b) Robust tests for single‐marker analysis in case‐control genetic association studies. Ann. Hum. Genet. 73, 245–252. [DOI] [PMC free article] [PubMed] [Google Scholar]
- Liu, Y. , Du, H. , Li, P. , Shen, Y. , Peng, H. , Liu, S. , Zhou, G.A. et al. (2020) Pan‐genome of wild and cultivated soybeans. Cell, 182(1), 162–176.e13. [DOI] [PubMed] [Google Scholar]
- Lu, S. , Dong, L. , Fang, C. , Liu, S. , Kong, L. , Cheng, Q. , Chen, L. et al. (2020) Stepwise selection on homeologous PRR genes controlling flowering and maturity during soybean domestication. Nat. Genet. 52, 428–436. [DOI] [PubMed] [Google Scholar]
- Lu, S. , Zhao, X. , Hu, Y. , Liu, S. , Nan, H. , Li, X. , Fang, C. et al. (2017) Natural variation at the soybean J locus improves adaptation to the tropics and enhances yield. Nat. Genet. 49, 773–779. [DOI] [PubMed] [Google Scholar]
- Marcais, G. , Delcher, A.L. , Phillippy, A.M. , Coston, R. , Salzberg, S.L. and Zimin, A. (2018) MUMmer4: A fast and versatile genome alignment system. PLoS Comput. Biol. 14, e1005944. [DOI] [PMC free article] [PubMed] [Google Scholar]
- Mohnen, D. (2008) Pectin structure and biosynthesis. Curr. Opin. Plant Biol. 11, 266–277. [DOI] [PubMed] [Google Scholar]
- Munz, E. , Jakob, P.M. and Borisjuk, L. (2016) The potential of nuclear magnetic resonance to track lipids in planta. Biochimie, 130, 97–108. [DOI] [PubMed] [Google Scholar]
- Olsen, K.M. , Caicedo, A.L. , Polato, N. , McClung, A. , McCouch, S. and Purugganan, M.D. (2006) Selection under domestication: evidence for a sweep in the rice waxy genomic region. Genetics, 173, 975–983. [DOI] [PMC free article] [PubMed] [Google Scholar]
- Olsen, K.M. and Wendel, J.F. (2013) A bountiful harvest: genomic insights into crop domestication phenotypes. Annu. Rev. Plant Biol. 64, 47–70. [DOI] [PubMed] [Google Scholar]
- Patil, G. , Vuong, T.D. , Kale, S. , Valliyodan, B. , Deshmukh, R. , Zhu, C. , Wu, X. et al. (2018) Dissecting genomic hotspots underlying seed protein, oil, and sucrose content in an interspecific mapping population of soybean using high‐density linkage mapping. Plant Biotechnol. J. 16, 1939–1953. [DOI] [PMC free article] [PubMed] [Google Scholar]
- Purcell, S. , Neale, B. , Todd‐Brown, K. , Thomas, L. , Ferreira, M.A. , Bender, D. , Maller, J. et al. (2007) PLINK: a tool set for whole‐genome association and population‐based linkage analyses. Ann. Hum. Genet. 81, 559–575. [DOI] [PMC free article] [PubMed] [Google Scholar]
- Rosegrant, M.W. and Cline, S.A. (2003) Global food security: challenges and policies. Science, 302, 1917–1919. [DOI] [PubMed] [Google Scholar]
- Saffer, A.M. (2018) Expanding roles for pectins in plant development. J. Integr. Plant Biol. 60, 910–923. [DOI] [PubMed] [Google Scholar]
- Sedivy, E.J. , Wu, F. and Hanzawa, Y. (2017) Soybean domestication: the origin, genetic architecture and molecular bases. New Phytol. 214, 539–553. [DOI] [PubMed] [Google Scholar]
- Selles Vidal, L. , Kelly, C.L. , Mordaka, P.M. and Heap, J.T. (2018) Review of NAD(P)H‐dependent oxidoreductases: Properties, engineering and application. Biochim. Biophys. Acta‐Proteins Proteom. 1866, 327–347. [DOI] [PubMed] [Google Scholar]
- Shen, Y. , Liu, J. , Geng, H. , Zhang, J. , Liu, Y. , Zhang, H. , Xing, S. et al. (2018) De novo assembly of a Chinese soybean genome. Sci. China Life Sci. 61, 871–884. [DOI] [PubMed] [Google Scholar]
- Shook, J.M. , Zhang, J. , Jones, S.E. , Singh, A. and Singh, A.K. (2020) Meta‐GWAS for quantitative trait loci identification in soybean. BioRXIV. [DOI] [PMC free article] [PubMed] [Google Scholar]
- Sun, L. , Miao, Z. , Cai, C. , Zhang, D. , Zhao, M. , Wu, Y. , Zhang, X. et al. (2015) GmHs1‐1, encoding a calcineurin‐like protein, controls hard‐seededness in soybean. Nat. Genet. 47, 939–943. [DOI] [PubMed] [Google Scholar]
- Thakur, B.R. , Singh, R.K. , Handa, A.K. and Rao, M.A. (1997) Chemistry and uses of pectin – a review. Crit. Rev. Food Sci. Nutr. 37, 47–73. [DOI] [PubMed] [Google Scholar]
- Todd, J.J. and Vodkin, L.O. (1993) Pigmented soybean (Glycine max) seed coats accumulate proanthocyanidins during development. Plant Physiol. 102, 663–670. [DOI] [PMC free article] [PubMed] [Google Scholar]
- Todd, J.J. and Vodkin, L.O. (1996) Duplications that suppress and deletions that restore expression from a chalcone synthase multigene family. Plant Cell, 8, 687–699. [DOI] [PMC free article] [PubMed] [Google Scholar]
- Tuteja, J.H. , Clough, S.J. , Chan, W.C. and Vodkin, L.O. (2004) Tissue‐specific gene silencing mediated by a naturally occurring chalcone synthase gene cluster in Glycine max. Plant Cell, 16, 819–835. [DOI] [PMC free article] [PubMed] [Google Scholar]
- Tuteja, J.H. and Vodkin, L.O. (2008) Structural features of the endogenous CHS silencing and target loci in the soybean genome. Crop Sci. 48, S49–S68. [Google Scholar]
- Tuteja, J.H. , Zabala, G. , Varala, K. , Hudson, M. and Vodkin, L.O. (2009) Endogenous, tissue‐specific short interfering RNAs silence the chalcone synthase gene family in Glycine max seed coats. Plant Cell, 21, 3063–3077. [DOI] [PMC free article] [PubMed] [Google Scholar]
- Wang, M. , Li, W. , Fang, C. , Xu, F. , Liu, Y. , Wang, Z. , Yang, R. et al. (2018) Parallel selection on a dormancy gene during domestication of crops from multiple families. Nat. Genet. 50, 1435–1441. [DOI] [PubMed] [Google Scholar]
- Wang, M. , Tu, L. , Lin, M. , Lin, Z. , Wang, P. , Yang, Q. , Ye, Z. et al. (2017) Asymmetric subgenome selection and cis‐regulatory divergence during cotton domestication. Nat. Genet. 49, 579–587. [DOI] [PubMed] [Google Scholar]
- Wang, S. , Liu, S. , Wang, J. , Yokosho, K. , Zhou, B. , Yu, Y.C. , Liu, Z. et al. (2020) Simultaneous changes in seed size, oil content and protein content driven by selection of SWEET homologues during soybean domestication. Natl Sci. Rev. 7, 1776–1786. [DOI] [PMC free article] [PubMed] [Google Scholar]
- Wilson, R.F. (2008) Soybean: Market driven research needs. In Genetics and Genomics of Soybean. Plant Genetics and Genomics: Crops and Models ( Stacey, G. , ed), pp. 3–15. New York: Springer. [Google Scholar]
- Woodworth, C.M. (1921) Inheritance of cotyledon, seed‐coat, hilum and pubescence colors in soy‐beans. Genetics, 6, 487–553. [DOI] [PMC free article] [PubMed] [Google Scholar]
- Xie, M. , Chung, C.Y. , Li, M.W. , Wong, F.L. , Wang, X. , Liu, A. , Wang, Z. et al. (2019) A reference‐grade wild soybean genome. Nat. Commun. 10, 1216. [DOI] [PMC free article] [PubMed] [Google Scholar]
- Xing, Y. and Zhang, Q. (2010) Genetic and molecular bases of rice yield. Annu. Rev. Plant Biol. 61, 421–442. [DOI] [PubMed] [Google Scholar]
- Yan, L. , Di, R. , Wu, C.J. , Liu, Q. , Wei, Y. , Hou, W.H. , Zhao, Q.S. et al. (2019) Haplotype analysis of a major and stable QTL underlying soybean (Glycine max) seed oil content reveals footprint of artificial selection. Mol. Breeding, 39, 57. [Google Scholar]
- Yang, J. , Yan, R. , Roy, A. , Xu, D. , Poisson, J. and Zhang, Y. (2015) The I‐TASSER Suite: protein structure and function prediction. Nat. Methods, 12, 7–8. [DOI] [PMC free article] [PubMed] [Google Scholar]
- Zhang, D. , Liu, C. , Cheng, H. , Kan, G. , Cui, S. , Meng, Q. , Gai, J. et al. (2010) Quantitative trait loci associated with soybean tolerance to low phosphorus stress based on flower and pod abscission. Plant Breed. 129, 243–249. [Google Scholar]
- Zhang, D. , Lu, H. , Chu, S. , Zhang, H. , Zhang, H. , Yang, Y. , Li, H. et al. (2017) The genetic architecture of water‐soluble protein content and its genetic relationship to total protein content in soybean. Sci. Rep. 7, 5053. [DOI] [PMC free article] [PubMed] [Google Scholar]
- Zhang, D.J. , Sun, L.J. , Li, S. , Wang, W.D. , Ding, Y.H. , Swarm, S.A. , Li, L.H. et al. (2018a) Elevation of soybean seed oil content through selection for seed coat shininess. Nat. Plants, 4, 30–35. [DOI] [PubMed] [Google Scholar]
- Zhang, J.P. , Wang, X.Z. , Lu, Y.M. , Bhusal, S.J. , Song, Q.J. , Cregan, P.B. , Yen, Y. et al. (2018b) Genome‐wide Scan for Seed composition provides insights into soybean quality improvement and the impacts of domestication and breeding. Mol. Plant, 11, 460–472. [DOI] [PubMed] [Google Scholar]
- Zhou, Z. , Jiang, Y. , Wang, Z. , Gou, Z. , Lyu, J. , Li, W. , Yu, Y. et al. (2015) Resequencing 302 wild and cultivated accessions identifies genes related to domestication and improvement in soybean. Nat. Biotechnol. 33, 408–414. [DOI] [PubMed] [Google Scholar]
Associated Data
This section collects any data citations, data availability statements, or supplementary materials included in this article.
Supplementary Materials
Figure S1 Characterization and GWAS for length to thickness ratio of seeds in soybean diversity panels.
Figure S2 Characterization of phenotype and GWAS for length to width ratio and width to thickness ratio of seeds in soybean diversity panels.
Figure S3 Characterization for length to thickness ratio of seeds in soybean diversity panels.
Figure S4 Comparison of the seed traits between GR8836 and XHD.
Figure S5 mRNA coexpression modules identified by WGCNA.
Figure S6 Phenotypes of Arabidopsis Col and ST1 transgenic seeds.
Figure S7 ST1 sequence alignment.
Figure S8 KEGG and correlation analysis.
Figure S9 Selection analysis of ST1.
Figure S10 Phenotypic comparison between control and control yellow coat seed gene.
Figure S11 Comparison of oil content.
Figure S12 Selection relationship between ST1 and CHS1.
Table S1 Summary of all soybean accessions.
Table S2 Single marker analysis in Chr08.
Table S3 Predicted gene list in the mapped 84.5kb genomic region in the reference genome of ZH13 of ST1 locus.
Table S4 Primers used in this study.