Abstract
The adhesion of a recently described species, Acinetobacter venetianus VE-C3 (F. Di Cello, M. Pepi, F. Baldi, and R. Fani, Res. Microbiol. 148:237–249, 1997), to diesel fuel (a mixture of C12 to C28 n-alkanes) and n-hexadecane was studied and compared to that of Acinetobacter sp. strain RAG-1, which is known to excrete the emulsifying lipopolysaccharide, emulsan. Oxygen consumption rates, biomass, cell hydrophobicity, electrophoretic mobility, and zeta potential were measured for the two strains. The dropping-mercury electrode (DME) was used as an in situ adhesion sensor. In seawater, RAG-1 was hydrophobic, with an electrophoretic mobility (μ) of −0.38 × 10⁻⁸ m2 V−1 s−1 and zeta potential (ζ) of −4.9 mV, while VE-C3 was hydrophilic, with μ of −0.81 × 10⁻⁸ m2 V−1 s−1 and ζ of −10.5 mV. The microbial adhesion to hydrocarbon (MATH) test showed that RAG-1 was always hydrophobic whereas the hydrophilic VE-C3 strain became hydrophobic only after exposure to n-alkanes. Adhesion of VE-C3 cells to diesel fuel was partly due to the production of capsular polysaccharides (CPS), which were stained with the lectin concanavalin A (ConA) conjugated to fluorescein isothiocyanate and observed in situ by confocal microscopy. The emulsan from RAG-1, which was negative to ConA, was stained with Nile Red fluorochrome instead. Confocal microscope observations at different times showed that VE-C3 underwent two types of adhesion: (i) cell-to-cell interactions, preceding the cell adhesion to the n-alkane, and (ii) incorporation of nanodroplets of n-alkane into the hydrophilic CPS to form a more hydrophobic polysaccharide–n-alkane matrix surrounding the cell wall. The incorporation of n-alkanes as nanodroplets into the CPS of VE-C3 cells might ensure the partitioning of the bulk apolar phase between the aqueous medium and the outer cell membrane and thus sustain a continuous growth rate over a prolonged period.
Microbial adhesion to hydrocarbons was the subject of pioneering studies by Mudd in 1924 (24) and more extensive ones over the last 20 years (12, 24, 28, 29, 33). Cell adhesion to hydrocarbons seems to proceed mainly via proteins: in Acinetobacter sp. strain MJT/F5/199A it occurs via an acidic protein of 65 kDa, probably a glycoprotein (31), in Acinetobacter calcoaceticus RAG-1 it occurs via fimbriae (27), and in Acinetobacter sp. strain A3 (12) it occurs via two proteins of 26.5 kDa and 56 kDa. Adhesion of cells to oil droplets and cell hydrophobicity can be determined by the microbial adhesion to hydrocarbon (MATH) test (28) or by more recently developed quantitative tests such as those involving measurement of zeta potential (6) and water contact angles (26, 35).
Bacteria produce many types of biosurfactants, as has been recently reviewed (8). The studies of new Acinetobacter strains are therefore stimulating because they are good sources of new surfactants when grown on hydrocarbons.
A new n-alkane-degrading strain of Acinetobacter has recently been isolated from the Venice Lagoon (2) and classified as Acinetobacter venetianus VE-C3 (9). The present study investigates the adhesion mechanisms of this new strain during the n-alkane degradation process. To do this, the adhesion mechanisms of Acinetobacter sp. strain RAG-1 as the control strain and the newly isolated A. venetianus VE-C3 were compared with respect to their physiological differences by using molecular probes and confocal laser-scanning microscopy (CLSM). Diesel fuel containing n-alkanes or pure n-hexadecane was used as the sole carbon and energy source. The electrochemical probe, the dropping-mercury electrode (DME), was used to study in situ the surface-active constituents of bacterial cultures. The electrochemical probe responds to the adhesion of bacteria (30, 38) and n-alkane droplets and the adsorption of dissolved polymers (15, 18) in real time.
MATERIALS AND METHODS
Cell cultures.
The restriction analysis of amplified rDNA, DNA hybridization, and GC content indicates that both VE-C3 and RAG-1 belong to the species A. venetianus (34). However, in this study we still use the species names A. venetianus VE-C3 and Acinetobacter sp. strain RAG-1 (ATCC 31012). Both strains were incubated at 28°C in a complex medium and in mineral medium. The complex medium, plate count agar (PCA), was composed of 5 g of tryptone, 2.5 g of yeast extract, 1 g of d-glucose, and 24 g of NaCl per liter of deionized water. The mineral medium had the following composition: 1.0 g of MgSO4 · 7H2O, 0.7 g of KCl, 2.0 g of KH2PO4, 3.0 g of Na2HPO4, 1.0 g of NH4NO3, and 24.0 g of NaCl per liter of deionized water. In the mineral medium, n-hexadecane or diesel fuel (2.0 g liter−1) was the sole carbon and energy source. The diesel fuel (Esso Italiana) for diesel engine vehicles is composed of a mixture of n-alkanes (C12 to C28) with traces of aromatics (<30 ppm polycyclic aromatic hydrocarbon PAH) and less than 1% total additives; it has a density of 0.830 g cm−3 at 15°C and a viscosity of 2.0 to 4.5 mm2 s−1 at 40°C (32). The diesel fuel was filtered through a 0.2-μm-pore-size Teflon filter (Sartorious) for sterilization and particle removal. Batch cultures of 50 and 250 ml were grown in flasks with continuous shaking (280 to 300 rpm) in a gyratory water bath shaker (G76; New Brunswick) or in a rotary drum.
Biomass determination.
The cell biomass of the two strains was determined from the protein concentration by the method of Bradford (5). The protein absorbance was determined at 595 nm with a UV-visible spectrophotometer (UV160; Shimadzu). The standard curve of bovine serum albumin was used for calibration. The coefficient of variation in five replicate analyses was 3.1%.
Bacterial counts for adhesion experiments with the DME were obtained by standard epifluorescence microscopy with an optical microscope (35); Axiovert, Zeiss) after DAPI (4′,6-diamidino-2-phenylindole) staining (25).
O2 consumption rates.
The strains were grown overnight in 250-ml flasks containing 50 ml of mineral medium with 2 g of diesel fuel liter−1. Then 2.5 ml of each culture (1% inoculum) was transferred to 250 ml of fresh mineral medium in duplicate and incubated at 28°C in a gyratory water bath shaker. The inoculum contained 24 ± 0.9 and 22 ± 0.6 μg of proteins ml−1 in RAG-1 and VE-C3, respectively. At different times, the O2 consumption was determined with a biological oxygen monitor (5300; Yellow Springs Instruments) equipped with a Clark probe. Analyses were carried out with 3-ml aliquots. Calculations were based on oxygen concentrations in air-saturated water at 28°C and on protein concentrations (5). The changes in pH during the experiment were not significant.
Fluorescent molecular probes for CLSM.
Image analysis was performed in both strain cultures by CLSM (MRC-500 instrument; Bio-Rad Microscience Division) equipped with a Nikon Microphot microscope. Two different fluorescent molecular probes were used: the lectin concanavalin A (ConA) from Canavalia ensiformis (Jack bean), labelled with fluorescein isothiocyanate (FITC) (Sigma), and Nile Red (Nile Blue A oxazone), (Sigma). The ConA has an affinity for glucose and mannose residues, whereas Nile Red is a fluorochrome specific for neutral lipids. This staining method was described previously (1). The distributions of the two fluorescent molecular probes in specimens were observed by CLSM.
MATH tests.
The two strains were grown in flasks containing 50 ml of PCA complex medium in a gyratory shaker for 18 h. The cells were harvested by centrifuging at 3,000 × g for 15 min., washed twice with deionized water, and suspended in phosphate-buffered saline (pH 7.2) to obtain a final absorbance at 600 nm (A600) of 0.4 to 0.6 as reported by Rosenberg et al. (28). The MATH tests were performed after 0, 12, and 36 h of incubation in mineral medium containing 2 g of diesel fuel liter−1. Aliquots (3 ml) of each suspension were distributed in seven vials to which 0.15 ml of n-hexadecane was added to extract the hydrophobic cells. The A600 of the aqueous phase (At) was measured after a given vortexing time, and cell concentrations were expressed with respect to the initial absorbance, A0, as log (At/A0 × 100).
Adhesion studies with the DME.
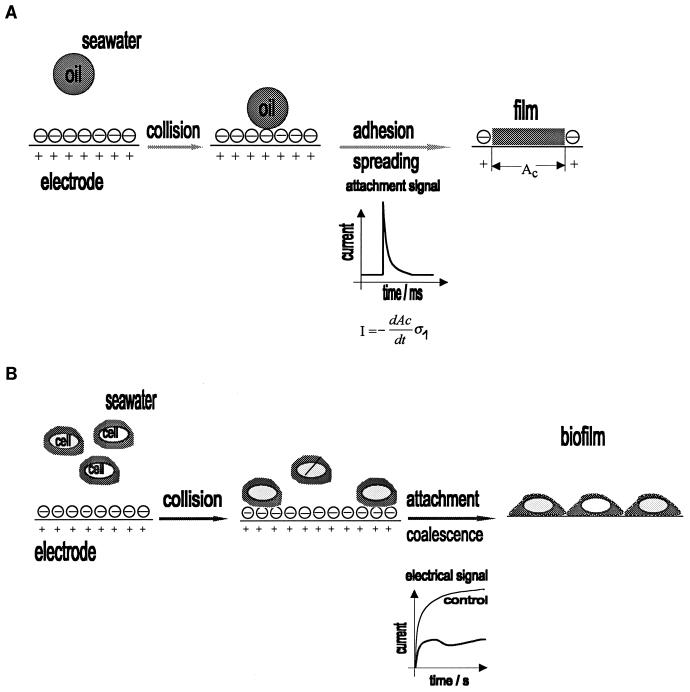
The electrochemical technique is based on the current-time dependence (chronoamperometry) during oxygen reduction at the DME. This is a modification of a widely used polarographic technique for measurements of surface-active organic matter in aquatic environments (3, 7, 14, 20, 23, 37, 40, 41). Adsorption of organic molecules and submicron particles to the DME causes a decrease in the oxygen reduction current. This decrease is proportional to the extent of surface coverage of the mercury drop by the organic film. On the other hand, adhesion of oil microdroplets results in well-defined attachment signals (39) on a millisecond time scale (Fig. 1A). The amplitudes of attachment signals reflect particle size and the force of adhesion; the signal frequency depends on the particle abundance in the medium.
FIG. 1.
(A) Adhesion of an oil droplet and its spreading to form a film at the electrode. The electrical signal (transient current) is caused by displacement of the double-layer charge (ς1) from the contact area AC. (B) Adhesion of bacterial cells and formation of molecular contact with the electrode.
The electrochemical technique enables the detection of bacterial adhesion (Fig. 1B) by measuring the surface coverage of the mercury drop. The extent of this coverage is usually determined at the end of the life of a drop (2.1 s in the present study). This mode of measurement is applicable to cell densities from 2 × 10⁵ to 1 × 10⁸ ml−1. At higher cell densities, the maximum surface coverage is reached during the life of the drop. The time (τ) when the maximum surface coverage is reached is defined as the film formation time. Generally, the film formation time decreases with increasing cell density to a constant value, τlim > 0 (38) but drops to zero with increasing biopolymer concentrations (15, 18).
To study the adhesion properties of uninduced cells, the bacterial cultures were grown in a standard liquid medium (marine broth; Difco), harvested after 24 h by centrifugation (6,000 × g for 10 min) and washed with seawater filtered through a 0.22-μm-pore-size Gelman filter. The cells were dispersed in organic-free electrolyte (0.1 M NaCl, with carbonate buffer [pH ≈ 8]) prior to measurement by epifluorescence microscopy (25). Bacterial cultures grown on commercial diesel fuel or n-hexadecane (99% purity; Sigma) were analyzed directly without any separation. The samples had to be diluted with organic-free water before the electrochemical measurement in order to achieve the optimum resolution for attachment signals.
A fast DME, with a drop lifetime of 2.1 s, flow rate of 6.03 mg s−1, and maximum surface area of 4.7 mm2, was used. A polarographic analyzer (174A; EG and G Princeton Applied Research) was used, and the current-time curves were recorded and stored with a Nicolet 3091 digital oscilloscope connected to a computer. The current-time curves were recorded at a constant potential of −400 mV, where the mercury surface is positively charged (+3.8 μC cm−2). The Ag|AgCl reference electrode was used. The samples (20 ml) were air saturated, and the measuring vessel was open to the air throughout the experiments.
Electrophoretic mobilities.
The electrophoretic mobilities of cell suspensions were measured in 0.1 M NaCl electrolyte and in seawater by using an automated microelectrophoresis instrument (S3000; PenKem). Zeta potentials were computed by the method of Hunter (13).
RESULTS
Although recent data suggest that VE-C3 and RAG-1 belong to the same new species, A. venetianus (9, 34), the two strains have different physiological behaviors in the presence of diesel fuel as the sole carbon and energy source (Fig. 2). Both strains consumed O2 when grown in mineral medium in the presence of diesel fuel (2 g liter−1), but their growth rates (Fig. 2A) and protein (biomass) production levels (Fig. 2B) were different. RAG-1 started consuming O2 after a 2-h lag phase, reaching the highest rate (0.5 nmol of O2 min−1 mg of protein−1) after 6 h. This maximum value was followed by a drop to 0.03 nmol of O2 min−1 mg of protein−1 (Fig. 2A). VE-C3 had a longer lag phase (4 h) (Fig. 2A). The O2 consumption rate increased to about 0.3 nmol min−1 mg of protein−1 in 8 h and remained almost constant throughout the experiment (28 h). Protein production did not parallel O2 consumption rates in either strain (Fig. 2B), and there was a more significant delay in biomass formation, measured as total proteins, for VE-C3 (21 h).
FIG. 2.
(A) Oxygen consumption rates determined with Clark’s probe in cultures of Acinetobacter sp. strain RAG-1 (▴) and A. venetianus VE-C3 (▵) grown in mineral medium containing 2 g of diesel fuel liter−1. (B) Protein determination of Acinetobacter sp. strain RAG-1 (▴) and A. venetianus VE-C3 (▵) grown in mineral medium containing 2 g of diesel fuel liter−1.
These physiological differences may be due to different mechanisms of adhesion to diesel fuel as the carbon source. An in situ investigation of cell interaction with diesel fuel was performed by CLSM with the fluorescent lectin ConA-FITC and the fluorochrome Nile Red to image the CPS of VE-C3 and the neutral lipid moiety of emulsan molecules of RAG-1, respectively. Observations were made at constant time intervals during cell growth in mineral medium amended with diesel fuel at 28°C.
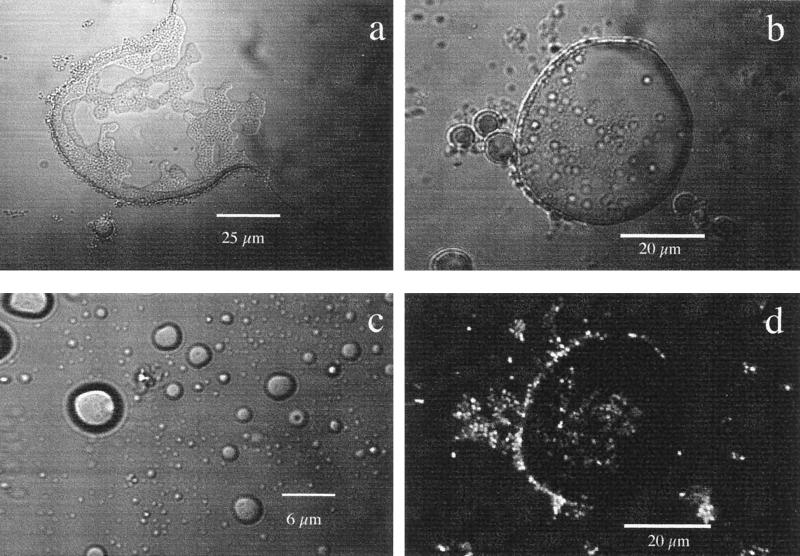
RAG-1 produces emulsan (11), which reduces the surface tension of diesel fuel. In the light transmission mode (Fig. 3a), the surface of diesel fuel drops was observed to break upon contact with the hydrophobic layer. When the diesel fuel drops were further broken down to microdroplets of around 100 μm in diameter (Fig. 3b), they were surrounded by bacteria and consumed as a carbon source. RAG-1 cells became highly fluorescent (Fig. 3d) due to Nile Red, which was bound to emulsan exuded by the cells. After 24 h of growth, the drops of diesel fuel broke down into even smaller free microdroplets about the same size as the bacteria or less (Fig. 3c). This might explain the peak and the rapid decrease in O2 consumption by RAG-1 cells grown with diesel fuel as the sole carbon source (Fig. 2A). RAG-1 cells no longer adhered to the diesel fuel residue when the microdroplets became repulsive due to the coating emulsan, a strong polyanionic bioemulsifier, and the microdroplets were dispersed in the medium without attached bacteria (Fig. 3c).
FIG. 3.
Colonization of diesel fuel by Acinetobacter sp. strain RAG-1. (a) Decrease in surface tension of part of a diesel fuel drop colonized by RAG-1, observed with an optical microscope in the transmission mode after a 3-h incubation at 28°C in mineral medium with diesel fuel (2 g liter−1). (b) Colonization of a diesel fuel droplet (diameter, 56 μm) by RAG-1, showing bacterial adhesion at the rim and on top, observed in the transmission mode after an 8-h incubation at 28°C. (c) Repellent diesel fuel microdroplets of different sizes (from 10 to less than 0.75 μm) dispersed in the medium without attached bacteria after a 24-h incubation. (d) Same image as in panel b but observed by CLSM in the fluorescence mode, formed by 16 overlapped images scanned every 0.8 μm for a total depth of 12.8 μm. This sample was stained with Nile Red fluorochrome for the neutral lipid moiety of emulsan.
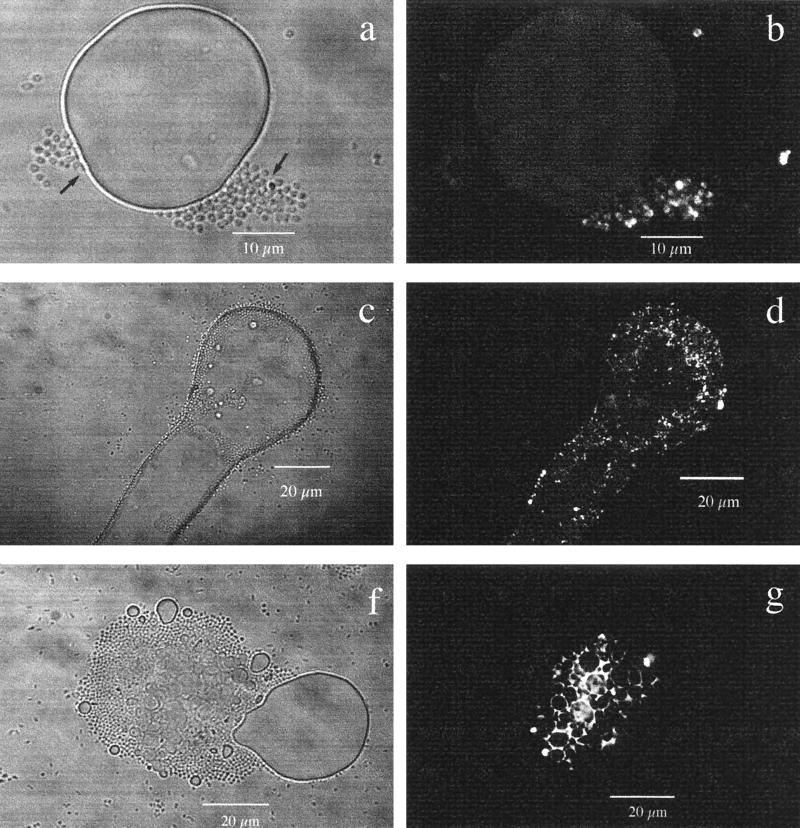
The behavior of VE-C3 cells was different (Fig. 4). In the presence of diesel fuel, this strain formed cell-to-cell aggregates and then adhered to the surface of diesel fuel drops (Fig. 4a) by its capsular polysaccharide (CPS). This term is generally accepted for a polysaccharide-based polymer anchored to the proteins or lipids of outer membranes. The CPS production was stimulated by diesel fuel, and the cells became partly fluorescent after 6 h of incubation with ConA-FITC. This molecular probe binds specifically to glucose and mannose residues of CPS (Fig. 4b). After 12 h of incubation, the diesel fuel droplets were completely colonized by VE-C3 cells. This had the effect of locally decreasing the surface tension, so that the diesel fuel formed sharp and indented droplet shapes (Fig. 4c). In the fluorescence mode, all cells produced CPS and the surface of the diesel fuel showed bacterial polysaccharide “footprints” (22) (Fig. 4d). At the end of the experiment (28 h), the bacterial cells were still attached to the microdroplets, producing larger mixed aggregates of diesel fuel and microbial cells (Fig. 4f). In the fluorescence mode, the microdroplets were seen to be “glued” in the middle of the bacterial aggregate by the ConA-positive CPS (Fig. 4g).
FIG. 4.
Colonization of diesel fuel by A. venetianus VE-C3. (a) Light microscopy in the transmission mode, showing aggregates of cells (arrows) before adhesion to the diesel fuel surface after a 6-h incubation at 28°C in mineral medium with 2 g of diesel fuel liter−1. (b) The same image as in panel a but observed by CLSM in the fluorescence mode, obtained by overlapping 20 images scanned every 0.6 μm for a total depth of 12 μm. VE-C3 was stained with ConA-FITC to show polysaccharide residues of glucose and mannose in CPS. Only a fraction of the cells seen in panel a (arrows) have a fluorescent CPS after 6 h of incubation. (c) Transmission mode, showing that the surface tension of a diesel fuel drop colonized by strain VE-C3 decreases and the bacteria at the rim and on top produce elongated and indented shapes after a 12-h incubation. (d) The same image as in panel c but in the fluorescence mode, with the ConA-FITC distribution imaged by CLSM. VE-C3 cells with CPS smear the elongated rim of the diesel fuel drop showing “polysaccharide footprints.” (f) Transmission mode, showing a diesel fuel droplet with a diameter of about 20 μm, with many smaller microdroplets embedded in a microbial aggregate. After a 28-h incubation at 28°C, VE-C3 cells are still attached to diesel fuel droplet. (g) The same image as in panel f but in fluorescence mode with the ConA-FITC distribution imaged by CLSM. The aggregate of cells and diesel fuel microdroplets is glued together by a thick polysaccharide matrix excreted by the bacteria.
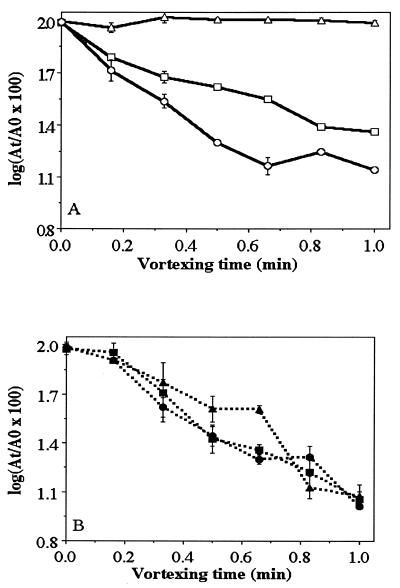
In cell-to-surface adhesion experiments, performed by the MATH test, VE-C3 cells appeared to be hydrophilic when grown in a complex medium but became hydrophobic when incubated in mineral medium with diesel fuel as the sole carbon and energy source (Fig. 5A). RAG-1 cells were always hydrophobic, even when grown in a complex medium without diesel fuel (Fig. 5B). Table 1 shows that diesel fuel-uninduced VE-C3 cells had higher negative electrophoretic mobility (−0.81 m−2 s−1 V−1) and more negative zeta potential (−10.5 mV−1) in seawater than did RAG-1 cells, in line with the MATH test results. Therefore, the two strains differ in their interfacial properties.
FIG. 5.
(A) Cell hydrophobicity of A. venetianus VE-C3 at different times, measured by the MATH test: 0 h (▵) preincubated in PCA medium and then transferred to mineral medium with 2 g of diesel fuel liter−1, then incubated for 12 h (□) and 36 h (○) in mineral medium with 2 g of diesel fuel liter−1. (B) MATH test for Acinetobacter sp. strain RAG-1 under the same conditions as in panel A incubated for 0 h (▴), 12 h (■), and 36 h (●).
TABLE 1.
Electrokinetic properties of bacterial cells
| Strain | Electrolyte | pH | Electrophoretic mobility (μ) (108 m2 V−1 s−1) | Zeta potential (ζ) (mV) |
|---|---|---|---|---|
| VE-C3 | 0.1 M NaCl | 6.5 | −1.04 ± 0.04 | −13.3 ± 0.49 |
| Seawater | 8.0 | −0.81 ± 0.03 | −10.5 ± 0.35 | |
| RAG-1 | 0.1 M NaCl | 6.9 | −0.32 ± 0.11 | −4.1 ± 1.42 |
| Seawater | 7.9 | −0.38 ± 0.05 | −4.9 ± 0.71 |
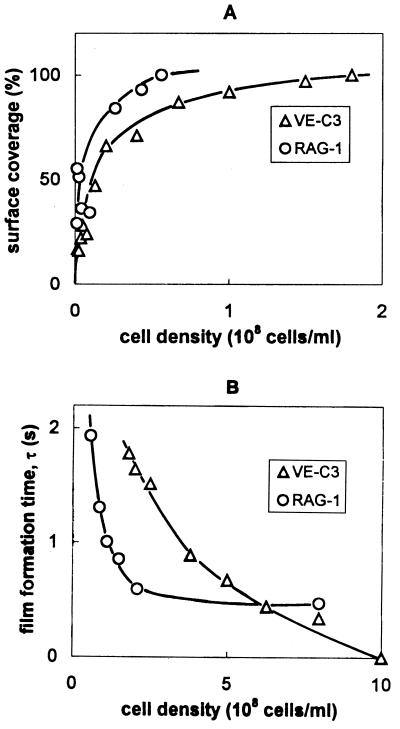
The adhesion of uninduced cells grown in mineral medium in the absence of diesel fuel was determined in organic-free electrolyte by analyzing current-time curves in terms of surface coverage and film formation time. We compared the adhesion behavior at an inert hydrophobic surface, the mercury electrode, by analyzing the amperometric curves recorded in the suspensions of RAG-1 and VE-C3 cells in terms of surface coverage (Fig. 6A) and film formation time (Fig. 6B). The extent of surface coverage recorded over a broad range of cell densities showed that both strains established rapid molecular contact with the surface. RAG-1 was more efficient in covering the surface despite being smaller. Full-surface coverage (100%) was reached at a cell density of 6 × 10⁷ ml−1 for RAG-1 and 1.8 × 10⁸ ml−1 for VE-C3, respectively. Consequently, the film formation rate was also higher in RAG-1 suspensions (Fig. 6B). However, at higher cell densities (>108/ml) a striking difference between two strains could be identified in the dynamics of film formation. For RAG-1 strain, the film formation time leveled off at τlim = 500 ms, and for VE-C3, τlim dropped to zero. The situation where τlim is zero is typical of films formed by the adsorption of dissolved biopolymers. When τlim is greater than zero, this generally indicates that there is a rate-limiting surface process involved in film formation. This means that biofilm formation by VE-C3 is governed by the adsorption of CPS, which is faster than the coalescence of cell-spreading zones, the rate-limiting surface process in film formation by RAG-1 cells. This difference in τlim between RAG-1 and VE-C3 reflects a difference in the flexibility of their outer membranes and cell-to-cell interactions. Cell-to-cell adhesion is an important characteristic for VE-C3. In mineral medium containing diesel fuel, up to 4,000 cells per aggregate were counted.
FIG. 6.
Adhesion of uninduced VE-C3 and RAG-1 cells at the electrode from their suspensions in 0.1 M NaCl solution. The percentage of surface coverage (A) and the film formation time (B) are plotted as a function of cell density.
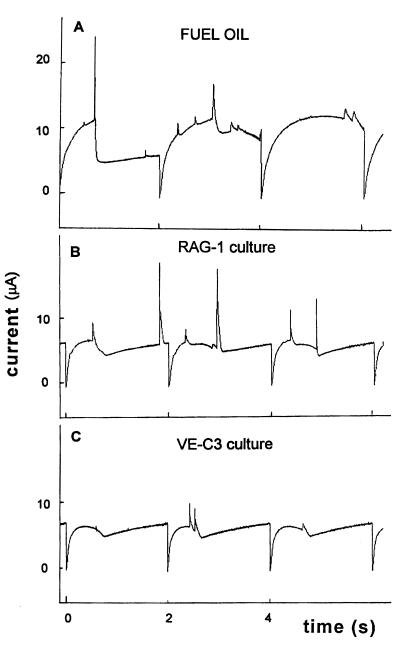
The adhesion response of bacteria in the oil-degrading cultures was studied simultaneously with the adhesion of dispersed oil droplets and the adsorption background of surface-active degradation products (Fig. 7). The amperometric curves recorded on three consecutive mercury drops reflect the size distribution of diesel fuel droplets and their abundance in RAG-1 cultures (Fig. 7B), in VE-C3 cultures (Fig. 7C) and in the control experiment (Fig. 7A) after 3 days of growth.
FIG. 7.
Electrochemical signals in the diesel fuel-degrading cultures of RAG-1 (curve B) and VE-C3 (curve C) after 3 days of growth. The control (curve A) is an uninoculated dispersion.
The average signal frequency and film formation times were obtained by the analysis of 50 current-time curves (Table 2). RAG-1 culture showed a significant increase of surface-active material smaller than <1 μm and no decrease in abundance of dispersed fuel droplets in the medium, but the fuel droplet decreased in size, showing that a significant fraction of newly produced surface-active material in RAG-1 cultures consists of emulsan and submicron fuel droplets formed by the action of the exocellular emulsan.
TABLE 2.
Adhesion in oil-degrading cultures measured by the electrochemical probe
| Culture | 24 h
|
72 h
|
||
|---|---|---|---|---|
| Oil droplet signal fre-quencya | Film formation time (τ) (s) | Oil droplet signal fre-quency | Film formation time (τ) (s) | |
| Controlb | 2.6 ± 1.2 | 1.70 ± 0.24 | 4.2 ± 1.5 | 1.48 ± 0.57 |
| RAG-1 | 2.2 ± 1.4 | 1.41 ± 0.12 | 3.3 ± 1.4 | 0.91 ± 0.15 |
| VE-C3 | 1.4 ± 0.9 | 1.60 ± 0.13 | 1.0 ± 0.8 | 0.75 ± 0.8 |
Average signal frequency (per drop lifetime of 2.1 s) obtained by analyzing current-time responses for 50 mercury drops.
Uninoculated oil dispersion in mineral medium.
In VE-C3 cultures, a significant decrease in the attachment frequency of oil droplets was already found at the end of day 1 of growth (Table 2). After day 3 of growth, a significant increase in the rate of film formation was observed (τ = 0.75 ± 0.08 s in VE-C3 and 0.9 ± 0.15 s in RAG-1), indicating a new production of surface-active material. The constant decrease in the abundance of fuel droplets dispersed in the medium was accompanied by an increase in the content of surface-active material (mostly bacteria). This remarkable difference between the two strains was even more pronounced when n-hexadecane was used instead of diesel fuel (16).
DISCUSSION
Different modes of cell adhesion to droplets of diesel fuel (a mixture of n-alkanes C12 to C28) and n-hexadecane are identified for two Acinetobacter strains, which helps to explain their biodegradation behavior. In this study, we demonstrated by imaging that strain VE-C3 produced a ConA-positive CPS to adhere to diesel fuel.
How does an insoluble alkane microdroplet become available as a carbon source for VE-C3 cells surrounded by hydrophilic CPS? The model proposed for Pseudomonas oleovorans growth on alkanes involves the transfer of outer membrane lipopolysaccharides to the alkane droplet, thus solubilizing the alkane material (36). However, extraction of these molecules would damage the outer cell membrane and ultimately cause cell damage and death. Therefore, an alternative mechanism of emulsification must be operating. We propose incorporation of alkane nanodroplets in the CPS as a more realistic mechanism for the continuing growth of VE-C3, based on the following observations. (i) The CPS of VE-C3 is capable of forming a stable dispersion of diesel fuel nanodroplets in the hydrophilic polymer matrix (Fig. 4g). This image suggested that a boundary layer surrounding the fuel droplets prevented them from coalescing (2). Electrochemical probe experiments clearly demonstrated that VE-C3 cells with a CPS establish molecular contact with the hydrophobic surface of mercury.
VE-C3 cells, which have a hydrophilic capsule, are therefore capable of attaching to the alkane droplet through the CPS. The three-dimensional network of the CPS hydro-gel entangles nanometer-sized fuel droplets, which do not coalesce, and stabilizes the emulsion without reducing the interfacial tension (10). This finding disagrees with other reports (4, 21), where it was demonstrated that CPS hinders attachment to hydrophobic solid surfaces.
The formation of a composite material is not a common concept in bacterial interaction with substrates but is a well-known phenomenon in materials science. The physical contact of two materials, hydrocarbons and CPS, at the nanometer level confers new properties on the mixture without the formation of chemical bonds. This interaction results in firm cell-to-substrate attachment, whereas the interactions in aggregated cells are of the cell-to-cell type and are mediated by glycoproteins, such as adhesin-like molecules.
The increasing hydrophobicity of VE-C3 measured by the MATH test is therefore most probably induced by incorporation of diesel fuel droplets into the CPS matrix, facilitating mass transfer of hydrocarbons from the medium to the cells. This incorporation mechanism is further supported by recent studies on polysaccharide giant aggregates from the northern Adriatic (17, 19). (The giant aggregate, 3 m in size, was a free-floating gelatinous formation sampled by a scuba diver at a depth of 15 m in August 1997.) The n-hexadecane could be incorporated in this hydrophilic gel to form a hydrophobic material of higher viscosity than the original gel. A gel prepared from dextran (molecular weight, 5 × 10⁷) in seawater had a similar capacity to incorporate n-hexadecane droplets and form a material of higher viscosity.
ACKNOWLEDGMENTS
This research was financed by MIRAAF Italian project 125/7240/96, partially by MURST (40%), and by the Ministry of Science and Technology of the Republic of Croatia, project P-1508.
We thank Neda Vdović for the electrophoretic measurements and Milica Petek for her comments.
REFERENCES
- 1.Baldi F, Minacci A, Saliot A, Mejanelle L, Mozetic̆ P, Turk V, Malej A. Cell lysis and release of particulate polysaccharides in extensive marine mucilage assessed by lipid biomarkers and molecular probes. Mar Ecol Prog Ser. 1997;153:45–57. [Google Scholar]
- 2.Baldi F, Pepi M, Fani R, Di Cello F, Da Ros L, Fossato V U. Complementary degradation of fuel oil in superficial waters and in axenic cultures of aerobic Gram-negative bacteria isolated from Venice Lagoon. Croat Chem Acta. 1997;70:333–346. [Google Scholar]
- 3.Barradas R G, Kimmerle F M. Effect of highly surface-active compounds on polarographic electrode processes. J Electroanal Chem. 1966;11:163–170. [Google Scholar]
- 4.Bonet R, Simon-Pujol M D, Congregado F. Effects of nutrients on exopolysaccharide production and surface properties of Aeromonas salmonicida. Appl Environ Microbiol. 1993;59:2437–2441. doi: 10.1128/aem.59.8.2437-2441.1993. [DOI] [PMC free article] [PubMed] [Google Scholar]
- 5.Bradford M M. A rapid and sensitive method for quantitation of microgram quantities of protein utilizing the principle of protein-dye binding. Anal Biochem. 1976;72:248–254. doi: 10.1016/0003-2697(76)90527-3. [DOI] [PubMed] [Google Scholar]
- 6.Busscher H J, van de Belt-Gritter B, van der Mei H C. Implication of microbial adhesion to hydrocarbons for evaluating cell surface hydrophobicity 1. Zeta potentials of hydrocarbon droplets. Colloids Surf B. 1995;5:111–116. [Google Scholar]
- 7.Ćosović B, Z̆utić V, Vojvodić V, Ples̆e T. Determination of surfactant activity and anionic detergents in seawater and sea surface microlayer in the Mediterranean. Mar Chem. 1985;17:127–139. [Google Scholar]
- 8.Desai J D, Banat I M. Microbial production of surfactants and their commercial potential. Microbiol Mol Biol Rev. 1997;61:47–64. doi: 10.1128/mmbr.61.1.47-64.1997. [DOI] [PMC free article] [PubMed] [Google Scholar]
- 9.Di Cello F, Pepi M, Baldi F, Fani R. Molecular characterization of an n-alkane-degrading bacterial community and identification of a new species, Acinetobacter venetianus. Res Microbiol. 1997;148:237–249. doi: 10.1016/S0923-2508(97)85244-8. [DOI] [PubMed] [Google Scholar]
- 10.Fuchs E, Cleveland D. A structural scaffolding of intermediate filaments in health and disease. Science. 1998;279:514–519. doi: 10.1126/science.279.5350.514. [DOI] [PubMed] [Google Scholar]
- 11.Gutnick D L, Allon R, Levy C, Petter R, Minas W. Applications of Acinetobacter as an industrial microorganism. In: Towner K J, editor. The biology of Acinetobacter. New York, N.Y: Plenum Press; 1991. [Google Scholar]
- 12.Hanson K, Vikram G, Kale C, Desai A J. The possible involvement of cell surface and outer membrane proteins of Acinetobacter sp. A3 in crude oil degradation. FEMS Microbiol Lett. 1994;122:275–280. [Google Scholar]
- 13.Hunter K A. Microelectrophoretic properties of natural surface-active organic matter in coastal seawater. Limnol Oceanogr. 1980;25:807–822. [Google Scholar]
- 14.Hunter K A, Liss P S. Polarographic measurement of surface-active material in natural waters. Water Res. 1980;15:203–215. [Google Scholar]
- 15.Ivos̆ević N, Z̆utić V. Polarography of marine particles. Croat Chem Acta. 1997;70:167–178. [Google Scholar]
- 16.Ivos̆ević N, Baldi F, Pepi M, Svetlic̆ić V, Z̆utić V. Abstract of the Natural Waters and Water Technology: Microorganisms and Geochemistry in Aquatic Ecosystems. Strasbourg, France: European Research Conferences; 1997. Electrochemical characterization of adhesion mechanism in Acinetobacter strains degrading diesel fuel; p. 18. [Google Scholar]
- 17.Ivos̆ević N, Svetlic̆ić V, Kovac̆ S, Kraus R, Z̆utić V, Furić K. Bacterial and biophysical aspects of macroaggregation phenomena in the northern Adriatic Sea. Eos Suppl. 1998;79:63. . (Abstract.) [Google Scholar]
- 18.Kovac̆, S., V. Svetlic̆ić, and V. Z̆utić. Molecular adsorption vs. cell adhesion at an electrified aqueous interface. Colloids Surf. A. in press.
- 19.Long R A, Fandino L B, Steward G F, Del Negro P, Romani P, Cataletto B, Welker C, Puddu A, Fonda S, Azam F. Microbial response to mucilage in the gulf of Trieste. Eos Suppl. 1998;79:OS63. . (Abstract.) [Google Scholar]
- 20.Marty J-C, Z̆utić V, Precali R, Saliot A, Ćosović B, Smodlaka N, Cauwet G. Organic matter characterization in the northern Adriatic Sea with a special reference to the sea surface microlayer. Mar Chem. 1988;26:313–330. [Google Scholar]
- 21.Murphy Cowan M, Fletcher M. Rapid screening method for detection of bacterial mutants with altered adhesion abilities. J Microbiol Methods. 1987;7:241–249. [Google Scholar]
- 22.Neu T R, Marshall K C. Microbial “footprints”—a new approach to adhesive polymers. Biofoulings. 1991;3:101–112. [Google Scholar]
- 23.Nuernberg H W, Valenta P. Polarography and voltammetry in marine chemistry. In: Goldberg E D, editor. The nature of sea-water. Berlin, Germany: Dahlem Konferenzen; 1975. pp. 87–136. [Google Scholar]
- 24.Paul J H, Jeffrey W H. Evidence for separate adhesion mechanisms for hydrophilic and hydrophobic surfaces in Vibrio proteolytica. Appl Environ Microbiol. 1985;50:431–437. doi: 10.1128/aem.50.2.431-437.1985. [DOI] [PMC free article] [PubMed] [Google Scholar]
- 25.Porter K G, Feig Y S. The use of DAPI for identifying and counting aquatic microflora. Limnol Oceanogr. 1980;25:943–948. [Google Scholar]
- 26.Reid G, Cuperus P L, Bruce A W, van der Mei H C, Tomeczek L, Khoury A H, Busscher H J. Comparison of contact angles and adhesion to hexadecane of urogenital, dairy, and poultry lactobacilli: effect of serial culture passages. Appl Environ Microbiol. 1992;58:1549–1553. doi: 10.1128/aem.58.5.1549-1553.1992. [DOI] [PMC free article] [PubMed] [Google Scholar]
- 27.Rosenberg M, Bayer E A, Delarea L, Rosenberg E. Role of thin fimbriae in adherence and growth of Acinetobacter calcoaceticus RAG-1 on hexadecane. Appl Environ Microbiol. 1982;44:929–937. doi: 10.1128/aem.44.4.929-937.1982. [DOI] [PMC free article] [PubMed] [Google Scholar]
- 28.Rosenberg M, Gutnick D L, Rosenberg E. Adherence of bacteria to hydrocarbons: a simple method for measuring cell-surface hydrophobicity. FEMS Microbiol Lett. 1980;9:29–33. [Google Scholar]
- 29.Rosenberg M, Rosenberg E. Role of adherence in growth of Acinetobacter calcoaceticus RAG-1 on hexadecane. J Bacteriol. 1981;148:51–57. doi: 10.1128/jb.148.1.51-57.1981. [DOI] [PMC free article] [PubMed] [Google Scholar]
- 30.Svetlic̆ić V, Ivos̆ević N, Z̆utić V, Fuks D. Polarography of marine bacteria: a preliminary study. Croat Chem Acta. 1997;70:141–150. [Google Scholar]
- 31.Thornley M J, Thorne K J I, Glauert A M. Detachment and chemical characterization of the regularly arranged subunits from the surface of an Acinetobacter. J Bacteriol. 1974;118:654–662. doi: 10.1128/jb.118.2.654-662.1974. [DOI] [PMC free article] [PubMed] [Google Scholar]
- 32.UNI. Ente Italiano di Unificazione (norma UNI-590). 1995. [Google Scholar]
- 33.van der Mei H C, van de Belt-Gritter B, Busscher H J. Implications of microbial adhesion to hydrocarbons for evaluating cell surface hydrophobicity. 2. Adhesion mechanisms. Colloids Surf B. 1995;5:117–126. [Google Scholar]
- 34.Vaneechoutte M, Tjernberg I, Baldi F, Pepi M, Fani R, Sullivan E R, van der Toorn J, Dijkshoorn L. The oil-degrading Acinetobacter strain RAG-1 and the strains described as ’Acinetobacter venetianus sp. nov.’ belong to the same genomic species. Res Microbiol. 1999;150:69–73. doi: 10.1016/s0923-2508(99)80047-3. [DOI] [PubMed] [Google Scholar]
- 35.van Loosdrecht M C M, Lyklema J, Norde W, Schraa G, Zhender A J B. The role of bacterial cell wall hydrophobicity in adhesion. Appl Environ Microbiol. 1987;53:1893–1897. doi: 10.1128/aem.53.8.1893-1897.1987. [DOI] [PMC free article] [PubMed] [Google Scholar]
- 36.Witholt B, de Smet M-J, Kingma J, van Beilen J B, Kok M, Lageveen R G, Eggink G. Bioconversions of aliphatic compounds by Pseudomonas oleovorans in multiphase bioreactors: background and economic potential. Trends Biotechnol. 1990;8:46–52. doi: 10.1016/0167-7799(90)90133-i. [DOI] [PubMed] [Google Scholar]
- 37.Z̆utić V, Ćosović B, Marc̆enko E, Bihari N, Krs̆inić F. Surfactant production by marine phytoplankton. Mar Chem. 1981;10:505–520. [Google Scholar]
- 38.Z̆utić, V., N. Ivos̆ević, V. Svetlic̆ić, R. A. Long, and F. Azam. Film formation by marine bacteria at a model fluid interface. Aquat. Microb. Ecol., in press.
- 39.Z̆utić V, Kovac̆ S, Tomaić J, Svetlic̆ić V. Heterocoalescence between dispersed organic microdroplets and a charged conductive interface. J Electroanal Chem. 1993;349:173–186. [Google Scholar]
- 40.Z̆utić V, Legović T. A film of organic matter at the freshwater/seawater interface of an estuary. Nature. 1987;328:612–614. [Google Scholar]
- 41.Z̆utić V, Svetlic̆ić V, Tomaić J. Dissolved and dispersed organic matter in natural waters. Progress by electroanalysis. J Pure Appl Chem. 1990;62:2269–2276. [Google Scholar]


