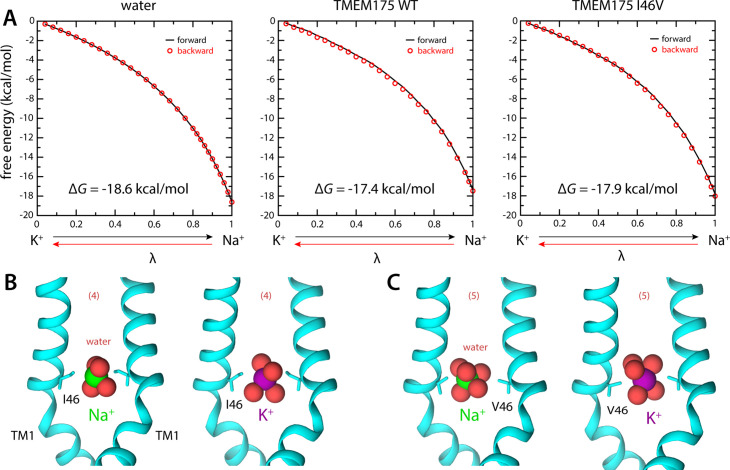
Figure 4. Ion selectivity of the isoleucine constriction.
(A) Left, free-energy difference between hydrated K+ and Na+, in bulk water, calculated with molecular dynamics (MD) simulations using the free-energy perturbation (FEP) method. The free energy is plotted as a function of a varying parameter λ that determines the size of ion (λ=0 for K+ and λ=1 for Na+). Results are shown for a calculation wherein K+ is transformed into Na+ (forward, black line) and for another carried out in the opposite direction (backward, red circles). Middle, analogous free-energy differences, calculated for an ion that is confined within the isoleucine constriction of wild-type TMEM175. Right, same as above, for the I46V mutant. Comparison of forward and backward curves provides a metric of the statistical error in these calculations, which is at most 0.1 kcal/mol. (B) Snapshots of the MD/FEP simulations at the end of the forward and backward transformations, for wild-type TMEM175 and I46V mutant. For clarity, only TM1 is shown, in cartoon representation, alongside the side chain of I46/V46. Red spheres represent the oxygen atoms of the water molecules in the first ion hydration shell, defined as in Figure 2.

