. 2022 May 17;11:e77646. doi: 10.7554/eLife.77646

Figure 1. INO1 transcriptional memory stimulates faster transcription and provides a competitive fitness advantage.

(A) Model of INO1 in the active, memory, and long-term repressed states, highlighting factors that are specifically required for memory. (B) Activation (left) and reactivation (right) of INO1 in wild type (WT) and mrs mutant strains upon starvation of inositol. Cells were harvested at indicated time points and the INO1 mRNA was quantified relative to ACT1 mRNA by real time quantitative PCR (RT-qPCR) (*p-value<0.05 from one-tailed t-test comparing WT and mrs mutant, alternative = greater). (C) Schematic of Anchor Away of Opi1 to induce INO1. (D) Top: experimental scheme for synthetic activation and reactivation of INO1. Activation and reactivation of INO1 in WT (left), mrs mutant (middle), and nup100∆ (right) strains upon removal of Opi1 by Anchor Away in the presence of inositol. Bottom: Cells were harvested at indicated time points and INO1 mRNA was quantified relative to ACT1 mRNA by RT-qPCR (*p-value<0.05 from one-tailed t-test comparing reactivation and activation, alternative = greater). (E) Chromatograms resulting from sequencing mixtures of strains having either ‘A’ or ‘C’ SNP within an integrated plasmid, as indicated (dashed box). (F) Standard curve comparing the predicted percentage of strain A (as estimated by O.D.600) with the measured percentage of A (as quantified by the relative area under the peaks, as shown in E). (G) Relative abundance of competing strains, as indicated. The log2 ratio of the abundance of the two strains after 3 hr of competition in media lacking inositol is shown. For panels B, D, F, and G, data are averages of three biological replicates ± SEM.

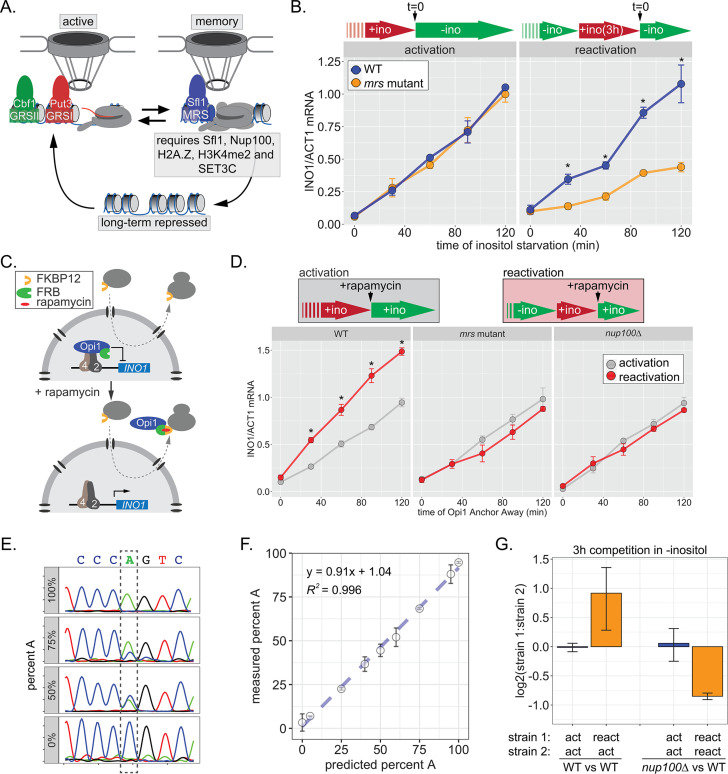
Figure 1.

Figure 1—figure supplement 1. CHO1 exhibits inositol transcriptional memory.

Figure 1—figure supplement 1.

(A) Peripheral localization of CHO1 under repressing (+inositol), activating (−inositol), or memory (−inositol →+inositol, 3 hr) conditions in either a wild type (WT) or nup100∆ strain. The average of three biological replicates ± SEM; each biological replicate counted a population of ≥30 cells. (B) Chromatin immunoprecipitation (ChIP) against H3K4me2 (left) or RNA polymerase II (RNAPII) (right) of cells grown under repressing, activating, or memory conditions. (C) Cells were harvested at the indicated time points during inositol starvation (either initial starvation or second starvation after 3 hr of repression), and CHO1 mRNA was quantified relative to ACT1 mRNA by real time quantitative PCR. For all panels, *p<0.05 from one-tailed t-test comparing to repressed condition, alternative = greater.

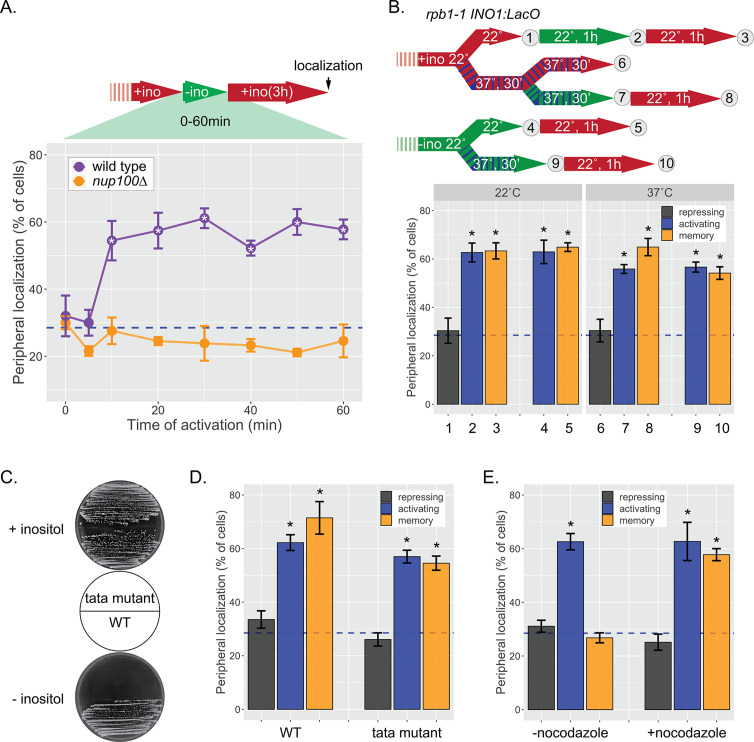
Figure 1—figure supplement 2. INO1 memory does not require transcription.

Figure 1—figure supplement 2.

(A) Cells grown in the repressing (+inositol) condition, switched to the activating conditions (−inositol) for the indicated amount of time before being returned to the repressing condition for 3 hr. After 3 hr of repression, peripheral localization was scored. *p<0.05 from one-tailed t-test comparing wild type (WT) to nup100, alternative = greater. (B) Peripheral localization of INO1 in a rpb1-1 temperature sensitive mutant strain. The permissive temperature is 22°C and the restrictive temperature is 37°C. Top: schematic of experimental design; cells were grown under either repressing (red) or activating (green) at either 22°C (solid) or 37°C (hatched) before scoring for peripheral localization. (C) Growth of WT and tata mutant cells on SDC (synthetic dextrose complete) +inositol (top) and SDC −inositol (bottom). The TATA box (5’ – TATATAAATT – 3’) at the endogenous INO1 gene was replaced with 5’ – GCGCGCCCGG –3’ using CRISPR Cas9. (D) Peripheral localization of WT and tata mutant INO1 was scored following 1 hr of inositol starvation and 3 hr of growth in +inositol. (E) Peripheral localization of INO1 under repressing (+inositol), activating (−inositol), or memory (−inositol →+inositol, 18 hr) conditions, with or without addition of nocodazole for 18 hr. Note: nocodazole-treated cells divided ≤4 times, while the untreated cells divided ~9 times. For all experiments, average of three biological replicates ± SEM; each biological replicate counted a population of ≥30 cells. For panels B, D, and E, *p<0.05 from one-tailed t-test comparing to repressed condition, alternative = greater. Blue hatched line: expected peripheral localization for a randomly localized gene.