

Abstract
Immune activation accompanies the development of proteinopathy in the brains of Alzheimer’s dementia patients. Evolving from the long-held viewpoint that immune activation triggers the pathological trajectory in Alzheimer’s disease, there is accumulating evidence now that microglial activation is neither pro-amyloidogenic nor just a simple reactive process to the proteinopathy. Preclinical studies highlight an interesting aspect of immunity, i.e., spurring immune system activity may be beneficial under certain circumstances. Indeed, a dynamic evolving relationship between different activation states of the immune system and its neuronal neighbors is thought to regulate overall brain organ health in both healthy aging and progression of Alzheimer’s dementia. A new premise evolving from genome, transcriptome, and proteome data is that there might be at least two major phases of immune activation that accompany the pathological trajectory in Alzheimer’s disease. Though activation on a chronic scale will certainly lead to neurodegeneration, this emerging knowledge of a potential beneficial aspect of immune activation allows us to form holistic insights into when, where, and how much immune system activity would need to be tuned to impact the Alzheimer’s neurodegenerative cascade. Even with the trove of recently emerging -omics data from patients and preclinical models, how microglial phenotypes are functionally related to the transition of a healthy aging brain towards progressive degenerative state remains unknown. A deeper understanding of the synergism between microglial functional states and brain organ health could help us discover newer interventions and therapies that enable us to address the current paucity of disease-modifying therapies in Alzheimer’s disease.
Supplementary Information
The online version contains supplementary material available at 10.1007/s13311-021-01179-3.
Keywords: Immunity, Neurodegeneration, Amyloid cascade, Tau, Gene variants, Transcriptome, Proteome
Introduction
Alzheimer’s disease (AD), accompanied by inexorable dementia, is a scourge of the aging population. The etiology of the sporadic forms of AD remains under intense debate. The main neuropathological hallmarks of AD are proteinaceous aggregates of amyloid β (Aβ) and tau that progress in a stereotypical fashion in the brain leading to neurodegeneration and neuropsychiatric decline [1]. AD is now acknowledged not to be a neuron-predominant disease, as evidence now supports that brain-resident non-neuronal cells (microglia, astrocytes, and oligodendrocytes), as well as peripheral immune cells (such as B cells, T cells, and neutrophils), play pivotal roles in the disease process. In this review, we focus on microglia vis-à-vis their role in the AD pathogenesis process.
Microglia and astrocytes are two of the main cell types involved in intrinsic immune function in the brain. In the past decade, the identification of several immune genes as genetic risk factors for AD has revolutionized our conceptual knowledge of the relevance of immune homeostasis in AD [2] (Table 1). Emerging at the same time, transcriptomic data from different labs have helped us characterize differential gene expression patterns in microglia associated with AD neuropathologies in mouse models and in human brain tissue [3] (Fig. 1). This information has now changed how we view microglial activation in health and disease. Functional activation of microglia, reflected in transcriptomic and morphological alterations, used to be commonly referred to as neuroinflammation or the M1 phenotype. Both these terms, “neuroinflammation” and “M1,” have now been superseded by other terms that are reflective of the dynamic functionality of the immune system. In this era of single-cell information, we have come to appreciate a wide range of microglial activation states, characterized by brain area and context-specific phenotypes that accompany the different stages of healthy aging and diseases of the brain [4–7].
Table 1.
Candidate genes expressed in microglia implicated in AD risk
| Gene | Gene name | Human cell type expression* | Direction and putative functiona,b |
|---|---|---|---|
| ABCA7 | ATP-binding cassette subfamily A, member 7 | Low expression in all cells | Variant increases AD risk; role in lipid homeostasis and membrane remodeling; functions in Aβ clearance through phagocytosis |
| ABI3/NESH | ABI gene family member 3; new molecule including SH3 | Microglia | Variant increases AD risk; may be involved in regulation of cellular migration; CNS function is uncharacterized |
| ADAM10 | A disintegrin and metallo-proteinase domain-containing protein 10 | All cells, including microglia | Variant increases AD risk; functions as a “sheddase,” especially for APP and TNFα; plays a role in neurodevelopment and synaptic plasticity |
| ALPK2 | Alpha protein kinase 2 | Microglia | Variant increases AD risk; may be involved in cellular migration though CNS function is unknown |
| APOE | Apolipoprotein E | Astrocyte | E2 variant reduces risk, E4 variant increases risk; Christchurch variant is protective; functions in Aβ clearance and tau-associated neurodegeneration |
| BIN1 | Bridging Integrator 1 | Microglia, oligodendrocyte | Variant increases AD risk; functions in clathrin-mediated endocytosis and dynamin interaction; CNS function includes synaptic vesicle recycling, APP trafficking, apoptosis, and inflammation |
| CASS4 | Cas Scaffold Protein Family Member 4 | Microglia | Variant reduces AD risk; functions as a docking protein during cell adhesion, migration, and motility; exact function unknown |
| CD33 | Myeloid cell surface antigen CD33 | Microglia | Variants reduce or increase AD risk by affecting splicing or increasing expression, respectively; functions as a sialic acid–binding immunoreceptor; may act like functional antagonists of TREM2; role in Aβ phagocytosis |
| CLU | Clusterin | Astrocyte | Variant increases AD risk; functions as a regulator of Aβ deposition as an extracellular chaperone, complement activity, and NFΚB activation; soluble form found in CSF |
| CR1 | Complement C3b/C4b receptor 1 | Low expression in all cells | Variant increases AD risk; functions as complement receptor, recognizes opsonins, inactivates C3b/C4b, and promotes phagocytosis |
| HLA-DRB1 | Major Histocompatibility Complex, Class II, DR beta 1 | Microglia | Variant increases AD risk; functions as intracellular adaptor and in antigen presentation though exact role in AD pathogenesis is unknown |
| INPP5D/SHIP1 | Inositol polyphosphate-5-phosphatase D/SH2 Domain-Containing Inositol 5′-Phosphatase 1 | Microglia | Variant reduces AD risk; interacts with DAP12 and regulates TREM2 signaling; negatively regulates myeloid cell proliferation, chemotaxis, and phagocytosis; required for endotoxin tolerance; related to autoimmunity |
| MS4A6A | Membrane Spanning 4-Domains A6A | Microglia | Variant reduces AD risk; functions in lipid sensing, protein trafficking, microglial receptor complexes, and TREM2 processing; can bind PU.1 (SPI1) |
| PICALM | Phosphatidylinositol Binding Clathrin Assembly Protein | Microglia, oligodendrocyte | Variant reduces AD risk; functions as a clathrin assembly protein though CNS function is uncharacterized; may alter Aβ by altering APP internalization and Aβ efflux across blood–brain barrier |
| PLCG2 | Phospholipase C gamma 2 | Microglia | Variant reduces AD risk; acts downstream of Syk; functions in regulating B cell development and autoinflammation; generates second messengers; variant may be a hypermorph though exact CNS function is unknown |
| SORL1 | Sortilin Related Receptor 1 | Microglia | Variant increases AD risk; functions as endocytic receptor and putative lipoprotein receptor; binds Aβ; related to APP proteolysis; exact CNS function uncharacterized |
| SPI1/PU.1 | Spi-1 proto-oncogene or Transcription Factor PU.1 | Microglia | Variant reduces AD risk; functions as a transcription factor and regulator of myeloid cell development; may play a role in phagocytosis; regulates expression of other AD risk genes such as APOE, CLU, and CD33 |
| TREM2 | Triggering Receptor Expressed on Myeloid Cells 2 | Microglia | Variants increase AD risk; member of immunoglobulin family; functions in chemotaxis, cell viability, and phagocytosis; AD variant putatively loss-of-function mutations; dichotomous effects in Aβ and tau proteinopathy models |
Many of the genes, in particular the bolded entries, correspond to loci indicating the genes that are most likely involved in AD risk
*inferred from https://www.brainrnaseq.org/: Zhang et al. (2016) (ref. [260])
aAlzPedia (Alzforum.org), retrieved July 2021
bAdapted from Hansen et al. (2018) (ref. [35])
Fig. 1.
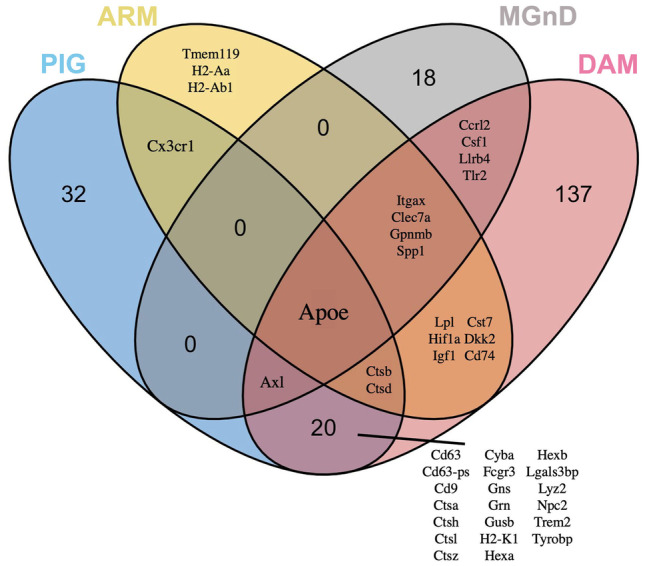
Overlap between the currently reported microglial transcriptome signatures. Comparison of upregulated gene expression profiles for PIG (blue), ARM (yellow), MGnD (gray), and DAM (pink) microglial populations demonstrates the overlap and dis-similarities in gene profiles and highlights the central role APOE plays in these populations. Gene lists were taken from each publication as follows and used to construct the Venn diagram. The ggvenn package (https://CRAN.R-project.org/package=ggvenn) in R was used to construct the plot. We acknowledge the following publications for data used to construct the plots: MGnD (Krasemann et al. 2017, ref. [73]: Supplemental Table 1 and Fig. 1A); DAM (Keren-Shaul et al. 2017, ref. [72]: Supplemental Table 7, sheet 2); ARM (Frigerio et al. 2019; ref. [152]: Fig. 1D, E and text); PIG (Chen et al. 2020, ref. [156]: Supplemental Table 3, purple module)
Immune activation, marked by microglial phenotypic changes, are thought to be at least partly responsible for triggering, or driving, the progression of the neurodegenerative cascade in AD. This AD cascade, supported by biomarker observations, posits that Aβ deposition is followed by intracellular accumulation of hyperphosphorylated tau (ptau) leading to neurofibrillary tangle (NFT) formation and neurodegeneration [8]. As the proteostasis dysfunction progressively leads to a neurodegenerative state, the microglia and other immune cells start proliferating, and in the final disease stages, microglial signaling overwhelms the CNS [9]. In reality, however, the gradual development of AD pathology, initiating with Aβ deposition and progressing to synaptic deficits, tauopathy, immune activation, and neurodegeneration, is not necessarily linear [10]. It is notable that both Aβ and tau aggregates are often found in cognitively normal aged people, which seems to suggest that some individuals may be more resilient to the pathology and its sequelae [11, 12]. Over the last decade, the role of microglial activation phenotypes as a critical non-cell-autonomous process that contributes to the onset and progression of the neurodegenerative cascade has been slowly coming into focus. Initial studies characterized inflammatory events as merely reactive gliosis, or responses to increasing Aβ or tau proteinopathy in the brain [13–16]. Preclinical studies where microglial function has been altered using various modalities have given us somewhat disparate results, with some groups reporting glial activation as beneficial and others showing that this is detrimental (Table 2). However, given that clinical trials with anti-inflammatory drugs have had no substantial benefits in AD patients [17–20], there is growing awareness that immune activation states may not be simply characterized as just “triggers” or “bystanders” in relation to AD. More importantly, recent functional genomic and transcriptomic data seem to suggest a more complex scenario. Genome-wide association studies have revealed that several immune gene variants, albeit occurring very rarely in the general population, modify AD risk, and preclinical studies indicate that these could be loss-of-function mutations [21] (Table 1). In fact, now it is thought that early microglial activation may be protective in AD [22–24], and the emergence of a succeeding wave of chronic inflammatory milieu may be functionally related to the neurodegenerative AD cascade. In fact, preclinical studies from our group have shown that inflammatory microglial signaling is not amyloidogenic per se in young mice bearing Aβ plaques [25–27]. This would fit with the observations that microglia assume a dysfunctional senescent phenotype in the later stages of AD [28], suggesting that age-progressive deterioration in microglial function (not necessarily microgliosis) directly leads to neurodegeneration. Other studies have hinted at progressive changes in gene expression patterns that underlie this conversion of homeostatic microglia to a neurotoxic phenotype [3]. Based on histopathological studies showing that microglial numbers increase steadily in early stages of AD and then subside in mature phases of the disease [29], it is possible that the microglial activation continuum has at least two phases in AD pathogenesis. It is tempting to suggest that much like the studies in radiation biology showing the limitations of linear dose–response theory [30], microglia display a hormetic response in response to the allostatic loads of progressive proteinopathy and neuronal loss in AD. How these various phases of microglial activation overlap with proteinopathy typically preceding brain organ failure, leading to either a benign (i.e., patients with neuropathology but limited dementia [31]) or a detrimental outcome (i.e., frank dementia) remains largely unknown. We have previously characterized this complex dynamic relationship as immunoproteostasis, a portmanteau of the words “immunity” and “proteostasis” (Fig. 2) [32, 33].
Table 2.
A survey of microglial functional manipulation studies in rodent models of AD. A curated selection of studies showing different outcomes of immune activation in mouse models of Aβ and tau. We acknowledge that this is only a small selection of the rich body of research available on this topic and some studies could not be cited due to space limitations
| Mouse model and manipulation | Age analyzed | Major Outcomes | Reference # | |
|---|---|---|---|---|
| Neuropathology | Neurodegeneration/Cognition | |||
| Complement | ||||
| J20 x C3 KO | 8 mo, 12 mo | ↔ Aβ | ↔ CA3 neuron | [232] |
| 17 mo | ↑ Aβ | ↓ CA3 neuron | ||
| Tg2576 x C1q KO | 12 mo, 16 mo | ↔ Aβ | ↓ CA3 degeneration (16 mo) | [233] |
| J20 x sCrry | 10-12 mo | ↑ Aβ | ↓ hippocampus neuron | [234] |
| Tg2576 (C5aR inhibitor) | 15 mo | ↓ Aβ | ↑ working memory | [235] |
| 3xTg-AD (C5aR inhibitor) | 20 mo | ↓ Aβ, ↓ tau | - | |
| JNPL3 x sCrry | 15-20 mo | ↓ tau | - | [236] |
| Cd59 KO (AAV-P301L tau) | 9.5 mo | ↑ tau | - | |
| Cytokine | ||||
| TgCRND8 (AAV-IL-6) | 5, 5.5 mo | ↓ Aβ | - | [25] |
| TgCRND8 (AAV-TNFα) | 5.5 mo | ↓ Aβ | - | [27] |
| TgCRND8 (AAV-IL-10) | 6 mo | ↑ Aβ | - | [32] |
| Tg2576 (AAV-IL-10) | 13 mo | ↑ Aβ | - | |
| APP/PS1 x IL-10 KO | 12-13 mo | ↓ Aβ | ↑ episodic, spatial memory | [59] |
| APP/PS1 x IL12b KO | 4 mo, 8 mo | ↓ Aβ | - | [237] |
| APP/PS1 x IL12a KO | 4 mo | ↓ Aβ | - | |
| APP/PS1 x IL23a KO | 4 mo | ↓ Aβ | - | |
| J20 x TgfβRIIΔK | 20 mo | ↑ Aβ | ↑ degeneration | [238] |
| APP/PS1 (AAV-IL-2) | 13.5 mo | ↓ Aβ | ↑ spatial memory, LTP deficit | [239] |
| Tg2576 x GRKO | 14 mo | ↓ Aβ | - | [240] |
| 3xTg-AD x TNF-RI/RII KO | 15 mo | ↑ Aβ, ↑ tau | ↔ LTP | [241] |
| 3xTg-AD x IL1β (XAT) + FIV-cre | 16, 18 mo | ↓ Aβ, ↑ tau | - | [81] |
| rTg4510 (AAV-IFN-γ) | 3 mo | ↑ tau | - | [86] |
| Microglia (selective) depletion | ||||
| 5x FAD (CSF1R inhibitor) | 15 mo | ↔ Aβ | - | [242] |
| 11 mo | ↔ Aβ | ↑ CA1 neuron number | ||
| 2.5 mo | ↔ Aβ | - | ||
| 5xFAD (CSF1R inhibitor) | 4 mo | ↓ Aβ | - | [243] |
| 7 mo | ↓ Aβ | ↑ synaptic plasticity genes | ||
| APP/PS1x Cd11b-HSV (TK) | 4 mo | ↔ Aβ | - | [244] |
| APP23 x Cd11b-HSV (TK) | 17 mo | ↓ Aβ | - | |
| APP/PS1 x Csf1R lox;CX3CR1-Cre/ER | 6 mo | ↓ Aβ | ↑ cognition (recognition memory) | [245] |
| 8 mo | ↓ Aβ | ↑ cognition (recognition memory) | ||
| 5xFAD x PS19 (+ tau seeding) | 7 mo | ↔ Aβ, ↓ tau | ↓ atrophy | [246] |
| rTg4510 (CSF1R inhibitor) | 15 mo | ↔ tau | ↔ cortical atrophy | [83] |
| PS19 (CSF1R inhibitor) | 4.5 mo | ↓ tau | - | [78] |
| AAV-P301L tau (CSF1R inhibitor) | 1 month p.i. | ↓ tau | normalized field potential | |
| Microglial receptor manipulation | ||||
| TgCRND8 (AAV-sTLR5) | 6 mo, 9 mo | ↓ Aβ | ↔ memory | [247] |
| TgCRND8 (AAV-sTLR4) | 6 mo | ↓ Aβ | - | |
| Tg2576 (+ TLR9 agonist) | 16-17 mo | ↓ Aβ | ↑ spatial memory | [248] |
| APP/PS1 x MyD88 KO | 3, 6, 9 mo | ↓ Aβ | ↓ spatial memory | [249] |
| Tg2576 (+LPS) | 16-17 mo | ↓ Aβ | - | [250] |
| J20 x Msr-RAGE | 9-10 mo | ↑ Aβ | ↓ spatial memory | [251] |
| J20 x Msr-DN RAGE | 9-10 mo | ↓ Aβ | ↑ spatial memory | |
| APP/PS1 (+AAV-sFKN) | 15 mo | ↔ Aβ | - | [252] |
| rTg4510 (+AAV-sFKN) | 6 mo | ↓ tau | ↔ spatial memory | |
| 3xTg-AD (+ LPS) | 5.5 mo | ↔ Aβ, ↑ tau | - | [94] |
| APP/PS1 x Cx3cl1 KO | 4 mo | ↓ Aβ, ↑ tau | - | [253] |
| APP/PS1 x Cx3cl1 (Sol Tg) | 4 mo | ↓ Aβ, ↑ tau | - | |
| hTau x Cx3cr1 KO | 2, 6, 12, 24 mo | ↑ tau | ↓ spatial memory | [82] |
| htau x Cx3cl1 KO | 6, 12 mo | ↑ tau | ↓ spatial memory (12 mo) | [254] |
| htau x Cx3cl1 (105Δ) | 6, 12 mo | ↑ tau | ↓ spatial memory (12 mo) | |
| IL-10 KO (+ LPS) | 5-6 mo | ↑ tau | ↑ TUNEL in CA3 | [255] |
| rTg4510 (+ LPS) | 5 mo | ↑ tau | - | [85] |
| AD risk factor | ||||
| APP/PS1 x Cd33 KO | 6-7 mo | ↓ Aβ | - | [256] |
| APP/PS1 x Trem2+/- | 3, 7 mo | ↔ Aβ | - | [257] |
| APP/PS2 x Trem2 KO* | 12, 22 mo | ↓ Aβ | ↑ degeneration | [258] |
| 7 mo | ↑ Aβ | - | ||
| 4 mo | ↔ Aβ | - | ||
| APP/PS1 x Trem2 KO (+ brain homogenate)* | 4 mo | ↑ Aβ | - | [67] |
| APP/PS1 x [T66M] Trem2 (+ brain homogenate) | 4 mo | ↑ Aβ | - | |
| 5xFAD x BAC-TREM2-GFP | 7 mo | ↓ Aβ | ↑ memory | [68] |
| hTau x Trem2 KO | 6 mo | ↑ Aβ, ↑ tau | - | [88] |
| 5xFAD x Trem2 KO (+AD-tau) | 9 mo | ↑ tau | - | [91] |
| PS19 x BAC-[R47H] TREM2 | 9 mo | ↓ tau | ↓ neurodegeneration | [90] |
| Others | ||||
| APP/PS1 x Nlrp3 KO | 16 mo | ↓ Aβ | ↑ learning and memory | [54] |
| PS19 x p16(INK4A)-Casp8 | 6 mo | ↓ tau | ↓ senescent glia | [134] |
| PS19 x [Cx3cr1-CreER; Atg7-fl/fl] | 12 mo | ↑ tau | ↔ neuronal loss | [259] |
| PS19 x [Cx3cr1-CreER; Atg7-fl/fl] + brain homogenate | 5 mo | ↑ tau | - | |
| Tau22 x Asc KO | 8 mo, 11 mo | ↓ tau | ↑ spatial learning | [80] |
| Tau22 x Asc KO (+APP/PS1 homogenate) | 8 mo | ↓ tau | - | |
| Tau22 x Nlrp3 KO | 8 mo, 11 mo | ↓ tau | ↑ spatial learning | |
| Tau22 x Nlrp3 KO (+APP/PS1 homogenate) | 8 mo | ↓ tau | - | |
↑ increased, ↓ decreased, ↔ no change
AAV adeno-associated virus, BAC bacterial chromosome, KO knockout, mo month, p.i. post injection
*Sex-dependent outcomes
Fig. 2.

A hypothetical depiction of the evolution of microglial function and neurodegeneration with aging. Microglia functions in tissue surveillance, cycling between activation states and homeostasis states throughout life, beginning in neonatal ages. During mid-life, several genetic (one being APOE) or environmental risk factors (lifestyle, metabolic diseases, stress, peripheral inflammation, for example) can potentially influence the balance of glial function in the brain. During this time, AD-typical neuropathology, such as Aβ and tau, also initiates in the brain and could incite glial activation. Aligned with proteostasis failure that results from the increasing neuropathological burden, immune phenotypes such as DAM, MGnD, ARM, and PIG could surface at this time, probably initiating a non-reversible immunoproteostasis phase (see Golde, 2019; ref. [33]). This immunoproteostasis paradigm reflects the complex relationship between microglia activity and evolving proteinopathy in the brain, characterized by context-dependent changes in microglial gene expression patterns. Whether these microglial profiles are related to disease staging is yet unknown (see Box 1). This transition from a prodromal to a clinical stage is thought to be characterized by loss of microglial homeostasis, reduced systemic resilience, and neurodegeneration, designated as a transition from a biochemical to a cellular phase (see Karran and De Strooper, 2016; ref. [10]). Loss of microglial homeostasis is worsened by chronic engagement of several AD-related microglial risk factors, such as TREM2/TYROBP, MS4A, INPP5D, CR1, SPI1, and CD33, with APOE playing a crucial role in inter-cellular communication. This is thought to gradually lead to a chronic activation state of the microglia and functional senescence, and subsequently, resulting in neurodegeneration and brain organ failure. The pictogram uses icons from Microsoft PowerPoint, and images (neuron and microglia) are from Smart Servier Medical Art (smart.servier.com: CC license)
Microglial Gene Variants Alter Risk of AD
Following tremendous technical advances in next-generation genomic technologies over the past decade, several new genetic risk factor genes for sporadic AD, which are predominantly of microglial origin, have been identified through multiple iterations of genome-wide association (GWA) analyses [34] (Table 1). Some of these immune function–related susceptibility genes include ABCA7, BIN1, CLU, CTSB, CTSD, CR1, EPHA1, HLA-DRB5, HLA-DRB1, INPP5A, MS4A, and PICALM. It is important to note that several of these risk genes actually implicate the entire locus as related to AD risk, which leaves a considerable knowledge gap in determining the mechanistic role of specific immune genes in AD progression.
Several recently identified risk factors such as TREM2 (triggering receptor expressed on myeloid cells 2), CD33, PILRA (paired immunoglobulin-like type 2 receptor alpha), and PLCG2 (phospholipase C γ-2) are exclusively myeloid in origin [35]. Though the function of many of these immune genes remains to be characterized, limited data available indicates that the AD-associated TREM2 mutations lead to reduced microglial signaling and activity [36, 37], suggesting that promoting microglial activity may be beneficial. Genetic risk locus involvement, together with preclinical and biomarker data, has spurred a recent hypothesis for AD [10] that modifies the original amyloid cascade hypothesis [8]. It states that an initial “biochemical” phase characterized by proteostasis abnormalities leads to accumulation of protein aggregates, which then act as immune stressors leading to a “cellular” phase driven predominantly by immune dysfunction and neurovascular abnormalities. These phases, which take decades to evolve, finally lead to neurodegeneration or the clinical phase which is marked by dementia [10] (Fig. 2). If this hypothesis were to correctly predict the evolution of the AD cascade, given that many cognitively normal aged individuals show detectable protein aggregates in their brains, how anti-inflammatory therapies could be tested in a safe window of opportunity without causing undue bystander toxicity is still a conundrum. Even with the frenetic pace of preclinical and clinical data emerging, how each of these risk factors of microglia/myeloid origin participates in brain organ health deterioration and clinical symptoms is highly debated (Box 1). Another important question is how these risk factors prompt the microglia to transition from a homeostatic to a maladaptive response in AD. Other critical questions in this regard are the following: (1) what drives pathological synergy between different cellular components of the immune system and progressively worsening abnormal protein deposits in the brain and (2) does the immune system have fail-safe mechanisms that become inactivated in symptomatic patients but not in healthy patients who may have robust amounts of neuropathology but no discernible dementia?
Box 1 Critical Knowledge Gaps in Microglial Function in AD.
Microglial functional transition as related to evolution of neuropathology burden.
Aligning the different microglial “-omic” profiles to maladaptive functional states, such as pathological aging and dementia symptoms.
Microglial functional transition between healthy and symptomatic phases – is this a reversible on–off switch?
Release or engage immune system checkpoint blockade for disease modification in AD – how is this related to microglial -omic profiles?
Microglial phenotypic heterogeneity as related to brain area-selective neurodegeneration profile along the ADRD spectrum.
Relationship of disease-specific proteinopathy strains and microglial functional states – differential role of co-pathologies and individual proteinopathies.
Microglial function as related to peripheral biomarkers.
Genetic risk variants influencing peripheral–central immune cross talk.
Diversity in microglia profiles in genetically diverse populations.
Inflammatory Processes and AD: Lessons from Preclinical Models of Amyloidosis
Neuroinflammation, on a facile level, refers to microgliosis and astrocytosis in the brain surrounding extracellular Aβ deposits and neuritic plaques [38, 39]. With the recent knowledge that the microglial activation continuum in the brain goes beyond simplistic designations of the peripheral immunity–derived M1/M2 designation [40] or the epithet “neuroinflammation,” the focus has now turned to characterizing context-dependent and spatio-temporally dependent phases of microglial activation states in health and disease.
The Aβ deposits composed of aggregated Aβ peptide also contain co-aggregating proteins, such as apolipoprotein E (APOE), ubiquitin, and complement factors. These are collectively known as damage-associated molecular patterns (DAMPs) [41, 42]. Interestingly, many of these plaque-associated proteins are themselves secreted by microglia and astrocytes and, in most cases, they are very immunogenic [43, 44]. Interaction between these Aβ-associated DAMP factors and immune cells in the brain (microglia and astrocytes) can initiate a sterile inflammation response, at least in cell culture and mouse models [42, 45]. Transcriptomic data from APP overexpression models from multiple laboratories have shown that immune activation and immunity-associated degenerative pathways are the major networks perturbed in these mouse models [9, 46–49]. This pattern of differentially expressed genes (DEGs) of the immune pathway in mouse models of Aβ is quite similar to the signature observed in human AD patients [9, 46–49] though some variations have been reported recently [50]. Overall, this suggests that Aβ-driven microglial inflammatory signaling is a pervasive signaling mechanism that is associated with the early phases of the AD cascade. It has been hypothesized that such a dysfunctional glial response on a chronic level could subsequently induce tauopathy and neuritic plaques leading to neurodegeneration [51], though the exact mechanism for this synergy is unknown. According to this sequence of events, referred to broadly as the amyloid cascade hypothesis [10], chronic microglial signaling occurring downstream of Aβ plaque accumulation could be one of the triggers that leads to tauopathy, synaptic degeneration, and neurodegeneration. Direct mechanistic evidence that immune signaling brought on by Aβ deposition plays a role in trigging tau proteinopathy and functional decline remains limited.
Some preclinical data has suggested that inflammatory reactions could also lie upstream of Aβ deposition, modulating the early formation of Aβ deposits [13, 52, 53] (Table 2). Rodent data that supports this hypothesis came from some notable studies, such as the study showing that reducing NLRP3 inflammasome activity in APP/PS1 mice reduced Aβ plaques [54]. Another study reported that deficiency of TREM2, a microglial receptor, reduces immune activation and lowered Aβ burden in mice [55]. However, data from other laboratories have firmly established that glial activation does not trigger formation of Aβ plaques and can instead confer a beneficial effect by activating microglial Aβ phagocytosis [25, 26, 32, 56–61]. Indeed, more recent data in diverse amyloid models has established that microglia can function either to facilitate phagocytic clearance of Aβ-associated DAMPs or to limit peri-plaque neuritic pathology [37, 62–64]. With the identification of several microglial genes (e.g., TREM2) whose loss-of-function variants increase AD risk [36, 65], the field has come to realize that activated microglial signaling could serve a physiologic protective function early in the disease process [33, 66]. Taking TREM2 as an example, most of the published data show that in mouse models, microglial TREM2 limits Aβ plaque deposition [67–69]. Interestingly, though having functional TREM2 limits plaque accumulation in APP/PS1 mice relative to mice lacking microglial TREM2, this effect is lost in older mice [67]. It would thus appear that though the activation of TREM2-expressing microglia is effective in reducing plaques early on, this beneficial effect of phagocytic clearance is overwhelmed at older ages as mice accumulate saturation levels of Aβ deposits. A similar outcome was observed in the CRND8 model of Aβ deposition where expressing the inflammatory cytokine IL-6 from birth induced microglial activity that slowed Aβ deposition early in life before the beneficial effect was overwhelmed as Aβ deposits rapidly increase with age [25]. On the other hand, expression of anti-inflammatory cytokines in APP mice increased Aβ deposition through various mechanisms including upregulation of murine ApoE [32, 56]. It is notable that ApoE secreted by microglia (as well as astrocytes) that might be beneficial in compaction and phagocytic clearance of Aβ early on [67] could later contribute to the emergence of microglial phenotypes in older mice that are neurotoxic and neurodegenerative. In fact, several labs have identified microglial APOE as a factor that determines whether microglia remain in homeostasis or become activated in ways that cause tissue damage and neurodegeneration [70–73]. This microglial phenotype is now known as DAM [73] or MGnD [72]. It is important to remember that ApoE is predominantly produced by astrocytes and microglia, so this would imply that the neurodegenerative process is precipitated by a concerted dysfunction of both neurons and these glial cells.
One consistent theme that emerges from these somehow disparate studies (summarized in Table 2) is that there is little consensus as to when and how microglial inflammatory signaling really transforms the environment into a neurodegenerative milieu. A recent report tackles this question in two mouse models that express physiological levels of Aβ (rather than APP overexpression). Here, the authors show that cerebral dyshomeostasis related to aberrant glutamate signaling precipitates Aβ deposition with microgliosis following the accumulation of deposits [74]. This is consistent with the proposed hypothetical timeline [10] and also confirms that inflammatory events do not precede Aβ deposition. Further, using microglial depletion strategies, it becomes apparent that dysfunction in phagocytic microglia drives further synaptic abnormalities [74], probably by induction of neurotoxic signaling involving TREM2. Taken together, these data suggest complex interactions between inflammatory activation of microglia and the deposition of Aβ in which there may be some scenarios where the inflammatory reaction could attenuate Aβ pathology through the phagocytosis process and in other scenarios where this could drive the pathological sequelae following Aβ deposition.
Inflammatory Processes and AD: Lessons from Preclinical Models of Tauopathy
As summarized in the previous sections and Table 2, microglial signaling alters brain organ health based on the context and temporal aspects. Microglia, through its phagocytotic function, can help the brain prune and repair neuronal synapses during development [75] and reduce Aβ in diseased states [33], but on the flip side, they can also participate in spreading the seeds of proteinopathy [76, 77] (Table 2). Some studies have provided evidence that phagocytosed tau within microglia can be secreted through exosomes, exacerbating tauopathy [78, 79]. Several other studies in mice have produced direct evidence that glial activation may induce tauopathy [80–82], though another group showed that simply reducing microglia does not directly affect tauopathy in the rTg4510 model [83]. Another group used a complementary approach in htau mice, i.e., depleted CNS microglia at different ages (young or old), and then in a subgroup of mice, repopulated the depleted niche with peripheral macrophages. In both instances, they did not observe any changes in tau levels [84]. This study also examined the microglial phenotype in 22-month-old htau mice and did not observe any microglial signature associated with damaged microglia (DAM phenotype) [84]. However, a previous study showed that pharmacologic depletion of microglia prevents tau spread in an adeno-associated virus (AAV) model and the PS19 model of tauopathy [78]. Other studies have shown that while glial activation may increase levels of hyperphosphorylated tau, it does not necessarily induce intracellular tangles [85]. We reported that expression of the inflammatory cytokine IFN-γ from birth increases the hyperphosphorylation of tau in rTg4510 mice [86] but expression of IL-6, another inflammatory cytokine, had no effect on pre-tangle tau levels or phosphorylated tau levels (Chakrabarty, personal communication). Our data using CNS overexpression of IFN-γ in rTg4510 mice is consistent with a report that showed similar results using injection of lipopolysaccharide, an agonist for the microglial receptor TLR4 [85]. Taken together, such studies add to the as yet undetermined role of microglia and its relationship to different co-occurring proteinopathies in AD.
The disparate nature of the relationship between microgliosis and tauopathy that emerges from these studies is very much recapitulated in mouse models of TREM2, a major immune risk factor for AD [87]. Loss of functional TREM2, which generally leads to reduced microgliosis [55] and induces tauopathy in tau transgenic mice [88], can also exacerbate neuritic plaque pathology in an APP/PS1 mouse by facilitating the tau-seeding process [89]. This latter study also showed that the AD-associated R47H mutant TREM2 reduces microgliosis and facilitates tau seeding associated with Aβ deposits [89]. In a pure model of tauopathy, this AD-associated TREM2 variant showed neuroprotective properties (reduced atrophy) when compared to the common variant [90]. Together with the data that show that ablating microglia speeds up tau seeding [91], this opens up intriguing questions regarding the relationship of Aβ, tau, and neurodegeneration to the evolving microglial function in the aging brain. Given that TREM2 deficiency by itself is related to neuropsychiatric symptoms observed in neurodevelopmental disorders such as autism [92], how mutant TREM2 influences cognitive impairment in AD dementia (irrespective of proteinopathy) in humans and preclinical models remains insufficiently understood.
Several studies have investigated how other factors impact tauopathy in mouse models. One study showed that microglial APOE drives inflammatory and neurodegenerative changes in a tau transgenic mouse model, without directly affecting tau phosphorylation levels or inducing tangle pathology [93]. Two studies showed that LPS induced microgliosis in the 3xTg-AD model (displaying both Aβ and ptau pathology) and increased ptau [94, 95]. Overall, whether microglial activation directly contributes to the generation and accumulation of AD-type pathological tau remains uncertain. While a facile explanation for such disparate observations could simply be attributed to different rodent models used in these studies, a more nuanced and physiologically relevant issue should not be overlooked. Most, if not all, of the preclinical models overexpress mutant tau which is mechanistically unrelated to AD. Importantly, the inflammatory milieu in AD brains is probably driven by Aβ and immunogenic factors coalesced within extracellular plaques. Thus, the pathological synergy between Aβ and inflammation could trigger signaling networks leading to the emergence and spread of tauopathy, which cannot be fully appreciated in pure tauopathy models.
The Dichotomous Effects of Aβ and Tau on the Inflammatory Milieu
It is clear from the ongoing discussion that Aβ and tau could potentially affect glial homeostasis differentially if present together or by itself. One of the caveats of the rich preclinical data on immune activation paradigms and AD neuropathology is that these studies have mostly been done in either Aβ or tauopathy models separately. Several studies, including data from our group, provide justification for why these studies should be performed in mouse models with mixed Aβ and tau pathologies. In mouse models with concomitant Aβ and tau (5xFADxTau22 [96] and APP/PS1xrTg21221 [97]), there is synergistic upregulation of microgliosis compared to parental transgenic lines, suggesting that microglial signaling may be a potential intermediate step in Aβ and tau mixed pathologies typical of AD. Because human data also confirms that Aβ and tau co-exist for years before the appearance of intracellular tangles [98], this compels us to not overlook how microglial signaling influences Aβ-tau co-pathologies leading to a more neurotoxic stage of the AD cascade. However, preclinical data shows that glial signaling affects Aβ and tau in dichotomous ways, when studied in isolation. We showed that CNS expression of IFN-γ and IL-6 both reduce Aβ plaques in young APP TgCRND8 mice [25, 26]. But IFN-γ increases tau phosphorylation [86], while IL-6 does not alter tau phosphorylation in MAPT rTg4510 mice (Chakrabarty, personal communication). Similar results have been noted in fractalkine, IL-1, TREM2, and TYROBP models [57, 81, 99–102] (Table 2).
Though microglial activation pathways do not likely trigger sporadic AD, the amyloid cascade hypothesis [10] postulates that sustained gliosis associated with accumulation of Aβ plaques could exacerbate tauopathy. Supported by human biomarker data, there is wide agreement that Aβ proteostasis dysfunction occurs first, followed by accumulation of soluble or phosphorylated tau, neurofibrillary tangles and neuritic plaques, and neurodegeneration [103]. This opens up the premise whether glial activation that closely follows the appearance of Aβ deposition is the missing link between Aβ deposition and subsequent neuritic pathology. This is supported by data from the 3xTg-AD model (displaying both Aβ and ptau) where LPS injection induced microgliosis and increased ptau [94, 95] (Table 2). In another study on 3xTg-AD mice, downregulation of TNF signaling through siRNA-mediated depletion of TNFRII increased both Aβ and tau, though a similar knockdown strategy for TNFRI did not have any significant effect [104].
Microglia at the Intersection of Systemic and Brain Immunity
An important aspect of microglial functionality is that it could be influenced by chronic systemic inflammation that occurs in normal aging. This phenomenon is known as inflammaging, a portmanteau of “inflammation” and “aging,” characterized by low-level chronic inflammatory signaling in the systemic circulation [105]. Intriguing links between systemic cytokine overproduction and age-progressive neuropsychiatric dysfunction have been noted — especially, increased plasma cytokine levels of IL-6 is shown to be associated with age-progressive functional decline and cognitive impairment. Indeed, IL-6 is a reliable predictor of morbidity and mortality in old age [106–108]. While the link between systemic cytokines and all-cause dementia has been documented [109–111], whether systemic immune activation contributes specifically to AD dementia is still debated [112–114]. Some recent evidence, albeit controversial, ties chronic systemic inflammatory disorders such as periodontitis and herpes infection with AD [115–117]. Metabolic syndromes, such as diabetes and obesity, could also potentially affect systemic inflammatory status and integrity of the blood–brain barrier and influence progressive changes in brain immunity and cognition in AD [118, 119]. A recent paper showed that diet-induced diabetes in transgenic mice co-expressing the APP and MAPT genes leads to microglial dysfunction, impairs microglial engagement around Aβ plaques in mice brains, and increases neuritic plaque load [120]. However, more systematic studies will need to be done to establish the relationship between these metabolic syndromes arising from peripheral immune activation leading to age-progressive deterioration in brain immune homeostasis and AD neuropathological cascade.
Aging-Associated Microglial Dysfunction and AD
Normal aging is associated with dysregulation of immune response, described as immunosenescence [121], which is associated with low-grade chronic peripheral inflammation, described as inflammaging [105]. Immunosenescence broadly refers to aging-related functional changes in the immune system, including reduced phagocytic activities of neutrophils, limited diversity in B/T cell repertoire, T cell exhaustion, and chronic production of inflammatory cytokines or inflammaging. So far, the effects of inflammaging and immunosenescence have been well-characterized for the peripheral immune system but not so for the brain. Chronic viral infections of lymphocytic choriomeningitis virus (LCMV), cytomegalovirus (CMV), hepatitis C virus (HCV), and human immunodeficiency virus (HIV) lead to immunosenescence with aging [122]. But not much is known about how these processes affect the brain and its immune milieu during aging and emergence of AD dementia.
During normal aging, microglia can undergo replicative senescence. This state is characterized by telomere shortening, accumulation of lipofuscin, reduced arborization and motility, reduced phagocytic response, increased inflammatory cytokine production, and abnormal upregulation of MHC II [123]. Intriguingly, recent data indicates that a surprisingly higher proportion of cognitively normal individuals progressively accumulate AD-similar microglial changes during aging [124]. This would suggest that aging-induced immune homeostasis failure may precede AD-typical brain organ failure by decades. This is also supported by the finding of histologically unique microglia subsets in the aging brain. These microglia are thought to correspond to some form of functionally dystrophic or senescent phenotype that is associated with iron dyshomeostasis [125]. These microglia show unique morphological characteristics, for example, spheroidal swellings and beaded tortuous processes which are conspicuously fragmented. Senescence-associated changes in microglia were noted to precede tau neuropathology [126], suggesting that these microglial changes lead to neurodegenerative outcomes. Interestingly, dystrophic microglia were highly abundant in AD patients carrying the AD risk–associated TREM2 mutation [29] compared to patients with similar neuropathology burden but lacking this TREM2 allele, suggesting that microglia carrying such mutated AD risk factors may be particularly vulnerable during aging. Additionally, other types of dysfunctional microglia have recently been characterized based on ultrastructure or differential patterns of gene expression [5, 127]. An interesting pathology-associated subtype that has gained recent attention is the “dark microglia” [128–130]. These microglia, first observed with an electron microscope, display condensed and electron-dense nucleoplasm [131] but do not have obvious apoptotic or necrotic lesions [129]. These microglia make intimate contact with cerebral vasculature as well as synaptic clefts, suggesting functional integration with maintenance of the blood–brain barrier and synaptic function, two main sites of degeneration in the AD brain [127]. It is important to note that these morphologically altered microglia have been observed in aging brains also, and thus could arise independently of Aβ and tau.
While such morphologically dystrophic microglia are frequently observed in the brains of AD patients as well as in Lewy body dementia and limbic-predominant age-related TDP-43 encephalopathy (LATE) [125, 126, 132], these microglia did not display the canonical markers of cellular senescence, such as β-galactosidase, p16, p21, or p53 [133]. Recently, in an experimental model of tauopathy, senescent microglia and astrocytes, characterized by the canonical senescence-associated β-galactosidase staining, were identified [134]. Such β-galactosidase-positive cells were also identified in the forebrain of an amyloid model of AD [135]. In this model, cellular senescence was regulated by the cGAS-STING pathway, which is associated with immune activation [136] – thus linking immune activation with glial senescence in the context of AD neuropathology.
While ultrastructure and histopathological analyses of microglia have allowed us to phenotypically characterize microglia in healthy and diseased brains [127], the recent advances in single-cell gene expression technologies have allowed us deeper and context-specific understanding of the microglia as a collection of heterogeneous cells whose function is continually evolving in synchrony with brain organ health. In the next few sections, we will describe how recent information from genomic and transcriptomic analysis has allowed us to phenotypically characterize microglia in AD.
Transcriptomics at the Level of Single Cell Focused on Specific Areas of Interest Allows Us to Identify Heterogeneity at the Molecular Level
In recent years, single-cell (sc) [137, 138], single-nucleus (sn) [139], and spatial [140] transcriptomic technologies have revolutionized our understanding of the variety and heterogeneity of various cell types in the brain. A deeper understanding of this heterogeneity will be essential for developing targeted therapeutics that might be effective in the relatively small, yet highly consequential populations of microglial cells that respond to Aβ, tau, and neurodegeneration.
In scRNA-sequencing (RNA-seq) or snRNA-seq, individual cells (or nuclei) are captured with their transcripts subsequently isolated and barcoded. Additionally, for spatial transcriptomics, spatially arrayed barcodes are overlaid on tissue sections prior to transcript isolation. These two types of studies are complementary to each other as well as to traditional bulk RNA sequencing approaches. With single-cell or single-nucleus isolation, transcript levels are examined in individual cells, allowing unique insights into cell populations that may be of low abundance within the larger context of the brain; however, the spatial resolution related to the location and environment of the cell is lost. On the other hand, while spatial data is captured in a spatial transcriptomic analysis, resolution at the level of a single cell is lacking. Together, these approaches provide a greater deal of resolution than traditional bulk RNA-seq studies but are more expensive and require specialized equipment and may, depending on sequencing depth, only detect abundant transcripts [141]. Nevertheless, these technologies can inform traditional RNA-seq datasets. Cell type–specific marker genes – gene(s) whose expression is strongly enriched in a single cell type – can classify proportions of cell populations in bulk RNA-seq data. Furthermore, multiple deconvolution methods utilize results from scRNA-seq or snRNA-seq studies to identify cell-specific changes within bulk gene expression datasets [142, 143].
By applying these techniques to the study of microglia function in AD and other neurodegenerative diseases, we now recognize the tremendous heterogeneity of microglia populations in the normal and aging brain and that there are specialized subpopulations of microglia that are disease-specific and, in the case of AD, closely associated with areas of amyloid plaques or neurodegeneration [5]. Such regional and temporal heterogeneity in microglia has important ramifications as to context-dependent response [144], which implies that microglial response to pathology is not uniform. However, it is important to note that when applied to the study of glial cell populations in the brain, the methods used to isolate the cells may cause artifactual changes in gene expression unrelated to the disease process [145]. Nevertheless, these evolving technologies have revolutionized our view of microglia as having either resting (M0), pro- (M1), or anti- (M2) inflammatory profiles [40] to one where microglia are diverse and non-homogeneous and have specialized subsets that are disproportionately responsive following various insults.
Transcriptomic Data Provide Systems-Level Insights into Microglial Phenotypes in the AD Cascade
While preclinical modeling of immunity in transgenic AD mouse models has enriched our scientific knowledge as to the involvement of microglial signaling in AD, the recent spate of multidisciplinary international collaborative efforts using principles of systems biology has provided unique insights into microglial function as never before [146–148]. These unbiased exploratory approaches using genomic, transcriptomic, proteomic, and metabolomic datasets could eventually lead to a deeper understanding of the functional importance of microglial activation states in the AD cascade, though knowledge gaps remain as to the overlaps between the different activation states as well as their functional concordance with disease stages (Box 1).
In the next sections, we describe the current state of the knowledge on microglial transcriptomic data and how this has enriched our understanding of the diversity in microglial signaling pathways in AD (Fig. 1).
Transcriptomic Analysis Identifies Several Unique Alzheimer's Disease-Associated Microglia Phenotypes
Homeostatic Microglia
Homeostatic or resting state microglia constantly surveil the brain, hunting for injury or insult, and express a transcriptional repertoire that includes transmembrane proteins and receptors involved in sensing and responding to environmental signals (the sensome) [149] and rely on TGF-β signaling [150, 151]. Nearly universally, microglia that are associated with inflammatory states or are responsive to injury downregulate homeostatic gene expression signatures.
Homeostatic microglia themselves appear to also display heterogeneity [5]. Multiple studies have identified at least two homeostatic microglia subpopulations which are present at roughly equivalent numbers in the normal state [152–154]. There is considerable overlap between the two homeostatic microglial populations in terms of their gene expression profile with well-studied microglial genes (TMEM119, P2RY12, CX3CR1) common in both cell subpopulations. However, one of these subpopulations of homeostatic microglia (H2M) may be more sensitive to aging as they are present at slightly lower levels in older mice and may be primed to respond more rapidly to an activated state [152].
Disease-Associated Microglia
Single-cell sequencing from normal and AD brains identified a unique population of protective microglia called the disease-associated microglia (DAM) [72]. DAMs make up a small (~7% combined) proportion of the microglia surveyed and are hypothesized to be a protective subtype of microglia that are activated in a progressive, two-step process that requires TREM2-independent and TREM2-dependent stages. The first, TREM2-independent stage initiates with a downregulation of homeostatic genes (CX3CR1, P2RY12, TMEM119) and upregulation of AD-associated genes (APOE, CTSB, CTSD). The subsequent TREM2-dependent stage of DAM activation involves upregulation of genes involved in phagocytosis and lipid metabolism (CST7, LPL). In mouse models of amyloid deposition and in the human AD brain, these cells are closely associated with Aβ deposits and are hypothesized to actively participate in remodeling Aβ plaques. Many genes involved in DAM activation are also microglial genes previously implicated in AD via genome-wide association study (GWAS) - these include APOE, TREM2, CST7, and LPL. Importantly, this microglial population is likely not specific to Aβ pathology as a similar population was found in mouse models of ALS, FTD, and CK-p25 [72, 155]. These microglial genes could possibly be responsible for maintaining proper checkpoints along the activation pathway which could prevent uncontrolled microglial activation.
MGnD Neurodegenerative Microglia
The MGnD cluster of microglia, distinct from homeostatic microglia, was identified in mouse models of ALS, AD, and multiple sclerosis [73]. This microglial population arises in response to degenerating/apoptotic neurons inducing the TREM2-APOE pathway along with suppression of the TGF-β pathway involved in regulating homeostatic microglial function. Progression of microglia to the MGnD neurodegenerative phenotype involves the downregulation of homeostatic genes and upregulation of at least 28 inflammatory genes, including APOE. As MGnD microglia closely associate with Aβ plaques and dystrophic neurites, they are thought to form a microenvironment which may influence disease progression and provide a potential therapeutic target via the TREM2-APOE pathway. Given that this microglial population was identified across multiple neurodegenerative models, MGnD, like DAMs, may represent a general response to neurodegenerative insults.
Activated Response Microglia
snRNA-seq of microglial cells in a progressive amyloid mouse model identified two distinct microglial subpopulations - activated response microglia (ARM) and interferon response microglia (IRM) - that are activated during normal aging [152]. Among these two profiles, only the ARM population responds to Aβ deposition. IRMs are highly enriched in genes involving the innate immune response and interferon response pathways. Other microglial populations were identified in this study including the transiting response microglia (TRM), which had a similar transcriptional profile to the ARMs, albeit at lower levels, and the cycling and proliferating microglia (CPM), which made up a very small percentage of the overall microglial population. ARMs express genes involved in inflammatory processes, MHC class II presentation, and tissue regeneration – a number of which overlap with previously identified AD GWAS hits including APOE and TREM2. During normal aging, the ARMs make up approximately 10% of all microglia, but in the presence of Aβ, ARMs become the major microglial subtype. In the area surrounding amyloid plaques, microglia are the major source of APOE expression and depleting APOE prevents the ARM (but not IRM) response to amyloid. However, as only amyloid models were investigated in this study [152], it remains to be determined whether or not the ARM response to limited to microglial responses to Aβ deposition.
Plaque-Induced Genes
A comprehensive spatial transcriptomic study from the De Strooper lab [156] identified two gene co-expression networks of cells in the area immediately surrounding Aβ plaques — an early response oligodendrocyte (OLIG) module composed of myelin and oligodendrocyte genes and a module of plaque-induced genes (PIGs) encompassing multiple cell types. The OLIG module is not modulated by Aβ deposition whereas the PIG module is highly sensitive to Aβ. The PIG module is composed of several cell types and involves 57 genes which regulate the complement cascade and downstream pathways and partially overlaps with genes identified in A1 astrocyte population [157] as well as with DAM/ARM genes [73, 152]. The PIG module highlights the coordinated cross talk between astrocytes and microglia and is regulated by APOE, TREM2, and members of the complement cascade pathway. Like the ARM population, it is unknown whether the PIG response is restricted to Aβ deposition as only amyloid mouse models were used in this investigation.
One important aspect that is highlighted from these transcriptomic studies is that different types of protein deposits or species may alter the microglial DEG in unique ways. In a recent study from our lab [158], we studied transcriptional responses in primary cultured microglia to amyloid conformations in vitro and compared these to bulk RNA-seq dataset obtained from the APP transgenic TgCRND8 mice of different ages. The TgCRND8 mice produce both Aβ40 and Aβ42 peptides resulting in a mix of cored and diffuse amyloid deposits. In these mice, the patterns of microglial response to the Aβ proteinopathy were progressive but the signature remained consistent throughout the life of the mouse, irrespective of the quantitative variation of the type of Aβ deposits. Interestingly, in the primary microglia cultures treated with different forms of Aβ conformers, we identified distinctive microglial profiles corresponding to fibrillar, monomeric, or oligomeric forms of Aβ. We found increased homeostatic microglial gene expression profile in microglia treated with fibrillar Aβ42 for 12 h, which was not seen following 12-h treatment of oligomeric Aβ42 or 1-h treatment of fibrillar Aβ42. Transcriptional profiles corresponding to the MGnD signature [72] were increased across all treatments while DAM signatures [73] were increased for fibrillar Aβ42 but not oligomeric Aβ42 treatments. Intriguingly, ARM [152] and PIG [156] signatures were either unchanged or decreased across all Aβ42 treatments. With the caveat that primary cultures are often not reflective of in vivo molecular changes [150], our results nonetheless bring forth an important aspect of heterogeneity of microglial response to different conformations of Aβ that is illuminated due to the reductionist aspect of culture systems. Such data can provide us insights into the evolution of microglial dysfunction in the continuum of neuropathological changes in the AD brain.
Together, these studies highlight the convergence of select subpopulations of amyloid-responsive microglia on the APOE/TREM2 pathway (Fig. 1). These data show how the microglial DEGs evolve with proteinopathy deposits and emergence of neurodegenerative signals. While many of the identified microglial populations share similar transcriptional profile and affected pathways, there are considerable differences among these profiles. Such differences could be due to a number of factors including the techniques used to isolate the cells and the various experimental models used in identifying the cell populations. As to the different nomenclatures of microglial activation signatures reported by various research groups, it should be noted that these all represent similar morphological activation states of microglia and caution should be warranted in further interpreting these profiles. Indeed, though all of these studies have reported transcriptionally homogenous microglial clusters, data from a recent study points to a transcriptional continuum, especially as it relates to homeostatic microglia [144]. It is possible that the differences (and similarities) in these profiles are more reflective of the experimental methodology and the experimental model used to characterize these signatures. In general, the systems-level changes in rodent models are characterized in binary forms (presence or absence of statistical significant DEG), whereas, in actual human brain, the neurodegenerative cascade may be more complex and contextually unique. Thus, additional work is needed to determine to what degree the functions of these microglial populations overlap; whether these populations represent broad (or, perhaps, more disease-specific) responses to amyloid, tau, synaptic pathology, and neurodegeneration; whether differences in gene expression profiles drive specific functions of the microglia; and what their functional significance is to the AD cascade in humans.
Relationship Between Genetic Linkage Data and Microglial Gene Expression
Many of the disease-associated variants identified in GWA studies do not result in deleterious changes in the protein-coding region of the gene [159]. In such cases, no obvious function can be assigned to the variant and they are oftentimes found in strong linkage disequilibrium with surrounding variants such that any variant within the haplotype could be the functional/causative culprit. Because of this, a mechanism involving the regulation of gene expression is invoked to explain the functional consequences of these variants. Interpretation of these non-coding variants in the context of genome-wide gene expression levels of the parent genes results in the concept of expression quantitative trait loci (eQTL). Identification of eQTLs is aided by large-scale projects unrelated to AD brain analysis, such as ENCODE [160], the Epigenome RoadMap [161], RegulomeDB [162], and GTEx [163], that generate annotated maps of biochemically characterized regulatory regions.
In a broad GWA study of adult neurological disorders, over 20% of associated SNPs were identified as brain cis-eQTLs localized within 1 Mb of the target gene [164]. Variants also exert effects on transcript levels over a greater distance – greater than 1 Mb from the location of the SNP – and in AD almost 30% of non-coding variants reside in enhancer regions and are thought to act by modulating the higher-order chromatin structure [165]. Generally, these studies indicate that an AD-associated SNP can have either local (cis-eQTL) or long-range (trans-eQTL) regulatory effects on the expression of other genes.
In AD and other neurodegenerative disorders, effects of AD-associated GWA variants affect the expression of microglia-enriched genes in brain-resident microglia as well as in immune cells in the blood. Some AD-risk variants found in microglial genes CD33 and C2AP were identified as their own eQTL in the brain as these influenced their own expression levels [166]. Other local effects of eQTLs on microglial gene expression are demonstrated by the influence of AD-associated SNPs localized in ZCWPW1, but which affected the expression of PILRB [167]. Notably, in myeloid cells, the absence of PILRB increases cytokine production resulting in inflammatory responses in the brain [168]. AD risk variants in the CELF1 haplotype affect the expression of SPI1 [169], which encodes the PU.1 transcription factor that is critical for myeloid cell development [170]. Low levels of SPI1 expression is linked to delayed AD onset [169], and entirely removing SPI1 expression dampens homeostatic microglia responses in the brain and increases microglial apoptosis [171].
Cell type–specific QTL (ct-eQTL) analysis can reveal the effects of SNPs on small populations of cells within the brain. By incorporating proxy genes representing specific cell types into the model that identifies eQTLs, this approach has identified the influence of genetic loci on gene expression that are lost with a traditional eQTL. Using this approach, gene–SNP eQTL pairs were identified in interferon-responsive pathways in myeloid cells in the blood and brain – ct-eQTL signals that were lost when using a conventional eQTL approach [172]. A separate approach utilized cell type–specific expression datasets from scRNA-seq analysis of microglia to identify a putative regulatory role for a genetic risk variant in BIN1 on its expression levels [173]. With larger sample sizes, this approach could be applied to identify genetic variants that directly affect specific population of microglia responsive to Aβ, tau, and neurodegeneration.
SNPs in a single gene or haplotype can have broader effects than the relatively local effects on the expression of their own or neighboring genes as described above. This can be mapped onto a co-expression network. Such network analyses using genome-wide expression data show that genes that are expressed together are often co-regulated. By combining co-expression networks with eQTL analyses, recent studies have underscored the importance of this systems approach. Yang and colleagues [174] used previously identified gene co-expression modules linked to AD pathological and cognitive phenotypes [175] together with GWA data to identify variants in TMEM106B and RBFOX1 haplotypes that act as module QTL (modQTL) affecting the expression of genes within specific co-expression modules. Notably, though RBFOX1 is a neuronally expressed RNA-binding protein that regulates mRNA metabolism in neurons, the RBFOX1 modQTL SNP can affect the expression of microglial genes that comprise this co-expression module [174]. Additionally, variants in RBFOX1 have been previously associated with increased amyloid-related positron emission tomography (PET) signals [176]. Another study, Salih et al. compared the overlap between genetic variability in key microglial genes with microglia-enriched, amyloid-responsive modules identified via a co-expression network and found that a number of these microglial genes are associated with AD risk [177].
Collectively, these studies highlight the effects that genetic variation can have on microglia-specific gene expression. Importantly, these QTL studies indicate that genetic variability in microglial gene expression levels can alter their responses to amyloid and can significantly affect the risk for AD. Furthermore, such gene–SNP QTL pairs represent potential therapeutic targets for controlling microglial inflammatory responses to AD-typical changes.
Proteomic Approaches Reveal Immune Factors Associated with Disease Progression
Activated microglia and astrocytes are found in close association with protein inclusions in post-mortem analysis of AD patient brains. Since these analyses are done in a cross-sectional manner, these outcomes reflect the agonal state of the brain and the catastrophic level of brain organ failure occurring at the end stage of a patient’s life. This would explain why immune signaling emerges as the overwhelmingly predominant pathway in the transcriptional studies done in patient brains. However, this does not explain how, if at all, immune signaling influences the development and progression of the disease and whether altered brain immunity plays a differential role in asymptomatic healthy aging and in symptomatic AD population. Another issue to consider is that protein levels cannot always be inferred from RNA levels [178–182], leading to a discrepancy between transcriptome data and functional outcome. Indeed, global co-expression analyses fail to show high degrees of overlap between proteome and transcriptome networks in AD [183, 184]. In other cases, disease phenotypes have been shown to better correlate with post-transcriptional and post-translational modifications which are not reflected in the RNA or genomic data [185]. Additionally, some of the differentially expressed genes or proteins coded by risk factors are differentially compartmentalized as the disease progresses. A prime example of this is the APOE protein (produced by astrocytes and microglia mainly), which directly binds to Aβ [186] and is selectively sequestered in association with Aβ plaques in an extracellular location. Other examples include immune factors such as midkine and netrin 1, which because of their affinity to Aβ, co-localize with extracellular plaques [187].
Recent advances in proteomics and metabolomics have started to address the ante-mortem biological alterations leading to disease phenotype and neuropathological trajectory. In the next pages, we will briefly discuss proteomic data in the context of immune activation, but for a comprehensive viewpoint of metabolomics as AD biomarkers, the readers are directed to these excellent publications [188–193].
Ultrasensitive and high-throughput mass spectrometry using either label-free methods or isobaric labeling methods have been used to analyze the proteome from brains, cerebrospinal fluid (CSF), and plasma of AD patients at different stages of the disease [184, 187, 194–196]. Such unbiased or even targeted proteome analysis could potentially identify biological pathways that help us define disease stages and characterize pathways affecting disease progression. This knowledge, along with genetic or epigenetic risk factors in an individual, could help us generate a framework for targeted therapeutics in vulnerable populations. These mass spectrometric studies have been done on different patient cohorts such as Goizueta ADRC [184], Brain and Body Donation Program at Banner Sun Health Research Institute [187], Mt Sinai ADRC [187], European Medical Information Framework for Alzheimer’s Disease Multimodal Biomarker Discovery (EMIF-AD MBD) and Alzheimer’s Disease Neuroimaging Initiative (ADNI) [195], and the Hong Kong Chinese AD cohort [196]. Network analysis of protein co-expression modules shows that cell type perturbations, driven by increased presence of glia-enriched modules and reduction in neuronal modules, characterize most of these datasets. Interestingly, one proteomic dataset reported the appearance of a protective “anti-inflammatory” glial response in patients in early stages of AD [184], followed later by the emergence of a module indicative of vascular-mediated inflammation [184]. Integrative analysis of mass spectrometry and multi-omic dataset pathways from patients at different disease stages identified several pathways, including amyloid cascade, immunity, complement, WNT (Wingless/Integrated) signaling, TGF-β and BMP (Bone Morphogenetic Protein) signaling, lipid metabolism, iron homeostasis, and membrane transport [187]. This study investigated cognitively normal samples with high or low Aβ burden, mild cognitively impaired patients, AD patients, and primary tauopathy patients and identified three distinct proteome clusters that were temporally regulated in the AD continuum. The innate and adaptive immune factors were upregulated early on and accumulate progressively while complement proteins remained stable early and increased much later in the disease process [187]. This dataset was integrated with other -omics data producing a ranked order of four major categories of enriched pathways encoding Aβ/tau, immunity, growth and development, and metabolism- and membrane transport–related proteins. Another study stratified patients into biological subtypes based on three clusters of proteome alterations indicating (i) hyperplasticity (with increased BACE1 levels), (ii) innate immune activation, and (iii) blood–brain barrier dysfunction (with low BACE1 levels) [195]. Given that (some of) these patients were matched for genetic risk factors, comorbidities, and neuropathology severity, it would seem that these different clusters represent inherent heterogeneity in AD patients. Since early studies in the field characterized patient subtypes based on CSF amyloid, tau, and ubiquitin levels [197, 198], this recent study adds more nuanced and mechanistic insights into AD heterogeneity as it captures more biological information related to altered signaling pathways. Another recent study of plasma proteins identified a panel of 19 “hub” proteins as part of co-expression networks correlated with disease stage–specific dysfunction [196]. Most of the downregulated proteins in these clusters were related to inflammatory processes or apoptosis, and upregulated proteins corresponded to cell proliferation pathways and chemotaxis. These protein clusters showed heterogeneity as some were correlated with the A/T/N signature while others did not [196]. CSF-associated immune proteins identified from at least two studies, such as YKL-40 and sTrem2, are associated with disease severity [195, 199] and together with data from preclinical modeling could rise to the level of being considered stage-specific biomarkers of AD [200–203]. Some of these proteomic signatures are associated with the APOE genotype [204] suggesting that these could be used towards stratifying proteomic data based on genetic risk factors. In the future, integrating the proteomic signatures from the brain, CSF, and plasma with other omic measures could potentially lead to characterization of disease stage–specific biomarkers for AD that would be informative of the evolving continuum of microglial activation patterns during the different stages of AD dementia.
Therapies Targeting the Immune System: Hits (in Rodents) and Misses (in Clinical Trials)
Early epidemiologic data showed that aging cohorts who were taking non-steroidal anti-inflammatory drugs (NSAIDs) for more than 2 years were protected from AD [205, 206]. Several trials with NSAIDs, such as indomethacin, diclofenac, nimesulide, naproxen, and rofecoxib, which showed promise in rodent proteinopathy models [207, 208], however, did not result in cognitive improvement in clinical trials [209, 210]. Similarly, a 2-year trial using the anti-inflammatory antibiotic minocycline also failed to show any clinical benefits in mild AD patients [211]. Failure in these trials was attributed to insufficiencies in study design [212] or to multiple sources of implicit/explicit biases [213]. In fact, long-term clinical trials with naproxen had to be halted due to emergence of cardiovascular side effects [214] and a 7-year follow-up of these enrolled patients showed no clear benefit against dementia [215]. Indeed, later analysis showed that anti-inflammatory therapies such as rofecoxib (marketed as Vioxx®) led to serious adverse events [17]. Some of these NSAIDs, referred to as gamma secretase modulators, were shown to also inhibit Aβ production [216–218]. However, a multicenter, randomized, double-blind, placebo-controlled phase 3 trial on mild AD patients using one such gamma secretase modulator, tarenflurbil, also failed to correct functional decline [219].
At this present time, there is a concern that broad therapeutic targeting of the immune system, especially in symptomatic patients, may lead to worse outcomes. Adverse outcomes in anti-inflammatory therapies might be related to peripheral effects (such as the cardiovascular effects observed in NSAID trials), and any treatment activating the endogenous immune function could lead to CNS effects such as accelerating dementia conditions (such as those observed in sepsis or in inflammaging conditions). Preclinical rodent studies showed that activating gliosis could reduce Aβ [26, 57] but induce selective neurodegeneration [220] or induce tau pathology [81]. Assuming that rodent studies predict human disease landscape, these preclinical data indicate the necessity of designing immune therapies specifically targeting unique disease stages and microglial phenotypes.
Fundamental differences in microglial biology in mice and humans might also confound the therapeutic translational potential of preclinical data. Aside from the fact that the immune landscape could be distinct in mice and humans [221], recent genetic deletion models of TREM2 and TYROBP also could not recapitulate the full range of TREM2-related phenotypes such as found in humans with rare TREM2 or TYROBP mutations. These patients suffer from the Nasu–Hakola disease (polycystic lipomembranous osteodysplasia with sclerosing leukoencephalopathy or PLOSL), which is also associated with early dementia but is primarily characterized by bone cysts [222]. Of particular interest is that the extent of heterogeneity in microglial transcriptome signatures is much higher in humans than in rodents even in steady state [221]. The absence of such deep layers of complexity in microglial transcription states in rodents could moderate the predictive value of preclinical studies conducted in rodents.
Systems-level data emerging from mouse models and detailed analysis of heterogeneous clinical cohorts support the presence of age-progressive and phased immune responses in the brain. There is increasing appreciation of an AD continuum, based on the enormous genetic and biological heterogeneity in patients exhibiting clinical dementia. These studies have led to the formation of precision medicine initiatives, such as the international Alzheimer Precision Medicine Initiative (APMI), the USA-based PMI, and the “All of Us Research Program” [223]. Such precision medicine initiatives could, in theory, one day, integrate genetic, transcriptomic, and proteomic datasets from heterogeneous populations to efficaciously target specific pathways at specific disease stages in susceptible individuals. There are some efforts to integrate immune components into these initiatives targeting AD patients, such as the “Korean AD Research Platform Initiative Based on Immune-Inflammatory Biomarkers” (K-ARPI) [224].
Conclusions
The pathological role of sustained microglial signaling in AD is bolstered by both post-mortem and ante-mortem biomarker analysis in human patients showing that microglial activation is an underlying feature in AD patients [225–227]. In particular, several neurotoxic damage-associated microglia-specific transcriptomic signatures have been identified in mice as well as a human-specific microglial signature observed in AD patients and in normal aging [50, 72, 228, 229]. However, in spite of the prevalent theory that microgliosis is a critical link between Aβ, tauopathy, and neurodegeneration, microglial signaling events that lead to neurodegeneration in the presence of Aβ, tau, and other co-occurring pathologies have not been defined (Box 1). While transcriptomic signatures have revealed key pathways that are upregulated in a cell type–specific manner, how much of these changes are co-incident with functional perturbation of brain homeostasis leading to neurodegenerative changes is still unknown. In concert with emerging proteomic signatures, such data will be transformative as we arrive at the age of personalized medicine [148].
There is a growing consensus that chronic gliosis that is associated with Aβ plaques (as revealed by transcriptomic data from rodent Aβ models) can contribute to CNS dysfunction, though the ultimate pathological role of microglial activation in AD, as gleaned from data from individual Aβ and tau preclinical models, remains to be resolved. Data indicates that these different microglial transcriptomic signatures identified so far in mouse models may not be fully representative of the neurodegenerative pathways in the human brain. It is possible that the degenerative sequence in the human brain cannot be neatly explained in such experimentally well-defined signatures but rather would be a result of the system devolving into chaos where microglia deviate from their usual surveillant and phagocytic function. In the end, we might realize that AD is not a monolithic disease and that the AD cascade does not proceed equally linear for all individuals (unlike transgenic rodent models of the disease). This also segues to another cautionary note as the neurodegeneration-associated microglial profiles may not be completely overlapping between the rodent models and humans [50, 230]. Based on an individual’s genetic risk factors and epigenomic perturbations, it is possible that microglial or immune signaling will play very unique roles in disease induction and progression, an aspect that may not be completely recapitulated in rodent models. Thus, the critical question of “does activated microglia cause neurodegenerative dementias” remains unanswered.
In humans, advanced biomarker studies have helped establish the continuum of pathological changes occurring in the AD brain [98, 231]. Though the measures of immune activation (plasma sampling, CSF sampling, or brain imaging) are still being resolved, there is wide agreement that Aβ deposition precedes the accumulation of phosphorylated tau and neurodegeneration in AD [103]. The question remains as to the placement of microglial signaling in this evolving cascade (Fig. 2). Bearing in mind that the several different types of microglial signatures and phenotypes have now been characterized, there is no need for carefully parsing out a staging system unique to microglial involvement just as has been done for the neuropathological Braak staging in the AD patient brain.
Supplementary Information
Below is the link to the electronic supplementary material.
Acknowledgements
We apologize to authors whose works were not cited due to space limitations.
Required Author Forms
Disclosure forms provided by the authors are available with the online version of this article.
Abbreviations
- AAV
Adeno-associated virus
- Aβ
Amyloid β
- AD
Alzheimer’s disease
- ADRD
Alzheimer’s disease and related dementias
- ADNI
Alzheimer’s Disease Neuroimaging Initiative
- ALS
Amyotrophic Lateral Sclerosis
- APMI
Alzheimer Precision Medicine Initiative
- APOE
Apolipoprotein E
- ARM
Activated response microglia
- BACE1
Beta-site amyloid precursor protein cleaving enzyme 1
- BMP
Bone Morphogenetic Protein
- CMV
Cytomegalovirus
- CNS
Central Nervous System
- CPM
Cycling and proliferating microglia
- CSF
Cerebrospinal fluid
- ct-eQTL
Cell type–specific expression quantitative trait loci
- DAM
Disease-associated microglia
- DAMPs
Damage-associated molecular patterns
- DEG
Differentially expressed genes
- EMIF-AD MBD
European Medical Information Framework for Alzheimer’s Disease Multimodal Biomarker Discovery
- eQTL
Expression quantitative trait loci
- FTD
Frontotemporal dementia
- GWA
Genome-wide association
- H2M
Homeostatic microglial subpopulation
- HCV
Hepatitis C virus
- HIV
Human immunodeficiency virus
- h
Hour
- IRM
Interferon response microglia
- K-ARPI
Korean AD Research Platform Initiative Based on Immune-Inflammatory Biomarkers
- LCMV
Lymphocytic choriomeningitis virus
- LPS
Lipopolysaccharide
- MGnD
Microglial neurodegenerative phenotype
- NFT
Neurofibrillary tangle
- NSAIDs
Non-steroidal anti-inflammatory drugs
- OLIG
Oligodendrocyte
- PET
Positron emission tomography
- PIG
Plaque-induced genes
- PLOSL
Polycystic lipomembranous osteodysplasia with sclerosing leukoencephalopathy
- ptau
Hyperphosphorylated tau
- sc
Single-cell
- RNA-seq
RNA-sequencing
- sn
Single-nucleus
- TRM
Transiting response microglia
- WNT
Wingless/Integrated
Funding
The authors were supported by Florida Department of Health grant 8AZ16 (PC), 1Florida ADRC P30AG066506 (PC, KNM), and 1RF1AG064914 (KNM).
Footnotes
Publisher's Note
Springer Nature remains neutral with regard to jurisdictional claims in published maps and institutional affiliations.
References
- 1.Vinters HV. Emerging concepts in Alzheimer’s disease. Annu Rev Pathol. 2015;10:291–319. doi: 10.1146/annurev-pathol-020712-163927. [DOI] [PubMed] [Google Scholar]
- 2.Efthymiou AG, Goate AM. Late onset Alzheimer’s disease genetics implicates microglial pathways in disease risk. Mol Neurodegener. 2017;12(1):43. doi: 10.1186/s13024-017-0184-x. [DOI] [PMC free article] [PubMed] [Google Scholar]
- 3.Deczkowska A, et al. Disease-associated microglia: a universal immune sensor of neurodegeneration. Cell. 2018;173(5):1073–1081. doi: 10.1016/j.cell.2018.05.003. [DOI] [PubMed] [Google Scholar]
- 4.Leng F, Edison P. Neuroinflammation and microglial activation in Alzheimer disease: Where do we go from here? Nat Rev Neurol. 2021;17(3):157–172. doi: 10.1038/s41582-020-00435-y. [DOI] [PubMed] [Google Scholar]
- 5.Masuda T, et al. Microglia heterogeneity in the single-cell era. Cell Rep. 2020;30(5):1271–1281. doi: 10.1016/j.celrep.2020.01.010. [DOI] [PubMed] [Google Scholar]
- 6.Walker DG. Defining activation states of microglia in human brain tissue: an unresolved issue for Alzheimer’s disease. Neuroimmunol Neuroinflam. 2020;7:194–214. [Google Scholar]
- 7.Boche D, Gordon MN. Diversity of transcriptomic microglial phenotypes in aging and Alzheimer’s disease. Alzheimers Dement. 2021. [DOI] [PMC free article] [PubMed]
- 8.Selkoe DJ, Hardy J. The amyloid hypothesis of Alzheimer’s disease at 25 years. EMBO Mol Med. 2016;8(6):595–608. doi: 10.15252/emmm.201606210. [DOI] [PMC free article] [PubMed] [Google Scholar]
- 9.Canchi S, et al. Integrating gene and protein expression reveals perturbed functional networks in Alzheimer’s disease. Cell Rep. 2019;28(4):1103–16 e4. [DOI] [PMC free article] [PubMed]
- 10.Karran E, De Strooper B. The amyloid cascade hypothesis: Are we poised for success or failure? J Neurochem. 2016;139(Suppl 2):237–252. doi: 10.1111/jnc.13632. [DOI] [PubMed] [Google Scholar]
- 11.Jagust W. Imaging the evolution and pathophysiology of Alzheimer disease. Nat Rev Neurosci. 2018;19(11):687–700. doi: 10.1038/s41583-018-0067-3. [DOI] [PMC free article] [PubMed] [Google Scholar]
- 12.Jack CR, Jr, et al. NIA-AA Research Framework: Toward a biological definition of Alzheimer’s disease. Alzheimers Dement. 2018;14(4):535–562. doi: 10.1016/j.jalz.2018.02.018. [DOI] [PMC free article] [PubMed] [Google Scholar]
- 13.Akiyama H, et al. Inflammation and Alzheimer’s disease. Neurobiol Aging. 2000;21(3):383–421. doi: 10.1016/S0197-4580(00)00124-X. [DOI] [PMC free article] [PubMed] [Google Scholar]
- 14.Eikelenboom P, Rozemuller JM, van Muiswinkel FL. Inflammation and Alzheimer’s disease: Relationships between pathogenic mechanisms and clinical expression. Exp Neurol. 1998;154(1):89–98. doi: 10.1006/exnr.1998.6920. [DOI] [PubMed] [Google Scholar]
- 15.Rogers J, et al. Inflammation and Alzheimer’s disease pathogenesis. Neurobiol Aging. 1996;17(5):681–686. doi: 10.1016/0197-4580(96)00115-7. [DOI] [PubMed] [Google Scholar]
- 16.McGeer PL, et al. Activation of the classical complement pathway in brain tissue of Alzheimer patients. Neurosci Lett. 1989;107(1–3):341–346. doi: 10.1016/0304-3940(89)90843-4. [DOI] [PubMed] [Google Scholar]
- 17.Aisen PS, et al. Effects of rofecoxib or naproxen vs placebo on Alzheimer disease progression: a randomized controlled trial. JAMA. 2003;289(21):2819–2826. doi: 10.1001/jama.289.21.2819. [DOI] [PubMed] [Google Scholar]
- 18.Breitner JC, et al. Extended results of the Alzheimer’s disease anti-inflammatory prevention trial. Alzheimers Dement. 2011;7(4):402–411. doi: 10.1016/j.jalz.2010.12.014. [DOI] [PMC free article] [PubMed] [Google Scholar]
- 19.de Jong D, et al. No effect of one-year treatment with indomethacin on Alzheimer’s disease progression: a randomized controlled trial. PLoS One. 2008;3(1):e1475. [DOI] [PMC free article] [PubMed]
- 20.Lyketsos CG, et al. Naproxen and celecoxib do not prevent AD in early results from a randomized controlled trial. Neurology. 2007;68(21):1800–1808. doi: 10.1212/01.wnl.0000260269.93245.d2. [DOI] [PubMed] [Google Scholar]
- 21.McQuade A, Blurton-Jones M. Microglia in Alzheimer’s disease: Exploring how genetics and phenotype influence risk. J Mol Biol. 2019;431(9):1805–1817. doi: 10.1016/j.jmb.2019.01.045. [DOI] [PMC free article] [PubMed] [Google Scholar]
- 22.Fan Z, et al. An early and late peak in microglial activation in Alzheimer’s disease trajectory. Brain. 2017;140(3):792–803. doi: 10.1093/brain/aww349. [DOI] [PMC free article] [PubMed] [Google Scholar]
- 23.Hamelin L, et al. Early and protective microglial activation in Alzheimer’s disease: a prospective study using 18F-DPA-714 PET imaging. Brain. 2016;139(Pt 4):1252–1264. doi: 10.1093/brain/aww017. [DOI] [PubMed] [Google Scholar]
- 24.Ismail R, et al. The relationships between neuroinflammation, beta-amyloid and tau deposition in Alzheimer’s disease: a longitudinal PET study. J Neuroinflammation. 2020;17(1):151. doi: 10.1186/s12974-020-01820-6. [DOI] [PMC free article] [PubMed] [Google Scholar]
- 25.Chakrabarty P, et al. Massive gliosis induced by interleukin-6 suppresses Abeta deposition in vivo: Evidence against inflammation as a driving force for amyloid deposition. FASEB J. 2010;24(2):548–559. doi: 10.1096/fj.09-141754. [DOI] [PMC free article] [PubMed] [Google Scholar]
- 26.Chakrabarty P, et al. IFN-gamma promotes complement expression and attenuates amyloid plaque deposition in amyloid beta precursor protein transgenic mice. J Immunol. 2010;184(9):5333–5343. doi: 10.4049/jimmunol.0903382. [DOI] [PMC free article] [PubMed] [Google Scholar]
- 27.Chakrabarty P, et al. Hippocampal expression of murine TNFalpha results in attenuation of amyloid deposition in vivo. Mol Neurodegener. 2011;6:16. doi: 10.1186/1750-1326-6-16. [DOI] [PMC free article] [PubMed] [Google Scholar]
- 28.Streit WJ, et al. Microglial activation occurs late during preclinical Alzheimer’s disease. Glia. 2018;66(12):2550–2562. doi: 10.1002/glia.23510. [DOI] [PubMed] [Google Scholar]
- 29.Prokop S, et al. Impact of TREM2 risk variants on brain region-specific immune activation and plaque microenvironment in Alzheimer’s disease patient brain samples. Acta Neuropathol. 2019;138(4):613–630. doi: 10.1007/s00401-019-02048-2. [DOI] [PMC free article] [PubMed] [Google Scholar]
- 30.Russell WL, Russell LB, Kelly EM. Radiation dose rate and mutation frequency. Science. 1958;128(3338):1546–1550. doi: 10.1126/science.128.3338.1546. [DOI] [PubMed] [Google Scholar]
- 31.Crary JF, et al. Primary age-related tauopathy (PART): a common pathology associated with human aging. Acta Neuropathol. 2014;128(6):755–766. doi: 10.1007/s00401-014-1349-0. [DOI] [PMC free article] [PubMed] [Google Scholar]
- 32.Chakrabarty P, et al. IL-10 alters immunoproteostasis in APP mice, increasing plaque burden and worsening cognitive behavior. Neuron. 2015;85(3):519–533. doi: 10.1016/j.neuron.2014.11.020. [DOI] [PMC free article] [PubMed] [Google Scholar]
- 33.Golde TE. Harnessing immunoproteostasis to treat neurodegenerative disorders. Neuron. 2019;101(6):1003–1015. doi: 10.1016/j.neuron.2019.02.027. [DOI] [PMC free article] [PubMed] [Google Scholar]
- 34.Kamboh MI. A brief synopsis on the genetics of Alzheimer’s disease. Curr Genet Med Rep. 2018;6(4):133–135. doi: 10.1007/s40142-018-0155-8. [DOI] [PMC free article] [PubMed] [Google Scholar]
- 35.Hansen DV, Hanson JE, Sheng M. Microglia in Alzheimer’s disease. J Cell Biol. 2018;217(2):459–472. doi: 10.1083/jcb.201709069. [DOI] [PMC free article] [PubMed] [Google Scholar]
- 36.Kober DL, et al. Neurodegenerative disease mutations in TREM2 reveal a functional surface and distinct loss-of-function mechanisms. Elife. 2016;5. [DOI] [PMC free article] [PubMed]
- 37.Cheng-Hathaway PJ, et al. The Trem2 R47H variant confers loss-of-function-like phenotypes in Alzheimer’s disease. Mol Neurodegener. 2018;13(1):29. doi: 10.1186/s13024-018-0262-8. [DOI] [PMC free article] [PubMed] [Google Scholar]
- 38.McGeer PL, Rogers J, McGeer EG. Inflammation, anti-inflammatory agents and Alzheimer disease: the last 12 years. J Alzheimers Dis. 2006;9(3 Suppl):271–276. doi: 10.3233/JAD-2006-9S330. [DOI] [PubMed] [Google Scholar]
- 39.Sarlus H, Heneka MT. Microglia in Alzheimer’s disease. J Clin Invest. 2017;127(9):3240–3249. doi: 10.1172/JCI90606. [DOI] [PMC free article] [PubMed] [Google Scholar]
- 40.Ransohoff RM. A polarizing question: Do M1 and M2 microglia exist? Nat Neurosci. 2016;19(8):987–991. doi: 10.1038/nn.4338. [DOI] [PubMed] [Google Scholar]
- 41.Masters CL, Selkoe DJ. Biochemistry of amyloid beta-protein and amyloid deposits in Alzheimer disease. Cold Spring Harb Perspect Med. 2012;2(6):a006262. [DOI] [PMC free article] [PubMed]
- 42.Heneka MT, Golenbock DT, Latz E. Innate immunity in Alzheimer’s disease. Nat Immunol. 2015;16(3):229–236. doi: 10.1038/ni.3102. [DOI] [PubMed] [Google Scholar]
- 43.Drummond E, et al. Proteomic differences in amyloid plaques in rapidly progressive and sporadic Alzheimer’s disease. Acta Neuropathol. 2017;133(6):933–954. doi: 10.1007/s00401-017-1691-0. [DOI] [PMC free article] [PubMed] [Google Scholar]
- 44.Rayaprolu S, et al. Systems-based proteomics to resolve the biology of Alzheimer’s disease beyond amyloid and tau. Neuropsychopharmacology. 2021;46(1):98–115. doi: 10.1038/s41386-020-00840-3. [DOI] [PMC free article] [PubMed] [Google Scholar]
- 45.Stewart CR, et al. CD36 ligands promote sterile inflammation through assembly of a Toll-like receptor 4 and 6 heterodimer. Nat Immunol. 2010;11(2):155–161. doi: 10.1038/ni.1836. [DOI] [PMC free article] [PubMed] [Google Scholar]
- 46.Colonna M, Brioschi S. Neuroinflammation and neurodegeneration in human brain at single-cell resolution. Nat Rev Immunol. 2020;20(2):81–82. doi: 10.1038/s41577-019-0262-0. [DOI] [PubMed] [Google Scholar]
- 47.Matarin M, et al. A genome-wide gene-expression analysis and database in transgenic mice during development of amyloid or tau pathology. Cell Rep. 2015;10(4):633–644. doi: 10.1016/j.celrep.2014.12.041. [DOI] [PubMed] [Google Scholar]
- 48.Zhang B, et al. Integrated systems approach identifies genetic nodes and networks in late-onset Alzheimer’s disease. Cell. 2013;153(3):707–720. doi: 10.1016/j.cell.2013.03.030. [DOI] [PMC free article] [PubMed] [Google Scholar]
- 49.Rothman SM, et al. Human Alzheimer’s disease gene expression signatures and immune profile in APP mouse models: a discrete transcriptomic view of Abeta plaque pathology. J Neuroinflammation. 2018;15(1):256. doi: 10.1186/s12974-018-1265-7. [DOI] [PMC free article] [PubMed] [Google Scholar]
- 50.Srinivasan K, et al. Alzheimer’s patient microglia exhibit enhanced aging and unique transcriptional activation. Cell Rep. 2020;31(13):107843. [DOI] [PMC free article] [PubMed]
- 51.Leyns CEG, Holtzman DM. Glial contributions to neurodegeneration in tauopathies. Mol Neurodegener. 2017;12(1):50. doi: 10.1186/s13024-017-0192-x. [DOI] [PMC free article] [PubMed] [Google Scholar]
- 52.McGeer PL, McGeer EG. Innate immunity, local inflammation, and degenerative disease. Sci Aging Knowledge Environ. 2002;2002(29):re3 [DOI] [PubMed]
- 53.Griffin WS, et al. Glial-neuronal interactions in Alzheimer’s disease: the potential role of a ‘cytokine cycle’ in disease progression. Brain Pathol. 1998;8(1):65–72. doi: 10.1111/j.1750-3639.1998.tb00136.x. [DOI] [PMC free article] [PubMed] [Google Scholar]
- 54.Heneka MT, et al. NLRP3 is activated in Alzheimer’s disease and contributes to pathology in APP/PS1 mice. Nature. 2013;493(7434):674–678. doi: 10.1038/nature11729. [DOI] [PMC free article] [PubMed] [Google Scholar]
- 55.Jay TR, et al. TREM2 deficiency eliminates TREM2+ inflammatory macrophages and ameliorates pathology in Alzheimer’s disease mouse models. J Exp Med. 2015;212(3):287–295. doi: 10.1084/jem.20142322. [DOI] [PMC free article] [PubMed] [Google Scholar]
- 56.Chakrabarty P, et al. Hippocampal expression of murine IL-4 results in exacerbation of amyloid deposition. Mol Neurodegener. 2012;7:36. doi: 10.1186/1750-1326-7-36. [DOI] [PMC free article] [PubMed] [Google Scholar]
- 57.Shaftel SS, et al. Sustained hippocampal IL-1 beta overexpression mediates chronic neuroinflammation and ameliorates Alzheimer plaque pathology. J Clin Invest. 2007;117(6):1595–1604. doi: 10.1172/JCI31450. [DOI] [PMC free article] [PubMed] [Google Scholar]
- 58.Rivera-Escalera F, et al. Interleukin-1beta mediated amyloid plaque clearance is independent of CCR2 signaling in the APP/PS1 mouse model of Alzheimer’s disease. Neurobiol Dis. 2014;69:124–133. doi: 10.1016/j.nbd.2014.05.018. [DOI] [PMC free article] [PubMed] [Google Scholar]
- 59.Guillot-Sestier MV, et al. Il10 deficiency rebalances innate immunity to mitigate Alzheimer-like pathology. Neuron. 2015;85(3):534–548. doi: 10.1016/j.neuron.2014.12.068. [DOI] [PMC free article] [PubMed] [Google Scholar]
- 60.El Khoury J, et al. Ccr2 deficiency impairs microglial accumulation and accelerates progression of Alzheimer-like disease. Nat Med. 2007;13(4):432–438. doi: 10.1038/nm1555. [DOI] [PubMed] [Google Scholar]
- 61.Hickman SE, Allison EK, El Khoury J. Microglial dysfunction and defective beta-amyloid clearance pathways in aging Alzheimer’s disease mice. J Neurosci. 2008;28(33):8354–8360. doi: 10.1523/JNEUROSCI.0616-08.2008. [DOI] [PMC free article] [PubMed] [Google Scholar]
- 62.Yuan P, et al. TREM2 haplodeficiency in mice and humans impairs the microglia barrier function leading to decreased amyloid compaction and severe axonal dystrophy. Neuron. 2016;90(4):724–739. doi: 10.1016/j.neuron.2016.05.003. [DOI] [PMC free article] [PubMed] [Google Scholar]
- 63.Song WM, et al. Humanized TREM2 mice reveal microglia-intrinsic and -extrinsic effects of R47H polymorphism. J Exp Med. 2018;215(3):745–760. doi: 10.1084/jem.20171529. [DOI] [PMC free article] [PubMed] [Google Scholar]
- 64.Wang Y, et al. TREM2-mediated early microglial response limits diffusion and toxicity of amyloid plaques. J Exp Med. 2016;213(5):667–675. doi: 10.1084/jem.20151948. [DOI] [PMC free article] [PubMed] [Google Scholar]
- 65.Gratuze M, Leyns CEG, Holtzman DM. New insights into the role of TREM2 in Alzheimer’s disease. Mol Neurodegener. 2018;13(1):66. doi: 10.1186/s13024-018-0298-9. [DOI] [PMC free article] [PubMed] [Google Scholar]
- 66.Henstridge CM, Hyman BT, Spires-Jones TL. Beyond the neuron-cellular interactions early in Alzheimer disease pathogenesis. Nat Rev Neurosci. 2019;20(2):94–108. doi: 10.1038/s41583-018-0113-1. [DOI] [PMC free article] [PubMed] [Google Scholar]
- 67.Parhizkar S, et al. Loss of TREM2 function increases amyloid seeding but reduces plaque-associated ApoE. Nat Neurosci. 2019;22(2):191–204. doi: 10.1038/s41593-018-0296-9. [DOI] [PMC free article] [PubMed] [Google Scholar]
- 68.Lee CYD, et al. Elevated TREM2 gene dosage reprograms microglia responsivity and ameliorates pathological phenotypes in Alzheimer’s disease models. Neuron. 2018;97(5):1032–48 e5. [DOI] [PMC free article] [PubMed]
- 69.Zhao Y, et al. TREM2 is a receptor for beta-amyloid that mediates microglial function. Neuron. 2018;97(5):1023–31 e7. [DOI] [PMC free article] [PubMed]
- 70.Li Q, et al. Developmental heterogeneity of microglia and brain myeloid cells revealed by deep single-cell RNA sequencing. Neuron. 2019;101(2):207–23 e10. [DOI] [PMC free article] [PubMed]
- 71.Hammond TR, et al. Single-cell RNA sequencing of microglia throughout the mouse lifespan and in the injured brain reveals complex cell-state changes. Immunity. 2019;50(1):253–71 e6. [DOI] [PMC free article] [PubMed]
- 72.Keren-Shaul H, et al. A unique microglia type associated with restricting development of Alzheimer’s disease. Cell. 2017;169(7):1276–90 e17. [DOI] [PubMed]
- 73.Krasemann S, et al. The TREM2-APOE pathway drives the transcriptional phenotype of dysfunctional microglia in neurodegenerative diseases. Immunity. 2017;47(3):566–81 e9. [DOI] [PMC free article] [PubMed]
- 74.Benitez DP, et al. Knock-in models related to Alzheimer’s disease: synaptic transmission, plaques and the role of microglia. Mol Neurodegener. 2021;16(1):47. doi: 10.1186/s13024-021-00457-0. [DOI] [PMC free article] [PubMed] [Google Scholar]
- 75.Sakai J. Core concept: How synaptic pruning shapes neural wiring during development and possibly, in disease. Proc Natl Acad Sci USA. 2020;117(28):16096–16099. doi: 10.1073/pnas.2010281117. [DOI] [PMC free article] [PubMed] [Google Scholar]
- 76.Brelstaff JH, et al. Microglia become hypofunctional and release metalloproteases and tau seeds when phagocytosing live neurons with P301S tau aggregates. [DOI] [PMC free article] [PubMed]
- 77.d'Errico RC, et al. Microglia contribute to the propagation of Aβ into unaffected brain tissue. Nat Neurosci. 2022;25(1):20–25. doi: 10.1038/s41593-021-00951-0. [DOI] [PMC free article] [PubMed] [Google Scholar]
- 78.Asai H, et al. Depletion of microglia and inhibition of exosome synthesis halt tau propagation. Nat Neurosci. 2015;18(11):1584–1593. doi: 10.1038/nn.4132. [DOI] [PMC free article] [PubMed] [Google Scholar]
- 79.Saman S, et al. Exosome-associated tau is secreted in tauopathy models and is selectively phosphorylated in cerebrospinal fluid in early Alzheimer disease. J Biol Chem. 2012;287(6):3842–3849. doi: 10.1074/jbc.M111.277061. [DOI] [PMC free article] [PubMed] [Google Scholar]
- 80.Ising C, et al. NLRP3 inflammasome activation drives tau pathology. Nature. 2019;575(7784):669–673. doi: 10.1038/s41586-019-1769-z. [DOI] [PMC free article] [PubMed] [Google Scholar]
- 81.Ghosh S, et al. Sustained interleukin-1beta overexpression exacerbates tau pathology despite reduced amyloid burden in an Alzheimer’s mouse model. Journal Neurosci: the Official Journal of the Society for Neuroscience. 2013;33(11):5053–5064. doi: 10.1523/JNEUROSCI.4361-12.2013. [DOI] [PMC free article] [PubMed] [Google Scholar]
- 82.Maphis N, et al. Reactive microglia drive tau pathology and contribute to the spreading of pathological tau in the brain. Brain. 2015;138(Pt 6):1738–1755. doi: 10.1093/brain/awv081. [DOI] [PMC free article] [PubMed] [Google Scholar]
- 83.Bennett RE, et al. Partial reduction of microglia does not affect tau pathology in aged mice. J Neuroinflammation. 2018;15(1):311. doi: 10.1186/s12974-018-1348-5. [DOI] [PMC free article] [PubMed] [Google Scholar]
- 84.Zhu K, et al. Absence of microglia or presence of peripherally-derived macrophages does not affect tau pathology in young or old hTau mice. Glia. 2020;68(7):1466–1478. doi: 10.1002/glia.23794. [DOI] [PubMed] [Google Scholar]
- 85.Lee DC, et al. LPS-induced inflammation exacerbates phospho-tau pathology in rTg4510 mice. J Neuroinflammation. 2010;7:56. doi: 10.1186/1742-2094-7-56. [DOI] [PMC free article] [PubMed] [Google Scholar]
- 86.Li A, et al. IFN-gamma promotes tau phosphorylation without affecting mature tangles. FASEB J. 2015;29(10):4384–4398. doi: 10.1096/fj.15-275834. [DOI] [PMC free article] [PubMed] [Google Scholar]
- 87.Guerreiro R, et al. TREM2 variants in Alzheimer’s disease. N Engl J Med. 2013;368(2):117–127. doi: 10.1056/NEJMoa1211851. [DOI] [PMC free article] [PubMed] [Google Scholar]
- 88.Bemiller SM, et al. TREM2 deficiency exacerbates tau pathology through dysregulated kinase signaling in a mouse model of tauopathy. Mol Neurodegener. 2017;12(1):74. doi: 10.1186/s13024-017-0216-6. [DOI] [PMC free article] [PubMed] [Google Scholar]
- 89.Leyns CEG, et al. TREM2 function impedes tau seeding in neuritic plaques. Nat Neurosci. 2019;22(8):1217–1222. doi: 10.1038/s41593-019-0433-0. [DOI] [PMC free article] [PubMed] [Google Scholar]
- 90.Gratuze M, et al. Impact of TREM2R47H variant on tau pathology-induced gliosis and neurodegeneration. J Clin Invest. 2020;130(9):4954–4968. doi: 10.1172/JCI138179. [DOI] [PMC free article] [PubMed] [Google Scholar]
- 91.Gratuze M, et al. Activated microglia mitigate Abeta-associated tau seeding and spreading. J Exp Med. 2021;218(8). [DOI] [PMC free article] [PubMed]
- 92.Filipello F, et al. The microglial innate immune receptor TREM2 is required for synapse elimination and normal brain connectivity. Immunity. 2018;48(5):979–91 e8. [DOI] [PubMed]
- 93.Shi Y, et al. Microglia drive APOE-dependent neurodegeneration in a tauopathy mouse model. J Exp Med. 2019;216(11):2546–2561. doi: 10.1084/jem.20190980. [DOI] [PMC free article] [PubMed] [Google Scholar]
- 94.Kitazawa M, et al. Lipopolysaccharide-induced inflammation exacerbates tau pathology by a cyclin-dependent kinase 5-mediated pathway in a transgenic model of Alzheimer’s disease. J Neurosci. 2005;25(39):8843–8853. doi: 10.1523/JNEUROSCI.2868-05.2005. [DOI] [PMC free article] [PubMed] [Google Scholar]
- 95.Sy M, et al. Inflammation induced by infection potentiates tau pathological features in transgenic mice. Am J Pathol. 2011;178(6):2811–2822. doi: 10.1016/j.ajpath.2011.02.012. [DOI] [PMC free article] [PubMed] [Google Scholar]
- 96.Chen W, et al. Increased tauopathy drives microglia-mediated clearance of beta-amyloid. Acta Neuropathol Commun. 2016;4(1):63. doi: 10.1186/s40478-016-0336-1. [DOI] [PMC free article] [PubMed] [Google Scholar]
- 97.Pickett EK, et al. Amyloid beta and tau cooperate to cause reversible behavioral and transcriptional deficits in a model of Alzheimer’s disease. Cell Rep. 2019;29(11):3592–604 e5. [DOI] [PMC free article] [PubMed]
- 98.Mattsson-Carlgren N, et al. Abeta deposition is associated with increases in soluble and phosphorylated tau that precede a positive Tau PET in Alzheimer’s disease. Sci Adv. 2020;6(16):eaaz2387. [DOI] [PMC free article] [PubMed]
- 99.Rueda-Carrasco J, Hong S. The Jekyll and Hyde of TREM2. Trends Neurosci. 2020;43(10):739–740. doi: 10.1016/j.tins.2020.08.002. [DOI] [PubMed] [Google Scholar]
- 100.Merino JJ, et al. Effects of CX3CR1 and fractalkine chemokines in amyloid beta clearance and p-tau accumulation in Alzheimer’s disease (AD) rodent models: is fractalkine a systemic biomarker for AD? Curr Alzheimer Res. 2016;13(4):403–412. doi: 10.2174/1567205013666151116125714. [DOI] [PubMed] [Google Scholar]
- 101.Audrain M, et al. Integrative approach to sporadic Alzheimer’s disease: deficiency of TYROBP in a tauopathy mouse model reduces C1q and normalizes clinical phenotype while increasing spread and state of phosphorylation of tau. Mol Psychiatry. 2019;24(9):1383–1397. doi: 10.1038/s41380-018-0258-3. [DOI] [PMC free article] [PubMed] [Google Scholar]
- 102.Haure-Mirande JV, et al. Integrative approach to sporadic Alzheimer’s disease: deficiency of TYROBP in cerebral Abeta amyloidosis mouse normalizes clinical phenotype and complement subnetwork molecular pathology without reducing Abeta burden. Mol Psychiatry. 2019;24(3):431–446. doi: 10.1038/s41380-018-0255-6. [DOI] [PMC free article] [PubMed] [Google Scholar]
- 103.Palmqvist S, et al. Cerebrospinal fluid and plasma biomarker trajectories with increasing amyloid deposition in Alzheimer’s disease. EMBO Mol Med. 2019;11(12):e11170. [DOI] [PMC free article] [PubMed]
- 104.Montgomery SL, et al. Chronic neuron- and age-selective down-regulation of TNF receptor expression in triple-transgenic Alzheimer disease mice leads to significant modulation of amyloid- and tau-related pathologies. Am J Pathol. 2013;182(6):2285–2297. doi: 10.1016/j.ajpath.2013.02.030. [DOI] [PMC free article] [PubMed] [Google Scholar]
- 105.Franceschi C, et al. Inflammaging 2018: an update and a model. Semin Immunol. 2018;40:1–5. doi: 10.1016/j.smim.2018.10.008. [DOI] [PubMed] [Google Scholar]
- 106.Giovannini S, et al. Interleukin-6, C-reactive protein, and tumor necrosis factor-alpha as predictors of mortality in frail, community-living elderly individuals. J Am Geriatr Soc. 2011;59(9):1679–1685. doi: 10.1111/j.1532-5415.2011.03570.x. [DOI] [PMC free article] [PubMed] [Google Scholar]
- 107.Barichello T, et al. Long-term cognitive outcomes after sepsis: a translational systematic review. Mol Neurobiol. 2019;56(1):186–251. doi: 10.1007/s12035-018-1048-2. [DOI] [PubMed] [Google Scholar]
- 108.Dantzer R, et al. From inflammation to sickness and depression: When the immune system subjugates the brain. Nat Rev Neurosci. 2008;9(1):46–56. doi: 10.1038/nrn2297. [DOI] [PMC free article] [PubMed] [Google Scholar]
- 109.Koyama A, et al. The role of peripheral inflammatory markers in dementia and Alzheimer’s disease: a meta-analysis. J Gerontol A Biol Sci Med Sci. 2013;68(4):433–440. doi: 10.1093/gerona/gls187. [DOI] [PMC free article] [PubMed] [Google Scholar]
- 110.Yaffe K, et al. The metabolic syndrome, inflammation, and risk of cognitive decline. JAMA. 2004;292(18):2237–2242. doi: 10.1001/jama.292.18.2237. [DOI] [PubMed] [Google Scholar]
- 111.Holmes C, et al. Systemic inflammation and disease progression in Alzheimer disease. Neurology. 2009;73(10):768–774. doi: 10.1212/WNL.0b013e3181b6bb95. [DOI] [PMC free article] [PubMed] [Google Scholar]
- 112.Ravaglia G, et al. Blood inflammatory markers and risk of dementia: the Conselice Study of Brain Aging. Neurobiol Aging. 2007;28(12):1810–1820. doi: 10.1016/j.neurobiolaging.2006.08.012. [DOI] [PubMed] [Google Scholar]
- 113.Brosseron F, et al. Body fluid cytokine levels in mild cognitive impairment and Alzheimer’s disease: a comparative overview. Mol Neurobiol. 2014;50(2):534–544. doi: 10.1007/s12035-014-8657-1. [DOI] [PMC free article] [PubMed] [Google Scholar]
- 114.Ng A, et al. IL-1beta, IL-6, TNF-alpha and CRP in elderly patients with depression or Alzheimer’s disease: Systematic review and meta-analysis. Sci Rep. 2018;8(1):12050. doi: 10.1038/s41598-018-30487-6. [DOI] [PMC free article] [PubMed] [Google Scholar]
- 115.Beydoun MA, et al. Clinical and bacterial markers of periodontitis and their association with incident all-cause and Alzheimer’s disease dementia in a large national survey. J Alzheimers Dis. 2020;75(1):157–172. doi: 10.3233/JAD-200064. [DOI] [PMC free article] [PubMed] [Google Scholar]
- 116.Abbott A. Are infections seeding some cases of Alzheimer’s disease? Nature. 2020;587(7832):22–25. doi: 10.1038/d41586-020-03084-9. [DOI] [PubMed] [Google Scholar]
- 117.Tzeng NS, et al. Anti-herpetic medications and reduced risk of dementia in patients with herpes simplex virus infections—a nationwide, population-based cohort study in Taiwan. Neurotherapeutics. 2018;15(2):417–429. doi: 10.1007/s13311-018-0611-x. [DOI] [PMC free article] [PubMed] [Google Scholar]
- 118.Cunnane SC, et al. Brain energy rescue: an emerging therapeutic concept for neurodegenerative disorders of ageing. Nat Rev Drug Discov. 2020;19(9):609–633. doi: 10.1038/s41573-020-0072-x. [DOI] [PMC free article] [PubMed] [Google Scholar]
- 119.Ma Y, et al. Higher risk of dementia in English older individuals who are overweight or obese. Int J Epidemiol. 2020;49(4):1353–1365. doi: 10.1093/ije/dyaa099. [DOI] [PMC free article] [PubMed] [Google Scholar]
- 120.Natunen T, et al. Diabetic phenotype in mouse and humans reduces the number of microglia around beta-amyloid plaques. Mol Neurodegener. 2020;15(1):66. doi: 10.1186/s13024-020-00415-2. [DOI] [PMC free article] [PubMed] [Google Scholar]
- 121.Montecino-Rodriguez E, Berent-Maoz B, Dorshkind K. Causes, consequences, and reversal of immune system aging. J Clin Invest. 2013;123(3):958–965. doi: 10.1172/JCI64096. [DOI] [PMC free article] [PubMed] [Google Scholar]
- 122.Oh SJ, Lee JK, Shin OS. Aging and the immune system: the impact of immunosenescence on viral infection, immunity and vaccine immunogenicity. Immune Netw. 2019;19(6):e37. [DOI] [PMC free article] [PubMed]
- 123.Deleidi M, Jaggle M, Rubino G. Immune aging, dysmetabolism, and inflammation in neurological diseases. Front Neurosci. 2015;9:172. doi: 10.3389/fnins.2015.00172. [DOI] [PMC free article] [PubMed] [Google Scholar]
- 124.Peng S, Zeng L, Haure-mirande JV, Wang M, Huffman DM, Haroutunian V, Erlich M, Zhang B, Tu Z. Transcriptomic changes highly similar to Alzheimer’s disease are observed in a subpopulation of individuals during normal brain aging. Biorxiv. 2021. [DOI] [PMC free article] [PubMed]
- 125.Shahidehpour RK, et al. Dystrophic microglia are associated with neurodegenerative disease and not healthy aging in the human brain. Neurobiol Aging. 2021;99:19–27. doi: 10.1016/j.neurobiolaging.2020.12.003. [DOI] [PMC free article] [PubMed] [Google Scholar]
- 126.Streit WJ, et al. Dystrophic (senescent) rather than activated microglial cells are associated with tau pathology and likely precede neurodegeneration in Alzheimer’s disease. Acta Neuropathol. 2009;118(4):475–485. doi: 10.1007/s00401-009-0556-6. [DOI] [PMC free article] [PubMed] [Google Scholar]
- 127.Stratoulias V, et al. Microglial subtypes: diversity within the microglial community. EMBO J. 2019;38(17):e101997. [DOI] [PMC free article] [PubMed]
- 128.Bisht Ket al. Dark microglia: why are they dark? Commun Integr Biol. 2016;9(6): e1230575. [DOI] [PMC free article] [PubMed]
- 129.Bisht K, et al. Dark microglia: a new phenotype predominantly associated with pathological states. Glia. 2016;64(5):826–839. doi: 10.1002/glia.22966. [DOI] [PMC free article] [PubMed] [Google Scholar]
- 130.El Hajj H, et al. Ultrastructural evidence of microglial heterogeneity in Alzheimer’s disease amyloid pathology. J Neuroinflammation. 2019;16(1):87. doi: 10.1186/s12974-019-1473-9. [DOI] [PMC free article] [PubMed] [Google Scholar]
- 131.Tremblay M-E. Microglial functional alteration and increased diversity in the challenged brain: Insights into novel targetsfor intervention. Brain Behav Immun Health. 2021 Jul;20(16):100301. [DOI] [PMC free article] [PubMed]
- 132.Bachstetter AD, et al. Disease-related microglia heterogeneity in the hippocampus of Alzheimer’s disease, dementia with Lewy bodies, and hippocampal sclerosis of aging. Acta Neuropathol Commun. 2015;3:32. doi: 10.1186/s40478-015-0209-z. [DOI] [PMC free article] [PubMed] [Google Scholar]
- 133.Gonzalez-Gualda E, et al. A guide to assessing cellular senescence in vitro and in vivo. FEBS J. 2021;288(1):56–80. doi: 10.1111/febs.15570. [DOI] [PubMed] [Google Scholar]
- 134.Bussian TJ, et al. Clearance of senescent glial cells prevents tau-dependent pathology and cognitive decline. Nature. 2018;562(7728):578–582. doi: 10.1038/s41586-018-0543-y. [DOI] [PMC free article] [PubMed] [Google Scholar]
- 135.Hou Y, et al. NAD(+) supplementation reduces neuroinflammation and cell senescence in a transgenic mouse model of Alzheimer’s disease via cGAS-STING. Proc Natl Acad Sci USA. 2021;118(37). [DOI] [PMC free article] [PubMed]
- 136.Decout A, et al. The cGAS-STING pathway as a therapeutic target in inflammatory diseases. Nat Rev Immunol. 2021;21(9):548–569. doi: 10.1038/s41577-021-00524-z. [DOI] [PMC free article] [PubMed] [Google Scholar]
- 137.Macosko EZ, et al. Highly parallel genome-wide expression profiling of individual cells using nanoliter droplets. Cell. 2015;161(5):1202–1214. doi: 10.1016/j.cell.2015.05.002. [DOI] [PMC free article] [PubMed] [Google Scholar]
- 138.Zheng GX, et al. Massively parallel digital transcriptional profiling of single cells. Nat Commun. 2017;8:14049. doi: 10.1038/ncomms14049. [DOI] [PMC free article] [PubMed] [Google Scholar]
- 139.Grindberg RV, et al. RNA-sequencing from single nuclei. Proc Natl Acad Sci USA. 2013;110(49):19802–19807. doi: 10.1073/pnas.1319700110. [DOI] [PMC free article] [PubMed] [Google Scholar]
- 140.Stahl PL, et al. Visualization and analysis of gene expression in tissue sections by spatial transcriptomics. Science. 2016;353(6294):78–82. doi: 10.1126/science.aaf2403. [DOI] [PubMed] [Google Scholar]
- 141.Peterson VM, et al. Multiplexed quantification of proteins and transcripts in single cells. Nat Biotechnol. 2017;35(10):936–939. doi: 10.1038/nbt.3973. [DOI] [PubMed] [Google Scholar]
- 142.Chikina M, Zaslavsky E, Sealfon SC. CellCODE: a robust latent variable approach to differential expression analysis for heterogeneous cell populations. Bioinformatics. 2015;31(10):1584–1591. doi: 10.1093/bioinformatics/btv015. [DOI] [PMC free article] [PubMed] [Google Scholar]
- 143.McKenzie AT, et al. Brain cell type specific gene expression and co-expression network architectures. Sci Rep. 2018;8(1):8868. doi: 10.1038/s41598-018-27293-5. [DOI] [PMC free article] [PubMed] [Google Scholar]
- 144.Masuda T, et al. Spatial and temporal heterogeneity of mouse and human microglia at single-cell resolution. Nature. 2019;566(7744):388–392. doi: 10.1038/s41586-019-0924-x. [DOI] [PubMed] [Google Scholar]
- 145.van den Brink SC, et al. Single-cell sequencing reveals dissociation-induced gene expression in tissue subpopulations. Nat Methods. 2017;14(10):935–936. doi: 10.1038/nmeth.4437. [DOI] [PubMed] [Google Scholar]
- 146.Hodes RJ, Buckholtz N. Accelerating Medicines Partnership: Alzheimer’s Disease (AMP-AD) knowledge portal aids Alzheimer’s drug discovery through open data sharing. Expert Opin Ther Targets. 2016;20(4):389–391. doi: 10.1517/14728222.2016.1135132. [DOI] [PubMed] [Google Scholar]
- 147.Sukoff Rizzo SJ, et al. Improving preclinical to clinical translation in Alzheimer’s disease research. Alzheimers Dement (NY). 2020;6(1):e12038. [DOI] [PMC free article] [PubMed]
- 148.Hampel H, et al. Omics sciences for systems biology in Alzheimer’s disease: State-of-the-art of the evidence. Ageing Res Rev. 2021;69:101346. [DOI] [PubMed]
- 149.Hickman SE, et al. The microglial sensome revealed by direct RNA sequencing. Nat Neurosci. 2013;16(12):1896–1905. doi: 10.1038/nn.3554. [DOI] [PMC free article] [PubMed] [Google Scholar]
- 150.Butovsky O, et al. Identification of a unique TGF-beta-dependent molecular and functional signature in microglia. Nat Neurosci. 2014;17(1):131–143. doi: 10.1038/nn.3599. [DOI] [PMC free article] [PubMed] [Google Scholar]
- 151.Gautier EL, et al. Gene-expression profiles and transcriptional regulatory pathways that underlie the identity and diversity of mouse tissue macrophages. Nat Immunol. 2012;13(11):1118–1128. doi: 10.1038/ni.2419. [DOI] [PMC free article] [PubMed] [Google Scholar]
- 152.Frigerio CS, et al. The major risk factors for Alzheimer’s disease: age, sex, and genes modulate the microglia response to Abeta plaques. Cell Rep. 2019;27(4):1293–1306 e6. [DOI] [PMC free article] [PubMed]
- 153.Sousa C, et al. Single-cell transcriptomics reveals distinct inflammation-induced microglia signatures. EMBO Rep. 2018;19(11). [DOI] [PMC free article] [PubMed]
- 154.Jordao MJC, et al. Single-cell profiling identifies myeloid cell subsets with distinct fates during neuroinflammation. Science. 2019;363(6425). [DOI] [PubMed]
- 155.Mathys H, et al. Temporal tracking of microglia activation in neurodegeneration at single-cell resolution. Cell Rep. 2017;21(2):366–380. doi: 10.1016/j.celrep.2017.09.039. [DOI] [PMC free article] [PubMed] [Google Scholar]
- 156.Chen WT, et al. Spatial transcriptomics and in situ sequencing to study Alzheimer’s disease. Cell. 2020;182(4):976–91 e19. [DOI] [PubMed]
- 157.Liddelow SA, et al. Neurotoxic reactive astrocytes are induced by activated microglia. Nature. 2017;541(7638):481–487. doi: 10.1038/nature21029. [DOI] [PMC free article] [PubMed] [Google Scholar]
- 158.McFarland KN, et al. Microglia show differential transcriptomic response to Abeta peptide aggregates ex vivo and in vivo. Life Sci Alliance. 2021;4(7). [DOI] [PMC free article] [PubMed]
- 159.Visscher PM, et al. 10 years of GWAS discovery: biology, function, and translation. Am J Hum Genet. 2017;101(1):5–22. doi: 10.1016/j.ajhg.2017.06.005. [DOI] [PMC free article] [PubMed] [Google Scholar]
- 160.Consortium EP. An integrated encyclopedia of DNA elements in the human genome. Nature. 2012;489(7414):57–74. doi: 10.1038/nature11247. [DOI] [PMC free article] [PubMed] [Google Scholar]
- 161.Roadmap Epigenomics C, et al. Integrative analysis of 111 reference human epigenomes. Nature. 2015;518(7539):317–330. doi: 10.1038/nature14248. [DOI] [PMC free article] [PubMed] [Google Scholar]
- 162.Boyle AP, et al. Annotation of functional variation in personal genomes using RegulomeDB. Genome Res. 2012;22(9):1790–1797. doi: 10.1101/gr.137323.112. [DOI] [PMC free article] [PubMed] [Google Scholar]
- 163.Consortium GT. The Genotype-Tissue Expression (GTEx) project. Nat Genet. 2013;45(6):580–585. doi: 10.1038/ng.2653. [DOI] [PMC free article] [PubMed] [Google Scholar]
- 164.Ramasamy A, et al. Genetic variability in the regulation of gene expression in ten regions of the human brain. Nat Neurosci. 2014;17(10):1418–1428. doi: 10.1038/nn.3801. [DOI] [PMC free article] [PubMed] [Google Scholar]
- 165.Kikuchi M, et al. Enhancer variants associated with Alzheimer’s disease affect gene expression via chromatin looping. BMC Med Genomics. 2019;12(1):128. doi: 10.1186/s12920-019-0574-8. [DOI] [PMC free article] [PubMed] [Google Scholar]
- 166.Katsumata Y, et al. Translating Alzheimer’s disease-associated polymorphisms into functional candidates: a survey of IGAP genes and SNPs. Neurobiol Aging. 2019;74:135–146. doi: 10.1016/j.neurobiolaging.2018.10.017. [DOI] [PMC free article] [PubMed] [Google Scholar]
- 167.Karch CM, et al. Alzheimer’s disease risk polymorphisms regulate gene expression in the ZCWPW1 and the CELF1 loci. PLoS One. 2016;11(2):e0148717. [DOI] [PMC free article] [PubMed]
- 168.Tato CM, et al. The myeloid receptor PILRbeta mediates the balance of inflammatory responses through regulation of IL-27 production. PLoS One. 2012;7(3):e31680. [DOI] [PMC free article] [PubMed]
- 169.Huang KL, et al. A common haplotype lowers PU.1 expression in myeloid cells and delays onset of Alzheimer’s disease. Nat Neurosci. 2017;20(8):1052–61. [DOI] [PMC free article] [PubMed]
- 170.Burda P, Laslo P, Stopka T. The role of PU.1 and GATA-1 transcription factors during normal and leukemogenic hematopoiesis. Leukemia. 2010;24(7):1249–57. [DOI] [PubMed]
- 171.Pimenova AA, et al. Alzheimer’s-associated PU.1 expression levels regulate microglial inflammatory response. Neurobiol Dis. 2021;148:105217. [DOI] [PMC free article] [PubMed]
- 172.Patel D, et al. Cell-type-specific expression quantitative trait loci associated with Alzheimer disease in blood and brain tissue. Transl Psychiatry. 2021;11(1):250. doi: 10.1038/s41398-021-01373-z. [DOI] [PMC free article] [PubMed] [Google Scholar]
- 173.Young AMH, et al. A map of transcriptional heterogeneity and regulatory variation in human microglia. Nat Genet. 2021;53(6):861–868. doi: 10.1038/s41588-021-00875-2. [DOI] [PMC free article] [PubMed] [Google Scholar]
- 174.Yang HS, et al. Genetics of gene expression in the aging human brain reveal TDP-43 proteinopathy pathophysiology. Neuron. 2020;107(3):496–508 e6. [DOI] [PMC free article] [PubMed]
- 175.Mostafavi S, et al. A molecular network of the aging human brain provides insights into the pathology and cognitive decline of Alzheimer’s disease. Nat Neurosci. 2018;21(6):811–819. doi: 10.1038/s41593-018-0154-9. [DOI] [PMC free article] [PubMed] [Google Scholar]
- 176.Raghavan NS, et al. Association between common variants in RBFOX1, an RNA-binding protein, and brain amyloidosis in early and preclinical Alzheimer disease. JAMA Neurol. 2020;77(10):1288–1298. doi: 10.1001/jamaneurol.2020.1760. [DOI] [PMC free article] [PubMed] [Google Scholar]
- 177.Salih DA, et al. Genetic variability in response to amyloid beta deposition influences Alzheimer’s disease risk. Brain Commun. 2019;1(1):fcz022. [DOI] [PMC free article] [PubMed]
- 178.Boutej H, et al. Diverging mRNA and protein networks in activated microglia reveal SRSF3 suppresses translation of highly upregulated innate immune transcripts. Cell Rep. 2017;21(11):3220–3233. doi: 10.1016/j.celrep.2017.11.058. [DOI] [PubMed] [Google Scholar]
- 179.Liu Y, Beyer A, Aebersold R. On the dependency of cellular protein levels on mRNA abundance. Cell. 2016;165(3):535–550. doi: 10.1016/j.cell.2016.03.014. [DOI] [PubMed] [Google Scholar]
- 180.Darmanis S, et al. Simultaneous multiplexed measurement of RNA and Proteins in single cells. Cell Rep. 2016;14(2):380–389. doi: 10.1016/j.celrep.2015.12.021. [DOI] [PMC free article] [PubMed] [Google Scholar]
- 181.Battle A, et al. Genomic variation. Impact of regulatory variation from RNA to protein. Science. 2015;347(6222):664–7. [DOI] [PMC free article] [PubMed]
- 182.Schwanhausser B, et al. Global quantification of mammalian gene expression control. Nature. 2011;473(7347):337–342. doi: 10.1038/nature10098. [DOI] [PubMed] [Google Scholar]
- 183.Seyfried NT, et al. A multi-network approach identifies protein-specific co-expression in asymptomatic and symptomatic Alzheimer’s disease. Cell Syst. 2017;4(1):60–72 e4. [DOI] [PMC free article] [PubMed]
- 184.Higginbotham L, et al. Integrated proteomics reveals brain-based cerebrospinal fluid biomarkers in asymptomatic and symptomatic Alzheimer’s disease. Sci Adv. 2020;6(43). [DOI] [PMC free article] [PubMed]
- 185.Swarup V, et al. Identification of conserved proteomic networks in neurodegenerative dementia. Cell Rep. 2020;31(12):107807. [DOI] [PMC free article] [PubMed]
- 186.Strittmatter WJ, et al. Binding of human apolipoprotein E to synthetic amyloid beta peptide: Isoform-specific effects and implications for late-onset Alzheimer disease. Proc Natl Acad Sci USA. 1993;90(17):8098–8102. doi: 10.1073/pnas.90.17.8098. [DOI] [PMC free article] [PubMed] [Google Scholar]
- 187.Bai B, et al. Deep multilayer brain proteomics identifies molecular networks in Alzheimer’s disease progression. Neuron. 2020;105(6):975–91 e7. [DOI] [PMC free article] [PubMed]
- 188.MahmoudianDehkordi S, et al. Altered bile acid profile associates with cognitive impairment in Alzheimer’s disease—an emerging role for gut microbiome. Alzheimers Dement. 2019;15(1):76–92. doi: 10.1016/j.jalz.2018.07.217. [DOI] [PMC free article] [PubMed] [Google Scholar]
- 189.Toledo JB, et al. Metabolic network failures in Alzheimer’s disease: a biochemical road map. Alzheimers Dement. 2017;13(9):965–984. doi: 10.1016/j.jalz.2017.01.020. [DOI] [PMC free article] [PubMed] [Google Scholar]
- 190.Nho K, et al. Altered bile acid profile in mild cognitive impairment and Alzheimer’s disease: Relationship to neuroimaging and CSF biomarkers. Alzheimers Dement. 2019;15(2):232–244. doi: 10.1016/j.jalz.2018.08.012. [DOI] [PMC free article] [PubMed] [Google Scholar]
- 191.Long T, et al. Whole-genome sequencing identifies common-to-rare variants associated with human blood metabolites. Nat Genet. 2017;49(4):568–578. doi: 10.1038/ng.3809. [DOI] [PubMed] [Google Scholar]
- 192.Tynkkynen J, et al. Association of branched-chain amino acids and other circulating metabolites with risk of incident dementia and Alzheimer’s disease: a prospective study in eight cohorts. Alzheimers Dement. 2018;14(6):723–733. doi: 10.1016/j.jalz.2018.01.003. [DOI] [PMC free article] [PubMed] [Google Scholar]
- 193.Varma VR, et al. Brain and blood metabolite signatures of pathology and progression in Alzheimer disease: a targeted metabolomics study. PLoS Med. 2018;15(1):e1002482. [DOI] [PMC free article] [PubMed]
- 194.Higginbotham L, et al. Network analysis of a membrane-enriched brain proteome across stages of Alzheimer’s Disease. Proteomes. 2019;7(3). [DOI] [PMC free article] [PubMed]
- 195.Tijms BM, et al. Pathophysiological subtypes of Alzheimer’s disease based on cerebrospinal fluid proteomics. Brain. 2020;143(12):3776–3792. doi: 10.1093/brain/awaa325. [DOI] [PMC free article] [PubMed] [Google Scholar]
- 196.Jiang Y, et al. Large-scale plasma proteomic profiling identifies a high-performance biomarker panel for Alzheimer’s disease screening and staging. Alzheimers Dement. 2021. [DOI] [PMC free article] [PubMed]
- 197.Wallin AK, et al. CSF biomarkers predict a more malignant outcome in Alzheimer disease. Neurology. 2010;74(19):1531–1537. doi: 10.1212/WNL.0b013e3181dd4dd8. [DOI] [PubMed] [Google Scholar]
- 198.Iqbal K, et al. Subgroups of Alzheimer’s disease based on cerebrospinal fluid molecular markers. Ann Neurol. 2005;58(5):748–757. doi: 10.1002/ana.20639. [DOI] [PubMed] [Google Scholar]
- 199.Suarez-Calvet M, et al. Early increase of CSF sTREM2 in Alzheimer’s disease is associated with tau related-neurodegeneration but not with amyloid-beta pathology. Mol Neurodegener. 2019;14(1):1. doi: 10.1186/s13024-018-0301-5. [DOI] [PMC free article] [PubMed] [Google Scholar]
- 200.Craig-Schapiro R, et al. YKL-40: a novel prognostic fluid biomarker for preclinical Alzheimer’s disease. Biol Psychiatry. 2010;68(10):903–912. doi: 10.1016/j.biopsych.2010.08.025. [DOI] [PMC free article] [PubMed] [Google Scholar]
- 201.Lananna BV, et al. Chi3l1/YKL-40 is controlled by the astrocyte circadian clock and regulates neuroinflammation and Alzheimer’s disease pathogenesis. Sci Transl Med. 2020;12(574). [DOI] [PMC free article] [PubMed]
- 202.Suarez-Calvet M, et al. sTREM2 cerebrospinal fluid levels are a potential biomarker for microglia activity in early-stage Alzheimer’s disease and associate with neuronal injury markers. EMBO Mol Med. 2016;8(5):466–476. doi: 10.15252/emmm.201506123. [DOI] [PMC free article] [PubMed] [Google Scholar]
- 203.Piccio L, et al. Cerebrospinal fluid soluble TREM2 is higher in Alzheimer disease and associated with mutation status. Acta Neuropathol. 2016;131(6):925–933. doi: 10.1007/s00401-016-1533-5. [DOI] [PMC free article] [PubMed] [Google Scholar]
- 204.Konijnenberg E, et al. APOE epsilon4 genotype-dependent cerebrospinal fluid proteomic signatures in Alzheimer’s disease. Alzheimers Res Ther. 2020;12(1):65. doi: 10.1186/s13195-020-00628-z. [DOI] [PMC free article] [PubMed] [Google Scholar]
- 205.In t’ Veld BA, et al. Nonsteroidal antiinflammatory drugs and the risk of Alzheimer’s disease. N Engl J Med. 2001;345(21):1515–21. [DOI] [PubMed]
- 206.Yip AG, et al. Nonsteroidal anti-inflammatory drug use and Alzheimer’s disease risk: the MIRAGE Study. BMC Geriatr. 2005;5:2. doi: 10.1186/1471-2318-5-2. [DOI] [PMC free article] [PubMed] [Google Scholar]
- 207.Jantzen PT, et al. Microglial activation and beta-amyloid deposit reduction caused by a nitric oxide-releasing nonsteroidal anti-inflammatory drug in amyloid precursor protein plus presenilin-1 transgenic mice. J Neurosci. 2002;22(6):2246–2254. doi: 10.1523/JNEUROSCI.22-06-02246.2002. [DOI] [PMC free article] [PubMed] [Google Scholar]
- 208.Lim GP, et al. Ibuprofen suppresses plaque pathology and inflammation in a mouse model for Alzheimer’s disease. J Neurosci: the Official Journal of the Society for Neuroscience. 2000;20(15):5709–5714. doi: 10.1523/JNEUROSCI.20-15-05709.2000. [DOI] [PMC free article] [PubMed] [Google Scholar]
- 209.Rivers-Auty J, et al. Anti-inflammatories in Alzheimer’s disease—potential therapy or spurious correlate? Brain Commun. 2020;2(2):fcaa109. [DOI] [PMC free article] [PubMed]
- 210.Hershey LA, Lipton RB. Naproxen for presymptomatic Alzheimer disease: is this the end, or shall we try again? Neurology. 2019;92(18):829–830. doi: 10.1212/WNL.0000000000007233. [DOI] [PubMed] [Google Scholar]
- 211.Howard R, et al. Minocycline at 2 different dosages vs placebo for patients with mild Alzheimer disease: a randomized clinical trial. JAMA Neurol. 2020;77(2):164–174. doi: 10.1001/jamaneurol.2019.3762. [DOI] [PMC free article] [PubMed] [Google Scholar]
- 212.Cummings J. Lessons learned from Alzheimer disease: Clinical trials with negative outcomes. Clin Transl Sci. 2018;11(2):147–152. doi: 10.1111/cts.12491. [DOI] [PMC free article] [PubMed] [Google Scholar]
- 213.de Craen AJ, et al. Meta-analysis of nonsteroidal antiinflammatory drug use and risk of dementia. Am J Epidemiol. 2005;161(2):114–120. doi: 10.1093/aje/kwi029. [DOI] [PubMed] [Google Scholar]
- 214.Group AR. Cardiovascular and cerebrovascular events in the randomized, controlled Alzheimer’s Disease Anti-Inflammatory Prevention Trial (ADAPT). PLoS Clin Trials. 2006;1(7):e33. [DOI] [PMC free article] [PubMed]
- 215.Alzheimer’s Disease Anti-inflammatory Prevention Trial Research G. Results of a follow-up study to the randomized Alzheimer’s Disease Anti-inflammatory Prevention Trial (ADAPT). Alzheimers Dement. 2013;9(6): 714–23. [DOI] [PMC free article] [PubMed]
- 216.Weggen S, et al. A subset of NSAIDs lower amyloidogenic Abeta42 independently of cyclooxygenase activity. Nature. 2001;414(6860):212–216. doi: 10.1038/35102591. [DOI] [PubMed] [Google Scholar]
- 217.Weggen S, et al. A beta42-lowering nonsteroidal anti-inflammatory drugs preserve intramembrane cleavage of the amyloid precursor protein and ErbB-4 receptor and signaling through the APP intracellular domain. J Biol Chem. 2003. 2003 May 31 [Epub ahead of print]. [DOI] [PubMed]
- 218.Kukar TL, et al. Substrate-targeting gamma-secretase modulators. Nature. 2008;453(7197):925–929. doi: 10.1038/nature07055. [DOI] [PMC free article] [PubMed] [Google Scholar]
- 219.Green RC, et al. Effect of tarenflurbil on cognitive decline and activities of daily living in patients with mild Alzheimer disease: a randomized controlled trial. JAMA. 2009;302(23):2557–2564. doi: 10.1001/jama.2009.1866. [DOI] [PMC free article] [PubMed] [Google Scholar]
- 220.Chakrabarty P, et al. Interferon-gamma induces progressive nigrostriatal degeneration and basal ganglia calcification. Nat Neurosci. 2011;14(6):694–696. doi: 10.1038/nn.2829. [DOI] [PMC free article] [PubMed] [Google Scholar]
- 221.Geirsdottir L, et al. Cross-species single-cell analysis reveals divergence of the primate microglia program. Cell 2019;179(7): 1609–22 e16. [DOI] [PubMed]
- 222.Paloneva J, et al. Mutations in two genes encoding different subunits of a receptor signaling complex result in an identical disease phenotype. Am J Hum Genet. 2002;71(3):656–662. doi: 10.1086/342259. [DOI] [PMC free article] [PubMed] [Google Scholar]
- 223.Hampel, H, et al. Revolution of Alzheimer precision neurology. Passageway of systems biology and neurophysiology. J Alzheimer's Dis. 2018;64:S47–105. [DOI] [PMC free article] [PubMed]
- 224.Kim SH, et al. A therapeutic strategy for Alzheimer’s disease focused on immune-inflammatory modulation. Dement Neurocogn Disord. 2019;18(2):33–46. doi: 10.12779/dnd.2019.18.2.33. [DOI] [PMC free article] [PubMed] [Google Scholar]
- 225.Dani M, et al. Microglial activation correlates in vivo with both tau and amyloid in Alzheimer’s disease. Brain. 2018;141(9):2740–2754. doi: 10.1093/brain/awy188. [DOI] [PubMed] [Google Scholar]
- 226.Passamonti L, et al. [(11)C]PK11195 binding in Alzheimer disease and progressive supranuclear palsy. Neurology. 2018;90(22):e1989–e1996. doi: 10.1212/WNL.0000000000005610. [DOI] [PMC free article] [PubMed] [Google Scholar]
- 227.Johnson ECB, et al. Large-scale proteomic analysis of Alzheimer’s disease brain and cerebrospinal fluid reveals early changes in energy metabolism associated with microglia and astrocyte activation. Nat Med. 2020;26(5):769–780. doi: 10.1038/s41591-020-0815-6. [DOI] [PMC free article] [PubMed] [Google Scholar]
- 228.Mathys H, et al. Single-cell transcriptomic analysis of Alzheimer’s disease. Nature. 2019;570(7761):332–337. doi: 10.1038/s41586-019-1195-2. [DOI] [PMC free article] [PubMed] [Google Scholar]
- 229.Deming Y, et al. The MS4A gene cluster is a key modulator of soluble TREM2 and Alzheimer’s disease risk. Sci Transl Med. 2019;11(505). [DOI] [PMC free article] [PubMed]
- 230.Friedman BA, et al. Diverse brain myeloid expression profiles reveal distinct microglial activation states and aspects of Alzheimer’s disease not evident in mouse models. Cell Rep. 2018;22(3):832–847. doi: 10.1016/j.celrep.2017.12.066. [DOI] [PubMed] [Google Scholar]
- 231.Aisen PS, et al. On the path to 2025: Understanding the Alzheimer’s disease continuum. Alzheimers Res Ther. 2017;9(1):60. doi: 10.1186/s13195-017-0283-5. [DOI] [PMC free article] [PubMed] [Google Scholar]
- 232.Maier M, et al. Complement C3 deficiency leads to accelerated amyloid beta plaque deposition and neurodegeneration and modulation of the microglia/macrophage phenotype in amyloid precursor protein transgenic mice. J Neurosci. 2008;28(25):6333–6341. doi: 10.1523/JNEUROSCI.0829-08.2008. [DOI] [PMC free article] [PubMed] [Google Scholar]
- 233.Fonseca MI, et al. Absence of C1q leads to less neuropathology in transgenic mouse models of Alzheimer’s disease. J Neurosci. 2004;24(29):6457–6465. doi: 10.1523/JNEUROSCI.0901-04.2004. [DOI] [PMC free article] [PubMed] [Google Scholar]
- 234.Wyss-Coray T, et al. Prominent neurodegeneration and increased plaque formation in complement-inhibited Alzheimer’s mice. Proc Natl Acad Sci USA. 2002;99(16):10837–10842. doi: 10.1073/pnas.162350199. [DOI] [PMC free article] [PubMed] [Google Scholar]
- 235.Fonseca MI, et al. Treatment with a C5aR antagonist decreases pathology and enhances behavioral performance in murine models of Alzheimer’s disease. J Immunol. 2009;183(2):1375–1383. doi: 10.4049/jimmunol.0901005. [DOI] [PMC free article] [PubMed] [Google Scholar]
- 236.Britschgi M, et al. Deficiency of terminal complement pathway inhibitor promotes neuronal tau pathology and degeneration in mice. J Neuroinflammation. 2012;9:220. doi: 10.1186/1742-2094-9-220. [DOI] [PMC free article] [PubMed] [Google Scholar]
- 237.Vom Berg J, et al. Inhibition of IL-12/IL-23 signaling reduces Alzheimer’s disease-like pathology and cognitive decline. Nat Med. 2012;18(12):1812–1819. doi: 10.1038/nm.2965. [DOI] [PubMed] [Google Scholar]
- 238.Tesseur I, et al. Deficiency in neuronal TGF-beta signaling promotes neurodegeneration and Alzheimer’s pathology. J Clin Invest. 2006;116(11):3060–3069. doi: 10.1172/JCI27341. [DOI] [PMC free article] [PubMed] [Google Scholar]
- 239.Alves S, et al. Interleukin-2 improves amyloid pathology, synaptic failure and memory in Alzheimer’s disease mice. Brain. 2017;140(3):826–842. doi: 10.1093/brain/aww330. [DOI] [PubMed] [Google Scholar]
- 240.Yamamoto M, et al. Interferon-gamma and tumor necrosis factor-alpha regulate amyloid-beta plaque deposition and beta-secretase expression in Swedish mutant APP transgenic mice. Am J Pathol. 2007;170(2):680–692. doi: 10.2353/ajpath.2007.060378. [DOI] [PMC free article] [PubMed] [Google Scholar]
- 241.Montgomery SL, et al. Ablation of TNF-RI/RII expression in Alzheimer’s disease mice leads to an unexpected enhancement of pathology: implications for chronic pan-TNF-alpha suppressive therapeutic strategies in the brain. Am J Pathol. 2011;179(4):2053–2070. doi: 10.1016/j.ajpath.2011.07.001. [DOI] [PMC free article] [PubMed] [Google Scholar]
- 242.Spangenberg EE, et al. Eliminating microglia in Alzheimer’s mice prevents neuronal loss without modulating amyloid-beta pathology. Brain. 2016;139(Pt 4):1265–1281. doi: 10.1093/brain/aww016. [DOI] [PMC free article] [PubMed] [Google Scholar]
- 243.Spangenberg E, et al. Sustained microglial depletion with CSF1R inhibitor impairs parenchymal plaque development in an Alzheimer’s disease model. Nat Commun. 2019;10(1):3758. doi: 10.1038/s41467-019-11674-z. [DOI] [PMC free article] [PubMed] [Google Scholar]
- 244.Grathwohl SA, et al. Formation and maintenance of Alzheimer’s disease beta-amyloid plaques in the absence of microglia. Nat Neurosci. 2009;12(11):1361–1363. doi: 10.1038/nn.2432. [DOI] [PMC free article] [PubMed] [Google Scholar]
- 245.Pons V, et al. Conditional genetic deletion of CSF1 receptor in microglia ameliorates the physiopathology of Alzheimer’s disease. Alzheimers Res Ther. 2021;13(1):8. doi: 10.1186/s13195-020-00747-7. [DOI] [PMC free article] [PubMed] [Google Scholar]
- 246.Lodder C, et al. CSF1R inhibition rescues tau pathology and neurodegeneration in an A/T/N model with combined AD pathologies, while preserving plaque associated microglia. Acta Neuropathol Commun. 2021;9(1):108. doi: 10.1186/s40478-021-01204-8. [DOI] [PMC free article] [PubMed] [Google Scholar]
- 247.Chakrabarty P, et al. TLR5 decoy receptor as a novel anti-amyloid therapeutic for Alzheimer’s disease. J Exp Med. 2018;215(9):2247–2264. doi: 10.1084/jem.20180484. [DOI] [PMC free article] [PubMed] [Google Scholar]
- 248.Scholtzova H, et al. Induction of toll-like receptor 9 signaling as a method for ameliorating Alzheimer’s disease-related pathology. J Neurosci. 2009;29(6):1846–1854. doi: 10.1523/JNEUROSCI.5715-08.2009. [DOI] [PMC free article] [PubMed] [Google Scholar]
- 249.Michaud JP, Richard KL, Rivest S. MyD88-adaptor protein acts as a preventive mechanism for memory deficits in a mouse model of Alzheimer’s disease. Mol Neurodegener. 2011;6(1):5. doi: 10.1186/1750-1326-6-5. [DOI] [PMC free article] [PubMed] [Google Scholar]
- 250.Herber DL, et al. Time-dependent reduction in Abeta levels after intracranial LPS administration in APP transgenic mice. Exp Neurol. 2004;190(1):245–253. doi: 10.1016/j.expneurol.2004.07.007. [DOI] [PubMed] [Google Scholar]
- 251.Fang F, et al. RAGE-dependent signaling in microglia contributes to neuroinflammation, Abeta accumulation, and impaired learning/memory in a mouse model of Alzheimer’s disease. FASEB J. 2010;24(4):1043–1055. doi: 10.1096/fj.09-139634. [DOI] [PMC free article] [PubMed] [Google Scholar]
- 252.Nash KR, et al. Fractalkine overexpression suppresses tau pathology in a mouse model of tauopathy. Neurobiol Aging. 2013;34(6):1540–1548. doi: 10.1016/j.neurobiolaging.2012.12.011. [DOI] [PMC free article] [PubMed] [Google Scholar]
- 253.Lee S, et al. Opposing effects of membrane-anchored CX3CL1 on amyloid and tau pathologies via the p38 MAPK pathway. J Neurosci. 2014;34(37):12538–12546. doi: 10.1523/JNEUROSCI.0853-14.2014. [DOI] [PMC free article] [PubMed] [Google Scholar]
- 254.Bemiller SM, et al. Genetically enhancing the expression of chemokine domain of CX3CL1 fails to prevent tau pathology in mouse models of tauopathy. J Neuroinflammation. 2018;15(1):278. doi: 10.1186/s12974-018-1310-6. [DOI] [PMC free article] [PubMed] [Google Scholar]
- 255.Weston LL, et al. Interleukin-10 deficiency exacerbates inflammation-induced tau pathology. J Neuroinflammation. 2021;18(1):161. doi: 10.1186/s12974-021-02211-1. [DOI] [PMC free article] [PubMed] [Google Scholar]
- 256.Griciuc A, et al. Alzheimer’s disease risk gene CD33 inhibits microglial uptake of amyloid beta. Neuron. 2013;78(4):631–643. doi: 10.1016/j.neuron.2013.04.014. [DOI] [PMC free article] [PubMed] [Google Scholar]
- 257.Ulrich JD, et al. Altered microglial response to Abeta plaques in APPPS1-21 mice heterozygous for TREM2. Mol Neurodegener. 2014;9:20. doi: 10.1186/1750-1326-9-20. [DOI] [PMC free article] [PubMed] [Google Scholar]
- 258.Meilandt WJ, et al. Trem2 deletion reduces late-stage amyloid plaque accumulation, elevates the Abeta42:Abeta40 ratio, and exacerbates axonal dystrophy and dendritic spine loss in the PS2APP Alzheimer’s mouse model. J Neurosci. 2020;40(9):1956–1974. doi: 10.1523/JNEUROSCI.1871-19.2019. [DOI] [PMC free article] [PubMed] [Google Scholar]
- 259.Xu Y, et al. Autophagy deficiency modulates microglial lipid homeostasis and aggravates tau pathology and spreading. Proc Natl Acad Sci USA. 2021;118(27). [DOI] [PMC free article] [PubMed]
- 260.Zhang Y, et al. Purification and characterization of progenitor and mature human astrocytes reveals transcriptional and functional differences with mouse. Neuron. 2016;89(1):37–53. doi: 10.1016/j.neuron.2015.11.013. [DOI] [PMC free article] [PubMed] [Google Scholar]
Associated Data
This section collects any data citations, data availability statements, or supplementary materials included in this article.