

Abstract
Background:
Residents of Anniston Alabama were highly exposed to polychlorinated biphenyls (PCBs) due to longstanding manufacturing in the area. The Anniston Community Health Surveys (ACHS I-2005–2007 and II, 2014) have linked these exposures with a variety of deletereous health outcomes. In addition to PCBs, these individuals were likely simultaneously exposed to other persistent organic pollutants including per and polyfluoroalkyl substances (PFAS), which are an emerging class of ubiquitous industrial chemicals that are measurable in the blood of most individuals and have themselves been linked increased risk of some non communicable diseases.
Methods:
To characterize PFAS exposures in ACHS I and ACHS II, we measured eight environmentally significant PFAS in serum by UPLC coupled electrospray ionization tandem mass spectrometry. Perfluorooctane sulfonate (PFOS), Perfluorooctanoic acid (PFOA), Perfluorononanoate (PFNA), Perfluorohexane sulfonate (PFHxS), Perfluoroheptanoic acid (PFHpA), Perfluorobutanesulfonic acid (PFBS), Hexafluoropropylene oxide dimer acid (HFPO-DA), and 4:2 Fluorotelomer sulfonic acid (4.2 FTS) were extracted from matched serum samples of individuals who participated in the original ACHS I (2005–2007; n = 297) and the follow up ACHS II (2014; n = 336). Data were collected in negative multiple reaction monitoring (MRM) mode with monitoring of quantitation and qualifier ions for all target PFAS analytes, surrogates and internal standards. VARCLUS procedure was used to create hierarchical clusters between PFAS and other legacy persistent organic pollutants which may share similar exposure routes.
Results:
Overall, circulating PFAS levels decreased approximately 50% from ACHS I (2005–2007) to ACHS II (2014), but these changes varied by compound. Mean levels of PFOS were >3 times higher in ACHS I subjects than in conpemporaneous NHANES subjects (2005–2006; ACHS I mean: 71.1 ng/ml; NHANES mean: 20.2 ng/mL), and this relationship persisted in ACHS II subjects (2014: ACHS II mean: 34.7 ng/ml; NHANES mean: 5.92 ng/mL). PFNA was also higher in both ACHS I and ACHS II subjects in comparision to NHANES whereas levels of PFOA and PFHxS were lower than in NHANES. Finally, cluster analysis revealed that in ACHS II, most PFAS tracked with polybrominated diphenyl ethers, except PFNA and PFHpA which clustered with industrial PCBs. In ACHS I, PFAS analytes correlated more closely with industrial PCBs and chlorinated pesticides.
Conclusions:
Participants in the Anniston Community Health Surveys have higher levels of PFOS and PFNA than the general population with average PFOS levels >3 times contemporaneous NHANES levels. Since PFAS were not known to be manufactured in the area, more work needs to be completed to determine if population demographics, proximity to a military base, or regional manufacturing can explain the elevated levels.
Keywords: PFAS, ACHS, Anniston, Biomonitoring, Per and poly fluoroalkyl substances
1. Introduction
Per- and polyfluoroalkyl substances (PFAS) are a class of ubiquitous man-made chemicals utilized for their surfactant properties in cook-ware, clothing, and carpets as well as in aqueous film forming foams used by civilian and military firefighters (ATSDR, 2020). Approximately 7000 chemically distinct PFAS have been reported in the chemical literature with a smaller subset of these found in the environment. Exposure to a handful of widely distributed PFAS have been associated with chronic diseases including steatosis, cardiometabolic disorders, and cancers, as well as endocrine disruption, reproductive and developmental impacts, elevated lipids, and obesity in epidemiological studies (ATSDR, 2020). Although long-chain legacy PFAS such as Perfluorooctanesulfonic acid (PFOS) and Perfluorooctanoic Acid (PFOA) have begun to be replaced by emerging PFAS of shorter chain length (e. g., Hexafluoropropylene oxide dimer acid; HFPO-DA), mixtures of these legacy and emerging PFAS are evident in the environment and have been found at differing levels circulating in human blood (Sunderland et al., 2019). Using data collected over time from longitudinal studies, long-chain PFAS have estimated half-lives within the human body of multiple years which is comparable to other well studied persistent organic pollutants, such as dioxins and polychlorinated biphenyls (Fu, 2016). The toxicokinetics and distribution of PFAS differ from other legacy pollutants however, as PFAS are more likely to continuously circulate throughout the bloodstream bound to albumin instead of being sequestered in adipose tissue (Han et al., 2003; Salvalaglio et al., 2010). The purpose of this study was to address a current deficiency in the literature by making longitudinal measurements of PFAS and other persistent organic pollutants (POPs) in the same individuals. Data of this type are currently lacking and may be a useful measure of how background levels have changed since legacy PFAS began to be phased out of production during the early 2000s.
The original Anniston Community Health Survey (ACHS I) was completed during 2005–2007 and included volunteers residing in Anniston, Alabama which was a site of polychlorinated biphenyl (PCB) production from 1929 to 1971. Using clinical data and measurements of circulating levels of 35 PCBs, epidemiological studies have shown links between exposure to these persistent organic pollutants and multiple disease pathologies/risk factors including hypertension, endocrine disruption, liver disease and diabetes (Goncharov et al., 2010; Silverstone et al., 2012; Clair et al., 2018; Rosenbaum et al., 2017). Building on these initial reports, a follow-up study took place in 2014 (ACHS II) which included measurement of the original 35 PCBs as well as additional measurements of dioxin-like pollutants and pesticides in surviving participants of ACHS (Yang et al., 2018). Using these newly collected results, we and others have thus far shown associations between persistent organic pollutant (POP) exposure and markers of cardiometabolic disease (i.e., Trimethylamine N-oxide) and hypertension (Petriello et al., 2018; Pavuk et al., 2019; Pavuk et al., 2014). Although quantitating PFAS was not a primary goal of either ACH survey (PFAS was not known to be manufactured in Anniston, Alabama and the area was not a known region of abundant water contamination), the longitudinal nature of the study and additional high quality pollutant measurements make the ACH surveys prime cohorts to study changes in long chain and short chain PFAS over time and to examine how PFAS levels relate to circulating levels of other persistent organic pollutants. Additionally, these cohorts are useful because samples were collected for ACHS I around the time that commercial use of some PFAS, especially PFOS, began to be discontinued and so may represent a high point for legacy PFAS bioaccumulation among the general public of the United States (Olsen et al., 2017). Therefore, the purpose of this present study was to measure a panel of representative legacy and short chain PFAS in samples collected from ACHS II and compare levels collected from the same individuals approximately a decade earlier to observe changes over time. Secondary goals of this study were to (1) examine if levels of PFAS were similar to those of the general adult population by comparing to corresponding NHANES data, and (2) to identify any significant correlations with other persistent organic pollutants and determine if these associations differed over time.
2. Methods
2.1. Description of cohort
Anniston Alabama, a city located between Atlanta, Georgia and Birmingham, Alabama was a major site of PCB manufacturing and environmental discharges from 1929 to 1971. To determine levels of PCBs in this population and to investigate associations with disease risk, the initial Anniston Community Health Survey (ACHS I) began in 2005 and recruited 774 volunteers who provided blood samples and demographic/clinical information (Pavuk et al 2014). Briefly, participants were 46% African American, middle aged (mean 54 years, range:19–79), and 70% female. In 2014, remaining surviving and available individuals from ACHS I were re-consented for a follow-up study (ACHS II; n = 359) and provided an additional blood sample and updated demographic/clinical information. Demographics were similar to the initial study, but ACHS II enrolled 53% African Americans and were obviously older (age range 26–87) (Birnbaum et al., 2016). Based on availability, samples from 297 individuals of ACHS I and 336 from ACHS II were shipped to the University of Kentucky for PFAS analyses. Both long chain (i.e., PFNA, PFOA, PFOS, PFHxS, PFHpA) and short chain (i.e., PFBS, HFPO-DA, and 4.2 FTS) PFAS were measured in ACHS I and ACHS II; Long chain sulfonic acids were categorized by chain lengths greater or equal to 6 and long chain carboxylic acids were categorized by chain lengths greater or equal to 7.
2.2. PFAS extraction and quantitation
PFAS were extracted and analyzed as previously described (Mottaleb et al., 2020). Briefly, 50 μL of serum was extracted in 96-well Impact Protein Precipitation Plates (Phenomenex, CA, USA) using methanol with addition of known concentrations of 13C labeled PFAS (13C-PFOS, 13C-PFOA, 13C -PFNA and 13C-PFHxS, Wellington Laboratories, Guelph, ON) as internal standards and surrogates. Dried extracts were reconstituted in ammonium acetate that contained 3.0 ng/mL of 13C4–PFHpA as internal standard. All extraction plates contained reagent blank (R-BLK), IS (internal standard)-blank and quality control samples. PFAS were quantitated by UHPLC-MS/MS using a Shimadzu ultra-performance liquid chromatography system (UPLC; model: Nexra X2 LC 30 AD) coupled to a Sciex QTRAP mass spectrometer (MS; model: Sciex 6500 plus) operated in negative ionization multiple reaction monitoring (MRM) mode. Parent and product ions for all PFAS, surrogates, and IS as well as instrument settings, and analytical method performance parameters have been reported previously (Mottaleb et al., 2020). PFAS were quantitated using IS-based calibration curves with lower limits of quantitation between 0.04 ng/mL and 0.20 ng/mL and are again reported here in the supplement (Mottaleb et al., 2020). The assay performance in this particular study was identical to that we have previously reported. Before analysis, we verified that the sensitivity of the instrument met or exceeded the manufacturer’s specifications and we used blanks and in batch samples containing low, medium and high analyte levels to monitor instrument performance. With regular cleaning, verification of sensitivity and use of a dedicated UHPLC system the assay performance consistently resulted in CVs of <10% for repeated analysis of these in batch controls.
2.3. Data and statistical analyses
Data analyses was performed using JMP® Pro, Version 14.0. (SAS Institute Inc., Cary, NC). For PFAS concentrations below the limit of quantitation, values were calculated as LOD/√2. Initially, descriptive statistics including mean, median, and variance were determined for all available ACHS I (n = 297) and ACHS II (n = 336) samples. To determine if PFAS differed over time, PFAS values were log transformed (x + 1), matched pairs analysis was completed (n = 294), and P-values corresponding to 2-tailed t-tests between the matched pairs were determined. To compare levels of circulating PFAS to those of the general public, corresponding NHANES 2005–2006 and NHANES 2013–2014 PFAS datasets were downloaded from the Inter-university Consortium for Political and Social Research (ICPSR) website curated by University of Michigan or CDC website. NHANES samples with available demographic and PFAS concentration data were used for subsequent analyses with NHANES. Significant differences between ACHS I and NHANES 2005–2006 as well as between ACHS II and NHANES 2013–2014 were determined using mean and median tests when data were stratified by sex, race, and age. We consider a p-value <0.05 as significant.
Finally, to determine if PFAS concentrations correlated with other pollutants measured, including PCBs, dioxins, pesticides, and PBDEs, we performed correlation and hierarchical cluster analyses for ACHS II (n = 287) and ACHS I data (n = 292; those that also participated in ACHS-I) (Anderberg, 1973; Hand et al., 1994). Correlation analyses addressed the question of whether there is linear relationship between PFAS and other POPs. The cluster analyses used the linear relationship combinations in a different way complementing the correlation analyses. The purpose of cluster analysis is to place objects into groups, or clusters, suggested by the data, not defined a priori (e.g. by chemical structure). Generally, objects in each cluster tend to be similar to each other in some sense, and objects in different clusters tend to be dissimilar. We used the VARCLUS procedure to create hierarchical clusters as some exposure variables (e.g., PCBs) are highly correlated. VARCLUS procedure divides a set of numeric variables into hierarchical clusters with a linear combination of the variables in the cluster (CLUSTER procedure uses distances). This linear combination can be either the first principal component (used in this analyses) or the centroid component; Both options provided similar clustering results (number of clusters and components of the clusters). The cluster analysis maximizes the variance that is explained by the cluster components summed over all clusters using principal components which are the weighted average of the variables that explains as much variance as possible. Unlike principal component analysis, this procedure is oblique, meaning that each cluster component is computed from a different set of variables than all the other cluster components (Harman, 1976). This algorithm is both divisive and iterative and will continue splitting groups until every cluster has only one eigenvalue greater than one (Harris and Kaiser, 1964). Non log-transformed whole weight exposure variables for PCBs, pesticides, and dioxin-like compounds were used for the cluster analysis with PFAS. Pearson’s correlation coefficients were calculated for basic correlation tables to contrast with hierarchical cluster analyses.
3. Results
3.1. PFAS concentrations and change over time
Levels of the indicated PFAS in samples from ACHS I (2005–2007) were as follows: PFOS (mean; 71.1 ng/mL) > PFHxS (mean; 2.35 ng/mL) > PFOA (mean; 2.16 ng/mL) > PFNA (mean; 1.69 ng/mL) > PFHpA (mean; 0.30 ng/mL) > PFBS (mean; 0.05 ng/mL) = HFPO-DA (mean; 0.05 ng/mL) = 4.2 FTS (mean; 0.05 ng/mL) (Table 1). Levels of legacy long chain PFAS such as PFOS and PFOA were found in nearly all individuals, but short chain PFAS were not widely detected (e.g., HFPO-DA only quantitated in 4.4% of individuals; LOD = 0.05 ng/mL). In samples collected in ACHS II (2014), levels of individual PFAS generally declined, but the ratio of abundance was similar to that of ACHS I. However, HFPO-DA was now the most abundant short chain PFAS, but again, was not widely detected (HFPO-DA only above LOD in 8.9% of individuals). The percent above LOD for each PFAS is shown in Table 1. Levels of the indicated PFAS in samples from ACHS II were as follows: PFOS (mean; 34.7 ng/mL) > PFHxS (mean; 1.62 ng/mL) > PFOA (mean; 1.16 ng/mL) > PFNA (mean; 1.04 ng/mL) > PFHpA (mean; 0.13 ng/mL) > HFPO-DA (mean; 0.07 ng/mL) > PFBS (mean; 0.05 ng/mL) > 4.2 FTS (mean; 0.04 ng/mL) (Table 1). Levels of these short chain compounds were close to the limit of detection of our analytical method. The skewness of each PFAS differed, with PFOA appearing most normally distributed. This, and the geometric means for all PFAS are shown in Supplemental Table 8. Finally, as most of the shorter chain PFAS were below the LOD, we report descriptive statistics for all PFAS for individuals that were above LOD in Supplemental Table 9.
Table 1.
PFAS levels in subjects from Anniston Community Health Surveys I and II.
| PFAS | (Mean ± SD) ng/mL | Median ng/mL | Min-Max ng/mL | % above LOD | % Change from ACHS I | *p-value (T-Test) | #p-value (WSRT) |
|---|---|---|---|---|---|---|---|
| ACHS I a | |||||||
| PFBS | 0.05 ± 0.08 | 0.04 | 0.04–1.42 | 14% | |||
| HFPO-DA | 0.05 ± 0.06 | 0.04 | 0.04–0.44 | 4.4% | |||
| 4.2 FTS | 0.05 ± 0.02 | 0.04 | 0.04–0.20 | 10% | |||
| PFOS | 71.1 ± 89.3 | 47.3 | 0.14–781 | 99% | |||
| PFNA | 1.69 ± 1.17 | 1.35 | 0.03–9.67 | 99% | |||
| PFOA | 2.16 ± 1.12 | 1.99 | 0.03–7.53 | 99% | |||
| PFHxS | 2.35 ± 2.72 | 1.75 | 0.14–26.3 | 97% | |||
| PFHpA | 0.30 ± 0.52 | 0.04 | 0.04–6.67 | 35% | |||
| ACHS II b | |||||||
| PFBS | 0.05 ± 0.03 | 0.04 | 0.04–0.34 | 11% | −8.22 | 0.460 | 0.246 |
| HFPO-DA | 0.07 ± 0.11 | 0.04 | 0.04–1.00 | 8.9% | +19.16 | 0.115 | 0.087 |
| 4.2 FTS | 0.04 ± 0.01 | 0.04 | 0.04–0.13 | 4.8% | −6.12 | 0.036 | 0.007 |
| PFOS | 34.7 ± 59.8 | 18.0 | 0.14–688 | 98% | −51.8 | <0.001 | <0.001 |
| PFNA | 1.04 ± 0.95 | 0.882 | 0.03–8.89 | 97% | −39.0 | <0.001 | <0.001 |
| PFOA | 1.16 ± 0.90 | 0.963 | 0.03–6.44 | 97% | −47.5 | <0.001 | <0.001 |
| PFHxS | 1.62 ± 2.55 | 1.17 | 0.14–35.6 | 96% | −33.7 | <0.001 | <0.001 |
| PFHpA | 0.13 ± 0.35 | 0.04 | 0.04–5.13 | 17% | −55.8 | <0.001 | <0.001 |
PFBS = Perfluorobutanesulfonic acid; HFPO-DA = Hexafluoropropylene oxide dimer acid; 4.2 FTS = 4:2 Fluorotelomer sulfonic acid; PFOS = Perfluorooctane sulfonate; PFNA = perfluorononanoate; PFHxS = Perfluorohexane sulfonate; PFHpA = perfluoroheptanoic acid.
PFAS concentrations were not lipid adjusted.
LODs: PFBS, HFPO-DA, 4.2 FTS, PFHpA = 0.05 ng/mL; PFOA, PFNA = 0.04 ng/mL; PFOS, PFHxS = 0.20 ng/mL
Values below the limit of quantitation were enumerated as .
Total sample size n = 297 was used for descriptive statistics.
Total sample size = 336 was used for descriptive statistics.
Delta from ACHS I and associated p-values are based on mean differences and matched paired t-tests using log transformed data (x + 1). A bold p-value denotes significant differences for a specific PFAS between ACHS I and ACHS II (n = 294).
Determined a significant change from ACHS I by nonparametric Wilcoxon signed-rank test (WSRT) using non log transformed data (n = 294).
Next, we determined the percent change over time of log transformed PFAS and utilized 2-sided matched paired t-tests to determine if these temporal changes between ACHS I and ACHS II were significantly different. In Table 1 we present descriptive statistics for all participants we had sufficient leftover serum for separately for ACHS I and II (n = 297 and n = 336 respectively). When we compared the change between the two studies, only matched data were used (n = 297). PFOS (51.8% decrease), 4.2 FTS (6.12% decrease), PFNA (39.0% decrease), PFOA (47.5% decrease), PFHxS (33.7% decrease), and PFHpA (55.8% decrease) all significantly decreased over time (p < 0.05), whereas HFPO-DA levels increased by nearly 20%, but did not reach significance (p = 0.11). PFBS levels did not significantly change (p = 0.460). Similarly, as log transformation did not robustly normalize PFAS of lower abundance, we also used the non-parametric Wilcoxon signed-rank test to evaluate changes in non-log-transformed PFAS between ACHS I and ACHS II. No differences were observed compared to the results from paired t-Tests.
3.2. PFAS comparisons with national averages
As summarized visually in Fig. 1 and in table form (Supplemental Table 1), mean concentrations of legacy PFAS, especially PFOS, differed in individuals participating in ACHS I compared with corresponding NHANES 2005–2006 data from the same time period. Specifically, PFOS levels were 3.52 times higher in ACHS I compared to NHANES 2005–2006 (p < 0.001). PFNA levels were about 1.3 times higher in ACHS I (p < 0.001). Circulating levels of PFOA and PFHpA were significantly lower in ACHS I samples compared to NHANES 2005–2006 (PFOA:2 times higher in NHANES; p < 0.001; PFHpA, 1.3 times higher in NHANES; p < 0.001). No significant difference was observed for PFHxS between ACHS I and NHANES (p = 0.114). Although PFBS was significantly higher in NHANES 2005–2006, this difference was driven primarily by a higher limit of detection. Quantitation of HFPO-DA and 4.2 FTS was not included in NHANES 2005–2006 because these compounds were not then known to be present in the environment. Comparisons between ACHS II and corresponding NHANES 2013–2014 resulted in similar observations (Supplemental Table 1 and Fig. 1). Interestingly, PFOS levels may have decreased at a slower rate than the national average as ACHS II concentrations were determined to be 5.86 times higher than NHANES 2013–2014 (compared to 3.51 times higher between ACHS I and NHANES 2005–2006). PFNA remained higher in ACHS II (1.2 times) and PFOA remained lower (1.9 times). PFHxS was significantly decreased in ACHS II (1.2 times) and PFHpA was significantly increased (1.6 times) compared to national averages. However, there is no PFAS exposure characterization for ACHS and possible sources of PFAS exposure in Anniston AL and their relationship to sources of exposure for the general population are not known. Finally, because levels of PFOS were considerably higher than anticipated in ACHS I and ACHS II, we re-extracted and quantitated a subset of samples from individuals with the highest levels of PFOS along with an equal number of randomly selected samples. The R2 values for comparison of the two data sets were between 0.98 and 0.86 depending on the PFAS (Supplemental Fig. 1).
Fig. 1.
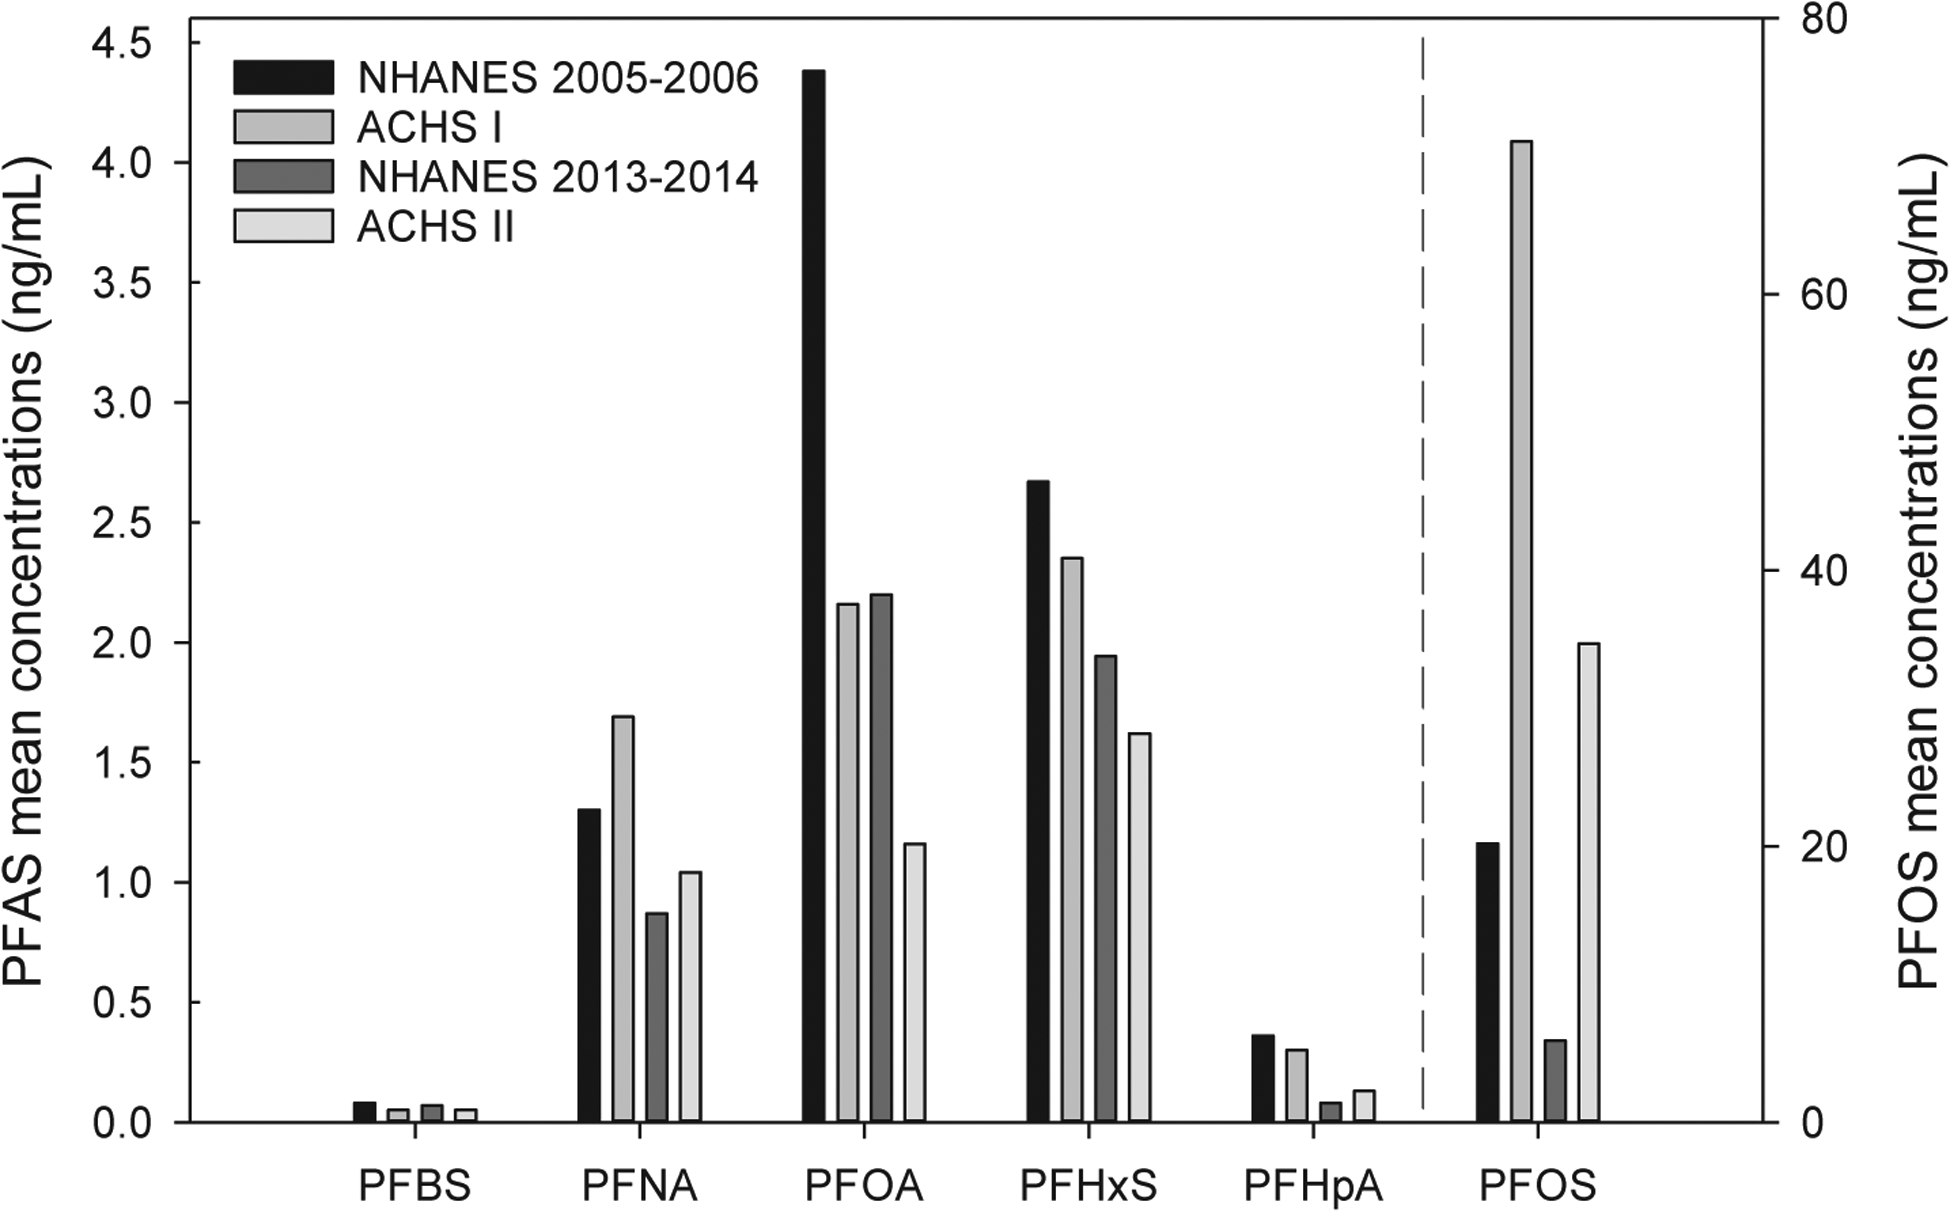
Summary of mean PFAS levels in ACHS I, ACHS II, and comparison to NHANES. Total available samples sizes were used for this summary figure. Please see supplemental Table 1 for variances and statistical comparisons. PFBS = Perfluorobutanesulfonic acid; PFOS = Perfluorooctane sulfonate; PFNA = perfluorononanoate; PFHxS = Perfluorohexane sulfonate; PFHpA = perfluoroheptanoic acid. All PFAS concentrations are shown in ng/mL and please note the unique y axis for PFOS. NHANES 2005–2006 LODs: PFOA,PFBS, PFNA,PFHxS = 0.1 ng/mL, PFOS = 0.2 ng/mL, PFHpA = 0.4 ng/mL. NHANES 2013–2014 LODs: All 0.1 ng/mL. ACHS I and II LODs: PFBS, PFHpA = 0.05 ng/mL; PFOA, PFNA = 0.04 ng/mL; PFOS, PFHxS = 0.20 ng/mL.
We next attempted to determine if the observed differences in PFAS levels between national averages and residents of Anniston, Alabama were preserved if subjects were stratified by sex, race, or age. Table 2 shows that the differences between PFOS and PFOA in either ACHS I or ACHS II with their corresponding NHANES datasets were, in general, not sex specific. However, PFNA was only significantly higher in female residents of Anniston (in both ACHS I and ACHS II). Also, in ACHS II, PFHxS was significantly lower than in NHANES only in males and PFHpA was only significantly increased compared to NHANES in females. Similarly, PFOS and PFOA differences between ACHS and NHANES were not specific to African Americans or Whites (Supplemental Table 3). Additionally, although comparisions between White and African American subjects was not a focus of this biomonitoring study, NHANES levels of PFOS were similar for African Americans and Whites but in both ACHS I and ACHS II PFOS levels were ~2 times higher in African Americans. Interestingly, in both ACHS I and ACHS II, PFNA was only significantly different from corresponding NHANES levels in African Americans. In ACHS I, white residents of Anniston, Alabama showed significantly lower levels of PFHxS and PFHpA. In ACHS II, both races had significantly lower levels of PFHxS, but African Americans only exhibited a significant increase in PFHpA compared to corresponding NHANES data. Finally, racial differences in PFOS and PFOA levels were not specific to older or younger participants (Supplemental Table 2). Using median ages of either NHANES 2005–2006 or NHANES 2013–2014 as respective stratification points, we noted that higher median levels of PFNA in ACHS I were more pronounced in younger subjects. This observation was similar for PFHxS when comparing ACHS I and NHANES 2005–2006, but in the opposite direction (lower in younger individuals of ACHS I). For PFHpA, mean levels were significantly lower in ACHS I compared to NHANES 2005–2006 only in younger individuals, whereas mean levels were significantly higher in ACHS II compared to NHANES 2013–2014 only in older individuals. On the other hand, comparing median levels we observed that PFHpA levels are significantly lower in both age groups. Overall lower levels of PFHpA were generally observed across both age groups.
Table 2.
Comparisons between ACHS I & ACHS II with corresponding NHANES stratified by sex.
| PFAS | Year1 | Value | Levels in ACHS I or ACHS II | Levels in Corresponding NHANES | p-Value (T-test)2 | p-Value (Median Test)2 | ||||
|---|---|---|---|---|---|---|---|---|---|---|
| N | Mean (SD) | Median (Q1,Q3) | N | Mean (SD) | Median (Q1,Q3) | |||||
| PFBS (ng/mL) | 2005–2007 | Female | 208 | 0.047 (0.023) | 0.04 (0.04, 0.04) | 728 | 0.079 (0.066) | 0.07 (0.07, 0.07) | <0.0001 | <0.0001 |
| 2005–2007 | Male | 88 | 0.061 (0.15) | 0.04 (0.04, 0.04) | 751 | 0.081 (0.098) | 0.07 (0.07, 0.07) | 0.2277 | <0.0001 | |
| 2014 | Female | 238 | 0.044 (0.018) | 0.04 (0.04, 0.04) | 681 | 0.071 (0.013) | 0.07 (0.07, 0.07) | <0.0001 | <0.0001 | |
| 2014 | Male | 91 | 0.052 (0.048) | 0.04 (0.04, 0.04) | 635 | 0.070 (0.0021) | 0.07 (0.07, 0.07) | 0.0006 | <0.0001 | |
| PFOS (ng/mL) | 2005–2007 | Female | 208 | 71 (93) | 46 (27, 72) | 728 | 19 (16) | 15 (9.5, 23) | <0.0001 | <0.0001 |
| 2005–2007 | Male | 88 | 73 (80) | 53 (33, 79) | 751 | 27 (20) | 22 (15, 32) | <0.0001 | <0.0001 | |
| 2014 | Female | 237 | 33 (60) | 16 (7.8, 34) | 681 | 6.3 (6.1) | 4.3 (2.6, 8.0) | <0.0001 | <0.0001 | |
| 2014 | Male | 91 | 40 (61) | 23 (11, 38) | 635 | 11 (56) | 6.7 (4.2, 11) | <0.0001 | <0.0001 | |
| PFNA (ng/mL) | 2005–2007 | Female | 208 | 1.7 (1.2) | 1.3 (1.0, 1.9) | 728 | 1.3 (1.3) | 0.90 (0.70, 1.4) | <0.0001 | <0.0001 |
| 2005–2007 | Male | 88 | 1.8 (1.2) | 1.5 (1.2, 2.0) | 751 | 1.5 (1.2) | 1.2 (0.80, 1.8) | 0.1244 | <0.0001 | |
| 2014 | Female | 237 | 1.0 (0.92) | 0.87 (0.47, 1.2) | 681 | 0.83 (0.91) | 0.6 (0.40, 1.0) | 0.0073 | <0.0001 | |
| 2014 | Male | 91 | 1.10 (1.1) | 0.95 (0.47, 1.4) | 635 | 0.93 (0.66) | 0.8 (0.5, 1.2) | 0.1083 | 0.0073 | |
| PFOA (ng/mL) | 2005–2007 | Female | 208 | 2.0 (1.1) | 1.8 (1.3, 2.5) | 728 | 4.0 (3.2) | 3.2 (2.2, 5.0) | <0.0001 | <0.0001 |
| 2005–2007 | Male | 88 | 2.5 (1.2) | 2.4 (1.8, 3.0) | 751 | 5.5 (3.6) | 4.7 (3.3, 6.8) | <0.0001 | <0.0001 | |
| 2014 | Female | 237 | 1.1 (0.91) | 0.93 (0.45, 1.5) | 681 | 2.3 (3.5) | 1.8 (1.1, 2.8) | <0.0001 | <0.0001 | |
| 2014 | Male | 91 | 1.3 (0.87) | 1.1 (0.57, 1.8) | 635 | 2.6 (1.5) | 2.3 (1.6, 3.4) | <0.0001 | <0.0001 | |
| PFHxS (ng/mL) | 2005–2007 | Female | 208 | 2.2 (2.9) | 1.6 (1.1, 2.3) | 728 | 2.3 (3.1) | 1.4 (0.80, 2.8) | 0.5522 | 0.2061 |
| 2005–2007 | Male | 88 | 2.7 (2.2) | 2.2 (1.5, 3.1) | 751 | 3.3 (3.8) | 2.2 (1.3, 3.9) | 0.0308 | 0.8300 | |
| 2014 | Female | 237 | 1.5 (2.5) | 1.1 (0.55, 1.7) | 681 | 1.7 (2.0) | 1.1 (0.60, 2.0) | 0.1764 | 0.7031 | |
| 2014 | Male | 91 | 2.0 (2.6) | 1.4 (0.73, 2.5) | 635 | 2.8 (2.9) | 2 (1.2, 3.2) | 0.0260 | 0.0023 | |
| PFHpA (ng/mL) | 2005–2007 | Female | 208 | 0.30 (0.36) | 0.04 (0.04, 0.59) | 728 | 0.34 (0.39) | 0.28 (0.28, 0.28) | 0.1705 | <0.0001 |
| 2005–2007 | Male | 88 | 0.30 (0.78) | 0.04 (0.04, 0.45) | 751 | 0.38 (0.40) | 0.28 (0.28, 0.28) | 0.3439 | <0.0001 | |
| 2014 | Female | 237 | 0.12 (0.22) | 0.04 (0.04, 0.04) | 681 | 0.086 (0.061) | 0.07 (0.07, 0.07) | 0.0298 | <0.0001 | |
| 2014 | Male | 91 | 0.16 (0.55) | 0.04 (0.04, 0.04) | 635 | 0.081 (0.046) | 0.07 (0.07, 0.07) | 0.1893 | <0.0001 | |
The P values for the comparison of medians was based on the WRST.
NHANES 2005–2006 LODs: PFOA,PFBS,PFNA,PFHxS = 0.1 ng/mL, PFOS = 0.2 ng/mL, PFHpA = 0.4 ng/mL. NHANES 2013–2014 LODs: All 0.1 ng/mL.
2005–2007 = ACHS I and NHANES 2005–2006; 2014 = ACHS II and NHANES 2013–2014.
P-values are determined using non-log transformed data and designate differences between ACHS I and NHANES 2005–2006 or ACHS II and NHANES 2013–2014.
Finally, although not a focus of this current biomonitoring study, we compared certain demographic/anthropometric parameters and clinical data between ACHS I and NHANES 2005–2006 to determine possible contributing factors for the observed differences in PFAS levels between the two datasets. Total cholesterol, LDL cholesterol, and triglyceride levels did not differ considerably between the two datasets, but BMI and age were notably different (NHANES mean age; 27.9, mean BMI: 25.1; ACHS I mean age: 55.1, mean BMI; 32.0 (data not shown). To attempt to account for differences in age, we included age stratified comparisons between NHANES and ACH studies as described in the preceding paragraph and summarized in Supplemental Table 2.
3.3. PFAS correlations with other POPs
In general, human biomonitoring studies reveal high correlations between congeners of the same classes of chemicals, i.e. PCBs and some pesticides. The correlations between different chemical classes depend on number of factors (manufacturing, industrial uses or commercial applications and consequent releast into the environment) and these factors have not yet been comprehensively elucidated for PFAS. We examined hierarchical clustering of exposures to different environmental chemcials in ACHS I and ACHS II (Fig. 2). ACHS I data exhibits two main clusters, one including highly chlorinated PCB congeners, two PFAS analytes – PFBS and 4:2 FTS – and chlorinated pesticides: trans-Nonaroclor, oxycholordane, and γ-HCCH. The PCBs on the other side of the tree form the other large cluster and the bais for this segregation is primarily related to the chlorine substitution groupings. ‘Industrial’ PCBs, found in higher levels historically at production and use sites and that are consquently commonly observed in serum from both industrial workers and the general population, PCBs 74, 99, 118, 138, 153, 187, are at the bottom of the tree, tracking with the majority of industrially used PFAS: PFOS, PFNA, PFHxS, and PFHpA. Mirex rounds up this cluster, which relates most closely to other chlorinated pesticides: hexachlorobenzene (HCB), β-HCCH, pp’-DDE, and pp-DDT. The rest of the lesser chlorinated PCBs in this cluster (28, 44, 49, 52) are closely related to PFOA, op-DDT, and other 5–6 chlorine substituted PCBs 101, 110, 128, 149, 151 that were also closely related to HFPO-DA.
Fig. 2.

Hierarchical cluster analyses. a. ACHS I Tree (n = 292) *non-log-transformed; wet-weight not lipid adjusted. b. ACHS II Tree (n = 286) *non-log-transformed; wet-weight not lipid adjusted.
For ACHS II, there are two major clusters, one including all PBDEs (including major congeners 99, 147, 153 and 209) and half of PFAS analytes: PFOA, PFHxS, HFPO-DA, and 4.2-FTS; also tracking in this group is op’- DDT. All PCBs are on the other side of the cluster tree retaining the groupings related to chlorine substitution and industrial seen for ACHS I. The ‘industrial’ PCBs (74, 99, 118, 138, 153, 180, 187) are at the bottom of the tree tracking with industrially used PFAS – PFNA and PFHpA. Mirex and total dioxin TEQ round out this cluster which relates most closely to other chlorinated pesticides: trans-Nonachlor, oxychlordane hexachlorobenzene (HCB) in one cluster and p,p’-DDT, p, p’-DDE, and β-HCCH, in the other. This cluster also included the sole polybrominated biphenyl PBB 153 (with t-Nona cluster) and total dioxin TEQ (with the DDT/DDE cluster).
For comparison, we obtained Pearson correlation coefficients to contrast with the cluster analyses (Supplemental Tables 4–7). Of all 7 PFAS analytes, PFOS, PFOA, PFHxS, and PFNA are moderately to highly correlated with each other. The highest correlation was showed for PFNA with PFOS (r > 0.77) and with PFOA (r > 0.56) in ACHS II. There were moderate correlations between PFOA, PFOS, and PFHxS (0.37–0.47). Gen X showed a slight correlation with PFOA (r > 0.23), and PFBS was slightly correlated to 4:2 FTS (r > 0.26) but in general these PFAS correlations to PFOA, PFOS, or PFNA were below 0.2.
We have included PFOS and PFNA in the correlation tables with other POPs (Supplemental Table 4 and Table 6) as those analytes were higher in Anniston data vs NHANES. Pesticides showed generally low correlations with PFAS (r < 0.15) as did PBDEs (low and negative correlations) - in contrast to cluster analysis. PCB74 and PCB153 showed moderate correlations with PFOS and PFNA that were higher than for other PCBs and pesticides (Supplemental Table 4). The correlation coefficients were slightly lower for ACHS I but in general in agreement with ACHS II (PBDEs and dioxins were not measured in ACHS I). For PCBs, higher chlorinated PCBs are highly correlated with each other and moderately correlated with lower chlorinated PCBs and pesticides. Weak or negative correlations were observed among PCBs and PBDEs. Total TEQ was also highly correlated with PCBs 74 and 153 (r > 0.84). The temporal and spatial groupings and correlations identified in cluster analyses are therefore not apparent using only Pearson correlation coefficients.
4. Discussion
Previously, the Anniston Community Health Survey has shown that residents of Anniston, Alabama were highly exposed to polychlorinated biphenyls primarily due to long term chemical manufacturing in the area (Pavuk et al., 2014). Concurrently, residents may have been exposed to other environmental chemicals including pesticides, flame retardants, and per-and poly fluoroalkyl substances from unknown origins, thus a concerted effort has been made to quantitate additional pollutants in the original ACHS and follow-up ACHS II studies. Here, we report on the concentrations of eight PFAS of varying chain length in available samples from these individuals and describe how levels changed between the two studies (~8 years), how levels compare to national averages at that time, and begin to identify patterns of correlation with other previously measured pollutants in ACHS participants. Our findings show that residents of Anniston, Alabama had higher levels of PFOS in both ACHS I and ACHS II compared to NHANES levels during equivalent time periods. PFOS levels were more than three times higher than national averages and PFOS was consistently higher for all the age, race, and sex specific strata compared. Residents of Anniston appear to also be more highly exposed to PFNA than national averages, but these differences for PFNA are much less robust than for PFOS with the differences observed depending on how cohorts were stratified based on age, sex, or race. All longer chain PFAS decreased over the ~8-year period between ACHS studies with these decreases ranging from approximately 30 to 50 percent. Emerging short chain PFAS were not readily detected, but HFPO-DA did appear to be increasing in abundance over time (from 4.4% to 8.9% above LOD). This increase did not reach significance with such a small percentage of individuals having levels above the LOD, but this observation is important and worthy of further investigation in more recent NHANES and other cohorts. Finally, the exact exposure sources of PFAS are unknown in this community, but the presence of the nearby military installations where PFAS could have been used to put out fires or for other purposes as in a number of other military installations around the country (ATSDR, 2020) may be a source of water contamination in this community. Exposure to aqueous film-forming foam (AFFF) contaminants in drinking water may be a source of the higher PFOS in ACHS participants, but possibly not PFNA (Barton et al., 2020). In a 2014 study of individuals residing near an air force base in New Hampshire, geometric mean serum concentrations of PFOS, PFOA, and PFHxS were 8.6 ng/mL (95% CI:8.3–8.9), 3.1 ng/mL (95% CI: 3.0–3.2), and 4.1 ng/mL (95% CI: 3.9–4.3), respectively which does not mirror what we see in Anniston (Daly et al., 2018). However, AFFF is also a source of PFOA, which is not higher in ACHS. There are also reports of additional areas of high PFAS exposure in Alabama (i.e., Decatur) where manufacturing and transport did occur (Worley et al., 2017). Dietary questionnaire information for ACHS was limited to evaluation of local foods potentially contaminated with PCBs and had little explanatory value for our study of PFAS exposures. Also, the available occupational information only asked about potential for other exposure to metals, acids, pesticides; thus, further studies of the exposure routes of PFAS in ACHS participants are warranted.
Quantitation of PFAS in matched samples over time is an important means of estimating biological elimination as well as identifying exposure trends over time. Previous reports have shown that longer chain PFAS such as PFNA are more bioaccumulative than PFAS of shorter chain lengths and sulfonates may be more bioaccumulative than carboxylates (Donat-Vargas et al., 2019). Exceptions include PFHxS which can be considered a shorter chain or longer chain PFAS, depending on the chain length cutoff used, and may have a longer half-life than PFOS. Some prior studies have attempted to estimate half-lives of PFAS, but the values reported are highly variable which may be a consequence of large differences in initial exposure level and the use of different toxicokinetic elimination models (Fu, 2016). In our study, percentage decreases over the ~8 year period were highest for PFHpA, PFOS, and PFOA (all around 50% decrease) and lowest for PFHxS (approximately 30% decrease). Our observed decreases in PFOS and PFOA were similar to other studies of similar timeframe (Worley et al., 2017). Focusing on PFOS, another study of Gullah African Americans from coastal South Carolina showed that PFOS dropped approximately nine percent each year between 2003 and 2013 (Gribble et al., 2015) which is consistent with our observations in residents of Anniston, Alabama. Finally, it is hard to interpret and compare our observations of possibly increased circulating levels of HFPO-DA over time because few studies in the United States focusing on matched serum samples have reported on HFPO-DA levels using analytical methodologies with comparable LODs. It will be important for future NHANES datasets to quantitate HFPO-DA and other emerging short chain PFAS in serum of participants.
In the original ACHS study there were important sex-, age-, and race-related differences between PCB concentrations (Pavuk et al., 2014). Multiple factors including residential proximity to the manufacturing plant, length of residence in the area, and dietary or cultural behaviors (e.g. local fish consumption, geophagia) explained some of the variation in PCB exposures but the main differences associated with to age and race remained (Pavuk et al., 2014). Here, when we stratified our comparisons to national averages based on these demographic parameters, we did not see many obvious differences for most of the PFAS we measured. For example, residents of Anniston, Alabama had higher levels of PFOS at both time points when we compared age, race, and sex matched individuals from NHANES. We note that male residents of Anniston had higher levels of PFAS than females and older residents had higher levels than younger (Supplemental Table 10). PFAS can be eliminated during menstruation and nursing which may play a role in these sexual dimorphisms (Park et al., 2019). There is some evidence that women excrete PFOS and PFHxS more quickly than males, but in our population these differences were marginal at about 10% difference between sexes (Li et al., 2018). Finally, African Americans had higher levels of PFOS than Whites in this study population, which was not seen in the NHANES data (Supplemental Table 10). African Americans were also more highly exposed to PCBs in comparison to White subjects (26) and in ACHS II the mean sum of all PCBs measured was 2–3 times higher in African American subjects than White subjects across all ages (33). While the explanation for these differences is not firmly established, some possibilities have been suggested and these could contribute to the differences in PFOS exposure we report here. While all subjects live in West Anniston, African American subjects mostly live closer to the site of the former PCB manufacturing facility and the waterway running away from it which is at lower elevation than other parts of Anniston AL and has higher soil levels of PCBs. In comparison to white subjects, a larger portion of African American subjects reported consumption of local fish and livestock and eating local clay. Self-reported responses to questions designed to capture possible occupational exposure to PCBs or other environmental chemicals did not reveal obvious differences between African American and White subjects. We therefore suggest the possibility that, as with PCBs, geographic residential location and possibly dietary sources of exposure could account for or contribute to the observed differences in PFOS exposure between African American and White subjects. Clearly further investigation is needed which could include the possibility that surface or drinking water are sources of PFAS exposure that also contribute to these racial differences.
Examining correlations between circulating pollutants may lead to a better understanding of common exposure routes in a community. In previous studies, levels of different PFAS have shown highly heterogenous patterns of collinearity. For example, in one study PFOS significantly correlated with PFHxS with a correlation coefficient of 0.30 (Fry and Power, 2017) but in a separate study PFOS significantly correlated with PFHxS with a stronger correlation coefficient of 0.75 (Watkins et al., 2019). Similar variability in observations was seen between correlations of PFOS and PFNA in these studies. Here, we show that PFNA was strongly correlated with PFOS with correlation coefficients nearing 0.80, and this correlation was seen in both ACHS I and ACHS II. Other correlations were observed, but at weak to moderate levels. HFPO-DA showed slight correlation with PFOA which is interesting as HFPO-DA is a replacement for PFOA as a polymer processing aid for PTFE production. Finally, there are only a few published reports investigating correlations between PFAS levels and other legacy pollutants such as PCBs, pesticides, and PBDEs. It is well established that congeners of similar legacy pollutants regularly show strong correlations with each other, but less is known how concentrations of PCBs and other POPs relate to PFAS. In one study the summed total of PCBs correlated weakly with PFOS with a correlation coefficient of 0.27 and no correlation between PCBs and PFOA was observed (Petersen et al., 2018). Here, pesticides showed generally low correlations with PFAS (r < 0.15) as did PBDEs (low and negative correlations). PCB74 and PCB153 showed moderate correlations with PFOS and PFNA that were higher than for other PCBs and pesticides (Table S3). The correlations coefficients were slightly lower for ACHS I but in general in agreement with ACHS II.
There are multiple strengths and some weaknesses of this work. The strengths are that the analytical measurements of POPs previously reported, and now PFAS, are technically robust and well validated. Also, the longitudinal nature of the two studies over an approximately 8-year timeframe allows statistical analyses for matched pairs to be completed and useful estimates of percent decrease over time to be made. Finally, we believe this to be one of the few studies that report correlation patterns between a wide variety of POPs including PCBs, PFAS, PBDEs, and pesticides. In our study we observed PFOS levels to be higher in residents of Anniston, Alabama compared to age, sex, and race matched individuals within NHANES of corresponding years. A weakness of our study is that these conclusions should be viewed with caution due to differences in age, sex, and other demographics between NHANES and ACHS subjects. For example, both ACHS I and ACHS II were predominately older females of higher BMI; PFAS did significantly positively associate with age in ACHS, but not with BMI (supplemental Fig. 3). Also, although we did not observe differences in age stratified comparisons with NHANES, especially with PFOS, the age differences between the cohorts (NHANES includes children aged 12–18 while no ACHS subjects are younger than 19) could account for or contribute to some observed differences (supplemental Fig. 2). Additionally, in the NHANES years that corresponded to ACHS I and ACHS II, no serum levels of HFPO-DA or 4.2-FTS were quantitated which limits available comparisons. In the NHANES 2013–2014 dataset, HFPO-DA was only quantitated in urine samples, and nearly all samples were below the limit of detection (data not shown) so worthwhile statistical comparisons with ACHS II cannot be made. As a point of reference however, serum HFPO-DA was quantitated above the LOD in 8.9% of individuals within ACHS II compared to only 1.13% of individuals in urine in NHANES 2013–2014; although the limits of detection are slightly between the two studies (ACHS II; 0.05 ng/mL, NHANES; 0.07 ng/mL). Because the LODs in serum and urine are not directly comparable and the relationship between HFPO-DA in serum and excreted in urine is not well understood these differences should be considered preliminary. Simiarly, although we report on PFHpA and PFBS differences between ACHS and corresponding NHANES, these pollutants were not widely detected in ACHS subjects, so differences between ACHS and NHANES should be considered exploratory. Finally, there is some evidence that certain health outcomes such as liver disease may impact on circulating PFAS (Yeung et al., 2013), and there are reports of pollutant-associated liver disease and hyperlipidemia in ACHS (Clair et al., 2018; Aminov, 2013).
5. Conclusions
Residents of Anniston, Alabama were highly exposed to PCBs due to longstanding manufacturing in the area, and here we report that these same individuals simultaneously had high circulating levels of PFOS, and to a lesser-degree, PFNA. Future studies identifying associations between clinical parameters and health outcomes with PFAS exposure in this longitudinal cohort may also identify important synergistic interactions between legacy and emerging persistent organic pollutants. The higher levels of PFOS and PFNA found in African Americans compared to Whites within the ACHS study population points to a need for future investigations to identify sources of PFAS exposure in these subjects.
Supplementary Material
Acknowledgments
We thank Brian Reed for his assistance with the NHANES comparisons and data tables.
Funding
This work was supported by the National Institute of Environmental Health Sciences at the National Institutes of Health [P30ES026529; P30ES020957; R00ES028734, P42ES007380, R35ES028373, P30ES302883, P42ES023716], the intramural program of the NCI/NIH, and used resources at the Lexington, KY VA medical center. The content is solely the responsibility of the authors and does not necessarily represent the official views of the National Institutes of Health or Center for Disease Control and Prevention.
Footnotes
Declaration of Competing Interest
The authors declare that they have no known competing financial interests or personal relationships that could have appeared to influence the work reported in this paper.
Appendix A. Supplementary material
Supplementary data to this article can be found online at https://doi.org/10.1016/j.envint.2021.106907.
References
- ATSDR. Per- and Polyfluoroalkyl Substances (PFAS) and Your Health. 2020. Available from: https://www.atsdr.cdc.gov/pfas/index.html.
- Sunderland EM, Hu XC, Dassuncao C, Tokranov AK, Wagner CC, Allen JG, 2019. A review of the pathways of human exposure to poly- and perfluoroalkyl substances (PFASs) and present understanding of health effects. J. Expo. Sci. Environ. Epidemiol 29 (2), 131–147. [DOI] [PMC free article] [PubMed] [Google Scholar]
- Fu J, et al. , 2016. Occurrence, temporal trends, and half-lives of perfluoroalkyl acids (PFAAs) in occupational workers in China. Sci. Rep 6, 38039. [DOI] [PMC free article] [PubMed] [Google Scholar]
- Han X, Snow TA, Kemper RA, Jepson GW, 2003. Binding of perfluorooctanoic acid to rat and human plasma proteins. Chem. Res. Toxicol 16 (6), 775–781. [DOI] [PubMed] [Google Scholar]
- Salvalaglio M, Muscionico I, Cavallotti C, 2010. Determination of energies and sites of binding of PFOA and PFOS to human serum albumin. J. Phys. Chem. B 114 (46), 14860–14874. [DOI] [PubMed] [Google Scholar]
- Goncharov A, et al. , 2010. Blood pressure and hypertension in relation to levels of serum polychlorinated biphenyls in residents of Anniston. Alabama. J. Hypertens 28 (10), 2053–2060. [DOI] [PubMed] [Google Scholar]
- Silverstone AE, Rosenbaum PF, Weinstock RS, Bartell SM, Foushee HR, Shelton C, Pavuk M, 2012. Polychlorinated biphenyl (PCB) exposure and diabetes: results from the Anniston Community Health Survey. Environ. Health Perspect 120 (5), 727–732. [DOI] [PMC free article] [PubMed] [Google Scholar]
- Clair HB, et al. , 2018. Liver disease in a residential cohort with elevated polychlorinated biphenyl exposures. Toxicol. Sci 164 (1), 39–49. [DOI] [PMC free article] [PubMed] [Google Scholar]
- Rosenbaum PF, Weinstock RS, Silverstone AE, Sjödin A, Pavuk M, 2017. Metabolic syndrome is associated with exposure to organochlorine pesticides in Anniston, AL, United States. Environ. Int 108, 11–21. [DOI] [PMC free article] [PubMed] [Google Scholar]
- Yang E, Pavuk M, Sjödin A, Lewin M, Jones R, Olson J, Birnbaum L, 2018. Exposure of dioxin-like chemicals in participants of the Anniston community health survey follow-up. Sci. Total Environ 637–638, 881–891. [DOI] [PMC free article] [PubMed] [Google Scholar]
- Petriello MC, Charnigo R, Sunkara M, Soman S, Pavuk M, Birnbaum L, Morris AJ, Hennig B, 2018. Relationship between serum trimethylamine N-oxide and exposure to dioxin-like pollutants. Environ. Res 162, 211–218. [DOI] [PMC free article] [PubMed] [Google Scholar]
- Pavuk M, Serio TC, Cusack C, Cave M, Rosenbaum PF, Birnbaum LS, 2019. Hypertension in relation to dioxins and polychlorinated biphenyls from the anniston community health survey follow-up. Environ. Health Perspect 127 (12), 127007. 10.1289/EHP5272. [DOI] [PMC free article] [PubMed] [Google Scholar]
- Pavuk M, Olson JR, Sjödin A, Wolff P, Turner WE, Shelton C, Dutton ND, Bartell S, 2014. Serum concentrations of polychlorinated biphenyls (PCBs) in participants of the Anniston Community Health Survey. Sci. Total Environ 473–474, 286–297. [DOI] [PMC free article] [PubMed] [Google Scholar]
- Olsen GW, Mair DC, Lange CC, Harrington LM, Church TR, Goldberg CL, Herron RM, Hanna H, Nobiletti JB, Rios JA, Reagen WK, Ley CA, 2017. Per- and polyfluoroalkyl substances (PFAS) in American Red Cross adult blood donors, 2000–2015. Environ. Res 157, 87–95. [DOI] [PubMed] [Google Scholar]
- Birnbaum LS, Dutton ND, Cusack C, Mennemeyer ST, Pavuk M, 2016. Anniston community health survey: Follow-up and dioxin analyses (ACHS-II)–methods. Environ. Sci. Pollut. Res. Int 23 (3), 2014–2021. [DOI] [PMC free article] [PubMed] [Google Scholar]
- Mottaleb MA, Petriello MC, Morris AJ, 2020. High-throughput UHPLC-MS/MS measurement of per- and poly-fluorinated alkyl substances in human serum. J. Anal. Toxicol 44 (4), 339–347. [DOI] [PMC free article] [PubMed] [Google Scholar]
- Anderberg MR, 1973. Cluster Analysis for Applications. Academic Press Inc., New York. [Google Scholar]
- Hand DJ, Daly F, Lunn AD, McConway KJ, Ostrowski E (Eds.), 1994. A Handbook of Small Data Sets. Chapman & Hall, London. [Google Scholar]
- Harman HH, 1976. Modern Factor Analysis, third ed. University of Chicago Press, Chicago. [Google Scholar]
- Harris CW, Kaiser HF, 1964. Oblique factor analytic solutions by orthogonal transformation. Psychometrika 32, 363–379. [Google Scholar]
- Barton KE, Starling AP, Higgins CP, McDonough CA, Calafat AM, Adgate JL, 2020. Sociodemographic and behavioral determinants of serum concentrations of per- and polyfluoroalkyl substances in a community highly exposed to aqueous film-forming foam contaminants in drinking water. Int. J. Hyg. Environ. Health 223 (1), 256–266. [DOI] [PMC free article] [PubMed] [Google Scholar]
- Daly ER, Chan BP, Talbot EA, Nassif J, Bean C, Cavallo SJ, Metcalf E, Simone K, Woolf AD, 2018. Per- and polyfluoroalkyl substance (PFAS) exposure assessment in a community exposed to contaminated drinking water, New Hampshire, 2015. Int. J. Hyg. Environ. Health 221 (3), 569–577. [DOI] [PubMed] [Google Scholar]
- Worley RR, Moore SM, Tierney BC, Ye X, Calafat AM, Campbell S, Woudneh MB, Fisher J, 2017. Per- and polyfluoroalkyl substances in human serum and urine samples from a residentially exposed community. Environ. Int 106, 135–143. [DOI] [PMC free article] [PubMed] [Google Scholar]
- Donat-Vargas C, Bergdahl IA, Tornevi A, Wennberg M, Sommar J, Koponen J, Kiviranta H, Åkesson A, 2019. Associations between repeated measure of plasma perfluoroalkyl substances and cardiometabolic risk factors. Environ. Int 124, 58–65. [DOI] [PubMed] [Google Scholar]
- Gribble MO, Bartell SM, Kannan K, Wu Q, Fair PA, Kamen DL, 2015. Longitudinal measures of perfluoroalkyl substances (PFAS) in serum of Gullah African Americans in South Carolina: 2003–2013. Environ. Res 143, 82–88. [DOI] [PMC free article] [PubMed] [Google Scholar]
- Pavuk M, Olson JR, Wattigney WA, Dutton ND, Sjödin A, Shelton C, Turner WE, Bartell SM, Bartell S, Carpenter DO, Cash J, Foushee R, Percy A, Frumkin H, Lavender M, Moysich K, Olson J, Pavuk M, Rosenbaum P, Silverstone A, Weinstock R, Shelton C, 2014. Predictors of serum polychlorinated biphenyl concentrations in Anniston residents. Sci. Total Environ 496, 624–634. [DOI] [PMC free article] [PubMed] [Google Scholar]
- Park SK, Peng Q, Ding N, Mukherjee B, Harlow SD, 2019. Determinants of per- and polyfluoroalkyl substances (PFAS) in midlife women: evidence of racial/ethnic and geographic differences in PFAS exposure. Environ. Res 175, 186–199. [DOI] [PMC free article] [PubMed] [Google Scholar]
- Li Y, Fletcher T, Mucs D, Scott K, Lindh CH, Tallving P, Jakobsson K, 2018. Half-lives of PFOS, PFHxS and PFOA after end of exposure to contaminated drinking water. Occup. Environ. Med 75 (1), 46–51. [DOI] [PMC free article] [PubMed] [Google Scholar]
- Fry K, Power MC, 2017. Persistent organic pollutants and mortality in the United States, NHANES 1999–2011. Environ. Health 16 (1), 105. [DOI] [PMC free article] [PubMed] [Google Scholar]
- Watkins DJ, Vélez-Vega CM, Rosario Z, Cordero JF, Alshawabkeh AN, Meeker JD, 2019. Preliminary assessment of exposure to persistent organic pollutants among pregnant women in Puerto Rico. Int. J. Hyg. Environ. Health 222 (2), 327–331. [DOI] [PMC free article] [PubMed] [Google Scholar]
- Petersen M, Halling J, Jørgensen N, Nielsen F, Grandjean P, Jensen T, Weihe P, 2018. Reproductive function in a population of young faroese men with elevated exposure to polychlorinated biphenyls (PCBs) and perfluorinated alkylate substances (PFAS). Int. J. Environ. Res. Public Health 15 (9), 1880. 10.3390/ijerph15091880. [DOI] [PMC free article] [PubMed] [Google Scholar]
- Yeung LWY, Guruge KS, Taniyasu S, Yamashita N, Angus PW, Herath CB, 2013. Profiles of perfluoroalkyl substances in the liver and serum of patients with liver cancer and cirrhosis in Australia. Ecotoxicol. Environ. Saf 96, 139–146. [DOI] [PubMed] [Google Scholar]
- Aminov Z, et al. , 2013. Analysis of the effects of exposure to polychlorinated biphenyls and chlorinated pesticides on serum lipid levels in residents of Anniston, Alabama. Environ. Health 12, 108. [DOI] [PMC free article] [PubMed] [Google Scholar]
Associated Data
This section collects any data citations, data availability statements, or supplementary materials included in this article.