Abstract
Purpose
The purpose of this study was to examine the diagnostic accuracy of traditional measures of phonological ability developed for monolingual English-speaking children with their bilingual peers in both English and Spanish. We predicted that a composite measure, derived from a combination of English and Spanish phonological measures, would result in higher diagnostic accuracy than examining the individual phonological measures of bilingual children separately by language.
Method
Sixty-six children, ages 3;3–6;3 (years;months), participated in this study: 29 typically developing bilingual Spanish-English–speaking children (x = 5;3), five bilingual Spanish-English–speaking children with speech sound disorders (x = 4;6), 26 typically developing monolingual English-speaking children (x = 4;8), and six monolingual English-speaking children with speech sound disorders (x = 4;9). Children were recorded producing single words using the Assessments of English and Spanish Phonology, and productions were phonetically transcribed and analyzed using the Logical International Phonetics Program. Overall consonants correct–revised; accuracy of early-, middle-, and late-developing sounds; and percent occurrence of phonological error patterns in both English and Spanish were calculated. Receiver operating characteristic curves and support vector machine models were applied to observe diagnostic accuracy, separately and combined, for each speaker group and each language.
Results
Findings indicated the combination of measures improved diagnostic accuracy within both the English and Spanish of bilingual children and significantly increased accuracy when measures from both languages of bilingual children were combined. Combining measures for the productions of monolingual English-speaking children did not increase diagnostic accuracy.
Conclusion
To prevent misdiagnosis of speech sound disorders in bilingual preschoolers, the composite phonological abilities of bilingual children need to be assessed across both gross and discrete measures of phonological ability.
Supplemental Material
Over the past 30 years, evidence-based assessment procedures for bilingual and multilingual children with suspected speech sound disorders have been steadily developing. Twenty years ago, Yavas and Goldstein (1998) recommended that assessment takes place “in all languages” (p. 50) and that if the speech-language pathologist (SLP) does not speak the language of the child, then support personnel, such as interpreters, should be used (e.g., Kayser, 1995). Twenty years later, the American Speech-Language-Hearing Association (ASHA) recommends the same approach. In ASHA's online statement, Key Issues: Service Provision for Bilingual Clients, it is recommended that, during a bilingual evaluation session, a single-word and connected speech sample should be gathered “in all languages used by the client” and should allow for an in-depth analysis (with the support of an interpreter if necessary). Phonological data derived from these sampling techniques is routinely performed “separately” for each language, and results are then compared “across” languages for presence or absence of phonological skills (ASHA, 2019). This approach follows the traditional paradigm of categorizing “difference” versus “disorder” in bilingual clinical practice. Here, we align with recent literature that challenges dichotomy with the notion that disorder occurs within a diverse society, highlighting the presence of children with and without disorders in all linguistic communities (Oetting et al., 2016), whether monolingual or bilingual. Adding nuance to our clinical framework when evaluating bilingual children will allow us to capture a more accurate representation of their phonological abilities, leading to more accurate diagnoses.
This research aims to shift our paradigm on how we observe and interpret phonological development in this population. Bilingual children are not two monolinguals in one (Grosjean, 1989), so it would follow that we should not evaluate their phonologies as such. Instead, the current research proposes that if we can uncover which phonological measures, when combined, are more useful than either language measure alone, then we can more accurately describe the phonological abilities of bilingual children. This approach has been successful in the identification of developmental language disorder (DLD) in bilingual preschoolers (Lazewnik et al., 2019), and here we predict that the same will be true for the identification of speech sound disorders in bilingual children. Rather than examining each language separately and comparing abilities “across” languages, combining language measures cross-linguistically, using a statistical model, might result in more sensitive and specific diagnostic accuracy. This notion of “composite” measures of phonological skills in bilinguals was derived from the intersection of theory on infant speech perception (Curtin et al., 2011) and a series of studies that reflected that framework in the speech production of young bilinguals (Fabiano-Smith & Barlow, 2010; Fabiano-Smith & Goldstein, 2010a, 2010b).
Theoretical Framework
This study was designed to provide further validation of a model of speech sound production in bilinguals in order to frame an assessment procedure for Latinx preschoolers. The Processing Rich Information from Multidimensional Interactive Representations (PRIMIR) model (Curtin et al., 2011) suggests that interaction between bilingual infants' speech perception and speech sound learning can result in differences between monolinguals and bilinguals in speech acquisition. This research extends this model to account for speech “production” differences between monolingual and bilingual children. Because differences in speech sound production have been observed between monolingual and bilingual preschoolers in a series of studies (e.g., Fabiano-Smith & Goldstein, 2010a, 2010b; Gildersleeve-Neumann et al., 2008; Goldstein et al., 2005; Paradis, 2001), in the context of PRIMIR, it is proposed here that those differences are a result of speech sound organization at the representational level.
To illustrate this point, Fabiano-Smith and Goldstein (2010b) examined eight bilingual 3-year-olds and compared them to age-matched monolingual speakers of both English and Spanish. They observed that two of the bilingual children produced initial voiceless stops in English as unaspirated (“telephone” /thɛləfoʊn/ produced as [t=ɛləfon]; “car” /khaɹ/ produced as [k=aɹ], and “toast” /thoʊst/ produced as [t=oʊst]), reflecting Spanish voice onset time (VOT). These findings were then validated acoustically in Fabiano-Smith and Bunta (2012), as VOT measures produced intermediary values for bilinguals that did not align completely with either English or Spanish VOT. The same bilingual children from Fabiano-Smith and Bunta and Fabiano-Smith and Goldstein (2010b) were examined at a different level of the speech sound system in Fabiano-Smith and Barlow (2010). They examined the phonetic inventory complexity of these children and observed Spanish sounds present in their English phonetic inventories and vice versa. Due to similarities between English and Spanish on some phonological structures, the authors argued that between-languages interaction in bilingual phonological representation has the ability to facilitate acquisition of similar phonological elements; however, this facilitation does not result in production that mirrors that of monolingual speakers of either language. Between-languages interaction, they posited, results in a sort of hybrid production that takes into consideration phonological elements of both languages and uses such structures interchangeably, as long as their use does not interrupt successful communication (e.g., substitution of an unaspirated initial voice stop for an initial aspirated stop; substituting the English approximant [ɹ] for the Spanish trill /r/). The current research proposes that because some phonological elements that are distinct between English and Spanish in monolinguals are represented similarly or interchangeably in bilingual phonological representation, measures that capture the combination of English and Spanish skills, rather than observing each language in isolation, will provide the most robust indicator of speech sound disorder in this population.
In order to examine the classification accuracy of measures of phonological ability, we initiated this study with a reference standard for diagnosis of phonological impairment (Dollaghan & Horner, 2011). To date, phonological reference standards have been derived from and developed for, monolingual English-speaking children (e.g., percent consonants correct–revised [PCC-R]: Shriberg, 1993; Shriberg & Kwiatkowski, 1994; percent occurrence of phonological error patterns: McReynolds & Elbert, 1981). Stemming from our theoretical framework that predicts between-languages interaction in bilingual children, we compared the utility of a “composite” measure (i.e., the combination of English and Spanish performance on a measure) to an “index” measure (i.e., measures of phonological ability in English and Spanish, separately). Our purpose was to observe if the combination of English and Spanish language measures resulted in better diagnostic accuracy than examining each language separately. Previous studies have examined composite measures of phonological awareness skills related to literacy (e.g., Masso et al., 2014), but no studies to date have examined composite scores of phonological accuracy in monolingual or bilingual children. In addition, we wanted to observe if the combination of phonological measures within languages yielded higher diagnostic accuracy than examining each measure alone.
Composite Measures
Composite measures have been studied in the literature examining monolingual English-speaking children. For example, Hintze et al. (2003) examined the decision accuracy of the Dynamic Indicators of Basic Early Literacy Skills (DIBELS) and the Comprehensive Test of Phonological Processing in the accurate identification of early literacy impairment in 86 kindergarteners. Their findings indicated that tools and measures developed to identify a particular impairment correlated with one another and that each is a good indicator of that particular ability. However, the two literacy tools they examined did not correlate in all domains. Specifically, using each tool separately did not evaluate all aspects of literacy ability in the group of children they examined, but combined, diagnostic accuracy was high. Similar findings were reported on the DIBELS in Schilling et al. (2007). While measures derived from the DIBELS were found to accurately identify children with literacy impairments, when combined with measures of reading comprehension and vocabulary, diagnostic accuracy grew.
In the domain of bilingualism, Bedore et al. (2010) examined 170 kindergarteners on measures of morphosyntax. Bilingual children produced language samples in both English and Spanish, and those samples were analyzed for number of utterances, number of different words, mean length of utterance (MLU), and percentage of grammatical utterances. Language measures were individually compared to a standardized test score from the Bilingual English–Spanish Assessment (BESA) to evaluate their ability to identify language disorder. They found that a composite score derived from production data in both Spanish and English was necessary to capture the variety of normal morphosyntactic language abilities in bilingual children. Because bilingual children are not functioning as two monolinguals in one, the authors argued that it was essential that English and Spanish abilities be evaluated simultaneously in order to capture all skills, across both languages, at any point in language development.
Potapova et al. (2018) examined 74 preschool-age bilingual Spanish-English–speaking children on both separate and combined measures of morphosyntactic ability. Accuracy of morpheme marking, calculated by collapsing both correct and incorrect productions across multiple morphemes, served as the composite measure. Tense marker total (the contrastive use of five morpheme categories) and T/A productivity score (TAP score; the diversity of contexts that children use for morpheme production) were also compared to broader measures such as MLU in words and number of different words. Their findings indicated that, for bilingual children, the composite measure was not the best predictor of low language ability. Rather, tense marker total and TAP score correlated strongly with broader measures and were more clinically useful in identification of bilingual children with language impairment. It is important to point out that this study only examined the English productions of bilingual children, so no cross-language composite scores were generated. These findings point out, however, that there is not a consensus in the literature on composite scoring and accurate identification of language impairment in bilingual children.
Lazewnik et al. (2019) examined the ability of the Morphosyntax and Semantics subtests of the BESA (Peña et al., 2013) to accurately identify disorders in bilingual Spanish-English–speaking 4- and 5-year-olds. Specifically, they found that combining subtests provided a higher level of sensitivity and specificity than examining each measure separately. Classification accuracy was its best when both formal and informal measures of language ability were combined. If the combination of measures for morphosyntactic skills in bilinguals leads to better identification accuracy, it follows that this possibility exists for phonology as well.
The goal of this study was to uncover what measures of phonological accuracy are predictive of impairment in bilingual children. Additionally, we aimed to evaluate if a combination of phonological measures or a composite measure increased diagnostic accuracy. This finding would support previous research that observed this effect in the morphosyntactic evaluation of bilingual Spanish-English–speaking children (e.g., Bedore et al., 2010). We wanted to observe this possibility for each language separately and then again when measures from the two languages of the bilingual child were combined. Furthermore, using receiver operating characteristic (ROC) curves, we aimed to derive diagnostic cutoff scores that are specific to the bilingual Spanish-English–speaking preschooler population to guide diagnostic decision making for SLPs evaluating the speech of bilingual children.
Research Questions and Hypotheses
Due to differences in speech production found in bilingual preschoolers when compared to their monolingual English-speaking peers (Fabiano-Smith & Barlow, 2010; Fabiano-Smith & Goldstein, 2010a, 2010b), we predicted that a composite measure that considers the “combination” of both English and Spanish phonological performance would increase classification accuracy of bilingual preschoolers with and without speech sound disorders.
We predicted that due to structural differences between English and Spanish (i.e., phonotactics), not all traditional measures of phonological ability have strong diagnostic accuracy for bilingual Spanish-English–speaking children. For example, English phonotactics allow three-member word-initial onset clusters and word-initial /s/ clusters, while Spanish allows only two-member onset clusters and no word-initial /s/ clusters (Hammond, 2000). We tested a variety of phonological measures, at different levels of the sound system, to observe a set of measures that are strong diagnostic indicators of speech sound disorder in bilingual preschoolers. Alternatively, traditional measures developed for English-speaking children could have equal ability in identifying speech sound disorders in bilingual children.
We predicted that due to between-languages interaction in bilingual phonological representation (PRIMIR Curtin et al., 2011), a combination of English and Spanish phonological measures would result in a composite measure that better predicts speech sound disorders in bilingual Spanish-English–speaking children than a phonological measure from either language alone. Alternatively, the combination of English and Spanish measures could have the same diagnostic accuracy as either English or Spanish measures observed separately by language.
We predicted that the combination of measures, across differing levels of the sound system (i.e., PCC-R; accuracy of early, middle, and late (EML)-developing phonemes; and percent occurrence of phonological error patterns), would provide higher diagnostic accuracy “within” languages than examining each measure independently.
Method
Tucson, Arizona is a southwestern U.S. city located approximately 60 miles north of the United States–Mexico border. Approximately 43.3% of Tucson residents identify as Hispanic/Latinx/Latine, and 26% of the population speaks Spanish, either exclusively or in addition to English (Data USA, 2019). The State of Arizona has an English-only policy of instruction in public schools (Arizona Proposition 203, 2000); therefore, a large number of children in this part of the United States are experiencing Spanish language loss while acquiring English (Fitzsimmons-Doolan et al., 2017). The school district where this study took place is 83.7% Hispanic/Latinx/Latine. All children attended a Title I preschool or kindergarten program where 86% of the children receive free and reduced lunch and 13% of the students receive special education services (Sunnyside Unified School District, 2017). With the poverty rate of Latinx residents in Tucson at 23.6% (Map AZ Dashboard, 2018) and the poverty rate for U.S. Latinx children at 23.5% (Pew Research Center, 2014), the majority of the children included in this study come from a low socioeconomic status (determined by the primary caregiver's level of education). The research team included Latine undergraduate and graduate students from the home communities of the children and families who participated in the study. Latine research team members served as cultural brokers between the university research team and the South Tucson Latine community. Their input and perspectives were centered in data collection and interpretation.
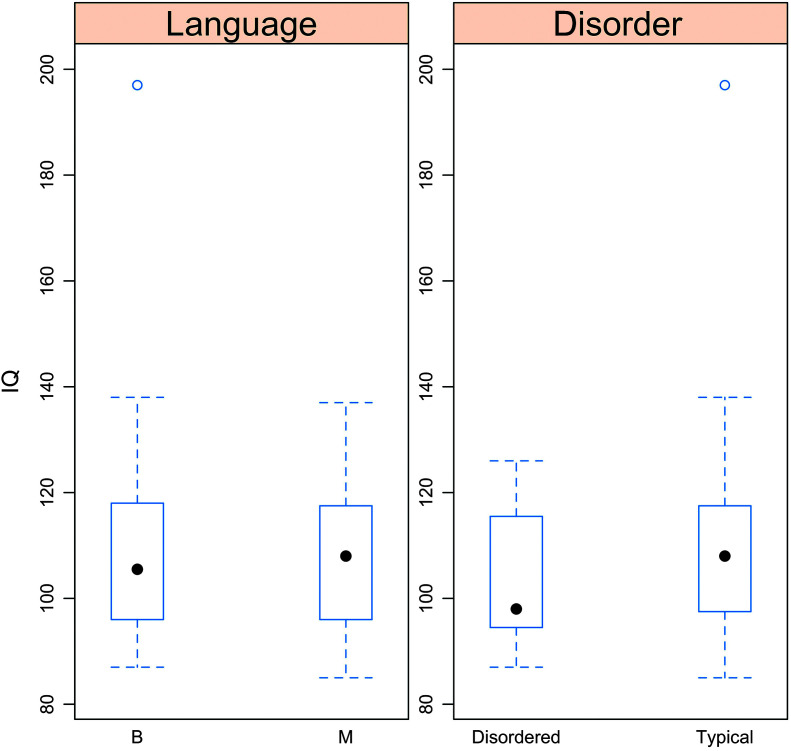
The research protocol for this study was approved by the institutional review board (IRB) at The University of Arizona. Sixty-six children, ages 3;3–6;3 (years;months), participated in this study: 29 typically developing bilingual Spanish-English–speaking children (x = 5;3), five bilingual Spanish-English–speaking children with speech sound disorders (x = 4;6), 26 typically developing monolingual English-speaking children (x = 4;8), and six monolingual English-speaking children with speech sound disorders (x = 4;9; see Table 1). Neither chronological age nor IQ score was significantly different across groups (see Figure 1). Participant demographics can be found in Table 2. A subset of the children in this study were included in the cohort examined in Fabiano-Smith and Hoffman (2018), as they are part of a larger database of children collected via two National Institutes of Health projects.
Table 1.
Participant distribution by language and phonological ability, with the sample size and mean and standard deviation of the age (in months, listed in parentheses).
| Condition | Language |
|
|---|---|---|
| Monolingual | Bilingual | |
| Typical | 26 (58.35, 10.0) | 29 (63.62, 6.22) |
| Disordered | 6 (59.17, 10.03) | 5 (55.20, 4.27) |
Figure 1.
Box plots for nonverbal IQ scores for all participants by language group and phonological ability. B = bilingual; M = monolingual.
Table 2.
Participant demographics for all language and ability groups.
| Participant ID | Chronological age in years;months (months) | Sex | Monolingual (M) or bilingual (B) | GFTA-2 score (monolinguals) | BESA score English (bilinguals) | BESA score Spanish (bilinguals) | Diagnostic category | Percent output English | Percent output Spanish |
|---|---|---|---|---|---|---|---|---|---|
| MD1 | 4;6 (54) | Male | M | 72 | Disordered | 100 | 0 | ||
| MD2 | 6;6 (78) | Male | M | 83 | Disordered | 100 | 0 | ||
| MD3 | 4;4 (52) | Male | M | 65 | Disordered | 100 | 0 | ||
| MD4 | 5;3 (63) | Female | M | 83 | Disordered | 100 | 0 | ||
| MD5 | 4;5 (53) | Male | M | 56 | Disordered | 100 | 0 | ||
| MD6 | 4;7 (55) | Male | M | 82 | Disordered | 100 | 0 | ||
| MT1 | 4;4 (52) | Female | M | 86 | Typical | 100 | 0 | ||
| MT2 | 5;0 (60) | Male | M | 97 | Typical | 100 | 0 | ||
| MT3 | 3;10 (46) | Female | M | 107 | Typical | 100 | 0 | ||
| MT4 | 5;8 (68) | Female | M | 111 | Typical | 100 | 0 | ||
| MT5 | 5;8 (68) | Female | M | 109 | Typical | 100 | 0 | ||
| MT6 | 5;7 (67) | Male | M | 111 | Typical | 100 | 0 | ||
| MT7 | 5;2 (62) | Female | M | 112 | Typical | 100 | 0 | ||
| MT8 | 5;11 (71) | Male | M | 103 | Typical | 100 | 0 | ||
| MT9 | 5;8 (68) | Female | M | 97 | Typical | 100 | 0 | ||
| MT10 | 5;10 (70) | Female | M | 100 | Typical | 100 | 0 | ||
| MT11 | 4:11 (59) | Male | M | 113 | Typical | 100 | 0 | ||
| MT12 | 3;9 (45) | Female | M | 102 | Typical | 100 | 0 | ||
| MT13 | 3;7 (43) | Male | M | 117 | Typical | 100 | 0 | ||
| MT14 | 4;11 (59) | Female | M | 110 | Typical | 100 | 0 | ||
| MT15 | 4;9 (57) | Female | M | 117 | Typical | 100 | 0 | ||
| MT16 | 5;6 (66) | Male | M | 103 | Typical | 100 | 0 | ||
| MT17 | 5;5 (65) | Female | M | 100 | Typical | 100 | 0 | ||
| MT18 | 4;2 (50) | Male | M | 113 | Typical | 100 | 0 | ||
| MT19 | 5;4 (64) | Female | M | 99 | Typical | 100 | 0 | ||
| MT20 | 5;5 (65) | Female | M | 86 | Typical | 100 | 0 | ||
| MT21 | 3;4 (40) | Female | M | 87 | Typical | 100 | 0 | ||
| MT22 | 4;11 (59) | Female | M | 110 | Typical | 100 | 0 | ||
| MT23 | 5;7 (67) | Female | M | 112 | Typical | 100 | 0 | ||
| MT24 | 5;4 (64) | Male | M | 85 | Typical | 100 | 0 | ||
| MT25 | 4;5 (53) | Male | M | 94 | Typical | 100 | 0 | ||
| MT26 | 3;3 (39) | Male | M | 94 | Typical | 100 | 0 | ||
| BD1 | 4;0 (48) | Female | B | 75 | 65 | Disordered | 28.50 | 71.50 | |
| BD2 a | 4;9 (57) | Female | B | 70 | 65 | Disordered | Not available | Not available | |
| BD3 | 4;9 (57) | Female | B | 75 | 75 | Disordered | Not available | Not available | |
| BD4 | 4;7 (55) | Female | B | 80 | 75 | Disordered | Not available | Not available | |
| BD5 | 4;11 (59) | Male | B | 60 | 55 | Disordered | Not available | Not available | |
| BT1 | 5;4 (64) | Female | B | 115 | 65 | Typical | Not available | Not available | |
| BT2 b | 5;7 (67) | Female | B | 120 | NA | Typical | 65.40 | 34.60 | |
| BT3 | 5;7 (67) | Female | B | 100 | 105 | Typical | 44 | 56 | |
| BT4 a | 5;8 (68) | Male | B | 110 | 95 | Typical | Not available | Not available | |
| BT5 | 5;9 (69) | Female | B | 115 | 90 | Typical | 52 | 48 | |
| BT6 a | 5;5 (65) | Male | B | 115 | 100 | Typical | Not available | Not available | |
| BT7 | 6;3 (75) | Female | B | 95 | 85 | Typical | 71.5 | 28.5 | |
| BT8 | 5;5 (65) | Female | B | 115 | 85 | Typical | 81 | 19 | |
| BT9 a | 6;1 (73) | Female | B | 85 | 100 | Typical | Not available | Not available | |
| BT10 | 5;5 (65) | Male | B | 105 | 70 | Typical | 73 | 7 | |
| BT11 a | 5;0 (60) | Female | B | 95 | 105 | Typical | Not available | Not available | |
| BT12 | 4;7 (55) | Male | B | 90 | 80 | Typical | 57 | 43 | |
| BT13 | 5;0 (60) | Female | B | 105 | 80 | Typical | 81.25 | 18.75 | |
| BT14 a | 5;6 (66) | Female | B | 110 | 90 | Typical | Not available | Not available | |
| BT15 | 5;4 (64) | Male | B | 100 | 80 | Typical | 71 | 29 | |
| BT16 | 5;6 (66) | Female | B | 105 | 70 | Typical | Not available | Not available | |
| BT17 | 5;5 (65) | Male | B | 100 | 80 | Typical | Not available | Not available | |
| BT18 | 4;10 (58) | Female | B | 115 | 80 | Typical | Not available | Not available | |
| BT19 | 5;7 (67) | Male | B | 115 | 80 | Typical | Not available | Not available | |
| BT20 | 4;11 (59) | Female | B | 115 | 100 | Typical | Not available | Not available | |
| BT21 | 4;8 (56) | Female | B | 100 | 100 | Typical | 50 | 50 | |
| BT22 | 5;8 (68) | Male | B | 90 | 85 | Typical | 73 | 29.60 | |
| BT23 | 4;4 (52) | Male | B | 100 | 85 | Typical | 62.96 | 37.04 | |
| BT24 | 6;2 (74) | Female | B | 100 | 70 | Typical | Not available | Not available | |
| BT25 b | 5;5 (65) | Male | B | 110 | NA | Typical | 53 | 47 | |
| BT26 | 6;0 (72) | Male | B | 90 | 60 | Typical | 67 | 33 | |
| BT27 | 5;5 (65) | Male | B | 110 | 70 | Typical | 57 | 43 | |
| BT28 | 5;6 (66) | Male | B | 110 | 85 | Typical | Not available | Not available | |
| BT29 | 4;8 (56) | Female | B | 100 | 105 | Typical | Not available | Not available |
Note. GFTA-2 = Goldman-Fristoe Test of Articulation–Second Edition; BESA = Bilingual English–Spanish Assessment; MD = monolingual, disordered; MT = monolingual, typical; BD = bilingual, disordered; BT = bilingual, typical.
Parents or guardians were not able to be reached for the parent interview. Background information was obtained via the school speech-language pathologist, educational records on file, or the classroom teacher. Percent language input and output could not be calculated; however, if the child provided speech samples in both languages, they were classified as bilingual.
This child was one the first children recorded for this study, and there were audio issues associated with the microphone; therefore, the Spanish BESA scores are unavailable because the recordings could not be accurately transcribed. These children performed in the typical range in English, so they were classified as typical.
Determining Degree of Bilingualism
Bilingual children who demonstrated at least 20% input and output in both of their languages per parent report were included in our study (Pearson et al., 1997). We acknowledge the inherent difficulty in quantifying language exposure and use; therefore, we employed the most current evidence-based methods available and gathered as much detail on each child's linguistic environment as possible (e.g., Gutiérrez-Clellen et al., 2006; Peña et al., 2002, 2003). An extensive parent report (Pearson et al., 1997), gathered by a Latine research team member from the families' community, was used to determine each child's language status (bilingual), bilingual type (simultaneous or sequential), language use of the parents, socioeconomic status (maternal level of education), degree of parental bilingualism (length of time in the United States and languages spoken in the home by whom), cognitive status of the child (medical history), and phonological status (typically developing or disordered). According to Gutiérrez-Clellen et al. (2006), the use of parent interview to quantify a child's language use and exposure aids in the determination of language proficiency in the absence of standardized tests. Parent report was used to determine percent input and output in both languages on an average day (Pearson et al., 1997), length of exposure to both languages (after Restrepo, 1998), and ratings on a 4-point proficiency rating scale from 0 (not able to speak or understand the language) to 4 (native-like ability; Peña et al., 2002, 2003). Bilingual children included in this study had a reported score of 3 or 4 in both languages to be included in the bilingual group and a score of 4 in English for monolinguals. Teacher interview included questions regarding literacy development, language use in the classroom, and teacher concern about intelligibility of speech. No children included in the study had a history of hearing impairment. Per the IRB protocol, parents were called a maximum of 3 times to obtain background information and language exposure and use information. If after three calls the parents were unable to be reached, we recorded those demographic data as “not available” (see Table 2). As much data as possible were collected from school records and the classroom teacher if parents could not be reached.
Classification of Children Into Typical and Disordered Speech Categories
Children were placed into typically developing and disordered categories based on data from (a) the converging concern approach (Restrepo, 1998) and (b) standardized tests appropriate for their monolingual or bilingual status. For children to be categorized as typically developing, it was required that the parents, teachers, and the school SLP had no concerns about the child's speech sound development. To verify these reports, monolingual English-speaking children had to score within the typical range on the Goldman-Fristoe Test of Articulation–Second Edition (GFTA-2; Goldman & Fristoe, 2000), and bilingual children had to score within the typical range in at least one language on the Phonology subtest of the BESA (Peña et al., 2013). For children to be labeled as presenting with a speech sound disorder, parents, teachers, and the school SLP had to demonstrate concern about the child's speech sound development, and this concern had to be validated by the GFTA-2 or the Phonology subtest of the BESA. Children who had a history of language disorder but who did not present with a speech sound disorder were excluded from analysis because they did not meet the inclusionary or exclusionary criteria for either the typical or the disordered group. We acknowledge that our categorization criteria were strict and that we may have missed children in the mildly disordered range; however, in order to observe clearly the distinction between each speech ability group on each measure, we closely followed the aforementioned protocol. Bilingual children had to present with scores in the below average range on the Phonology subtest of the BESA in both languages to be placed in the disordered category. Research assistants were blinded as to whether children belonged to the typical or disordered group for data transcription and analysis, but the statistician was not blinded to child categorization. Because sensitivity and specificity are not 100% accurate for standardized test scores and the accuracy of parent and teacher reports is not guaranteed, the statistician identified two children in the bilingual group who were patterning as disordered, even though the standardized test of phonological ability identified them as typical. They were reassigned to the disordered category.
Data Collection
Data collection took place in a soundproof audiology booth at the children's preschool. A bilingual Latine Spanish-English–speaking research assistant performed data collection in both English and Spanish for the single-word samples. A group of three bilingual Spanish–English research assistants shared the task of administering the nonverbal cognition test (described below).
Nonverbal Test of Cognition
In order to rule out the influence of cognitive impairment on phonological ability, the Nonverbal subtest of the Kaufman Assessment Battery for Children, Second Edition (Kaufman & Kaufman, 2004) was administered to each child. The test administrator used English, Spanish, or both languages to provide instructions to the children, depending on their language preference. A nonverbal test of cognition was chosen in order to observe cognitive skills independent of language abilities. Children who demonstrated scores within the average range or in the above average range were moved to the next step in the data collection process. Children who performed in the below average range were referred to the school psychologist for cognitive testing and excluded from the study.
Single-Word Samples
The Assessment of English Phonology (AEP; Barlow, 2003a) and the Assessment of Spanish Phonology (ASP; Barlow, 2003b) were used to collect single-word samples. These protocols reflect the type and frequency of phonemes, syllable types, and word shapes in English and Spanish. Children are able to complete approximately 60 items per protocol, and targets are randomized across items so that there are opportunities for each sound or structure to be produced multiple times. A PowerPoint presentation was displayed on a tablet that consisted of child-friendly pictures of common objects and verbs, and children are asked, “What is this?” or “Qué es esto?” If the child did not spontaneously produce the target word or labeled the picture in the nontarget language, children were prompted to produce the word in imitation (Goldstein et al., 2004). Goldstein et al. (2004) found that Spanish-speaking children with speech sound disorders were no more accurate in imitated than in spontaneous productions during single-word tests; therefore, the concern that imitation would inflate production accuracy was alleviated. Monolingual English-speaking children completed the AEP, and bilingual children completed both the AEP and the ASP. Children's productions were recorded using a Zoom H4n handy recorder (Zoom, 2015). Recordings were taken back to the laboratory and transferred to an encrypted server where they were organized for transcription.
Transcription of Samples
Bilingual Spanish-English–speaking undergraduate students trained in narrow International Phonetic Alphabet performed phonetic transcription for both Spanish and English samples, and native monolingual English-speaking students performed data transcription of English samples. The Logical International Phonetics Program (LIPP; Oller & Delgado, 2000) was used in conjunction with Express Scribe foot pedals (NCH Software, 2015) and Sennheiser HD 400S over-ear headphones (Sennheiser, 2018).
Reliability Analyses
Inter- and intrarater reliability was performed on 100% of the transcribed samples. Across English samples, intrarater reliability reached 96.74%, and interrater reliability reached 96.58%. For Spanish samples, intra- and interrater reliability reached 98.17% and 95.08%, respectively.
Phonological Analyses
Phonological analyses were performed in English for monolingual English speakers and in both English and Spanish for bilingual children.
PCC-R
PCC-R is a measure of overall consonant accuracy that takes into consideration substitution and omission errors but excludes distortion errors (Shriberg et al., 1997). This measure was developed for use with English-speaking preschool-age children to judge level of phonological ability between the ages of 3 and 6 years and is positively correlated with speech intelligibility (e.g., Miccio, 2002). To maintain consistency with previous research on the phonological abilities of both bilinguals and monolinguals alike, PCC-R was selected rather than the original PCC measure (Shriberg & Kwiatkowski, 1982). Shriberg et al. (1997) calculated PCC and PCC-R measures using connected speech samples; however, the current study utilized single-word samples for analysis, in line with clinical use of the measure, as well as more recent research (Fabiano-Smith & Goldstein, 2010a, 2010b; Fabiano-Smith & Hoffman, 2018; Gildersleeve-Neumann et al., 2008; Sabri & Fabiano-Smith, 2018). The LIPP was used to calculate both PCC-R and the following analysis of accuracy of EML-developing phonemes in both languages.
Accuracy of EML-Developing Phonemes
Accuracy of EML-developing phonemes is a measure of phonological acquisition that was developed and validated for monolingual English-speaking children by Shriberg (1993) and for the Spanish and English of bilingual children by Fabiano-Smith and Goldstein (2010a; see Table 3). Accuracy of EML-developing sounds is a discrete measure that can be compared to the broader measure of PCC-R. Due to the difference between English and Spanish on the number of consonant phonemes in each language, English breaks down into eight EML-developing phonemes in each category while Spanish includes six phonemes per category. Accuracy of phonemes in each developmental category indicates how children perform on less complex, early-developing phonemes versus more complex, later-developing phonemes. For example, in Fabiano-Smith and Goldstein (2010a, 2010b), overall PCC-R was significantly lower in the Spanish of bilingual children as compared to their monolingual Spanish-speaking peers; however, flap /ɾ/ and trill /r/, the most complex, latest-developing phonemes, were produced with disproportionately low accuracy when compared to the rest of the consonant inventory. More specifically, the low production accuracy on flap and trill was the driving force for an overall lower PCC-R in bilinguals. More discrete measures of phonological ability may uncover patterns in development that might be overlooked by broader measures; thus, they were included to examine phonological ability at differing levels of the sound system.
Table 3.
Early-, middle-, and late-developing phonemes for English and Spanish based on Shriberg (1993) and Fabiano-Smith and Goldstein (2010a).
| Phoneme | English | Spanish |
|---|---|---|
| Early-developing phonemes | /m, b, j, n, w, d, p, h/ | /n, t, m, n, k, x/ |
| Middle-developing phonemes | /t, ŋ, k, ɡ, f, v, ʧ, ʤ/ | /s, f, p, ʧ, β, ɣ/ |
| Late-developing phonemes | /ʃ, ð, s, z, ɵ, l, ɹ/ | /l, ð, r, ɾ/ |
Phonological Error Patterns
Phonological patterns are sound and structural error patterns routinely examined in the clinical assessment of English-speaking children. Shriberg (1994) found that the average frequency of occurrence of phonological error patterns in English-speaking children with speech sound disorders differs significantly from children with typical skills. Based on a predetermined set of phonological patterns from research on Spanish and English phonological acquisition (Bauman-Wängler, 2000; Goldstein & Iglesias, 1996), the percent occurrence of each pattern was calculated using the LIPP. Diagnostic criteria suggested by McReynolds and Elbert (1981) were used for comparison to our data in English, and criteria by Goldstein and Iglesias (1996) were used for comparison in Spanish.
Statistical Analyses
Summary statistical analysis was conducted for each measure stratified by monolingual and bilingual speakers. Within each language group (i.e., monolingual and bilingual), a univariate logistic regression model of sound condition (binary as typical = 0 and disordered = 1) on each individual variable was conducted. The ROC curve and area under the ROC curve (AUC) from each individual logistic model were computed, which measure the prediction accuracy in sound condition using each variable. To increase accuracy in predicting speech sound condition (i.e., typical or disordered) within each language group, we also conducted a supervised linear support vector machine (SVM) analysis, which is a multivariate analysis. The ROC curve and AUC were computed to measure the overall ability to predict the speech sound condition.
Results
Descriptive Statistics
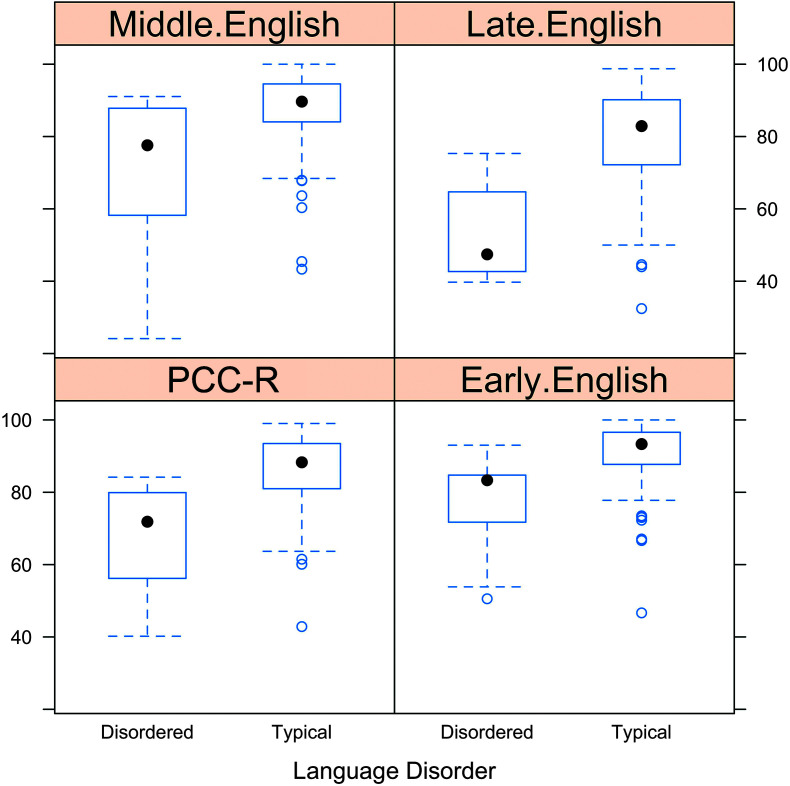
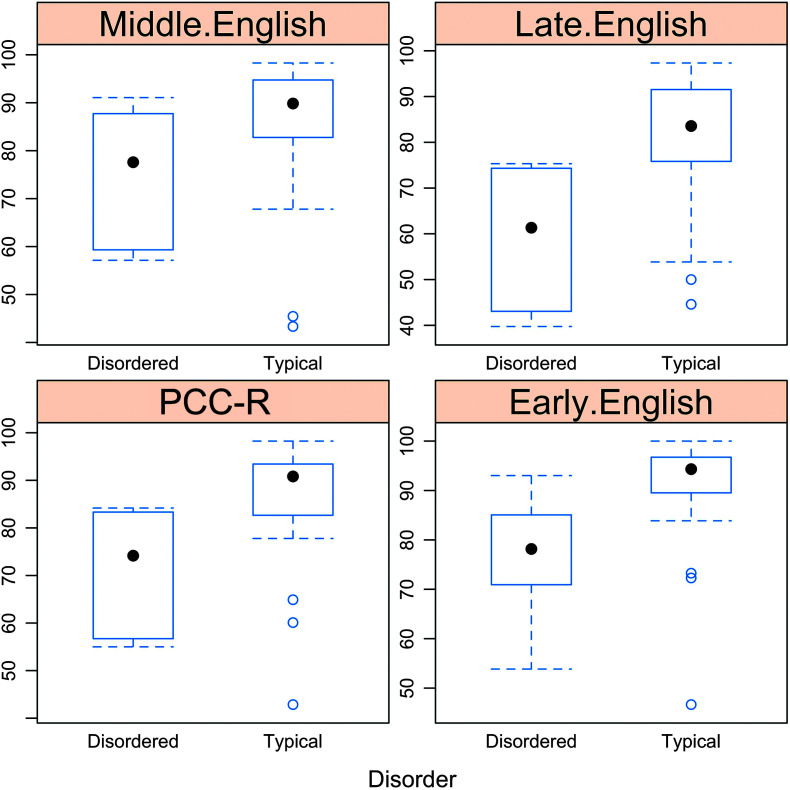
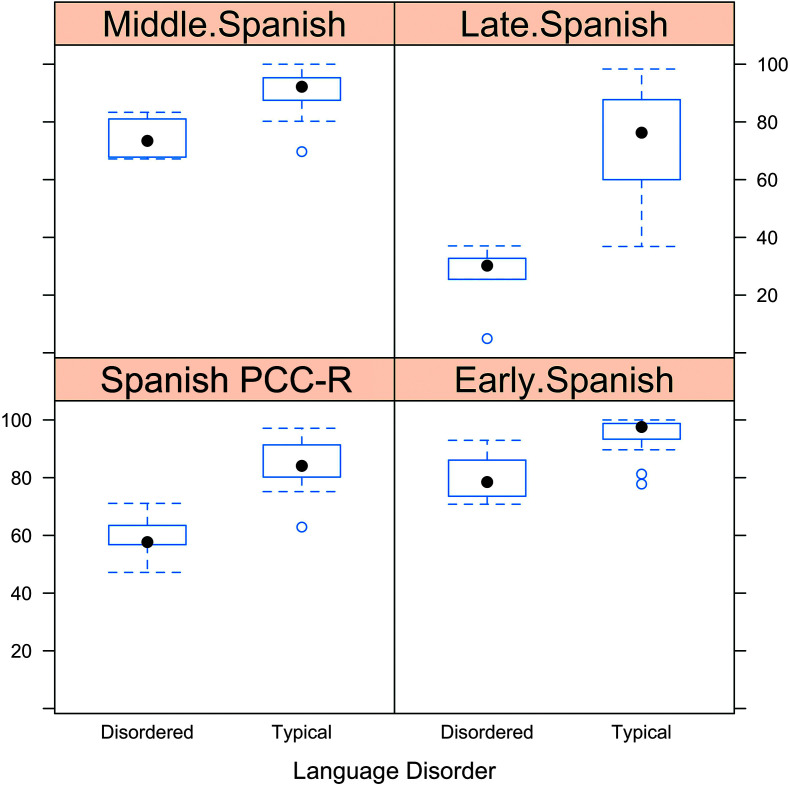
The summary statistics, including means, standard deviations, medians, and ranges for all phonological measures, were given in Table 4 (for monolingual) and Tables 5 and 6 (for bilingual). In these tables, the descriptive statistics are detailed for each ability group (typical vs. disordered) and the combined groups. Box plots for each analysis can be found in Figures 2 –8. Overall, regardless of language background, typically developing children exhibited consonant accuracy approximately 15%–25% higher than children with speech sound disorders. Whether examining children by language or bilingual status, children with and without speech sound disorders perform differently on both gross (PCC-R) and discrete (EML-developing sounds) measures of consonant accuracy.
Table 4.
Summary statistics for monolingual English-speaking children on measures of percent consonants correct–revised (PCC-R) and accuracy of early-, middle-, and late-developing phonemes.
| Measure | n | M | SD | Min | Q1 | Mdn | Q3 | Max |
|---|---|---|---|---|---|---|---|---|
| Overall | ||||||||
| PCC-R | 32 | 80.68 | 13.87 | 40.20 | 70.44 | 83.70 | 91.00 | 99.02 |
| Early-developing phonemes (English) | 32 | 86.78 | 11.63 | 50.56 | 82.33 | 91.44 | 95.57 | 100.00 |
| Middle-developing phonemes (English) | 32 | 82.16 | 17.30 | 24.14 | 77.59 | 87.82 | 92.98 | 100.00 |
| Late-developing phonemes (English) | 32 | 71.86 | 19.43 | 32.43 | 54.94 | 76.91 | 87.07 | 98.75 |
| Disordered | ||||||||
| PCC-R | 6 | 66.15 | 15.57 | 40.20 | 59.09 | 70.60 | 76.47 | 81.82 |
| Early-developing phonemes (English) | 6 | 76.85 | 13.78 | 50.56 | 75.23 | 83.60 | 84.30 | 86.36 |
| Middle-developing phonemes (English) | 6 | 63.21 | 27.43 | 24.14 | 42.92 | 72.12 | 85.34 | 87.93 |
| Late-developing phonemes (English) | 6 | 50.90 | 11.06 | 39.74 | 43.35 | 46.95 | 60.28 | 64.86 |
| Typical | ||||||||
| PCC-R | 26 | 84.03 | 11.31 | 61.50 | 78.04 | 86.56 | 92.93 | 99.02 |
| Early-developing phonemes (English) | 26 | 89.08 | 10.03 | 66.66 | 84.20 | 93.02 | 95.64 | 100.00 |
| Middle-developing phonemes (English) | 26 | 86.53 | 10.71 | 60.34 | 84.55 | 88.70 | 93.16 | 100.00 |
| Late-developing phonemes (English) | 26 | 76.70 | 17.72 | 32.43 | 67.85 | 80.89 | 88.42 | 98.75 |
Table 5.
Summary statistics for the English productions of bilingual children on measures of percent consonants correct–revised (PCC-R) and accuracy of early-, middle-, and late-developing phonemes.
| Measure | n | M | SD | Min | Q1 | Mdn | Q3 | Max |
|---|---|---|---|---|---|---|---|---|
| Overall | ||||||||
| PCC-R | 34 | 83.60 | 13.35 | 42.86 | 81.10 | 86.45 | 92.84 | 98.25 |
| Early-developing phonemes (English) | 34 | 88.64 | 12.43 | 46.66 | 85.58 | 93.25 | 96.34 | 100.00 |
| Middle-developing phonemes (English) | 34 | 84.35 | 14.20 | 43.33 | 82.76 | 89.66 | 94.35 | 98.28 |
| Late-developing phonemes (English) | 34 | 77.51 | 16.43 | 39.74 | 71.25 | 82.54 | 90.61 | 97.33 |
| Disordered | ||||||||
| PCC-R | 5 | 70.68 | 14.10 | 55.00 | 56.72 | 74.16 | 83.33 | 84.18 |
| Early-developing phonemes (English) | 5 | 76.20 | 14.94 | 53.85 | 70.93 | 78.16 | 85.06 | 93.02 |
| Middle-developing phonemes (English) | 5 | 74.57 | 15.74 | 57.14 | 59.32 | 77.59 | 87.72 | 91.07 |
| Late-developing phonemes (English) | 5 | 58.75 | 16.82 | 39.74 | 43.06 | 61.33 | 74.32 | 75.32 |
| Typical | ||||||||
| PCC-R | 29 | 85.83 | 12.11 | 42.86 | 82.66 | 90.82 | 93.43 | 98.25 |
| Early-developing phonemes (English) | 29 | 90.79 | 10.85 | 46.66 | 89.53 | 94.32 | 96.74 | 100.00 |
| Middle-developing phonemes (English) | 29 | 86.03 | 13.50 | 43.33 | 82.76 | 89.83 | 94.74 | 98.28 |
| Late-developing phonemes (English) | 29 | 80.74 | 14.29 | 44.59 | 75.83 | 83.56 | 91.53 | 97.33 |
Table 6.
Summary statistics for the Spanish productions of bilingual children on measures of percent consonants correct–revised (PCC-R) and accuracy of early-, middle-, and late-developing phonemes.
| Measure | n | M | SD | Min | Q1 | Mdn | Q3 | Max |
|---|---|---|---|---|---|---|---|---|
| Overall | ||||||||
| PCC-R (Spanish) | 34 | 81.43 | 11.98 | 47.17 | 78.88 | 83.08 | 89.89 | 97.12 |
| Early-developing phonemes (Spanish) | 34 | 92.87 | 7.85 | 70.79 | 91.20 | 95.40 | 98.75 | 100.00 |
| Middle-developing phonemes (Spanish) | 34 | 88.66 | 8.69 | 67.19 | 85.54 | 90.47 | 94.18 | 100.00 |
| Late-developing phonemes (Spanish) | 34 | 67.99 | 23.01 | 4.92 | 58.62 | 74.12 | 87.05 | 98.33 |
| Disordered | ||||||||
| PCC-R (Spanish) | 5 | 59.23 | 8.84 | 47.17 | 56.79 | 57.67 | 63.45 | 71.09 |
| Early-developing phonemes (Spanish) | 5 | 80.37 | 9.12 | 70.79 | 73.56 | 78.48 | 86.08 | 92.94 |
| Middle-developing phonemes (Spanish) | 5 | 74.56 | 7.42 | 67.19 | 67.80 | 73.44 | 81.03 | 83.33 |
| Late-developing phonemes (Spanish) | 5 | 26.07 | 12.54 | 4.92 | 25.45 | 30.19 | 32.73 | 37.04 |
| Typical | ||||||||
| PCC-R (Spanish) | 29 | 85.26 | 7.41 | 62.88 | 80.20 | 84.09 | 91.36 | 97.12 |
| Early-developing phonemes (Spanish) | 29 | 95.03 | 5.30 | 77.78 | 93.33 | 97.56 | 98.78 | 100.00 |
| Middle-developing phonemes (Spanish) | 29 | 91.09 | 6.29 | 69.70 | 87.50 | 92.19 | 95.31 | 100.00 |
| Late-developing phonemes (Spanish) | 29 | 75.21 | 15.29 | 36.84 | 60.00 | 76.27 | 87.72 | 98.33 |
Figure 2.
Box plots for percent consonants correct–revised (PCC-R) and accuracy of early-, middle-, and late-developing phonemes for monolingual English speakers with and without speech sound disorders. Early.English = early-developing phonemes (English); Middle.English = middle-developing phonemes (English); Late.English = late-developing phonemes (English).
Figure 3.
Box plot for percent consonants correct–revised (PCC-R) and accuracy of early-, middle-, and late-developing phonemes for the English productions of bilingual speakers with and without speech sound disorders. Early.English = early-developing phonemes (English); Middle.English = middle-developing phonemes (English); Late.English = late-developing phonemes (English).
Figure 4.
Box plots for percent consonants correct–revised (PCC-R) and accuracy of early-, middle-, and late-developing phonemes for the Spanish productions of bilingual speakers with and without speech sound disorders. Early.Spanish = early-developing phonemes (Spanish); Middle.Spanish = middle-developing phonemes (Spanish); Late.Spanish = late-developing phonemes (Spanish).
Figure 5.
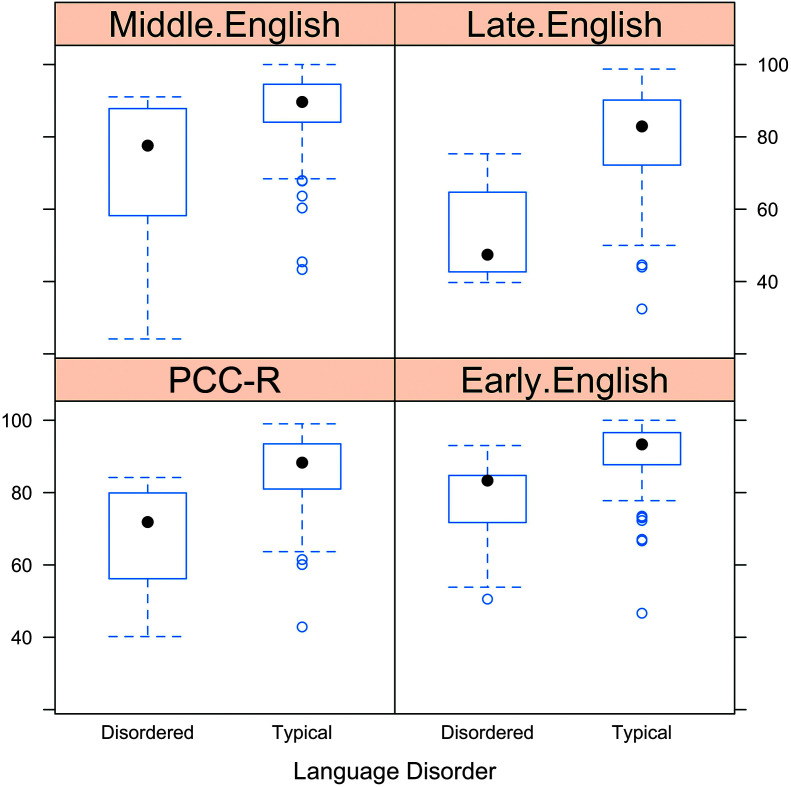
Box plots illustrating group differences between the English productions of monolingual and bilingual speakers. Early.English = early-developing phonemes (English); Middle.English = middle-developing phonemes (English); Late.English = late-developing phonemes (English); PCC-R = percent consonants correct–revised.
Figure 6.
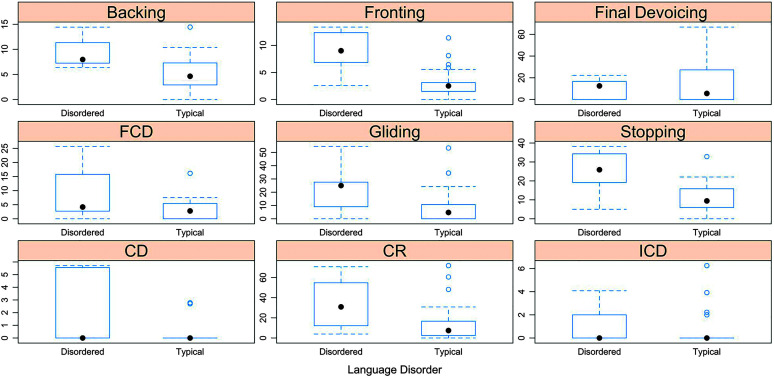
Box plots for percent occurrence of phonological error patterns for monolingual English speakers with and without speech sound disorders. FCD = final consonant deletion; CD = cluster deletion; CR = cluster reduction; ICD = initial consonant deletion.
Figure 7.
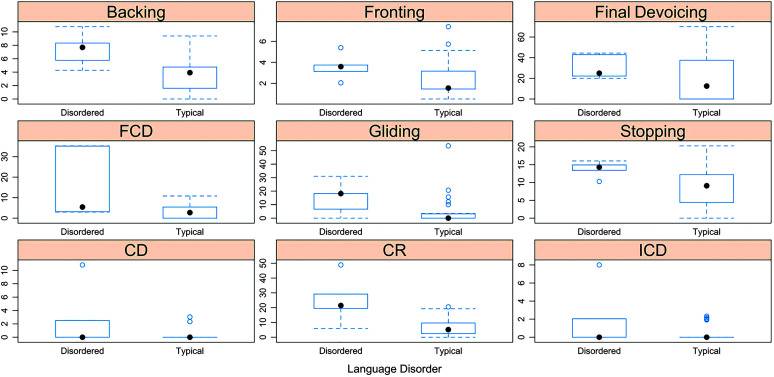
Box plots for percent occurrence of phonological error patters in the English productions of bilingual speakers. FCD = final consonant deletion; CD = cluster deletion; CR = cluster reduction; ICD = initial consonant deletion.
Figure 8.
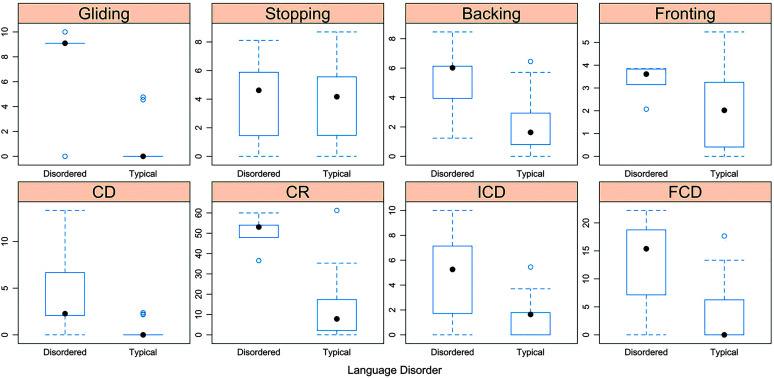
Box plots for percent occurrence of phonological error patterns in the Spanish productions of bilingual speakers. CD = cluster deletion; CR = cluster reduction; ICD = initial consonant deletion; FCD = final consonant deletion.
Diagnostic Accuracy of PCC-R
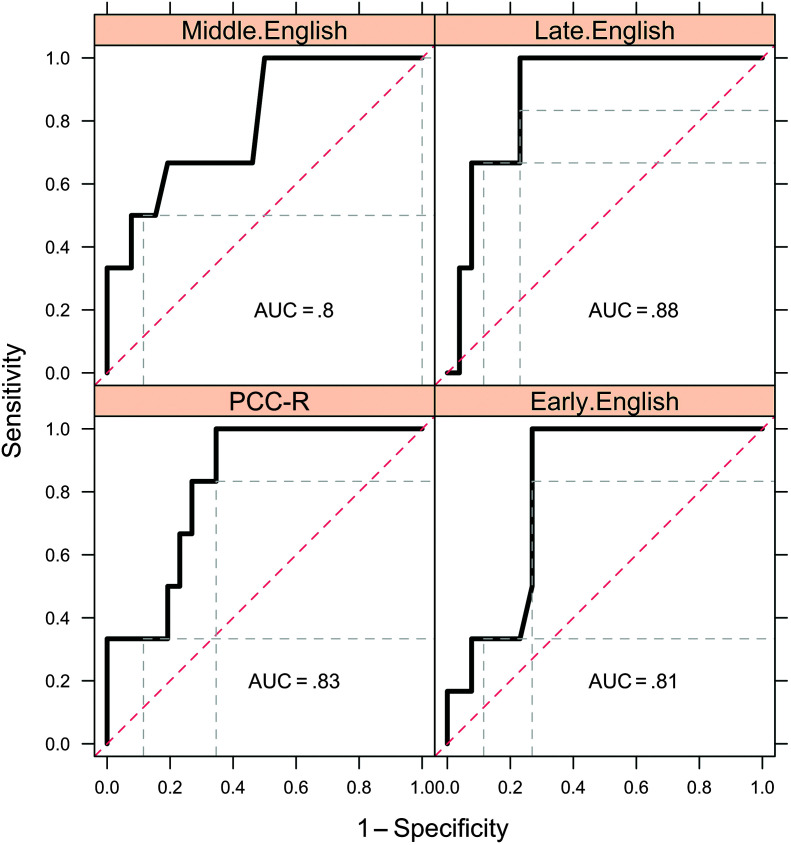
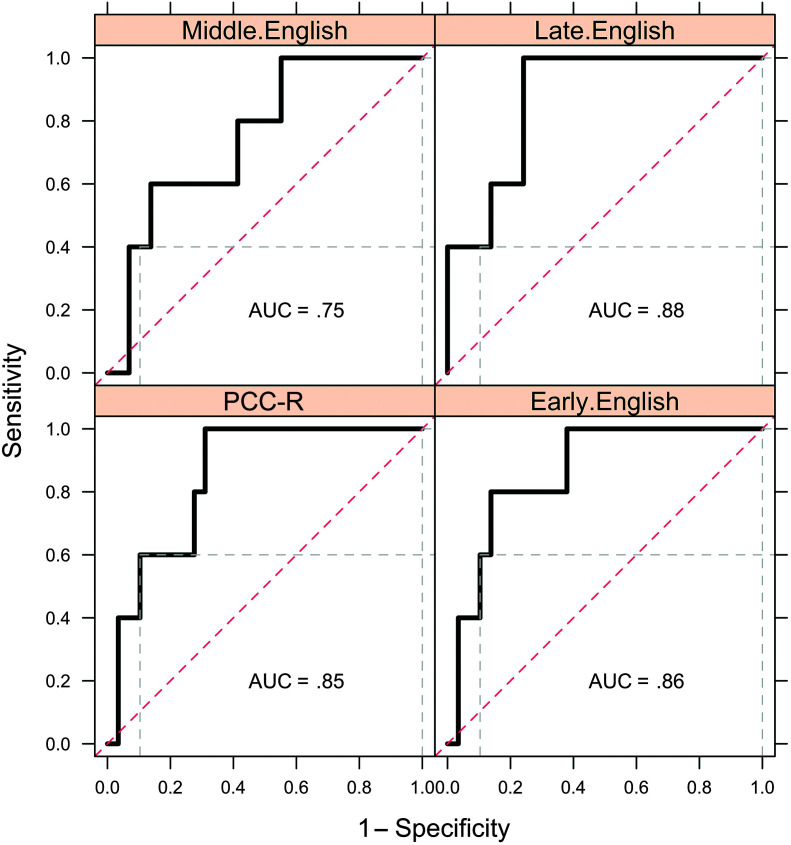
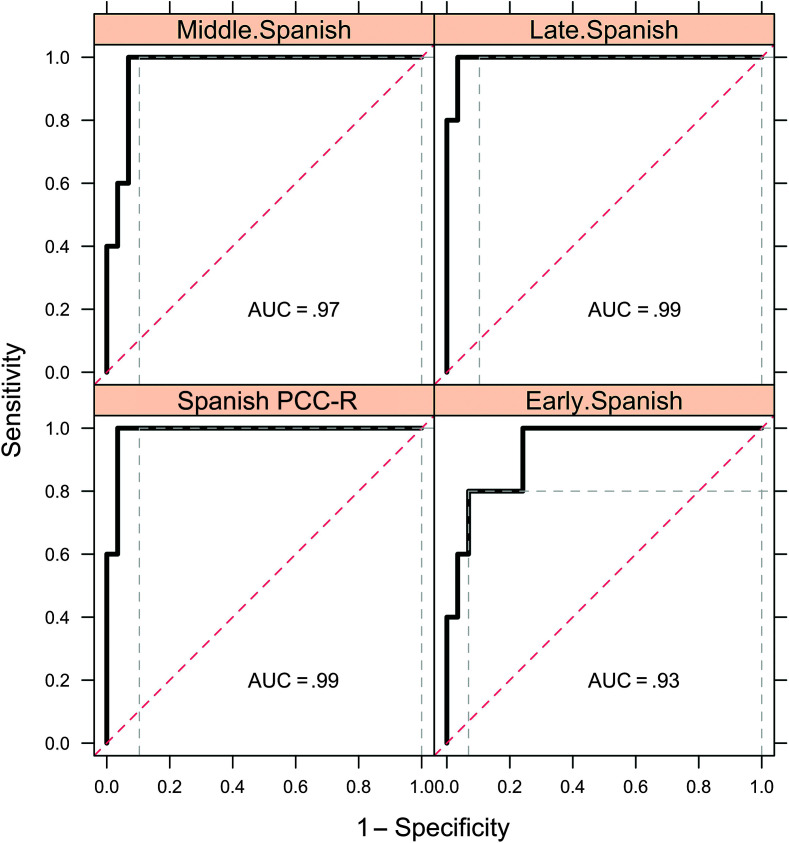
ROC curves were derived to observe the diagnostic accuracy of PCC-R for monolingual and bilingual children. Curves were derived by speaker type (monolingual and bilingual) and by language (English and Spanish). An AUC for the ROC was calculated for each situation. An AUC between .7 and .8 is considered acceptable in discriminating, an AUC between .8 and .9 is considered excellent, and an AUC higher than .9 is considered outstanding (Mandrekar, 2010).
English
The ROC curve derived yielded an AUC of .83 for monolingual English-speaking children and an AUC of .85 for bilingual children (see Figures 9 and 10). These results indicated that PCC-R has a relatively similar and excellent ability to distinguish between typical and disordered speech in the English productions of monolingual and bilingual children.
Figure 9.
Receiver operating characteristic (ROC) curves illustrating diagnostic accuracy of percent consonants correct–revised (PCC-R) and accuracy of early-, middle-, and late-developing phonemes for monolingual English-speaking children. Early.English = early-developing phonemes (English); Middle.English = middle-developing phonemes (English); Late.English = late-developing phonemes (English); AUC = area under the ROC curve.
Figure 10.
Receiver operating characteristic (ROC) curves illustrating diagnostic accuracy of percent consonants correct–revised (PCC-R) and accuracy of early-, middle-, and late-developing phonemes for the English productions of bilingual children. Early.English = early-developing phonemes (English); Middle.English = middle-developing phonemes (English); Late.English = late-developing phonemes (English); AUC = area under the ROC curve.
Spanish
The ROC curve derived for the Spanish productions of bilingual children yielded an AUC statistic of .99, indicating that PCC-R has outstanding diagnostic accuracy for Spanish (see Figure 11). Importantly, diagnostic accuracy for PCC-R is higher in Spanish (.99) than in English (.85) for bilingual children.
Figure 11.
Receiver operating characteristic (ROC) curves illustrating diagnostic accuracy for percent consonants correct–revised (PCC-R) and accuracy of early-, middle-, and late-developing phonemes for the Spanish productions of bilingual children. Early.Spanish = early-developing phonemes (Spanish); Middle.Spanish = middle-developing phonemes (Spanish); Late.Spanish = late-developing phonemes (Spanish); AUC = area under the ROC curve.
Diagnostic Accuracy of Accuracy of EML-Developing Phonemes
English
The ROC curve analysis examining EML-developing phonemes yielded AUC statistics of .81, .80, and .88 for EML-developing phonemes, respectively, for monolingual English-speaking children and .86, .75, and .88, respectively, for the English productions of bilingual children (see Figures 9 and 10). Again, diagnostic accuracy of accuracy of EML-developing phonemes is excellent for the monolingual group, while it is excellent/acceptable for the bilingual group for English.
Spanish
ROC curves for the analysis of EML-developing phonemes in the Spanish productions of bilinguals yielded AUC statistics of .93, .97, and .99, respectively (see Figure 11). Like the gross measure of PCC-R, these more discrete measures of accuracy show outstanding diagnostic accuracy in the Spanish of bilinguals than in the English of bilinguals.
Multivariate Analysis
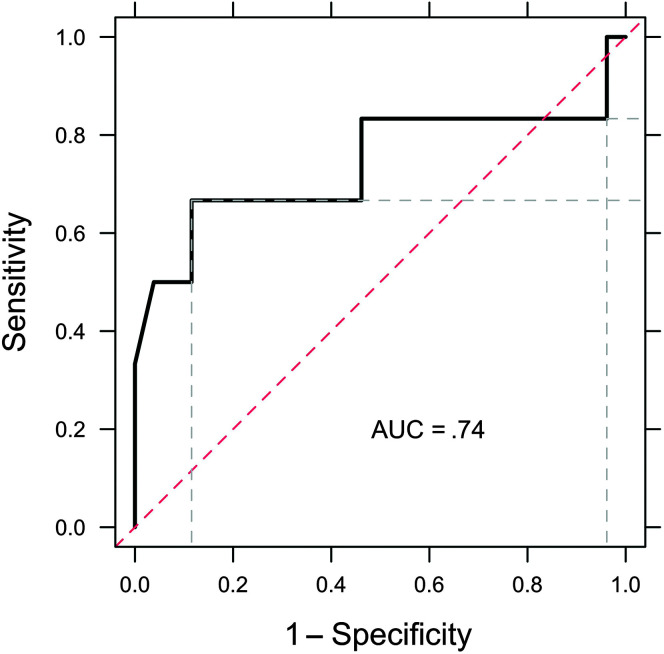
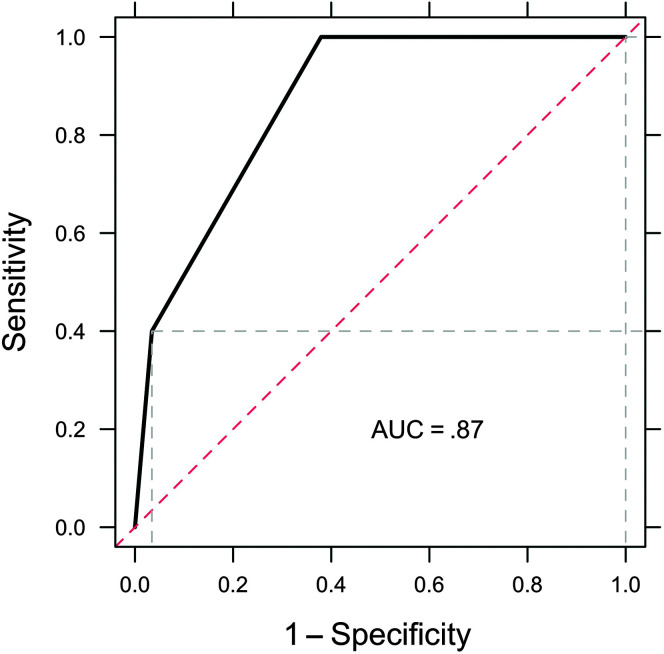
A linear SVM method was used to observe diagnostic accuracy when all measures of consonant accuracy (PCC-R and accuracy of EML-developing phonemes) were combined. Scatter plots for each analysis can be found in Supplemental Materials S1–S3. The productions of monolingual English-speaking children yielded an AUC statistic of .74 (see Figure 12), and the English productions of bilingual children yielded an AUC statistic of .87 (see Figure 13). The combination of accuracy measures increased diagnostic accuracy for bilingual speakers, while the diagnostic accuracy for monolingual speakers did not increase (due to two opposite outliers: one group has an extremely large value, and the other group has an extremely low value). It is important to point out that there was an outlier in each language ability group (typical and disordered) in the monolingual English-speaking sample that could possibly account for a lack of increase in diagnostic accuracy for monolinguals when all measures were combined. This aspect of the data set should be considered when interpreting findings reported here.
Figure 12.
Receiver operating characteristic (ROC) curve derived from the support vector machine model illustrating the diagnostic accuracy of all measures for monolingual English-speaking children. AUC = area under the ROC curve.
Figure 13.
Receiver operating characteristic (ROC) curve derived from the support vector machine model illustrating the diagnostic accuracy of all measures for the English productions of bilingual children. AUC = area under the ROC curve.
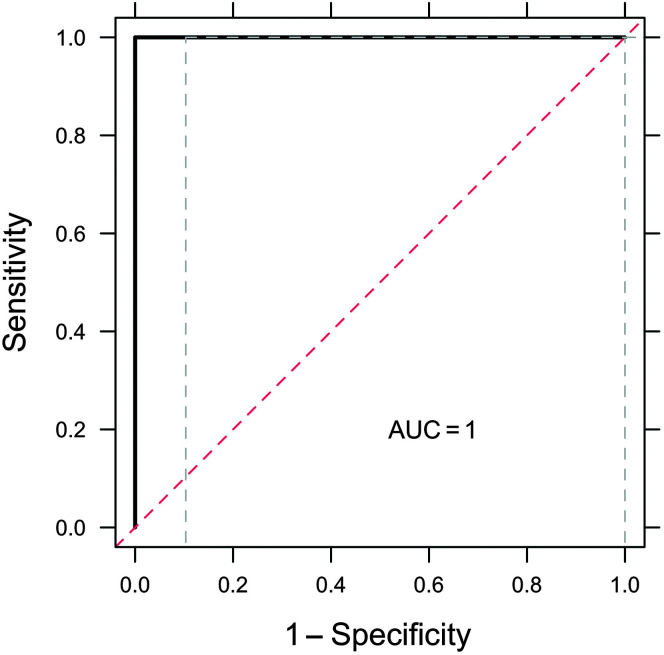
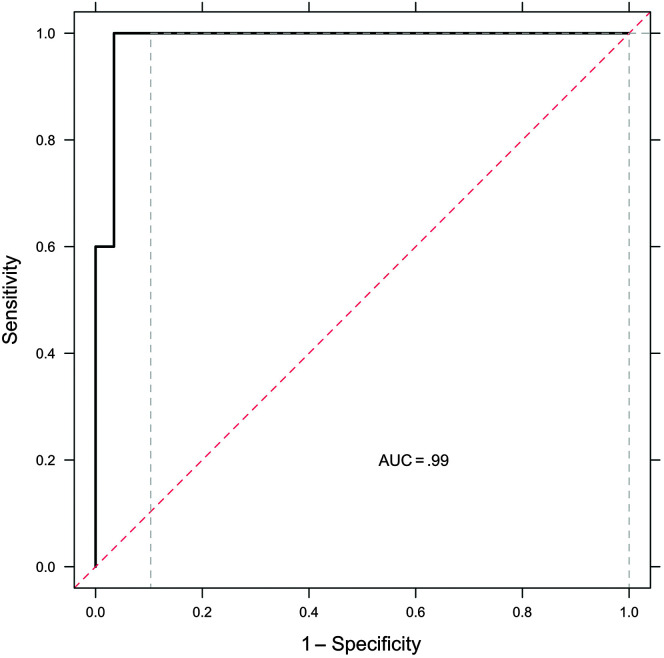
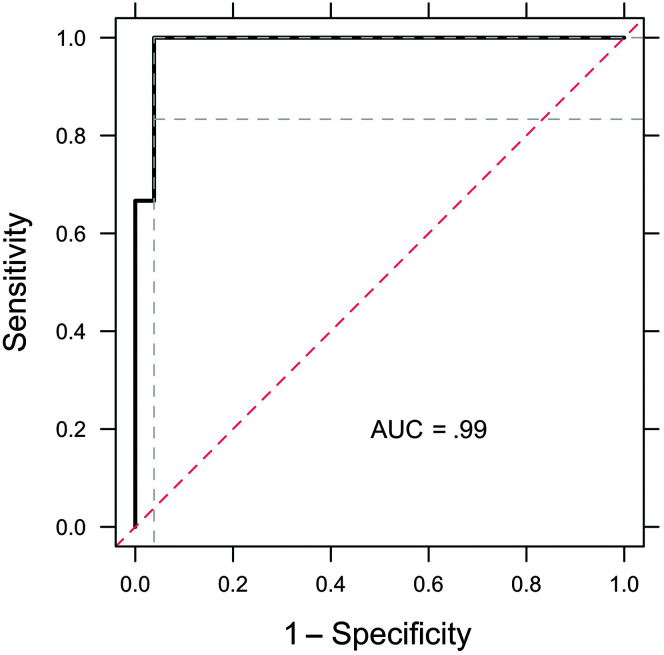
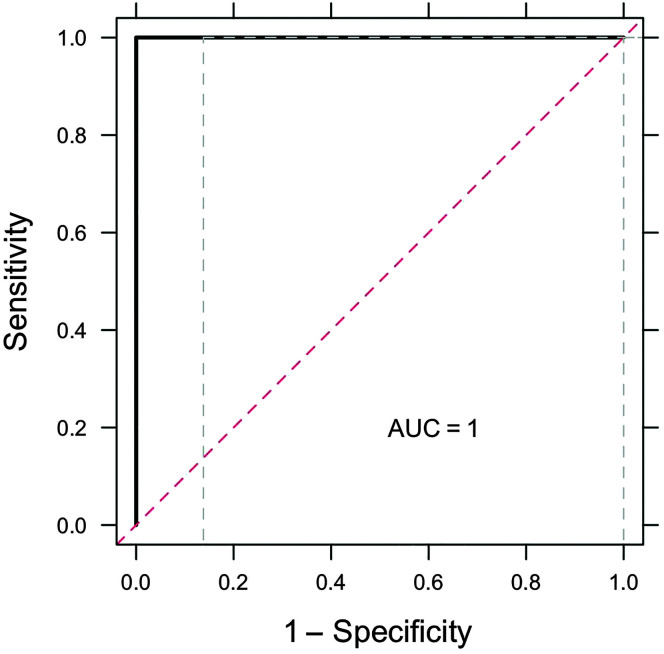
Overall, these measures demonstrated high diagnostic accuracy for monolingual English speakers, so this aspect of the data set does not impact the overall findings of the study. The Spanish productions of bilinguals resulted in an AUC statistic of 1, which indicates the highest level of diagnostic accuracy possible (see Figure 14). When the English and Spanish productions of bilingual children were combined for PCC-R, diagnostic accuracy reached .99 (see Figure 15). It is clear that combining measures, within and across languages, for bilingual children increases diagnostic accuracy from moderate–high levels to nearly perfect levels.
Figure 14.
Receiver operating characteristic (ROC) curve derived from the support vector machine model illustrating the diagnostic accuracy of all measures for the Spanish productions of bilingual children. AUC = area under the ROC curve.
Figure 15.
Receiver operating characteristic (ROC) curve derived from the support vector machine model illustrating the diagnostic accuracy of all measures for the English and Spanish of bilingual children combined. AUC = area under the ROC curve.
Diagnostic Accuracy of Percent Occurrence of Phonological Patterns
English
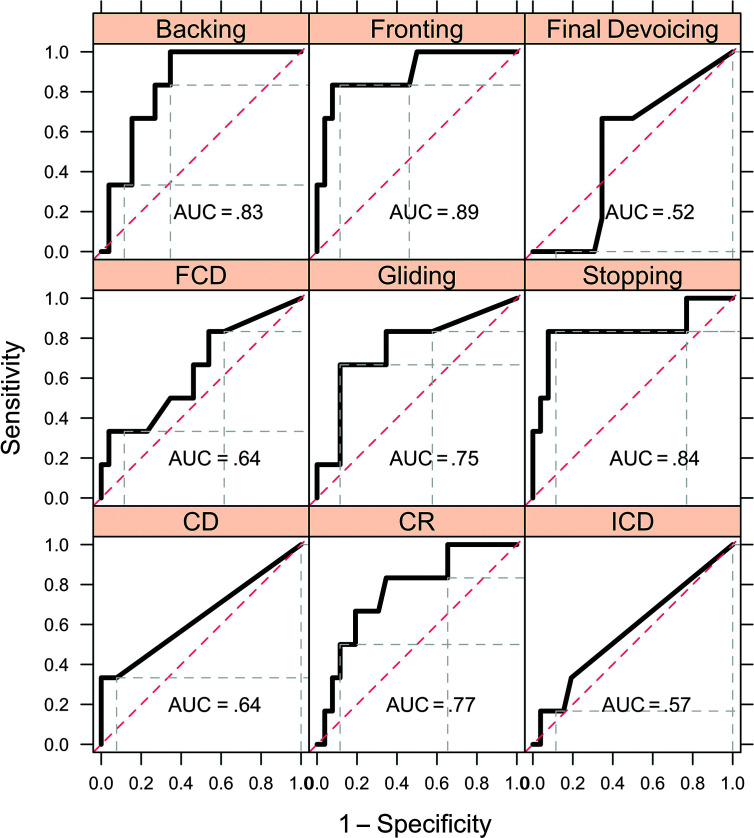
Monolingual English-speaking children. Results for the performance of monolingual English-speaking children on the phonological pattern analysis can be found in Table 7. Scatter plots for these analyses can be found in Supplemental Materials S4–S6. For monolingual English-speaking children, there were three phonological patterns (backing, fronting, and stopping) exhibiting excellent diagnostic accuracy (AUC > .80; see Figure 16). Patterns that demonstrated acceptable diagnostic utility (> .7) included cluster reduction (.77) and gliding (.75). Phonological patterns with low diagnostic utility (AUC < .7) included final consonant deletion (.64), cluster deletion (.64), and initial consonant deletion (.57). When all phonological error pattern measures were combined in the SVM model, diagnostic accuracy increased to .99 for monolingual English-speaking children (see Figure 17).
Table 7.
Summary statistics for monolingual English-speaking children on measures of phonological error patterns.
| Measure | n | M | SD | Min | Q1 | Mdn | Q3 | Max |
|---|---|---|---|---|---|---|---|---|
| Overall | ||||||||
| CD | 32 | 0.52 | 1.50 | 0.00 | 0.00 | 0.00 | 0.00 | 5.71 |
| CR | 32 | 18.30 | 21.29 | 0.00 | 3.51 | 8.56 | 23.28 | 71.79 |
| ICD | 32 | 0.76 | 1.61 | 0.00 | 0.00 | 0.00 | 0.00 | 6.25 |
| FCD | 32 | 4.35 | 5.61 | 0.00 | 0.00 | 2.86 | 5.45 | 25.71 |
| Gliding | 32 | 11.89 | 15.33 | 0.00 | 0.00 | 6.67 | 17.78 | 54.55 |
| Stopping | 32 | 13.19 | 10.11 | 0.00 | 5.97 | 11.35 | 17.44 | 38.24 |
| Backing | 32 | 5.86 | 3.66 | 0.00 | 3.11 | 5.82 | 7.62 | 14.44 |
| Fronting | 32 | 4.12 | 3.67 | 0.00 | 1.55 | 2.81 | 6.00 | 13.40 |
| Final devoicing | 32 | 14.41 | 18.74 | 0.00 | 0.00 | 11.11 | 22.91 | 66.67 |
| Disordered | ||||||||
| CD | 6 | 1.88 | 2.91 | 0.00 | 0.00 | 0.00 | 4.17 | 5.71 |
| CR | 6 | 33.90 | 25.94 | 3.92 | 14.47 | 30.88 | 51.19 | 70.73 |
| ICD | 6 | 1.01 | 1.70 | 0.00 | 0.00 | 0.00 | 1.50 | 4.08 |
| FCD | 6 | 8.76 | 9.95 | 0.00 | 2.76 | 4.18 | 13.20 | 25.71 |
| Gliding | 6 | 23.54 | 18.68 | 0.00 | 13.07 | 25.00 | 26.94 | 54.55 |
| Stopping | 6 | 24.74 | 12.44 | 5.00 | 19.27 | 25.88 | 33.73 | 38.24 |
| Backing | 6 | 9.22 | 3.06 | 6.37 | 7.37 | 7.97 | 10.56 | 14.43 |
| Fronting | 6 | 8.88 | 3.94 | 2.58 | 7.20 | 9.03 | 11.74 | 13.40 |
| Final devoicing | 6 | 10.65 | 8.99 | 0.00 | 3.12 | 12.50 | 15.63 | 22.22 |
| Typical | ||||||||
| CD | 26 | 0.21 | 0.74 | 0.00 | 0.00 | 0.00 | 0.00 | 2.78 |
| CR | 26 | 14.71 | 18.87 | 0.00 | 2.50 | 7.41 | 15.99 | 71.79 |
| ICD | 26 | 0.70 | 1.62 | 0.00 | 0.00 | 0.00 | 0.00 | 6.25 |
| FCD | 26 | 3.33 | 3.66 | 0.00 | 0.00 | 2.78 | 5.41 | 16.13 |
| Gliding | 26 | 9.20 | 13.48 | 0.00 | 0.00 | 4.74 | 10.62 | 53.33 |
| Stopping | 26 | 10.53 | 7.51 | 0.00 | 5.97 | 9.43 | 15.46 | 32.84 |
| Backing | 26 | 5.09 | 3.38 | 0.00 | 2.95 | 4.63 | 7.18 | 14.44 |
| Fronting | 26 | 3.03 | 2.63 | 0.00 | 1.51 | 2.52 | 3.13 | 11.40 |
| Final devoicing | 26 | 15.28 | 20.37 | 0.00 | 0.00 | 5.56 | 26.70 | 66.67 |
Note. CD = cluster deletion; CR = cluster reduction; ICD = initial consonant deletion; FCD = final consonant deletion.
Figure 16.
Receiver operating characteristic (ROC) curves illustrating the diagnostic accuracy of individual phonological error patterns for monolingual English speakers. FCD = final consonant deletion; CD = cluster deletion; CR = cluster reduction; ICD = initial consonant deletion; AUC = area under the ROC curve.
Figure 17.
Receiver operating characteristic (ROC) curves derived from the support vector machine model illustrating the diagnostic accuracy of combined phonological error pattern measures for monolingual English-speaking children. AUC = area under the ROC curve.
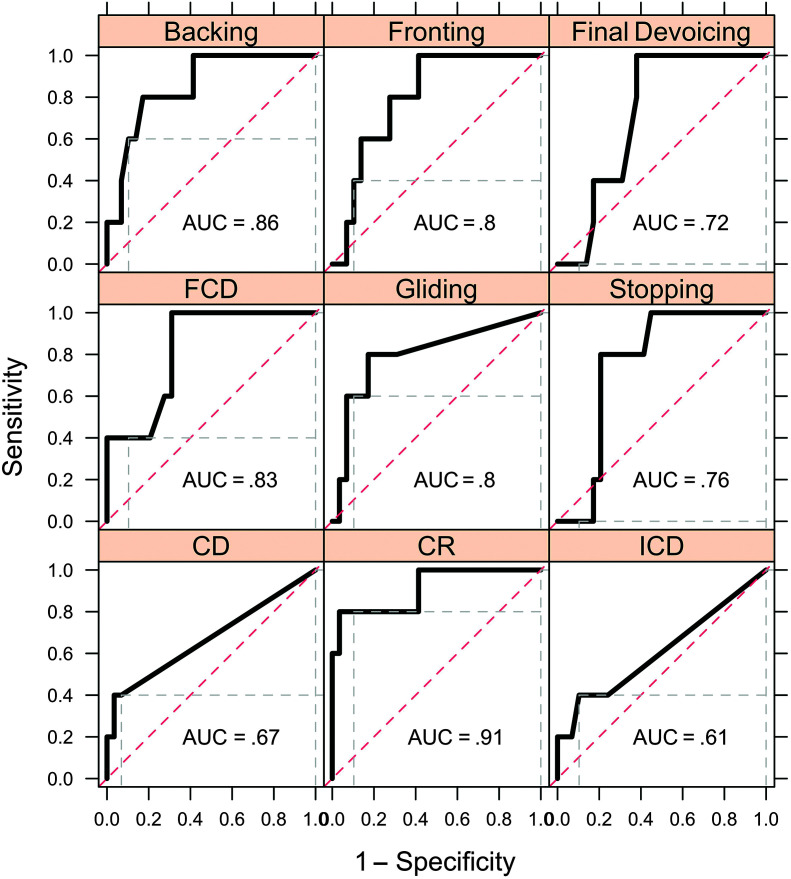
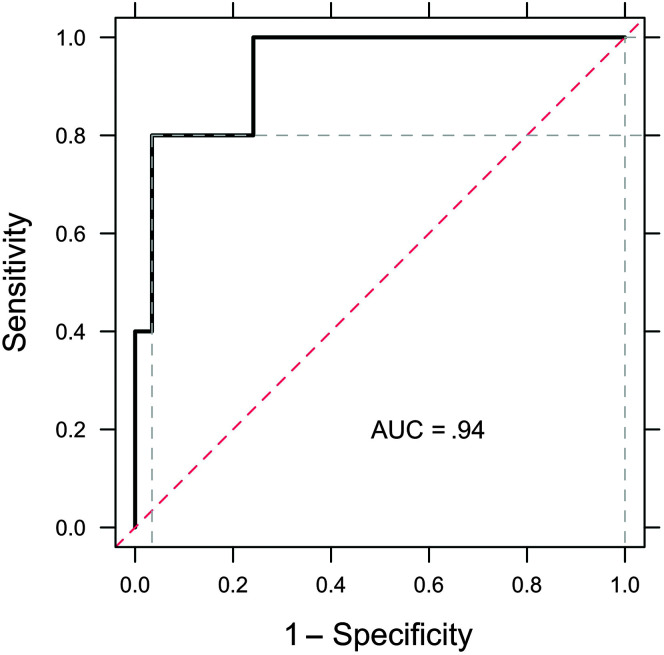
Bilingual children. In the English productions of bilingual children (see Table 8), cluster reduction was the outstanding measure, with an AUC of .91 (see Figure 18). The excellent measures are backing (.86), final consonant deletion (.83), and fronting and gliding (both .80). Stopping (.76) and final devoicing (.72) are acceptable in diagnosing phonological disorders. Phonological patterns with low diagnostic utility are cluster deletion (.67) and initial consonant deletion (.61). When all phonological error patterns were combined into an SVM model, diagnostic accuracy reached .94 (see Figure 19).
Table 8.
Summary statistics for the English productions of bilingual children on measures of phonological error patterns.
| Measure | n | M | SD | Min | Q1 | Mdn | Q3 | Max |
|---|---|---|---|---|---|---|---|---|
| Overall | ||||||||
| CD | 34 | 0.55 | 1.97 | 0.00 | 0.00 | 0.00 | 0.00 | 10.81 |
| CR | 34 | 9.52 | 10.00 | 0.00 | 2.82 | 5.77 | 13.30 | 48.84 |
| ICD | 34 | 0.72 | 1.56 | 0.00 | 0.00 | 0.00 | 1.44 | 8.00 |
| FCD | 34 | 4.67 | 8.23 | 0.00 | 0.00 | 2.78 | 5.41 | 35.29 |
| Gliding | 34 | 5.86 | 11.46 | 0.00 | 0.00 | 0.00 | 5.86 | 53.57 |
| Stopping | 34 | 9.89 | 5.58 | 0.00 | 5.03 | 10.29 | 14.07 | 20.29 |
| Backing | 34 | 4.33 | 2.67 | 0.00 | 1.96 | 4.20 | 5.68 | 10.77 |
| Fronting | 34 | 2.49 | 1.64 | 0.51 | 1.47 | 2.04 | 3.45 | 7.39 |
| Final devoicing | 34 | 21.86 | 20.84 | 0.00 | 0.00 | 15.48 | 37.50 | 70.00 |
| Disordered | ||||||||
| CD | 5 | 2.66 | 4.68 | 0.00 | 0.00 | 0.00 | 2.50 | 10.81 |
| CR | 5 | 24.97 | 15.77 | 5.88 | 19.51 | 21.43 | 29.17 | 48.84 |
| ICD | 5 | 2.01 | 3.46 | 0.00 | 0.00 | 0.00 | 2.04 | 8.00 |
| FCD | 5 | 16.38 | 17.22 | 2.94 | 3.13 | 5.41 | 35.14 | 35.29 |
| Gliding | 5 | 14.81 | 11.95 | 0.00 | 6.67 | 18.18 | 18.18 | 31.03 |
| Stopping | 5 | 13.80 | 2.18 | 10.29 | 13.43 | 14.29 | 14.93 | 16.05 |
| Backing | 5 | 7.37 | 2.49 | 4.28 | 5.76 | 7.69 | 8.33 | 10.77 |
| Fronting | 5 | 3.58 | 1.21 | 2.05 | 3.14 | 3.59 | 3.74 | 5.39 |
| Final devoicing | 5 | 30.90 | 11.78 | 20.00 | 22.22 | 25.00 | 42.86 | 44.44 |
| Typical | ||||||||
| CD | 29 | 0.18 | 0.70 | 0.00 | 0.00 | 0.00 | 0.00 | 3.03 |
| CR | 29 | 6.86 | 5.68 | 0.00 | 2.44 | 5.13 | 9.62 | 20.51 |
| ICD | 29 | 0.49 | 0.89 | 0.00 | 0.00 | 0.00 | 0.00 | 2.33 |
| FCD | 29 | 2.65 | 2.96 | 0.00 | 0.00 | 2.70 | 5.41 | 10.81 |
| Gliding | 29 | 4.31 | 10.84 | 0.00 | 0.00 | 0.00 | 3.13 | 53.57 |
| Stopping | 29 | 9.22 | 5.73 | 0.00 | 4.41 | 9.09 | 12.20 | 20.29 |
| Backing | 29 | 3.81 | 2.36 | 0.00 | 1.60 | 3.92 | 4.76 | 9.39 |
| Fronting | 29 | 2.30 | 1.64 | 0.51 | 1.46 | 1.55 | 3.16 | 7.39 |
| Final devoicing | 29 | 20.30 | 21.80 | 0.00 | 0.00 | 12.50 | 37.50 | 70.00 |
Note. CD = cluster deletion; CR = cluster reduction; ICD = initial consonant deletion; FCD = final consonant deletion.
Figure 18.
Receiver operating characteristic (ROC) curves illustrating the diagnostic accuracy of individual phonological error pattern measures for the English productions of bilingual children. FCD = final consonant deletion; CD = cluster deletion; CR = cluster reduction; ICD = initial consonant deletion; AUC = area under the ROC curve.
Figure 19.
Receiver operating characteristic (ROC) curve derived from the support vector machine model illustrating the diagnostic accuracy of phonological error patterns combined for the English productions of bilingual children. AUC = area under the ROC curve.
Spanish
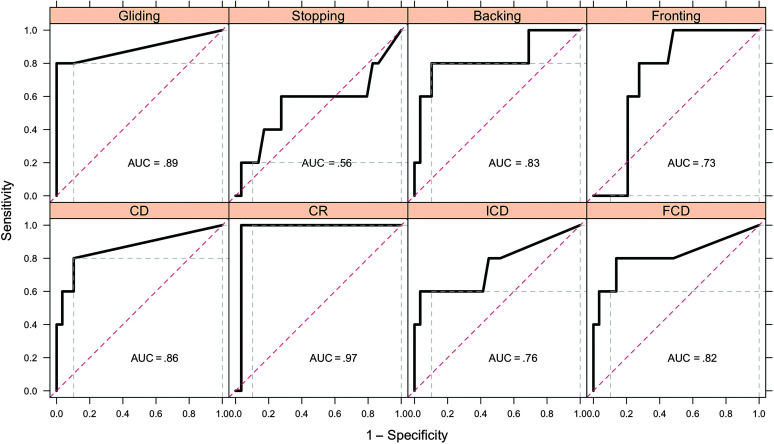
For bilingual children, one phonological pattern on Spanish (see Table 9), cluster reduction, exhibits outstanding diagnostic accuracy with an AUC of .97 (see Figure 20). Four phonological patterns with excellent diagnostic utility (AUC > .8) included gliding (.89), backing (.83), cluster deletion (.86), and final consonant deletion (.82). Two patterns, fronting (.73) and initial consonant deletion (.76), are acceptable; only one measure, stopping, shows a low accuracy with an AUC of .56. When these measures were combined into an SVM model, diagnostic accuracy rose to the perfect value of 1.0, higher than any individual phonological pattern measure in Spanish (see Figure 21).
Table 9.
Summary statistics for the Spanish productions of bilingual children on measures of phonological error patterns.
| Measure | n | M | SD | Min | Q1 | Mdn | Q3 | Max |
|---|---|---|---|---|---|---|---|---|
| Overall | ||||||||
| CD | 34 | 0.92 | 2.57 | 0.00 | 0.00 | 0.00 | 0.00 | 13.33 |
| CR | 34 | 17.60 | 18.51 | 0.00 | 3.94 | 12.29 | 22.21 | 61.22 |
| ICD | 34 | 1.85 | 2.36 | 0.00 | 0.00 | 1.69 | 2.99 | 10.00 |
| FCD | 34 | 5.29 | 6.39 | 0.00 | 0.00 | 5.41 | 6.67 | 22.22 |
| Gliding | 34 | 1.50 | 3.19 | 0.00 | 0.00 | 0.00 | 0.00 | 10.00 |
| Stopping | 34 | 3.76 | 2.48 | 0.00 | 1.47 | 4.20 | 5.61 | 8.70 |
| Backing | 34 | 2.56 | 2.09 | 0.00 | 1.23 | 2.15 | 3.62 | 8.46 |
| Fronting | 34 | 2.34 | 1.68 | 0.00 | 0.88 | 2.26 | 3.55 | 5.46 |
| Disordered | ||||||||
| CD | 5 | 4.87 | 5.32 | 0.00 | 2.08 | 2.27 | 6.67 | 13.33 |
| CR | 5 | 50.30 | 8.81 | 36.54 | 47.92 | 53.06 | 54.00 | 60.00 |
| ICD | 5 | 4.82 | 4.04 | 0.00 | 1.72 | 5.26 | 7.14 | 10.00 |
| FCD | 5 | 12.70 | 9.04 | 0.00 | 7.14 | 15.38 | 18.75 | 22.22 |
| Gliding | 5 | 7.45 | 4.19 | 0.00 | 9.09 | 9.09 | 9.09 | 10.00 |
| Stopping | 5 | 4.01 | 3.29 | 0.00 | 1.45 | 4.62 | 5.88 | 8.11 |
| Backing | 5 | 5.16 | 2.71 | 1.24 | 3.94 | 6.02 | 6.13 | 8.46 |
| Fronting | 5 | 3.30 | 0.74 | 2.07 | 3.15 | 3.61 | 3.83 | 3.85 |
| Typical | ||||||||
| CD | 29 | 0.23 | 0.70 | 0.00 | 0.00 | 0.00 | 0.00 | 2.38 |
| CR | 29 | 11.96 | 12.99 | 0.00 | 2.13 | 7.84 | 17.39 | 61.22 |
| ICD | 29 | 1.33 | 1.55 | 0.00 | 0.00 | 1.64 | 1.79 | 5.45 |
| FCD | 29 | 4.01 | 4.99 | 0.00 | 0.00 | 0.00 | 6.25 | 17.65 |
| Gliding | 29 | 0.48 | 1.43 | 0.00 | 0.00 | 0.00 | 0.00 | 4.76 |
| Stopping | 29 | 3.71 | 2.38 | 0.00 | 1.47 | 4.17 | 5.56 | 8.70 |
| Backing | 29 | 2.11 | 1.63 | 0.00 | 0.80 | 1.63 | 2.94 | 6.45 |
| Fronting | 29 | 2.18 | 1.75 | 0.00 | 0.41 | 2.02 | 3.25 | 5.46 |
Note. CD = cluster deletion; CR = cluster reduction; ICD = initial consonant deletion; FCD = final consonant deletion.
Figure 20.
Receiver operating characteristic (ROC) curves illustrating individual phonological error patterns for the Spanish productions of bilingual children. CD = cluster deletion; CR = cluster reduction; ICD = initial consonant deletion; FCD = final consonant deletion; AUC = area under the ROC curve.
Figure 21.
Receiver operating characteristic (ROC) curve derived from the support vector machine model illustrating the diagnostic accuracy of combined phonological error patterns for the Spanish productions of bilingual children. AUC = area under the ROC curve.
Multivariate Analysis
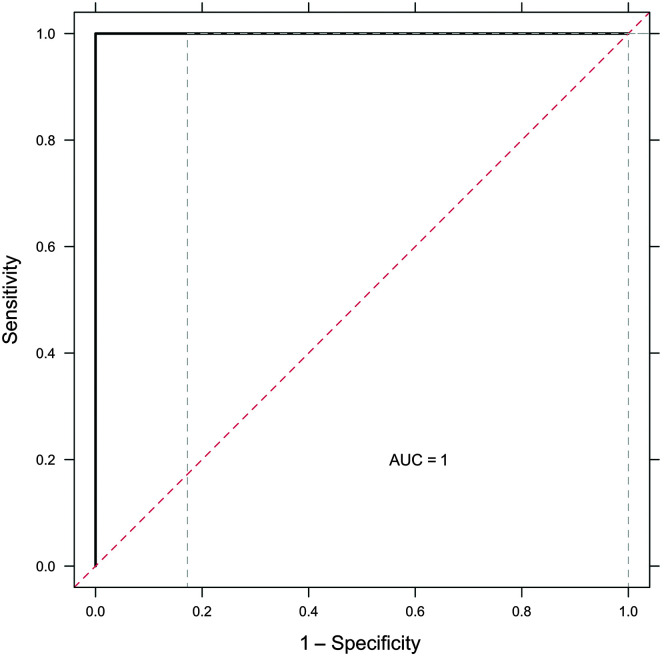
A linear SVM method was used to observe diagnostic accuracy when all measures of phonological error patterns were combined across English and Spanish for bilingual children. An AUC statistic of 1 was reached for these measures for bilingual children (see Figure 22), indicating that combining measures across languages provided perfect diagnostic accuracy. Again, it was observed that combining the language abilities of bilingual children provides better diagnostic accuracy than observing either language alone. Importantly, the language combination effect extended across all measures analyzed in this study.
Figure 22.
Receiver operating characteristic (ROC) curve derived from the support vector machine model illustrating the diagnostic accuracy of combined phonological error patterns for the Spanish and English productions of bilingual children. AUC = area under the ROC curve.
Diagnostic Cutoffs
In the univariate logistic regression analysis, we also derived a diagnostic cutoff for each measure. The diagnostic cutoff is defined as the optimal value for each measure that can be used to achieve the maximum value for the sum of sensitivity and specificity in diagnosis. Diagnostic cutoffs derived from the univariate logistic regression analysis for English PCC-R and accuracy of EML-developing phonemes for monolingual children can be found in Table 10 and for the bilingual group in Table 11; for Spanish PCC and EML-developing phonemes for the bilingual group, the cutoff can be found in Table 12. Diagnostic cutoffs derived from the logistic regression analysis for English phonological error patterns can be found in Table 13 for monolingual children and Table 14 for bilingual children. For Spanish phonological patterns for the bilinguals, the cutoff can be found in Table 15. The only cutoffs for phonological error patterns that reach 10% or higher were stopping for both groups of English speakers and cluster reduction for the Spanish of bilinguals. Diagnostic cutoffs differed between monolinguals and bilinguals and between the English and Spanish of bilinguals, suggesting that cutoff criteria developed for monolingual English-speaking children may misclassify bilingual children into typical and disordered categories.
Table 10.
Fitting results from logistic regression on English percent consonants correct–revised (PCC-R) and early-, middle-, and late-developing phonemes for monolingual speakers.
| Measure | Estimate | SE | z | p | Cutoff |
|---|---|---|---|---|---|
| PCC-R | −0.1043 | 0.0452 | −2.3072 | .0210 | 84.16 |
| Early-developing phonemes (English) | −0.0859 | 0.0422 | −2.0345 | .0419 | 92.86 |
| Middle-developing phonemes (English) | −0.0748 | 0.0335 | −2.2312 | .0257 | 84.48 |
| Late-developing phonemes (English) | −0.0854 | 0.0349 | −2.4484 | .0143 | 81.01 |
Note. The cutoff is the optimal value for each measure that can be used to achieve the maximum sum of sensitivity and specificity in diagnosis.
Table 11.
Fitting results from logistic regression on English percent consonants correct–revised (PCC-R) and early-, middle-, and late-developing phonemes for the bilingual speakers.
| Measure | Estimate | SE | z | p | Cutoff |
|---|---|---|---|---|---|
| PCC-R | −0.0705 | 0.0341 | −2.0682 | .0386 | 90.20 |
| Early-developing phonemes (English) | −0.0735 | 0.0360 | −2.0427 | .0411 | 95.45 |
| Middle-developing phonemes (English) | −0.0461 | 0.0294 | −1.5646 | .1177 | 89.83 |
| Late-developing phonemes (English) | −0.0792 | 0.0332 | −2.3859 | .0170 | 84.00 |
Note. The cutoff is the optimal value for each measure that can be used to achieve the maximum sum of sensitivity and specificity in diagnosis.
Table 12.
Fitting results from logistic regression on Spanish percent consonants correct–revised (PCC-R) and early-, middle-, and late-developing phonemes for the bilingual speakers.
| Measure | Estimate | SE | z | p | Cutoff |
|---|---|---|---|---|---|
| PCC-R (Spanish) | −0.2916 | 0.1201 | −2.4278 | .0152 | 91.36 |
| Early-developing phonemes (Spanish) | −0.2263 | 0.0815 | −2.7775 | .0055 | 95.51 |
| Middle-developing phonemes (Spanish) | −0.2451 | 0.0911 | −2.6919 | .0071 | 94.03 |
| Late-developing phonemes (Spanish) | −0.8992 | 1.4785 | −0.6082 | .5431 | 50.94 |
Note. The cutoff is the optimal value for each measure that can be used to achieve the maximum sum of sensitivity and specificity in diagnosis.
Table 13.
Fitting results from logistic regression on each of English phonological error patterns for the monolingual speakers.
| Measure | Estimate | SE | z | p | Cutoff |
|---|---|---|---|---|---|
| CD | 0.5830 | 0.2960 | 1.9696 | .0489 | 0.00 |
| CR | 0.0371 | 0.0200 | 1.8555 | .0635 | 7.14 |
| ICD | 0.1107 | 0.2599 | 0.4261 | .6700 | 0.00 |
| FCD | 0.1466 | 0.0816 | 1.7966 | .0724 | 0.00 |
| Gliding | 0.0537 | 0.0286 | 1.8810 | .0600 | 0.00 |
| Stopping | 0.1481 | 0.0581 | 2.5496 | .0108 | 17.19 |
| Backing | 0.3498 | 0.1606 | 2.1786 | .0294 | 5.76 |
| Fronting | 0.4677 | 0.1726 | 2.7102 | .0067 | 3.13 |
| Final devoicing | −0.0156 | 0.0285 | −0.5483 | .5835 | 0.00 |
Note. The cutoff is the optimal value for each measure that can be used to achieve the maximum sum of sensitivity and specificity in diagnosis. CD = cluster deletion; CR = cluster reduction; ICD = initial consonant deletion; FCD = final consonant deletion.
Table 14.
Fitting results from logistic regression on each of the English phonological error patterns for bilingual speakers.
| Measure | Estimate | SE | z | p | Cutoff |
|---|---|---|---|---|---|
| CD | 0.5780 | 0.4248 | 1.3606 | .1736 | 0.00 |
| CR | 0.2275 | 0.0966 | 2.3538 | .0186 | 9.30 |
| ICD | 0.4574 | 0.2975 | 1.5377 | .1241 | 0.00 |
| FCD | 0.1894 | 0.1213 | 1.5613 | .1185 | 0.00 |
| Gliding | 0.0589 | 0.0366 | 1.6115 | .1071 | 0.00 |
| Stopping | 0.1746 | 0.1081 | 1.6147 | .1064 | 11.11 |
| Backing | 0.5594 | 0.2393 | 2.3379 | .0194 | 4.62 |
| Fronting | 0.4270 | 0.2786 | 1.5326 | .1254 | 1.54 |
| Final devoicing | 0.0233 | 0.0224 | 1.0399 | .2984 | 0.00 |
Note. The cutoff is the optimal value for each measure that can be used to achieve the maximum sum of sensitivity and specificity in diagnosis. CD = cluster deletion; CR = cluster reduction; ICD = initial consonant deletion; FCD = final consonant deletion.
Table 15.
Fitting results from logistic regression on each of the Spanish phonological error patterns for the bilingual speakers.
| Measure | Estimate | SE | z | p | Cutoff |
|---|---|---|---|---|---|
| CD | 1.2516 | 0.5895 | 2.1231 | .0337 | 0.00 |
| CR | 0.1343 | 0.0499 | 2.6911 | .0071 | 18.75 |
| ICD | 0.5701 | 0.2478 | 2.3007 | .0214 | 0.00 |
| FCD | 0.2000 | 0.0841 | 2.3779 | .0174 | 0.00 |
| Gliding | 0.6406 | 0.2249 | 2.8480 | .0044 | 0.00 |
| Stopping | 0.0504 | 0.1987 | 0.2539 | .7996 | 2.90 |
| Backing | 0.7066 | 0.2892 | 2.4432 | .0146 | 3.57 |
| Fronting | 0.4246 | 0.3160 | 1.3436 | .1791 | 2.07 |
Note. The cutoff is the optimal value for each measure that can be used to achieve the maximum sum of sensitivity and specificity in diagnosis. CD = cluster deletion; CR = cluster reduction; ICD = initial consonant deletion; FCD = final consonant deletion.
Discussion
The hypotheses of this study were as follows: First, due to the structural differences (i.e., phonotactics) between English and Spanish, it was predicted that all traditional phonological measures developed for monolingual English speakers would not provide equal diagnostic accuracy for bilingual Spanish–English speakers. Second, to previous work that found composite measures of morphosyntax provided greater diagnostic accuracy for bilinguals than individual measures alone, we predicted that composite phonological scores, within and across languages, would provide greater sensitivity and specificity for bilingual children than individual measures alone.
Utility of Composite Phonological Measures
Overall, diagnostic accuracy was excellent for all phonological measures for monolingual English-speaking children, and combining their measures generally did not increase diagnostic accuracy. It is possible that this finding is due to two outliers in our data set, but it is also possible that this finding is the natural consequence of using measures that were created for and validated using large cohorts of monolingual English-speaking children (e.g., Shriberg & Kwiatkowski, 1994). Conversely, the combination of measures in the bilingual group yielded a sharp increase in diagnostic accuracy in both English and Spanish, both within and across languages. Importantly, the English productions of bilingual children differed from the English productions of monolingual children, indicating that even though these children are speakers of the same language, they are performing differently on the same English measures of phonological ability, depending on whether they speak one language or two. This finding aligns with Oetting et al.'s (2016) theoretical framework of disorder existing within a diverse society rather than the separation of diverse children from children with language disorders. Children can both be bilingual and present with a communication disorder as well as be bilingual and exhibit typical phonological development; the difference versus disorder dichotomy does not account for these possibilities. Children in our diverse society might require novel approaches to the measurement of phonological skills whether they present with a speech sound disorder or not. In this study, a composite score of phonological skills was found to be a superior diagnostic tool for bilingual children, whereas the traditional approach to measurement satisfied the needs of the monolingual English-speaking children. A “one-size-fits-all” approach to phonological assessment will not yield accurate identification of disorder in our diverse society; a difference versus disorder false dichotomy does not leave room for typically developing bilingual children who require a novel approach to assessment. Misdiagnosis can occur in the forms of under- or overidentification of disorder, and novel approaches to assessment, such as composite scoring, may prevent overidentification of speech sound disorders in bilingual populations.
Language-Specific Considerations
Across monolingual English speakers, the English of bilinguals, and the Spanish productions of bilinguals, the Spanish of bilinguals yielded the highest diagnostic accuracy for traditional phonological measures, either observed individually or combined into composite scores. This finding suggests that many children in this age group, even in a subtractive bilingual environment (i.e., Arizona's English-only policy), exhibit their best phonological skills in their home language. This reinforces the need to test bilingual children's phonological abilities in both languages, even if the child demonstrates high language proficiency in English. When testing bilingual children with suspected phonological disorders, their Spanish performance on diagnostic measures could reveal the presence of disorder with more accuracy than their performance on English measures, even if English language proficiency is higher than Spanish.
In the Spanish productions of bilinguals, linguistic structure was the motivation for lower clinical utility for some measures as compared to others, as the phonotactics of Spanish do not trigger certain error patterns (i.e., gliding and cluster deletion). Spanish-speaking children do not typically substitute glides for flap /ɾ/ and trill /r/; instead, they prefer to use [l] as a substitute (e.g., Goldstein & Iglesias, 1996; Rodríguez-Guerra, 2020). Cluster deletion is also a rare occurrence in the speech of Spanish-speaking children, as compared to English, due to Spanish allowing only two-member onset clusters, in contrast to English, which allows three (Hammond, 2000). Cluster reduction yielded the best clinical utility, as initial clusters in Spanish often include the flap /ɾ/, a highly complex, late-developing phoneme (e.g., tɾen). The presence of the flap makes initial clusters in Spanish susceptible to reduction during the preschool years (e.g., Goldstein et al., 2005). These findings also suggest that perhaps a smaller set of phonological error patterns can be used in the evaluation of bilingual children as compared to monolingual English speakers. Fronting, initial consonant deletion, stopping, backing, and cluster reduction appear to provide the best diagnostic information in the identification of speech sound disorders in bilingual preschoolers.
Theoretical Implications
Overall, bilingual preschool-age children benefit from the language combination effect on measures of phonological ability. In line with the PRIMIR model (Curtin et al., 2011), between-languages interaction at the representational level in bilingual phonology results in phonological skills that are distributed unevenly across the languages of the bilingual child (Ebert et al., 2014). It is not enough to look across both languages for patterns of disorder; we must evaluate a composite measure of overall phonology that takes into consideration the entire system in this population in order to observe an accurate representation of skills. Parsing phonological measures by language does not accurately represent the extent of the child's phonological skill set because both languages are integrated into the child's representation in an interactional manner. For this same reason, cutoff scores differ for monolinguals and bilinguals, and for bilinguals across languages.
Study Limitations
We acknowledge limitations of the current study for SLPs to contextualize our findings for clinical application. First, we used very strict inclusionary and exclusionary criteria that may have excluded children with mild speech sound disorders. Caution should be exercised in applying cutoff scores so that underidentification of speech sound disorders in bilingual children does not occur. In addition, children's hearing was not formally tested as part of the research methodology, so it is possible that mild hearing impairment was present in the subject sample without the knowledge of the research team. Additionally, parent report is a subjective method of gathering background information on child development and language proficiency and use. It is the most widely used method in the bilingual literature; however, error is inherent in the method and reported data. Finally, single-word samples, versus connected speech samples, were used to calculate phonological measures due to ease of data analysis. Previous studies (e.g., Shriberg, 1993) based measures of phonological accuracy on connected speech samples; thus, some differences in quantitative measures may appear when large-scale developmental studies are compared to this research.
Conclusions
The prevention of misdiagnosis of speech sound disorders in bilingual Latinx children can be achieved with proper knowledge of how this “hybrid” system is organized at the representational level and which phonological measures demonstrate high, intermediate, and low clinical utility. Deriving a composite measure that takes into consideration skills in both languages is the best approach to the evaluation and diagnosis of speech sound disorders in bilingual Spanish-English–speaking preschoolers.
Supplementary Material
Acknowledgments
We acknowledge our funding sources that made this research possible: National Institute of Child Health and Human Development Grant 1-R21-HD081382-01A1 and National Institute on Deafness and Other Communication Disorders Grant 1-R01-DC016624-01A1, awarded to Leah Fabiano-Smith. We want to thank the children and families who participated in our study and the Southern Arizona border community for their collaboration. We thank Eugenia Fávela, Paul Ohm, and Mary Montano in the Sunnyside Unified School District, who invited us into their schools and provided us the opportunity to work with their students. We express our gratitude to Vania Pantoja, laboratory manager of the Bilingual Phonology Lab at The University of Arizona, for her efforts in data collection and analysis. Finally, we thank the National Institutes of Health Loan Repayment Program Division of Health Disparities for supporting the first author during the course of this project.
Funding Statement
We acknowledge our funding sources that made this research possible: National Institute of Child Health and Human Development Grant 1-R21-HD081382-01A1 and National Institute on Deafness and Other Communication Disorders Grant 1-R01-DC016624-01A1, awarded to Leah Fabiano-Smith.
References
- American Speech-Language-Hearing Association. (2019). Key issues: Service provision for bilingual clients. https://www.asha.org/practice-portal/professional-issues/bilingual-service-delivery/
- Arizona Proposition 203. (2000). English language education for children in public schools. https://www.azleg.gov/jlbc/ballotprop203.pdf
- Barlow, J. A. (2003a). The Assessment of English Phonology. San Diego State University. [Google Scholar]
- Barlow, J. A. (2003b). The Assessment of Spanish Phonology. San Diego State University. [Google Scholar]
- Bauman-Wängler, J. A. (2000). Articulatory and phonological impairments: A clinical focus. Allyn & Bacon. [Google Scholar]
- Bedore, L. M. , Pena, E. D. , Gillam, R. B. , & Ho, T. H. (2010). Language sample measures and language ability in Spanish–English bilingual kindergarteners. Journal of Communication Disorders, 43(6), 498–510. https://doi.org/10.1016/j.jcomdis.2010.05.002 [DOI] [PMC free article] [PubMed] [Google Scholar]
- Curtin, S. , Byers-Heinlein, K. , & Werker, J. (2011). Bilingual beginnings as a lens for theory development: PRIMIR in focus. Journal of Phonetics, 39(4), 492–504. https://doi.org/10.1016/j.wocn.2010.12.002 [Google Scholar]
- Data USA. (2019). DATA USA: Tucson demographics. https://datausa.io/profile/geo/tucson-az/#demographics
- Dollaghan, C. A. , & Horner, E. A. (2011). Bilingual language assessment: A meta-analysis of diagnostic accuracy. Journal of Speech, Language, and Hearing Research, 54(4), 1077–1088. https://doi.org/10.1044/1092-4388(2010/10-0093) [DOI] [PubMed] [Google Scholar]
- Ebert, K. D. , Kohnert, K. , Pham, G. , Disher, J. R. , & Payesteh, B. (2014). Three treatments for bilingual children with primary language impairment: Examining cross-linguistic and cross-domain effects. Journal of Speech, Language, and Hearing Research, 57(1), 172–186. https://doi.org/10.1044/1092-4388(2013/12-0388) [DOI] [PMC free article] [PubMed] [Google Scholar]
- Fabiano-Smith, L. , & Barlow, J. A. (2010). Interaction in bilingual phonological acquisition: Evidence from phonetic inventories. International Journal of Bilingual Education and Bilingualism, 13(1), 81–97. https://doi.org/10.1080/13670050902783528 [DOI] [PMC free article] [PubMed] [Google Scholar]
- Fabiano-Smith, L. , & Bunta, F. (2012). Voice onset time of voiceless bilabial and velar stops in 3-year-old bilingual children and their age-matched monolingual peers. Clinical Linguistics & Phonetics, 26(2), 148–163. https://doi.org/10.3109/02699206.2011.595526 [DOI] [PMC free article] [PubMed] [Google Scholar]
- Fabiano-Smith, L. , & Goldstein, B. (2010a). Early-, middle-, and late-developing sounds in monolingual and bilingual children: An exploratory study. American Journal of Speech-Language Pathology, 19(1), 66–77. https://doi.org/10.1044/1058-0360(2009/08-0036) [DOI] [PubMed] [Google Scholar]
- Fabiano-Smith, L. , & Goldstein, B. (2010b). Phonological acquisition in bilingual Spanish-English–speaking children. Journal of Speech, Language, and Hearing Research, 53(1), 160–178. https://doi.org/10.1044/1092-4388(2009/07-0064) [DOI] [PubMed] [Google Scholar]
- Fabiano-Smith, L. , & Hoffman, K. (2018). Diagnostic accuracy of traditional measures of phonological ability for bilingual preschoolers and kindergarteners. Language, Speech, and Hearing Services in Schools, 49(1), 121–134. https://doi.org/10.1044/2017_LSHSS-17-0043 [DOI] [PMC free article] [PubMed] [Google Scholar]
- Fitzsimmons-Doolan, S. , Palmer, D. , & Henderson, K. (2017). Educator language ideologies and a top-down dual language program. International Journal of Bilingual Education and Bilingualism, 20(6), 704–721. https://doi.org/10.1080/13670050.2015.1071776 [Google Scholar]
- Gildersleeve-Neumann, C. E. , Kester, E. S. , Davis, B. L. , & Peña, E. D. (2008). English speech sound development in preschool-aged children from bilingual English–Spanish environments. Language, Speech, and Hearing Services in Schools, 39(3), 314–348. https://doi.org/10.1044/0161-1461(2008/030) [DOI] [PubMed] [Google Scholar]
- Goldman, R. , & Fristoe, M. (2000). Goldman-Fristoe Test of Articulation–Second Edition (GFTA-2). Pearson. [Google Scholar]
- Goldstein, B. , Fabiano, L. , & Iglesias, A. (2004). Spontaneous and imitated productions in Spanish-speaking children with phonological disorders. Language, Speech, and Hearing Services in Schools, 35(1), 5–15. https://doi.org/10.1044/0161-1461(2004/002) [DOI] [PubMed] [Google Scholar]
- Goldstein, B. A. , Fabiano, L. , & Washington, P. S. (2005). Phonological skills in predominantly English-speaking, predominantly Spanish-speaking, and Spanish–English bilingual children. Language, Speech, and Hearing Services in Schools, 36(3), 201–218. https://doi.org/10.1044/0161-1461(2005/021) [DOI] [PubMed] [Google Scholar]
- Goldstein, B. A. , & Iglesias, A. (1996). Phonological patterns in normally-developing Spanish-speaking 3- and 4-year-olds of Puerto Rican descent. Language, Speech, and Hearing Services in Schools, 27(1), 82–90. https://doi.org/10.1044/0161-1461.2701.82 [Google Scholar]
- Grosjean, F. (1989). Neurolinguists, beware! The bilingual is not two monolinguals in one person. Brain and Language, 36(1), 3–15. https://doi.org/10.1016/0093-934X(89)90048-5 [DOI] [PubMed] [Google Scholar]
- Gutiérrez-Clellen, V. , Restrepo, M. A. , & Simon-Cereijido, G. (2006). Evaluating the discriminant accuracy of a grammatical measure with Spanish-speaking children. Journal of Speech, Language, and Hearing Research, 49(6), 1209–1223. https://doi.org/10.1044/1092-4388(2006/087) [DOI] [PMC free article] [PubMed] [Google Scholar]
- Hammond, R. M. (2000). The sounds of Spanish: Analysis and application. Cascadilla Press. [Google Scholar]
- Hintze, J. M. , Ryan, A. L. , & Stoner, G. (2003). Concurrent validity and diagnostic accuracy of the Dynamic Indicators of Basic Early Literacy Skills and the Comprehensive Test of Phonological Processing. School Psychology Review, 32(4), 541–556. https://doi.org/10.1080/02796015.2003.12086220 [Google Scholar]
- Kaufman, A. S. , & Kaufman, N. L. (2004). The Kaufman Assessment Battery for Children, Second Edition. Wiley. [Google Scholar]
- Kayser, H. (1995). Assessment of speech and language impairments in bilingual children. In Kayser H. (Ed.), Bilingual speech-language pathology: An Hispanic focus (pp. 243–264). Singular. [Google Scholar]
- Lazewnik, R. , Creaghead, N. A. , Smith, A. B. , Prendeville, J. A. , Raisor-Becker, L. , & Silbert, N. (2019). Identifiers of language impairment for Spanish–English dual language learners. Language, Speech, and Hearing Services in Schools, 50(1), 126–137. https://doi.org/10.1044/2018_LSHSS-17-0046 [DOI] [PubMed] [Google Scholar]
- Mandrekar, J. N. (2010). Receiver operating characteristic curve in diagnostic test assessment. Journal of Thoracic Oncology, 5(9), 1315–1316. https://doi.org/10.1097/JTO.0b013e3181ec173d [DOI] [PubMed] [Google Scholar]
- MAP AZ Dashboard. (2018). Poverty rate. https://mapazdashboard.arizona.edu/healthsocialwell-being/poverty-rate
- Masso, S. , Baker, E. , McLeod, S. , & McCormack, J. (2014). Identifying phonological awareness difficulties in preschool children with speech sound disorders. Speech, Language and Hearing, 17(1), 58–68. https://doi.org/10.1179/2050572813Y.0000000028 [Google Scholar]
- McReynolds, L. , & Elbert, M. (1981). Criteria for phonological process analysis. Journal of Speech and Hearing Disorders, 46(2), 197–204. https://doi.org/10.1044/jshd.4602.197 [DOI] [PubMed] [Google Scholar]
- Miccio, A. W. (2002). Clinical problem solving. American Journal of Speech-Language Pathology, 11(3), 221–229. https://doi.org/10.1044/1058-0360(2002/023) [Google Scholar]
- NCH Software. (2015). Express Scribe transcription software. https://www.nch.com.au/scribe/versions.html
- Oetting, J. B. , Gregory, K. D. , & Rivière, A. M. (2016). Changing how speech-language pathologists think and talk about dialect variation. Perspectives of the ASHA Special Interest Groups, 1(16), 28–37. https://doi.org/10.1044/persp1.SIG16.28 [DOI] [PMC free article] [PubMed] [Google Scholar]
- Oller, D. , & Delgado, R. (2000). Logical International Phonetics Program (LIPP). Intelligent Hearing Systems. [Google Scholar]
- Paradis, J. (2001). Do bilingual two-year-olds have separate phonological systems? International Journal of Bilingualism, 5(1), 19–38. https://doi.org/10.1177/13670069010050010201 [Google Scholar]
- Pearson, B. , Fernandez, S. , Lewedeg, V. , & Oller, D. K. (1997). The relation of input factors to lexical learning by bilingual infants. Applied Psycholinguistics, 18(1), 41–58. https://doi.org/10.1017/S0142716400009863 [Google Scholar]
- Peña, E. D. , Bedore, L. M. , & Rappazzo, C. (2003). Comparison of Spanish, English, and bilingual children's performance across semantic tasks. Language, Speech, and Hearing Services in Schools, 34(1), 5–16. https://doi.org/10.1044/0161-1461(2003/001) [DOI] [PubMed] [Google Scholar]
- Peña, E. D. , Bedore, L. M. , & Zlatic-Giunta, R. (2002). Category-generation performance of bilingual children: The influence of condition, category, and language. Journal of Speech, Language, and Hearing Research, 45(5), 938–947. https://doi.org/10.1044/1092-4388(2002/076) [DOI] [PubMed] [Google Scholar]
- Peña, E. D. , Gutiérrez-Clellen, V. , Iglesias, A. , Goldstein, B. , & Bedore, L. (2013). Bilingual English–Spanish Assessment (BESA). Brookes. [Google Scholar]
- Pew Research Center. (2014). Hispanics only group to see its poverty rate decline and incomes rise. https://www.pewresearch.org/fact-tank/2014/09/19/hispanics-only-group-to-see-its-poverty-rate-decline-and-incomes-rise/
- Potapova, I. , Kelly, S. , Combiths, P. N. , & Pruitt-Lord, S. L. (2018). Evaluating English morpheme accuracy, diversity, and productivity measures in language samples of developing bilinguals. Language, Speech, and Hearing Services in Schools, 49(2), 260–276. https://doi.org/10.1044/2017_LSHSS-17-0026 [DOI] [PMC free article] [PubMed] [Google Scholar]
- Restrepo, A. (1998). Identifiers of predominantly Spanish-speaking children with language impairment. Journal of Speech, Language, and Hearing Research, 41(6), 1398–1411. https://doi.org/10.1044/jslhr.4106.1398 [DOI] [PubMed] [Google Scholar]
- Rodríguez-Guerra, M. (2020). Between-language interaction in early acquisition of speech: An analysis of gliding by bilingual preschoolers in Southern Arizona [Doctoral dissertation, The University of Arizona] . ProQuest Dissertations & Theses. [Google Scholar]
- Sabri, M. , & Fabiano-Smith, L. (2018). Phonological development in a bilingual Arabic-English–speaking child with bilateral cochlear implants: A longitudinal case study. American Journal of Speech-Language Pathology, 27(4), 1506–1522. https://doi.org/10.1044/2018_AJSLP-17-0162 [DOI] [PubMed] [Google Scholar]
- Schilling, S. G. , Carlisle, J. F. , Scott, S. E. , & Zeng, J. (2007). Are fluency measures accurate predictors of reading achievement? The Elementary School Journal, 107(5), 429–448. https://doi.org/10.1086/518622 [Google Scholar]
- Sennheiser. (2018). HD 400S headphones. https://en-us.sennheiser.com/headphonesmicstereo-over-ear-hd-400s
- Shriberg, L. D. (1993). Four new speech and prosody-voice measures for genetics research and other studies in developmental phonological disorders. Journal of Speech and Hearing Research, 36(1), 105–140. https://doi.org/10.1044/jshr.3601.105 [DOI] [PubMed] [Google Scholar]
- Shriberg, L. D. (1994). Five subtypes of developmental phonological disorders. Clinics in Communication Disorders, 4(1), 38–53. [PubMed] [Google Scholar]
- Shriberg, L. D. , Austin, D. , Lewis, B. A. , McSweeny, J. L. , & Wilson, D. L. (1997). The percentage of consonants correct (PCC) metric. Journal of Speech, Language, and Hearing Research, 40(4), 708–722. https://doi.org/10.1044/jslhr.4004.708 [DOI] [PubMed] [Google Scholar]
- Shriberg, L. D. , & Kwiatkowski, J. (1982). Phonological disorders I: A diagnostic classification system. Journal of Speech and Hearing Disorders, 47(3), 226–241. https://doi.org/10.1044/jshd.4703.226 [DOI] [PubMed] [Google Scholar]
- Shriberg, L. D. , & Kwiatkowski, J. (1994). Developmental phonological disorders I: A clinical profile. Journal of Speech and Hearing Research, 37(5), 1100–1126. https://doi.org/10.1044/jshr.3705.1100 [DOI] [PubMed] [Google Scholar]
- Sunnyside Unified School District. (2017). District vital statistics. http://www.susd12.org/node/50
- Yavas, M. , & Goldstein, B. (1998). Phonological assessment and treatment of bilingual speakers. American Journal of Speech-Language Pathology, 7(2), 49–60. https://doi.org/10.1044/1058-0360.0702.49 [Google Scholar]
- Zoom. (2015). Zoom H4n handy portable digital recorder. https://www.amazon.com/Zoom-H4n-Portable-Recorder-International/dp/B001TDSQ8A
Associated Data
This section collects any data citations, data availability statements, or supplementary materials included in this article.


