Abstract
Purpose:
Objective assessment of deformable image registration (DIR) accuracy often relies on the identification of anatomical landmarks in image pairs, a manual process known to be extremely time-expensive. The goal of this study is to propose a method to automatically detect vessel bifurcations in images and assess their use for the computation of target registration errors (TRE).
Materials and Methods:
Three image datasets were retrospectively analyzed. The first dataset included 10 pairs of inhale/exhale phases from lung 4DCTs and full inhale and exhale breath-hold CT scans from 10 patients presenting with chronic obstructive pulmonary disease, with 300 corresponding landmarks available for each case (DIR-Lab). The second dataset included 6 pairs of inhale/exhale phases from lung 4DCTs (POPI Dataset), with 100 pairs of landmarks for each case. The third dataset included 28 pairs of pre/post-radiotherapy liver contrast-enhanced CT scans, each with 5 manually picked vessel bifurcation correspondences. For all images, the vasculature was autosegmented by computing and thresholding a vesselness image. Images of the vasculature centerline were computed and bifurcations were detected based on centerline voxel neighbors’ count. The vasculature segmentations were independently registered using a Demons algorithm between representations of their surface with distance maps. Detected bifurcations were considered as corresponding when distant by less than 5 mm after vasculature DIR. The selected pairs of bifurcations were used to calculate TRE after registration of the images considering three algorithms: rigid registration, Anaconda and a Demons algorithm. For comparison with the ground truth, TRE values calculated using the automatically detected correspondences were interpolated in the whole organs to generate TRE maps. The performance of the method in automatically calculating TRE after image registration was quantified by measuring the correlation with the TRE obtained when using the ground truth landmarks.
Results:
The median Pearson correlation coefficients between ground truth TRE and corresponding values in the generated TRE maps were r=0.81 and r=0.67 for the lung and liver cases, respectively. The correlation coefficients between mean TRE for each case were r=0.99 and r=0.64 for the lung and liver cases, respectively.
Conclusion:
For lungs or liver CT scans DIR, a strong correlation was obtained between TRE calculated using manually picked or landmarks automatically detected with the proposed method. This tool should be particularly useful in studies requiring to assess the reliability of a high number of DIRs.
Keywords: Deformable image registration, Registration accuracy, Vessel bifurcations
Introduction
Advanced image-guided cancer treatment strategies increasingly rely on deformable image registration (DIR) methods. The use of DIR for the propagation of anatomical structures or region of interest boundaries from one image volume to another is now well established in radiation oncology.1 However, other applications that require DIR to be accurate at the voxel level, such as dose mapping between longitudinal images or in 4D images for automated voxel analysis, are still limited by the challenge in thoroughly characterizing the local registration error uncertainties and their clinical impact.2,3 The most objective way to characterize these errors is by having expert observers, such as radiologists, identify corresponding anatomical landmarks in the pairs of images to register. Identification of anatomical landmarks is usually facilitated in images which exhibit blood vessel branching such as images of the lung,4–8 liver9–13 or brain14,15. However, this task is extremely time-consuming, especially since observer uncertainty exist and should be quantified by considering different experts and reproducibility tests and gross errors occur, due to human error in interacting with the point selection software that requires data curation and evaluation of the selected points. Therefore, this approach has been adopted for evaluation of DIR accuracy only on relatively small image datasets, unlikely to represent all the challenges that DIR methods can face with the global population of patients and has not translated to patient-specific quality assurance (QA) in the clinical setting. A control quality tool that could automatically detect when the desired registration accuracy is not achieved would increase the safety of clinical protocols or robustness of studies involving DIR techniques.
Few methods have been evaluated to achieve this automatic DIR accuracy assessment. Muenzing et al16 proposed a machine learning based method to classify the local alignment of voxels in follow-up pairs of lung CT into three quality categories. Sokooti et al17 later evaluated the use of random forests for that same task. Datteri et al18 proposed the construction of error maps for brain MR images using multiple registration circuits and atlas data. More recently, Eppenhof and Pluim19 proposed and evaluated the use of 3D convolutional networks to generate registration error maps in inhale-exhale pairs of thoracic CT scans. An inconvenience of these machine learning approaches may be the difficulty for the clinical user to apprehend the results. If these methods can be used to generate error maps to draw the user’s attention on likely misaligned anatomical areas, they do not provide a clear rationale for the classification of the registration accuracy, such as well identified mismatching anatomical points. Other methods have been proposed to automatically detect large numbers of landmark correspondences in pairs of lung20,21, abdomen22,23 or head and neck images24 which can be used for the assessment of DIR accuracy. However, landmarks automatically identified using image intensity features may not necessarily represent actual anatomical correspondences. This paper proposes a heuristic method to reproduce the process of manual landmark selection by a human observer in images presenting with vascular trees. The proposed workflow consists of segmenting the vasculature, detecting vessel bifurcations, and selecting correspondences between the bifurcations.
Many studies have previously proposed to extract the vasculature information from the images to improve the accuracy of deformable image registration methods6,10,25–29. In this study, the vasculature trees were extracted and matched independently of the rest of the image. A list of corresponding vessel bifurcation points, as well as the possibility to visualize the vessel matching, can then be offered to the clinical user for a quick assessment of any other deformable alignment results. The approach was evaluated using 26 pairs of lung CT scans from publicly available datasets and 28 pairs of longitudinal contrast-enhanced CTs of liver cholangiocarcinoma. Target registration error (TRE) calculated with manually or automatically detected anatomical correspondences, and calculated after classic registration methods, were compared.
1. Materials and methods
2.1. Patient data
The method proposed in this paper was evaluated for lung and liver CT scans. The lung CT scans of a total of 26 individuals were collected from three publicly available datasets: DIR-Lab,7,30 DIR-Lab COPD8 and POPI31,32, while the liver dataset corresponded to CT scans of 28 patients previously treated at The University of Texas MD Anderson Cancer Center.
2.1.1. Lung datasets
The DIR-Lab dataset (https://www.dir-lab.com/) contains 4DCT scans from 10 subjects. The images were acquired by a General Electric Discovery ST PET/CT scanner (GE Medical Systems, Waukesha, WI) with a voxel size between 0.97×0.97 and 1.15×1.15 mm in the axial plane and a slice spacing of 2.5mm. For each pair of inhale (T0) and exhale (T50) phases, 300 pairs of manually selected feature landmarks defined are provided. Only the inhale and exhale phases of each 4DCT scan and corresponding landmarks were analyzed in this study.
The DIR-Lab COPD contains full inhale and exhale breath-hold CT scans from 10 patients presenting with chronic obstructive pulmonary disease (COPD). The images were acquired by a with a GE VCT 64-slice scanner (GE Healthcare Technologies, Waukesha, WI) with a resolution comprised between 0.59×0.59 and 0.74×0.74 mm in the axial plane and a slice spacing of 2.5mm. As for the DIR-Lab dataset, 300 pairs of manually selected landmarks are provided for each pair of images.
The POPI dataset contains 4DCT scans from the Léon Bérard Cancer Center & CREATIS lab, Lyon, France for 6 subjects (https://www.creatis.insa-lyon.fr/rio/popi-model/).31,32 The images were acquired by a Philips 16-slice Brilliance Big Bore Oncology Configuration (Phillips Medical Systems, Cleveland, OH) and had a resolution varying between 0.78×0.78 mm and 1.17×1.17 mm. The slice spacing was 2 mm. For each pair of inhale and exhale phases of the 4DCTs, 100 landmarks identified semi-automatically with a software tool33 are provided.
2.1.2. Liver longitudinal CT scans dataset
Pairs of contrast-enhanced CT scans pre- and post-radiation therapy acquired on average 113 ± 35 days apart were retrospectively analyzed for 28 patients with cholangiocarcinoma treated at MD Anderson. The spatial resolution of the CT scans ranged between 0.66×0.66 mm and 0.98×0.98 mm in the axial plane and the slice spacing ranged from 2 and 5 mm. For evaluation of the accuracy of DIR methods, five corresponding landmarks were previously manually identified in each pair of longitudinal images.10,11
2.2. Automatic TRE estimation
2.2.1. Lung cases
The workflow of the proposed method to estimate TRE between registered pairs of reference and secondary lung CT scans is depicted in Figure 1 and detailed below.
Figure 1.
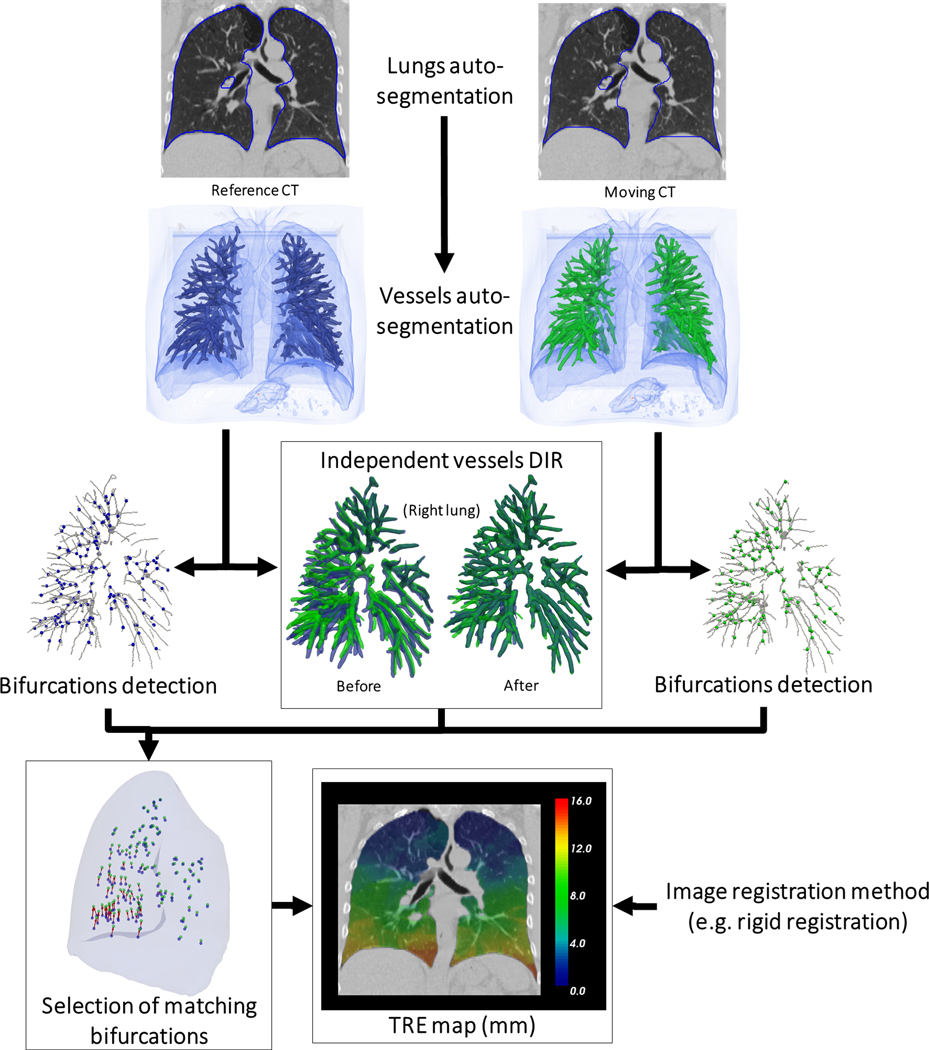
Workflow of the automatic definition of landmarks for TRE calculation. Example with a lung case from the DIR-Lab dataset (Case 2).
Lung and vessels segmentation
First, the left and right lung were automatically segmented on each image using a deep learning-based segmentation method consisting of a U-net model (R-231) trained on 236 lung CT scans including various diseases and distributed online by Hofmanninger et al in a recent lung segmentation study.34 All lung contours for the 26 cases were visually reviewed by an experienced imaging physics scientist (GC) and considered accurate enough for the purpose of this study without need for manual edits. A vessel segmentation algorithm, as described in detail in a previous study,6 was then applied to the image within the lung contours morphologically eroded by 5mm. Briefly, a vesselness image was computed as a combination of the eigen values of the Hessian matrix of the image.35 As a representation of the lung vasculature, a binary image was generated by thresholding the vesselness image in the lungs at the 95th percentile. This threshold being chosen empirically, the binary segmentation did not necessarily respect the actual diameter of the vessels but provided a representation of the vessel tree facilitating the extraction and registration of the vessel tree centerlines. To control the size of the vessels to detect, the original image is usually convolved with a Gaussian kernel of variance σ prior to calculation of the Hessian matrix. While highly detailed trees can be obtained by setting σ to 1mm as in prior work,6,36 establishing correspondences between such detailed trees appeared too challenging in cases which presented with large deformations. The variance σ was instead set to 3 mm in this study.
Detection of vessel bifurcations
The centerlines of the vessel trees were extracted using a skeletonization algorithm37 and the resulting binary images were used to automatically detect vessel bifurcations. For each voxel being part of the centerline, the number of other voxels in its 3×3×3 neighborhood also belonging to the centerline were counted. The voxel was considered to be a bifurcation point when that number was above 2 (a voxel in the middle of a branch will have only 2 neighbors). In order to avoid including bifurcation points where a branch would be only one voxel long, the 5×5×5 neighborhood of the detected bifurcation voxel was considered. In this case, at least 3 more voxels (at least 6 in total) should be counted. Bifurcations with a count below 6 voxels were then discarded. The skeletonization algorithm could sometimes generate small blobs in the trees which would result in multiple detected bifurcations in place of one. To remove these duplicates, the image of bifurcations was morphologically dilated with a spherical structuring element with radius 1 mm. The final bifurcation coordinates corresponded then to the center of mass of all connected regions.
Vessel trees matching
Signed squared distance maps were calculated from the vessel tree segmentations. The distance map represented on the secondary image was registered using a classic affine transformation optimized to minimize the mutual information between the two distance maps. After this initialization, deformable image registration was applied using an implementation of a variant of the Demons algorithm,38 with the smoothing parameter σ set at 2mm. The affine transform and displacement vector field (DVF) computed by the Demons algorithm were composed to provide a mapping the vessels of the reference image onto the vessels on the secondary image.
Selection of bifurcation correspondences.
Each bifurcation detected in the reference image was displaced according to . When a displaced bifurcation was located in the vicinity of a detected bifurcation in the secondary image within a distance τ, the correspondence between the two bifurcations was saved. All bifurcations of the reference image that did not fall close (within τ) to a bifurcation in the secondary image were discarded.
2.2.2. Liver cases
The method to detect bifurcation correspondences for the liver cases is the same as for the lung cases, except for the vessel segmentation and rigid initialization method which were described in detail in a previous study.10 Briefly, a multiscale vasculature enhancement filter based on the formulation by Frangi et al39 was applied to the liver CT followed by an Otsu thresholding filter40 to obtain a segmentation of the vessels. The skeletonization was performed using the same algorithm as for the lung cases37. The rigid initialization was based on a chamfer matching of the vessel segmentations and the deformable matching performed using distance maps and a Demons algorithm as for the lung. Figure 2 shows an example of segmentation results from a pre-treatment liver CT, the extracted centerline, and the bifurcations: manually picked, automatically detected and those for which a corresponding bifurcation was found in the post-treatment CT considering τ =4 mm.
Figure 2.
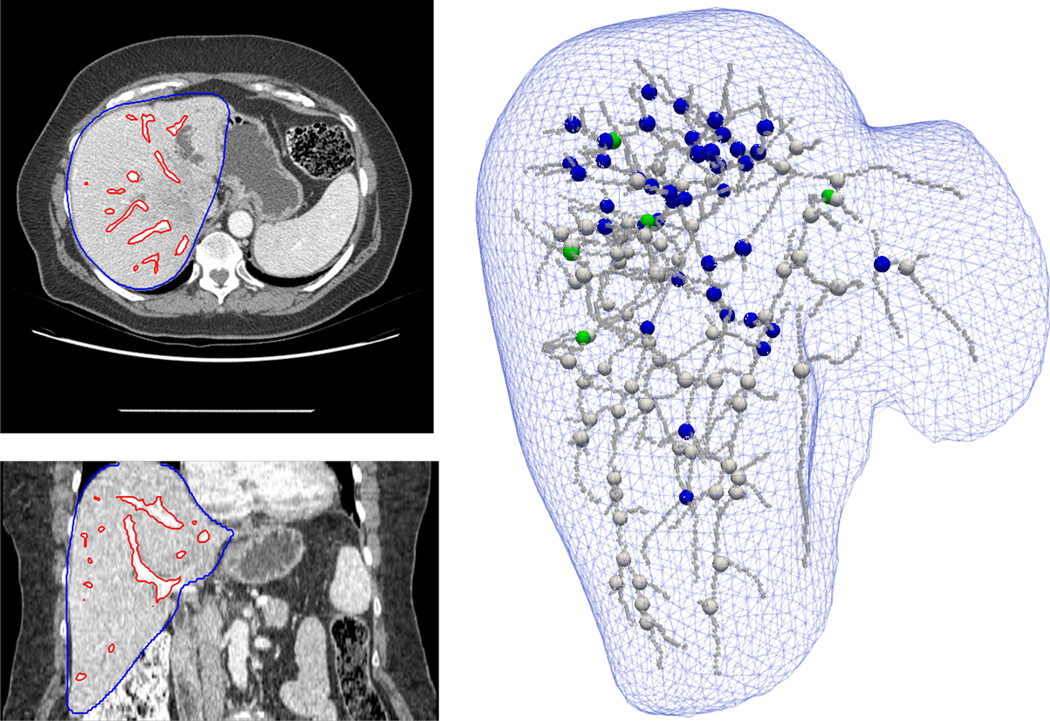
Example of a liver case. Left images: axial and coronal slices of the pre-treatment contrast-enhanced CT scan with the auto-segmentation of the liver (in blue) and vasculature (in red). Right: Representation of the liver surface and segmented vasculature centerline. Green spheres: the 5 ground truth landmarks. Blue spheres: the detected landmarks for which a correspondence was established on the post-treatment image. White spheres: the bifurcations that were detected in the pre-treatment image but discarded because no correspondence could be established in the post-treatment image according to the vessels DIR.
2.3. Comparison of automatic TREs vs ground truth
To evaluate the accuracy of the method in estimating TREs in a typical range of values, the 54 pairs of lung or liver images were registered using three standard registration methods: rigid, Anaconda in RayStation (RaySearch Laboratories, Stockholm, Sweden),41 and a Demons algorithm.38 The rigid alignment corresponded to the default alignment for the lung images and to the chamfer matching for the liver images. After each registration, the TREs were calculated using the ground truth and automatically detected landmark correspondences. Since the number and spatial distribution of the ground truth and automatically detected landmarks differed, the automatic TREs were interpolated at the ground truth landmarks locations. To perform this interpolation in an organ, a triangular mesh of this organ was created from its contour on the reference image. The number of points was on average (min;max): 7494 (4850;10346) and 4194 (3388;5866) for the two lungs and liver, respectively. Using these points and the landmarks in the reference image, a tetrahedral mesh was created using a Delaunay triangulation algorithm implemented in the Visualization Toolkit (www.vtk.org). Each point of the mesh corresponding to a landmark was assigned the corresponding TRE value, and each point of the external surface was assigned the TRE of the closest landmark. The TRE values in the mesh were then resampled on the grid of the reference image to provide a TRE map as illustrated in Figure 1.
To quantify the performance of the proposed method in automatically estimating TRE, the correlation with ground truth TRE was calculated. Using the TRE results from the three registration methods and for all pairs of images, the Pearson correlation coefficient r between the ground truth TREs and TREs given by the TRE maps was calculated. The performance of the method in estimating mean TRE for each case was evaluated in two ways. In Evaluation A, all the detected landmark correspondences were used for the mean TRE calculation. In Evaluation B, only the values resampled onto the ground truth landmark locations were used.
2. Results
3.1. Local TRE evaluation
Varying the tolerance parameter τ lead locally to different automatic TREs. Figure 3 represents the distribution of the Pearson correlation coefficients r between ground truth TREs and TREs derived from TRE maps for the different lung datasets. The value of τ providing the highest median correlation varied between the datasets, the optimal value for the DIR-Lab COPD dataset, which contains the cases with the largest deformations, being higher than for the POPI or DIR-Lab datasets. As a compromise, τ was set to 5mm for the rest of the study.
Figure 3.
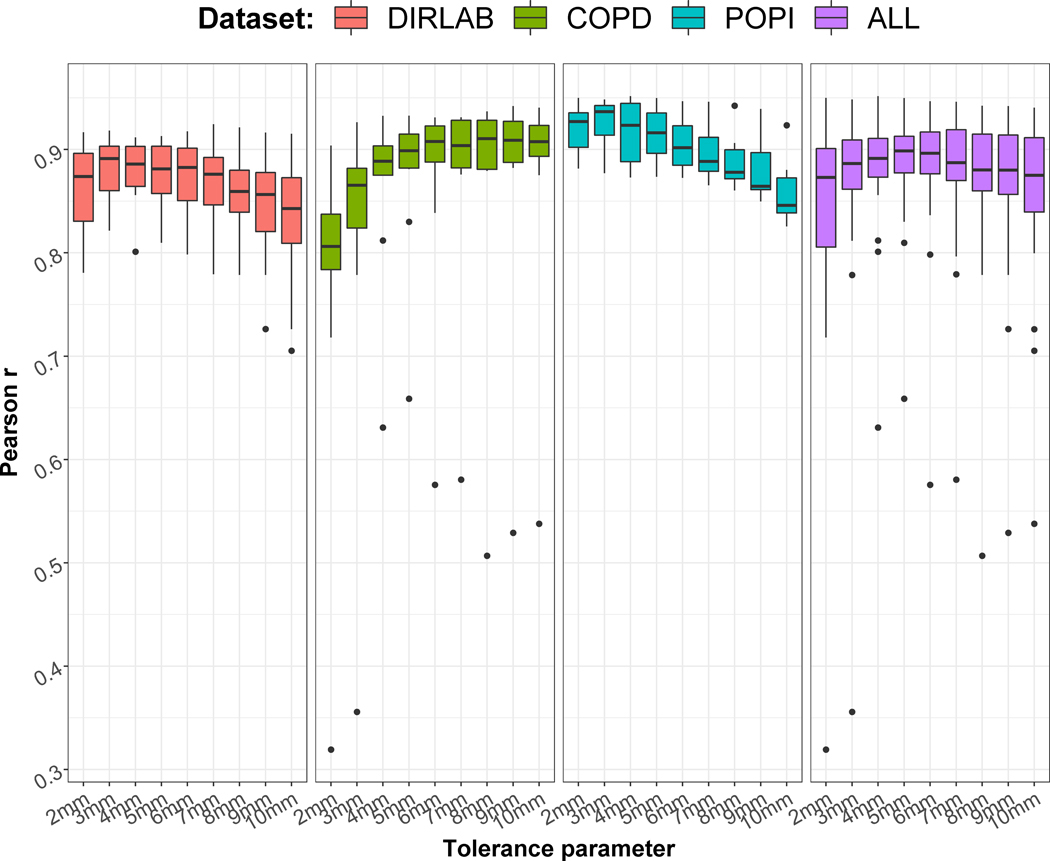
Distributions of the Pearson correlation coefficients between automatic and ground truth TREs for the 26 lung cases and different tolerance parameters τ.
The Pearson correlation coefficients r obtained for the liver cases are represented in Figure 4. The correlations were in general lower than for the lung cases. For a few cases, no or even negative correlations were obtained. As for the lung, the τ leading to the highest median r was 5mm and was therefore fixed to this value in the rest of the study.
Figure 4.
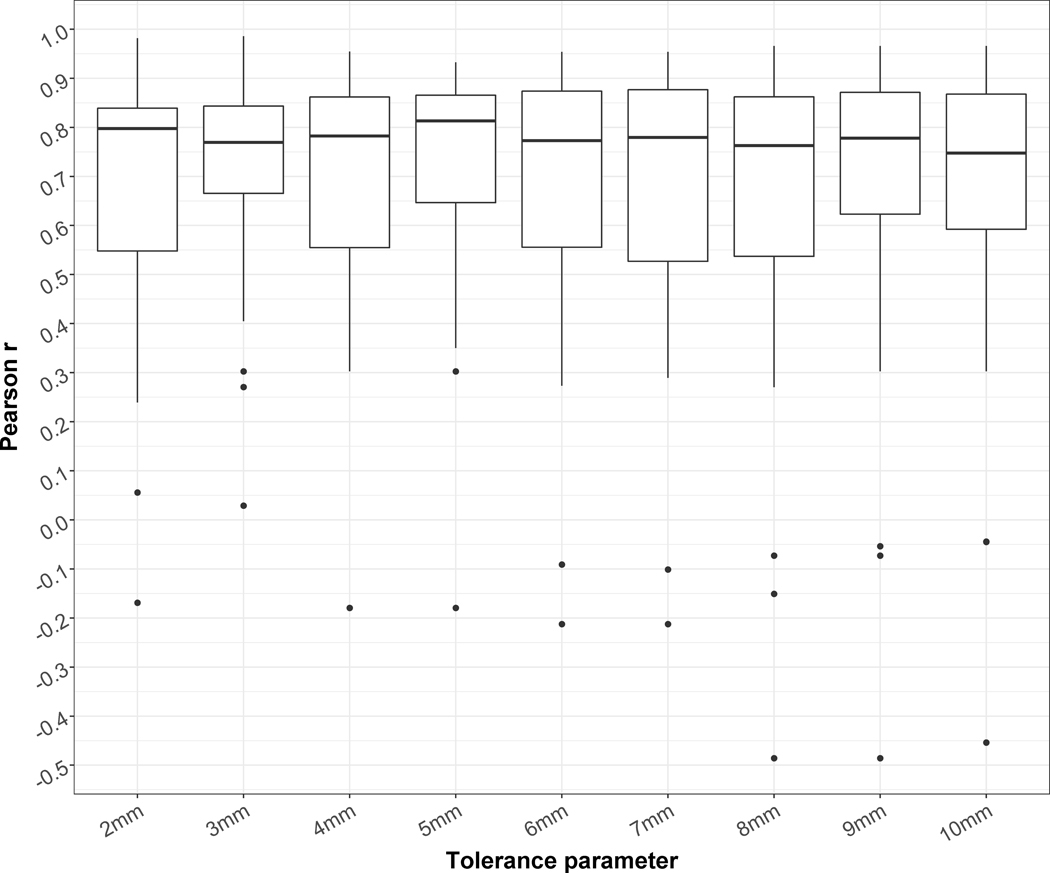
Distributions of the Pearson correlation coefficients between automatic and ground truth TREs for the 28 liver cases and different tolerance parameter τ.
The number of detected correspondences for τ = 5 mm was on average (min;max): 175 (64;312) and 32 (6;69) for the two lungs and liver, respectively. Figure 5 illustrates for the best, median and worst lung cases in terms of TRE correlation: the segmented vessels and corresponding bifurcations before and after matching of the tree; the generated TRE maps from these bifurcation correspondences; and the plot of the automatic vs ground truth TREs. For the best and median cases (r = 0.95 and 0.90, respectively), which were from the POPI and Dir-Lab dataset, the matching between the vessel trees appeared consistent. On the contrary, for the worst case, a case from the COPD dataset, the method seemed to fail at accurately matching the trees because of the large deformations between the deep inhale and exhale states of the lung. However, the TRE correlation was still moderate in this case (r = 0.66). Figure 6 illustrates similarly the results for the best, median and worst liver cases. The worst case presented a negative correlation between the automatic and ground truth TREs. The segmentation of the vasculature in the longitudinal images appeared less consistent than usual causing the method to detect only 8 bifurcation correspondences (versus an average of 32 for the 28 cases). These correspondences were also all located in a same small area yielding in this case to a rough TRE map of the liver.
Figure 5.
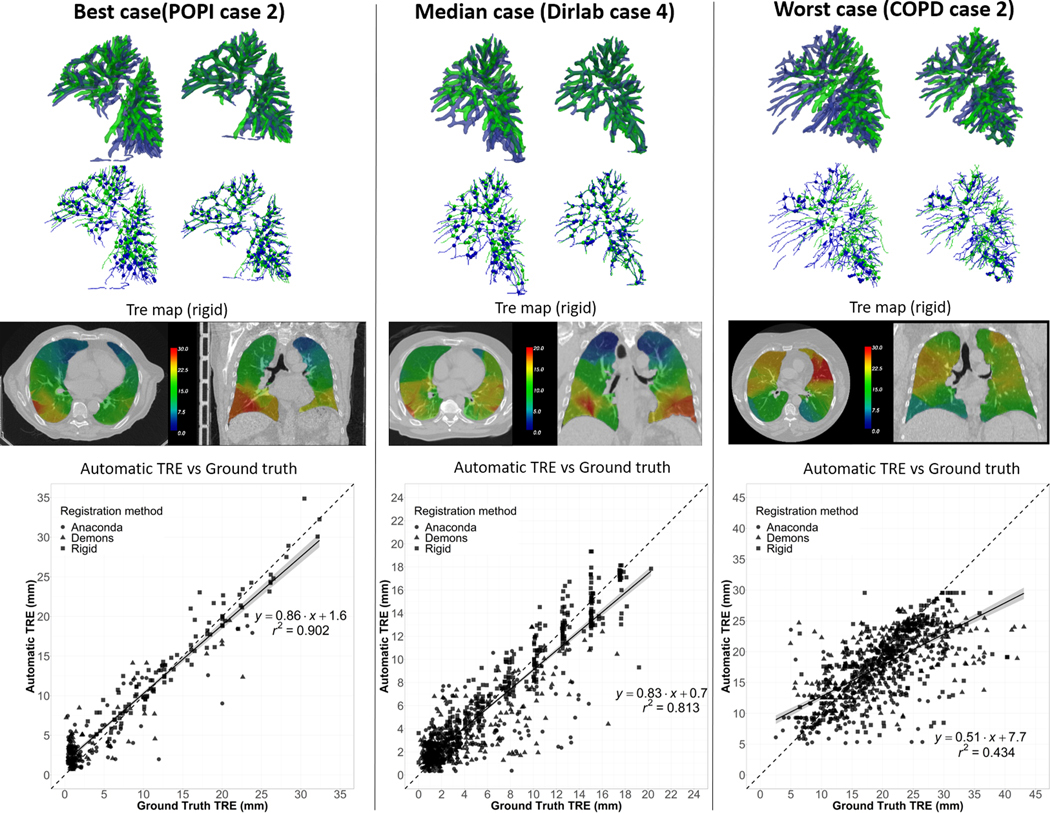
Best, median and worst lung cases results. Top row: Side view of the overlay between the vessels segmented on the reference image (in blue) and the secondary image (in green) before vessel matching (left) and after (right). Second row: Corresponding centerlines and bifurcation correspondences. Third row: Axial and coronal slice of the computed TRE maps calculated in case of rigid registration (arbitrary window/level setup). Bottom row: Plot of the correlation between automatic and ground truth TREs.
Figure 6.
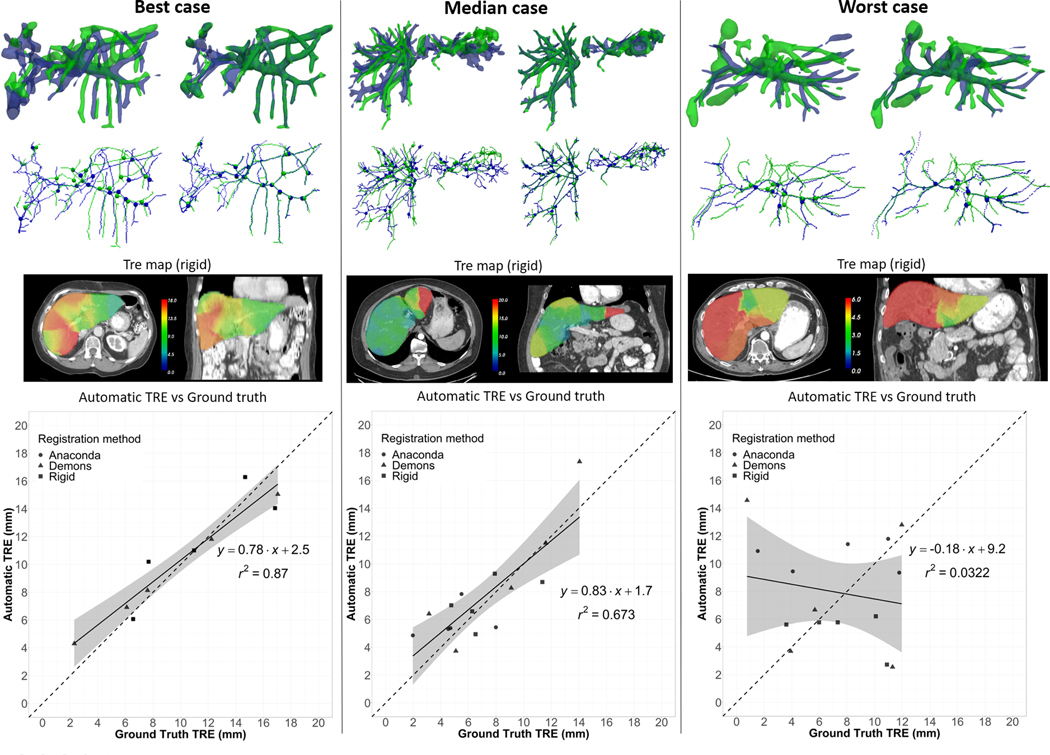
Best, median and worst liver cases results. Top row: Side view of the overlay between the vessels segmented on the reference image (in blue) and the secondary image (in green) before vessel matching (left) and after (right). Second row: Corresponding centerlines and bifurcation correspondences. Third row: Axial and coronal slice of the computed TRE maps calculated in case of rigid registration (arbitrary window/level setup). Bottom row: Plot of the correlation between automatic and ground truth TREs.
3.1. Mean TRE evaluation
Figure 7 reports for the lung cases the automatically determined mean TRE vs the ground truth mean TRE, using TREs based on all detected bifurcation correspondences (Evaluation A) or using TRE maps (Evaluation B). Using all detected correspondences, the mean automatic TRE presented a very high correlation with the ground truth (r2 = 0.97). This correlation was even higher when using interpolated TREs in Evaluation B (r2 = 0.99). Similarly, Figure 8 reports the mean TRE results for the liver cases. The correlation (r2 = 0.62) was inferior to the one obtained for the lung cases but still high. Again, the correlation was higher in Evaluation B (r2 = 0.64), indicating a certain sensitivity of the ground truth mean TRE to the location of the manually picked landmarks.
Figure 7.
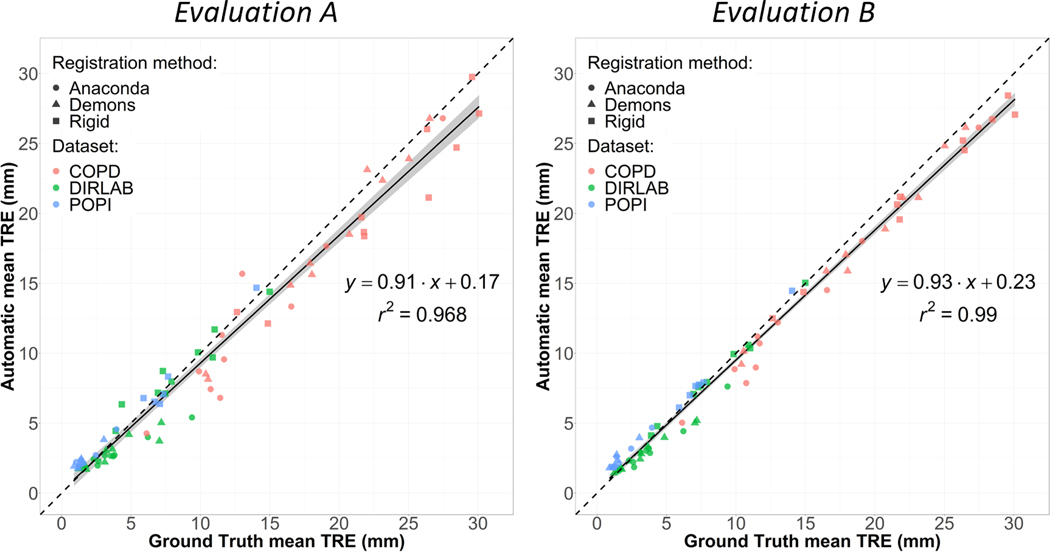
Representation for the lung cases of the correlation between the TREs calculated using the ground truth and automatically detected landmark correspondences. Left (Evaluation A): using all the detected landmarks. Right (Evaluation B): Using TRE maps.
Figure 8.
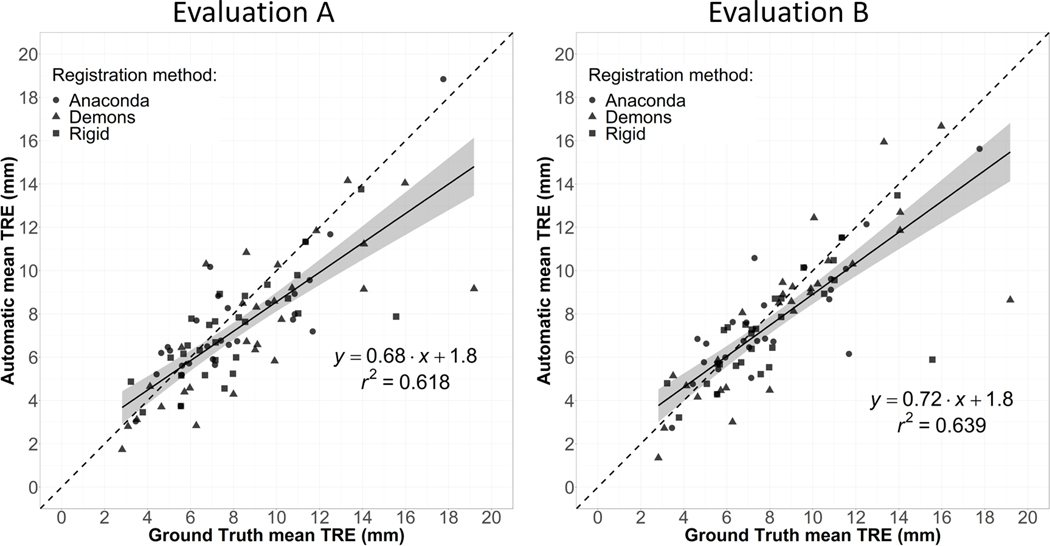
Representation for the liver cases of the correlation between the TREs calculated using the ground truth and automatically detected landmark correspondences. Left (Evaluation A): using all the detected landmarks. Right (Evaluation B): Using TRE maps.
Figure 9 shows the distributions of the mean TRE obtained for the three registration methods and Table 1 reports the mean values. Both Evaluation A and B yielded to similar distributions of the mean TRE as when using the ground truth landmarks.
Figure 9.
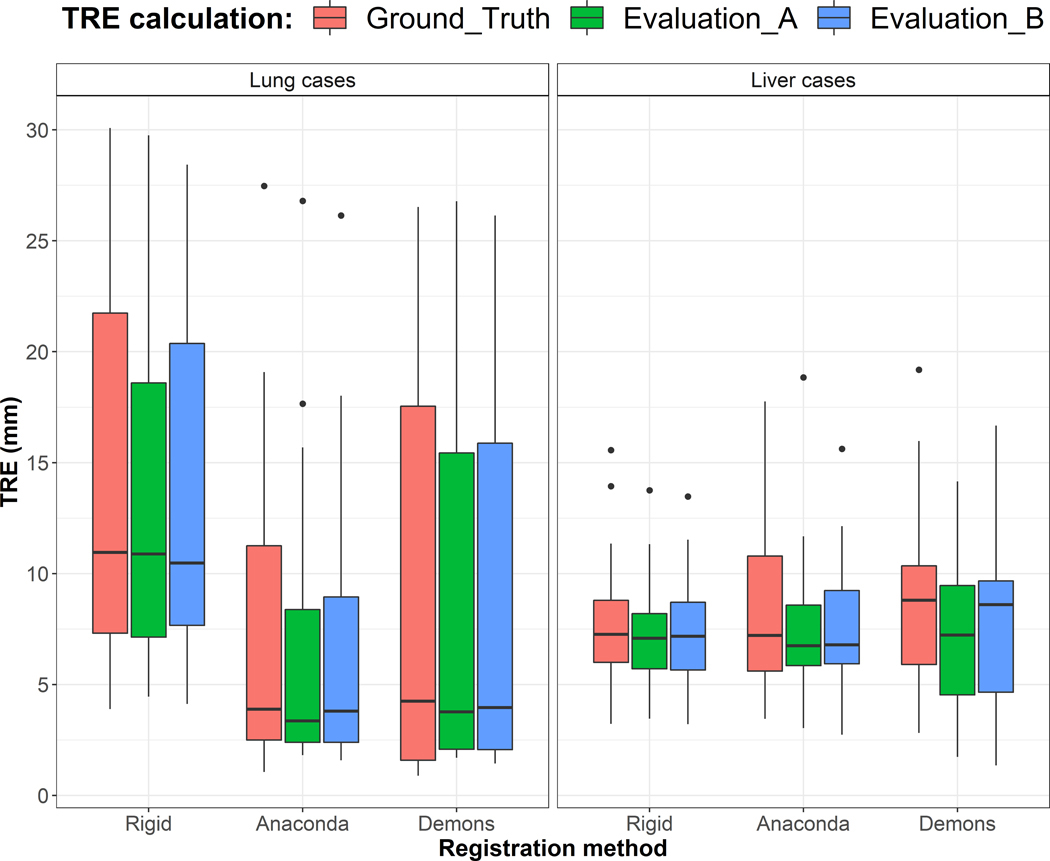
Distribution of the mean TRE for the lung (26) and liver (28) cases obtained after using the three registration methods and considering the ground truth landmarks, Evaluation A and B.
Table 1.
Mean TRE (±SD) (mm) after the three registration methods and considering the three evaluation methods.
| Lung cases | Liver cases | |||||
|---|---|---|---|---|---|---|
| Ground truth | Evaluation A | Evaluation B | Ground truth | Evaluation A | Evaluation B | |
| Rigid | 14.1±8.5 | 13.4±7.3 | 13.7±7.7 | 7.9±2.8 | 7.2±2.2 | 7.2±2.3 |
| Anaconda | 7.2±6.4 | 6.4±6.0 | 6.6±5.9 | 8.0±3.1 | 7.6±2.9 | 7.6±2.7 |
| Demons | 9.1±8.7 | 8.5±8.3 | 8.6±8.2 | 8.9±3.9 | 7.4±3.3 | 8.1±3.7 |
3. Discussion
A method was proposed in this paper to automatically estimate TRE after registration of lung or liver images exhibiting vasculature. The method allowed to accurately estimate mean TRE in these organs according to ground truth TRE derived from manually selected anatomical landmarks. This tool could thus be particularly valuable in studies involving numerous DIRs, such as dose accumulation studies, to automatically bring attention to probable DIR failure when automatic TRE exceeds certain threshold. In addition to detecting such cases, this tool can provide a clear and intuitive rational for the decision by allowing to visualize the vessels segmentation and estimated bifurcation correspondences, as for example as illustrated in figures 5 and 6. While approaches based on convolutional neural networks appear promising to estimate TRE values directly from the registered images, they do not directly offer this possibility to the user. We believe that the method proposed in this paper could be used as a tool that, in complement with others, will allow more robust assessments of DIR accuracy in the clinic for patient-specific QA. Treatment planning systems (TPS) for radiation therapy indeed currently lack this kind of tool which, after each application of a DIR, would provide the user with a measure of confidence (TRE) in the result, and the option to highlight anatomical areas likely not properly aligned.
Regarding the spatial distribution of the TRE, the method provided a very high correlation for all of the lung cases analyzed except for a couple of deep inhale and exhale image pairs. Parts of the workflow could be improved to address these challenging cases. For example, other vessel segmentation algorithms may provide more consistent results between the pairs of images, especially considering the remarkable recent advances in deep learning for image segmentation. The technique proposed to match the vessel trees could also be replaced by more advanced approaches, for example based on a graph definition of the trees. The difference between the optimal tolerance parameters τ for the three lung datasets suggest that a finer tuning of this parameter in future work could also improve the performance of the method, for example by adapting its value based on the initial distance between the landmarks. However, the optimal value of this parameter is dependent of other parts of the workflow, mainly the vessel segmentation and matching algorithms, which, we believe, are the components presenting the best opportunities of amelioration in our current implementation.
The results were more mitigated for the liver than for the lung, as for a few cases no correlation was found between the automatic and ground truth TREs. However, as discussed in prior work analyzing those data,10,11 large uncertainties exist in the ground truth landmarks in some cases because of poor contrast or dramatic liver response to treatment. These uncertainties could explain some of the discrepancies observed between automatic and ground truth TRE.
Finally, the method was evaluated using lung and liver CT scans, but the workflow could in theory be easily adapted for other imaging modalities or anatomical localization showing vascular trees, such as in the case of brain imaging.
4. Conclusion
A full workflow based on image processing techniques was proposed to automatically estimate TRE in pairs of CT scans for organs with visible vasculature. The evaluation on 26 lung pairs of different respiratory images and 28 longitudinal liver images showed that the method can provide an estimation of the mean TRE highly correlated to the TRE estimated using manually identified anatomical landmarks. The method thus appears particularly interesting to be incorporated as a control quality tool in studies involving an extensive use of DIR.
Acknowledgments
Research reported in this publication was supported in part by the Helen Black Image Guided Fund, in part by resources of the Image Guided Cancer Therapy Research Program at The University of Texas MD Anderson Cancer Center, in part by RaySearch Laboratories AB and University of Texas MD Anderson Cancer Center through a Co-Development and Collaboration Agreement, and in part by the National Cancer Institute of the National Institutes of Health under award numbers 1R01CA221971 and R01CA235564. Eugene Koay was supported by the Andrew Sabin Family Fellowship, the Sheikh Ahmed Center for Pancreatic Cancer Research, institutional funds from The University of Texas MD Anderson Cancer Center, the Khalifa Foundation, equipment support by GE Healthcare and the Center of Advanced Biomedical Imaging, Cancer Center Support (Core) Grant CA016672, and by NIH (5P50CA217674–02, U54CA210181, U54CA143837, U01CA200468, U01CA196403, U01CA214263, R01CA221971, R01CA248917, and R01CA218004).
Footnotes
Conflict of Interest Statement
Kristy Brock has a licensing agreement with RaySearch Laboratories AB.
Data availability
The data that support the findings of this study are available from the corresponding author upon reasonable request.
References
- 1.Rigaud B, Simon A, Castelli J, et al. Deformable image registration for radiation therapy: principle, methods, applications and evaluation. Acta oncologica (Stockholm, Sweden). 2019;58(9):1225–1237. [DOI] [PubMed] [Google Scholar]
- 2.Paganelli C, Meschini G, Molinelli S, Riboldi M, Baroni G. “Patient-specific validation of deformable image registration in radiation therapy: Overview and caveats”. Med Phys. 2018;45(10):e908–e922. [DOI] [PubMed] [Google Scholar]
- 3.Chetty IJ, Rosu-Bubulac M. Deformable Registration for Dose Accumulation. Seminars in radiation oncology. 2019;29(3):198–208. [DOI] [PubMed] [Google Scholar]
- 4.Yang YX, Teo SK, Van Reeth E, Tan CH, Tham IW, Poh CL. A hybrid approach for fusing 4D-MRI temporal information with 3D-CT for the study of lung and lung tumor motion. Med Phys. 2015;42(8):4484–4496. [DOI] [PubMed] [Google Scholar]
- 5.Sarrut D, Delhay B, Villard PF, Boldea V, Beuve M, Clarysse P. A comparison framework for breathing motion estimation methods from 4-D imaging. IEEE Trans Med Imaging. 2007;26(12):1636–1648. [DOI] [PubMed] [Google Scholar]
- 6.Cazoulat G, Owen D, Matuszak MM, Balter JM, Brock KK. Biomechanical deformable image registration of longitudinal lung CT images using vessel information. Physics in Medicine & Biology. 2016;61(13):4826. [DOI] [PMC free article] [PubMed] [Google Scholar]
- 7.Castillo R, Castillo E, Guerra R, et al. A framework for evaluation of deformable image registration spatial accuracy using large landmark point sets. Physics in medicine and biology. 2009;54(7):1849–1870. [DOI] [PubMed] [Google Scholar]
- 8.Castillo R, Castillo E, Fuentes D, et al. A reference dataset for deformable image registration spatial accuracy evaluation using the COPDgene study archive. Physics in medicine and biology. 2013;58(9):2861–2877. [DOI] [PMC free article] [PubMed] [Google Scholar]
- 9.Fernandez-de-Manuel L, Wollny G, Kybic J, et al. Organ-focused mutual information for nonrigid multimodal registration of liver CT and Gd–EOB–DTPA-enhanced MRI. Medical Image Analysis. 2014;18(1):22–35. [DOI] [PubMed] [Google Scholar]
- 10.Cazoulat G, Elganainy D, Anderson BM, et al. Vasculature-Driven Biomechanical Deformable Image Registration of Longitudinal Liver Cholangiocarcinoma Computed Tomographic Scans. Advances in Radiation Oncology. 2020;5(2):269–278. [DOI] [PMC free article] [PubMed] [Google Scholar]
- 11.Sen A, Anderson BM, Cazoulat G, et al. Accuracy of deformable image registration techniques for alignment of longitudinal cholangiocarcinoma CT images. Medical Physics. 2020;47(4):1670–1679. [DOI] [PMC free article] [PubMed] [Google Scholar]
- 12.Polan DF, Feng M, Lawrence TS, Ten Haken RK, Brock KK. Implementing Radiation Dose-Volume Liver Response in Biomechanical Deformable Image Registration. International Journal of Radiation Oncology* Biology* Physics. 2017;99(4):1004–1012. [DOI] [PMC free article] [PubMed] [Google Scholar]
- 13.Brock KK. Results of a Multi-Institution Deformable Registration Accuracy Study (MIDRAS). International Journal of Radiation Oncology*Biology*Physics. 2010;76(2):583–596. [DOI] [PubMed] [Google Scholar]
- 14.Reinertsen I, Lindseth F, Unsgaard G, Collins DL. Clinical validation of vessel-based registration for correction of brain-shift. Medical Image Analysis. 2007;11(6):673–684. [DOI] [PubMed] [Google Scholar]
- 15.Morin F, Courtecuisse H, Reinertsen I, et al. Brain-shift compensation using intraoperative ultrasound and constraint-based biomechanical simulation. Med Image Anal. 2017;40:133–153. [DOI] [PubMed] [Google Scholar]
- 16.Muenzing SEA, van Ginneken B, Murphy K, Pluim JPW. Supervised quality assessment of medical image registration: Application to intra-patient CT lung registration. Medical Image Analysis. 2012;16(8):1521–1531. [DOI] [PubMed] [Google Scholar]
- 17.Sokooti H, Saygili G, Glocker B, Lelieveldt BPF, Staring M. Accuracy Estimation for Medical Image Registration Using Regression Forests. 2016; Cham. [DOI] [PubMed] [Google Scholar]
- 18.Datteri RD, Liu Y, D’Haese PF, Dawant BM. Validation of a nonrigid registration error detection algorithm using clinical MRI brain data. IEEE Trans Med Imaging. 2015;34(1):86–96. [DOI] [PMC free article] [PubMed] [Google Scholar]
- 19.Eppenhof KAJ, Pluim JPW. Error estimation of deformable image registration of pulmonary CT scans using convolutional neural networks. J Med Imaging (Bellingham). 2018;5(2):024003–024003. [DOI] [PMC free article] [PubMed] [Google Scholar]
- 20.Fu Y, Wu X, Thomas AM, Li HH, Yang D. Automatic large quantity landmark pairs detection in 4DCT lung images. Medical Physics. 2019;46(10):4490–4501. [DOI] [PMC free article] [PubMed] [Google Scholar]
- 21.Vickress J, Battista J, Barnett R, Morgan J, Yartsev S. Automatic landmark generation for deformable image registration evaluation for 4D CT images of lung. Physics in Medicine & Biology. 2016;61(20):7236. [DOI] [PubMed] [Google Scholar]
- 22.Yang D, Zhang M, Chang X, et al. A method to detect landmark pairs accurately between intra-patient volumetric medical images. Med Phys. 2017;44(11):5859–5872. [DOI] [PubMed] [Google Scholar]
- 23.Grewal M, Deist T, Wiersma J, Bosman PA, Alderliesten T. An end-to-end deep learning approach for landmark detection and matching in medical images. Vol 11313: SPIE; 2020. [Google Scholar]
- 24.Paganelli C, Peroni M, Riboldi M, et al. Scale invariant feature transform in adaptive radiation therapy: a tool for deformable image registration assessment and re-planning indication. Physics in Medicine & Biology. 2012;58(2):287. [DOI] [PubMed] [Google Scholar]
- 25.Li B, Christensen GE, Hoffman EA, McLennan G, Reinhardt JM. Pulmonary CT image registration and warping for tracking tissue deformation during the respiratory cycle through 3D consistent image registration. Medical Physics. 2008;35(12):5575–5583. [DOI] [PMC free article] [PubMed] [Google Scholar]
- 26.Penney GP, Blackall JM, Hamady MS, Sabharwal T, Adam A, Hawkes DJ. Registration of freehand 3D ultrasound and magnetic resonance liver images. Med Image Anal. 2004;8(1):81–91. [DOI] [PubMed] [Google Scholar]
- 27.Porter BC, Rubens DJ, Strang JG, Smith J, Totterman S, Parker KJ. Three-dimensional registration and fusion of ultrasound and MRI using major vessels as fiducial markers. IEEE Transactions on Medical Imaging. 2001;20(4):354–359. [DOI] [PubMed] [Google Scholar]
- 28.Guo F, Zhao X, Zou B, Liang Y. Automatic Retinal Image Registration Using Blood Vessel Segmentation and SIFT Feature. International Journal of Pattern Recognition and Artificial Intelligence. 2017;31(11):1757006. [Google Scholar]
- 29.Cao K, Ding K, Reinhardt JM, Christensen GE. Improving Intensity-Based Lung CT Registration Accuracy Utilizing Vascular Information. International journal of biomedical imaging. 2012;2012:285136. [DOI] [PMC free article] [PubMed] [Google Scholar]
- 30.Castillo E, Castillo R, Martinez J, Shenoy M, Guerrero T. Four-dimensional deformable image registration using trajectory modeling. Physics in medicine and biology. 2009;55(1):305–327. [DOI] [PMC free article] [PubMed] [Google Scholar]
- 31.Vandemeulebroucke J, Rit S, Kybic J, Clarysse P, Sarrut D. Spatiotemporal motion estimation for respiratory-correlated imaging of the lungs. Med Phys. 2011;38(1):166–178. [DOI] [PubMed] [Google Scholar]
- 32.Vandemeulebroucke J, Bernard O, Rit S, Kybic J, Clarysse P, Sarrut D. Automated segmentation of a motion mask to preserve sliding motion in deformable registration of thoracic CT. Med Phys. 2012;39(2):1006–1015. [DOI] [PubMed] [Google Scholar]
- 33.Murphy K, van Ginneken B, Klein S, et al. Semi-automatic construction of reference standards for evaluation of image registration. Medical Image Analysis. 2011;15(1):71–84. [DOI] [PubMed] [Google Scholar]
- 34.Hofmanninger J, Prayer F, Pan J, Röhrich S, Prosch H, Langs G. Automatic lung segmentation in routine imaging is primarily a data diversity problem, not a methodology problem. European Radiology Experimental. 2020;4(1):50. [DOI] [PMC free article] [PubMed] [Google Scholar]
- 35.Sato Y, Nakajima S, Shiraga N, et al. Three-dimensional multi-scale line filter for segmentation and visualization of curvilinear structures in medical images. Medical image analysis. 1998;2(2):143–168. [DOI] [PubMed] [Google Scholar]
- 36.Cazoulat G, Balter JM, Matuszak MM, Jolly S, Owen D, Brock KK. Mapping lung ventilation through stress maps derived from biomechanical models of the lung. Medical Physics. 2021;48(2):715–723. [DOI] [PMC free article] [PubMed] [Google Scholar]
- 37.Lee T-C, Kashyap RL, Chu C-N. Building skeleton models via 3-D medial surface axis thinning algorithms. CVGIP: Graphical Models and Image Processing. 1994;56(6):462–478. [Google Scholar]
- 38.Wang H, Dong L, O’Daniel J, et al. Validation of an accelerated ‘demons’ algorithm for deformable image registration in radiation therapy. Physics in Medicine & Biology. 2005;50(12):2887. [DOI] [PubMed] [Google Scholar]
- 39.Frangi AF, Niessen WJ, Vincken KL, Viergever MA. Multiscale vessel enhancement filtering. Paper presented at: International Conference on Medical Image Computing and Computer-Assisted Intervention 1998. [Google Scholar]
- 40.Otsu N. A Threshold Selection Method from Gray-Level Histograms. IEEE Transactions on Systems, Man, and Cybernetics. 1979;9(1):62–66. [Google Scholar]
- 41.Weistrand O, Svensson S. The ANACONDA algorithm for deformable image registration in radiotherapy. Med Phys. 2015;42(1):40–53. [DOI] [PubMed] [Google Scholar]
Associated Data
This section collects any data citations, data availability statements, or supplementary materials included in this article.
Data Availability Statement
The data that support the findings of this study are available from the corresponding author upon reasonable request.


