Abstract
Cobalt-doped TiO2-based diluted magnetic semiconductors were successfully synthesized using a co-precipitation method. The X-ray diffraction study of all the samples showed good crystallinity, matching the standard tetragonal anatase phase. The X-ray diffraction peaks of the cobalt-doped sample slightly shifted towards a lower angle showing the decrease in particle size and distortion in the unit cell due to cobalt incorporation in the lattice of TiO2. Transmission electron microscopy showed the spherical morphology of the TiO2 nanoparticles, which decreased with Co-doping. The optical characteristics and band gap investigation revealed that defects and oxygen vacancies resulted in lower band gap energy and maximum absorption in the visible region. Dielectric measurements showed enhancement in the dielectric constant and AC conductivity, while the dielectric loss decreased. The enhancement in the dielectric properties was attributed to interfacial polarization and charge carrier hopping between Co and Ti ions. The magnetic properties displayed that pure TiO2 was diamagnetic, while Co-doped TiO2 showed a ferromagnetic response at 300 K. The visible light-driven photocatalytic activity showed an improvement for Co-doped TiO2. Our results demonstrate that Co-doping can be used to tune the physical properties and photocatalytic activity of TiO2 for possible spin-based electronics, optoelectronics, and photo-degradation applications.
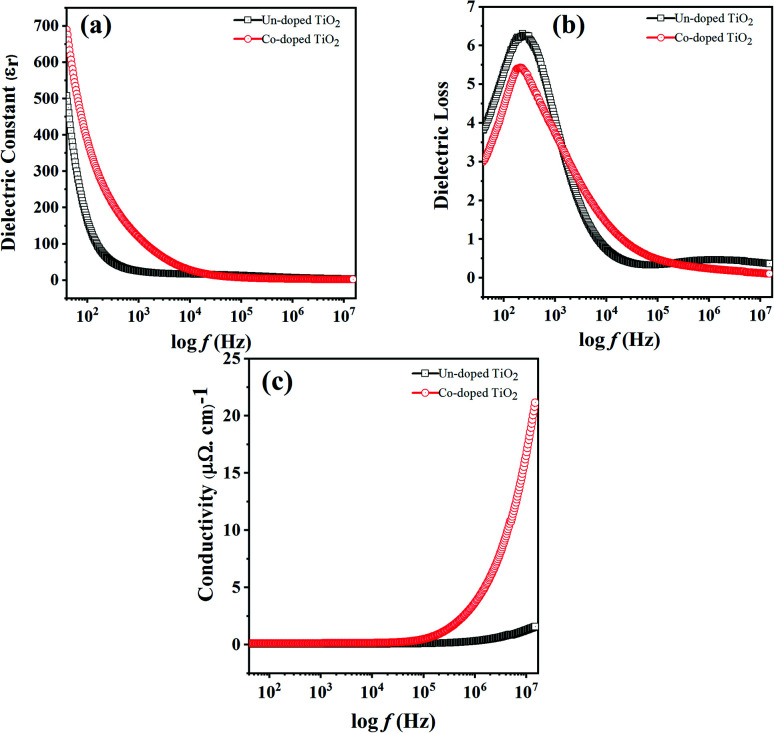
(a) dielectric constant, (b) dielectric loss and (c) AC conductivity vs. frequency for un-doped and 5 at% Co-doped TiO2 NPs.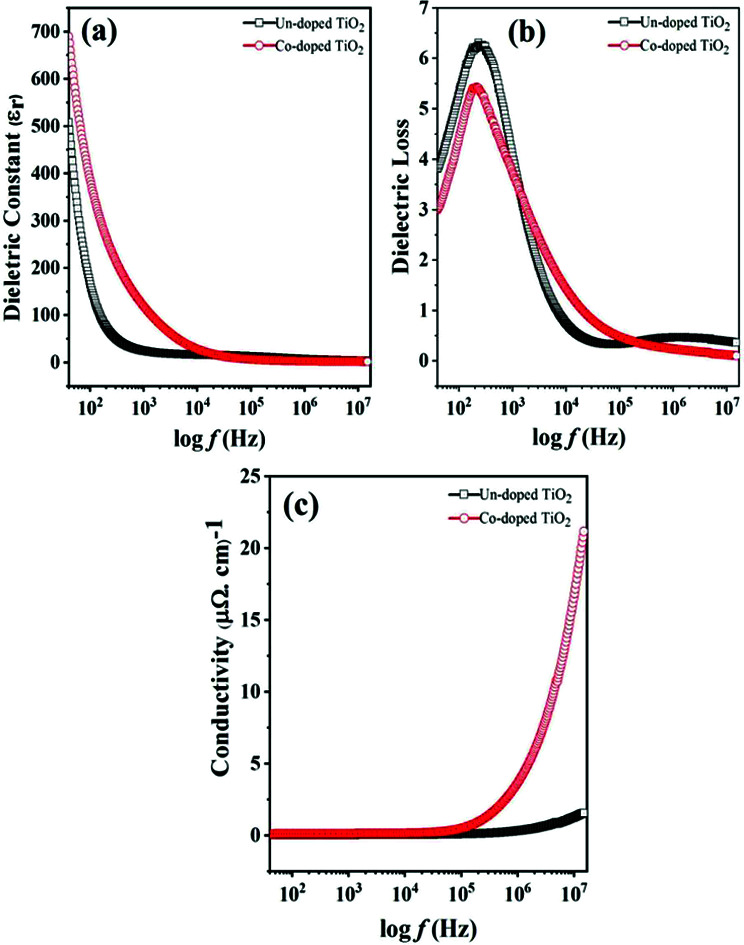
1. Introduction
Among oxide-based semiconductors, titanium dioxide (TiO2) is a well-known semiconductor that exhibits interesting properties such as non-toxicity, chemical stability, biocompatibility, long-term durability, transparency to visible light, and efficient photocatalytic activity.1,2 Because of these intriguing qualities, it is employed in a wide range of conventional and high-tech applications, such as catalysts, pigments, ceramics, catalyst supports, sensors, energy storage, magnetic data storage, solar cells, photoanodes, ion-conducting layers, and magneto-optical applications.3 TiO2 has three main polymorphs, i.e., anatase, rutile, and brookite.3,4 The anatase type is of hexagonal structure belonging to the space group I41/amd with a band gap of 3.2 eV, while the rutile type belongs to the space group P42/mnm with a bandgap of 3 eV. The rutile structure is similar to anatase, and the only difference is that the octahedra share four edges instead of four corners. The rutile phase is stable at most temperatures and pressures, while the other forms of titania transform to the rutile phase. Brookite TiO2 has an orthorhombic crystal structure belonging to the Pcab space group with a bandgap of 3.26 eV.5,6 Anatase TiO2 is the predominant commercial phase, which is mainly used in photocatalytic processes because of its high activity, and the rutile phase is mainly used as a whitening agent.7
Many synthesis techniques, such as co-precipitation, hydrothermal, sol–gel, wet chemical, and chemical vapour deposition, have been used to synthesize TiO2 nanostructures.8 Among them, the co-precipitation chemical method is a facile, economical, and valuable synthesis route. It was used in the current report to synthesize Co-doped TiO2 nanoparticles.9 Many properties of TiO2, such as the photocatalytic, magnetic, and dielectric properties, can be enhanced by doping it with foreign elements, either non-metallic or metallic ions. For example, the bandgap energy of pure TiO2 is significant (3–3.2 eV), corresponding to ultraviolet radiation such that a small portion of the solar spectrum is absorbed in the UV region, which decreases the photocatalytic activity.10,11 The photocatalytic activity of TiO2 is enhanced by doping due to the narrowing of the band gap. With doping, new mid-gap energy states are introduced at the top of the conduction band and thus narrow the band gap such that the absorption edge is extended from the UV-region to the Vis-light region.12,13 Khurana et al. reported a decrease in band gap energy of TiO2 nanoparticles with cobalt doping from 3.03 eV to 1.93 eV.14 When Ti4+ is replaced by Co2+, oxygen vacancies are generated, which change the construction of the valence band and conduction band. Hence, new energy states are introduced in forbidden energy bands that reduce the band gap. The decrease in band gap energy increases the visible light absorption, enhancing the photocatalytic activity.15 Similarly, the magnetic properties of titania are greatly affected by transition metal ion incorporation.16,17 Many authors have reported that pure TiO2 is diamagnetic, while Co-doped TiO2 shows room temperature ferromagnetism (RTFM),18,19 which contradicts some reports that show that TiO2 displays small ferromagnetic behavior.16 Some studies report that the RTFM in Co-doped TiO2 is due to the Co-content and oxygen vacancies, and thus a combined intrinsic and extrinsic effect;20 hence, both the cobalt and oxygen vacancies are significant in RTFM.18 However, the mechanism by which Co-doped into TiO2, like other TM doped TiO2, exhibits ferromagnetism is still contested, and whether it is an inherent or extrinsic property remains unclear.
In the present work, pure and 5 at% Co-doped TiO2 nanoparticles were fabricated using the co-precipitation technique, and their different properties were characterized using X-ray diffractometry (XRD), transmission electron microscopy (TEM), ultraviolet-visible diffuse reflectance spectroscopy (UV-Vis DRS), dielectric spectroscopy, and vibrating sample magnetometry (VSM). Additionally, the photocatalytic activity of the synthesized samples was also investigated.
2. Materials and methods
The co-precipitation method was used to fabricate pure and Co-doped TiO2 nanoparticles (NPs). The initial precursors were titanium tetrachloride (TiCl4) and ammonia water (NH4OH). In addition, chloride hexahydrate (CoCl2·6H2O) was used to fabricate Co-doped TiO2 NPs. Pure TiO2 was fabricated by adding TiCl4 dropwise into distilled water at a ratio of 1 : 15 with agitation under a fume hood to produce an exothermic reaction. The solution was stirred for 30 min at room temperature. Ammonium hydroxide (NH4OH) was added dropwise to the solution until the pH reached 10. The solution was allowed to settle for 12 h before separating and washing the precipitates many times with distilled water, then drying at 150 °C for 12 h. The solid residue was pulverized and calcined at 600 °C for 4 h at a heating rate of 20 °C min−1 in a furnace to get crystalline TiO2. The same procedure was used to fabricate Co-doped TiO2 NPs where an appropriate amount of cobalt chloride (CoCl2·6H2O) solution was used as a precursor.
3. Results and discussion
3.1. Structural properties
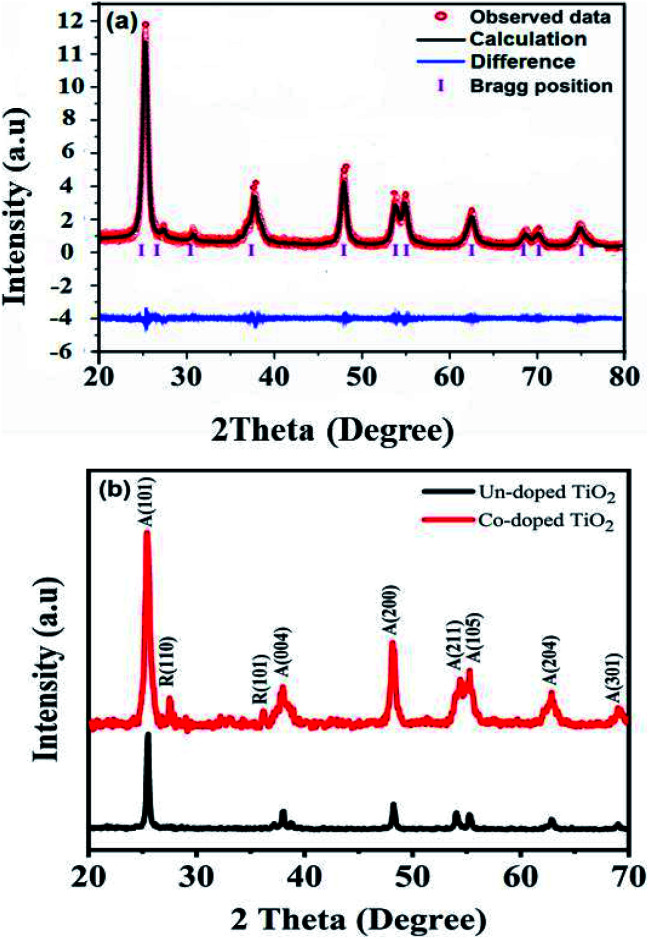
The XRD diffractograms of the pure and 5 at% Co-doped TiO2 NPs are shown in Fig. 1. Fig. 1(a) shows the powder XRD pattern of the un-doped TiO2 sample, together with its Rietveld refinement (weighted profile factor, RWP = 2.4% and the goodness-of-fit, χ2 = 1.67). All peaks could be well indexed with the hexagonal structure (BaNiO3-type, space group P63/mmc), and the lattice parameters of a = 3.7861 Å and c = 9.5054 Å were obtained using Rietveld refinement. Strong peaks are seen in all specimens in the range of 20° ≤ 2θ ≤ 70° showing good crystallinity of the samples.21,22 The strongest intensity of the (101) diffraction peak is found at around 25.20° and corresponds to the anatase polycrystalline structure.23 Interestingly, for Co-doped TiO2, in addition to the anatase peaks, small peaks appeared at 2θ = 27.546° (110) and 2θ = 36.176° (101) and represent the formation of the rutile phase, as shown in Fig. 1(b). The relative weight fractions of the rutile phase in the anatase-rutile phase mixture was estimated using the relation:24 , where IR and IA are the integrated intensity of the most intense rutile and anatase peak ((110) and (101) in this case) and 0.886 is a unit-less correction factor to account for the differences in scattering intensities due to the different crystal structures. The anatase phase proportion in the sample was found to be around 88.17%, while the minor part of the sample consisted of the rutile phase (11.83%). Besides the rutile phase, no other phases were found, indicating that cobalt ions are uniformly dispersed in the TiO2 matrix. The observed changes in the lattice parameters and a small shift of the diffraction peaks towards the lower angle in Co-doped TiO2 is also due to the different ionic radius of Co2+ (0.72 Å)25 and Ti4+ (0.68 Å), indicating that the doping of Co2+ in the TiO2 matrix is substitutional.21,26 The following Debye–Scherrer's formula was used to determine the average crystallite size D of the synthesized samples from the XRD spectra:27
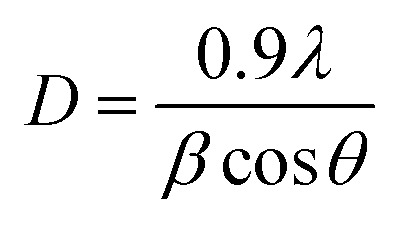 |
1 |
where λ is the wavelength of the incident X-ray, β (in radians) is the angular peak width at half maximum, and θ represents Bragg's diffraction angle.
Fig. 1. (a) X-ray diffraction pattern of TiO2 NPs with its Rietveld refinement. (b) XRD patterns of un-doped and 5 at% Co-doped TiO2 NPs; the inset in the figure shows the peak shifting with Co-doping.
The average crystallite size determined is 29.6 nm for pure TiO2 and 15.4 nm for Co-doped TiO2. The formation of the rutile phase in the Co-doped specimen might be due to the creation of oxygen vacancies. As the ionic charge of Ti4+ is greater than that of Co2+, dopant replacement causes some charge imbalance and vacancy creation as the system tries to achieve charge neutrality. This accelerates diffusion and enhances the crystallization of the rutile phase. Thus, crystallization occurs when titanium and oxygen ions break bonds and rearrange during heat treatment. The presence of vacancies provides a path for ion diffusion and lowers the activation energy to facilitate the growth of rutile in Co-doped compared to pure TiO2.28,29 Y. Shao et al. showed that during the anatase to rutile transformation process, using smaller grain sizes of Co-doped TiO2 results in low total surface energy and activation energy due to increased surface area.30 Some authors reported that the phase transformation could be due to the difference in ionic radii between cobalt and titania ions, such that the unit cell distortions occur when cobalt ions substitute for titanium ions. Incorporating cobalt generates strain energy, which lowers the activation energy needed for transformation.31
3.2. Transmission electron microscopy
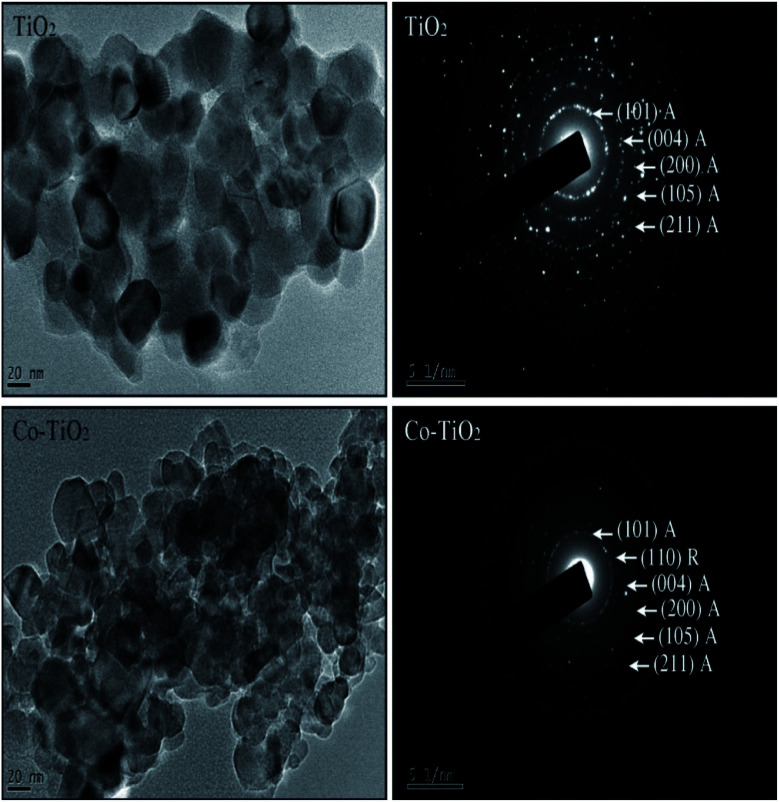
The transmission electron microscopy (TEM) images of un-doped and Co-doped TiO2 NPs are shown in Fig. 2 (left panel). The TEM images show almost spherical-shaped particles with a uniform distribution for both the un-doped and Co-doped TiO2 samples. The TEM analysis confirmed that the average particle size is around 30 nm for pure TiO2 and 16 nm for Co-doped TiO2. The particle size decreases with cobalt doping, which is in good agreement with the XRD results.
Fig. 2. (left panel) TEM images of un-doped TiO2 and 5 at% Co-doped TiO2 NPs. (right panel) SAED images of un-doped TiO2 and 5 at% Co-doped TiO2 NPs.
The selected area electron diffraction (SAED) images of the prepared nanoparticles are shown in Fig. 2 (right panel). The fringes obtained in the SAED pattern for the un-doped sample indicate the formation of the polycrystalline tetragonal anatase structure of TiO2. The rings observed in the doped nanoparticles show the presence of a small rutile phase with anatase as the primary phase, consistent with the XRD results. It is also important to highlight that the broad XRD peak of Co-doped TiO2 indicates the small crystallite size and hence large surface area. From the TEM micrograph, it can be seen clearly that the size of Co-doped TiO2 is reduced as compared to pristine TiO2 indicating that the surface area of Co-doped TiO2 is larger than that of pristine TiO2. A larger surface area of the sample is required for enhanced photodegradation efficiency.32
3.3. UV-vis DRS study
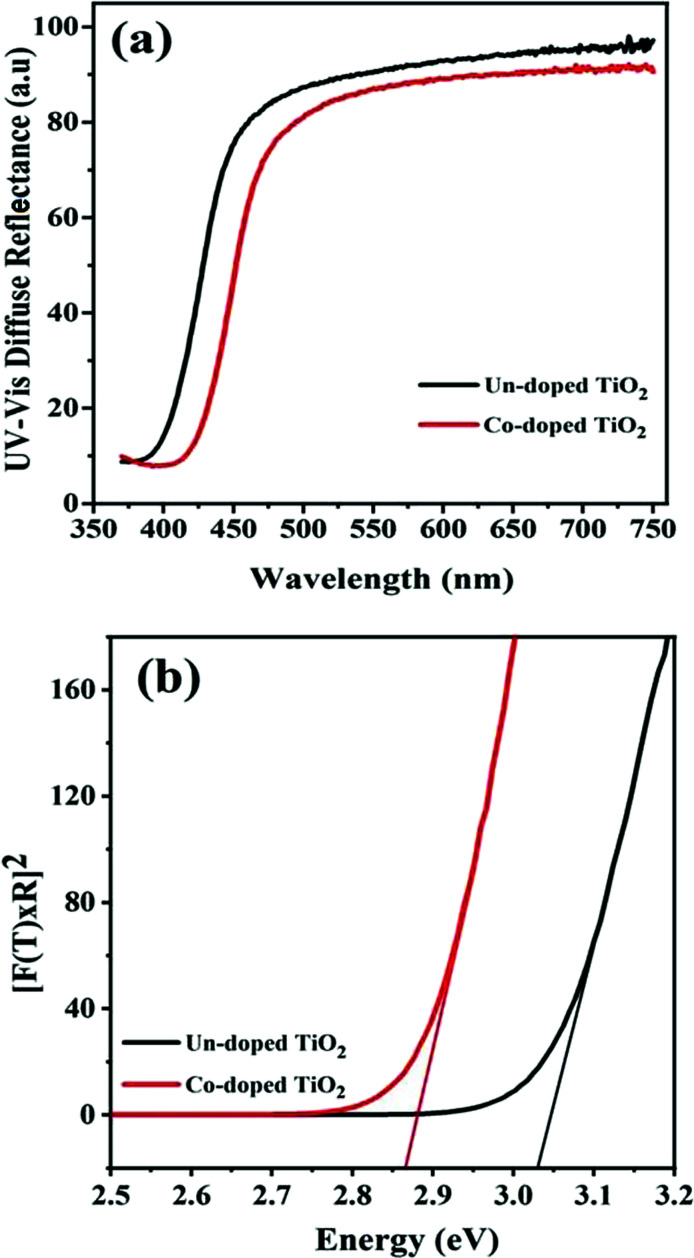
Room-temperature ultraviolet-visible spectra of the fabricated specimens of pure and Co-doped TiO2 nanoparticles are shown in Fig. 3(a). It can be observed that the absorption of TiO2 nanoparticles increases with an increase in Co-doping. The absorption edge is around 397 nm for pure TiO2, while the maximum absorption of the Co-doped TiO2 was about 425 nm, showing the shift in the absorption edge towards a longer wavelength (red-shift). This result corroborates well with a previous report.33 The cobalt and titania ions facilitate charge transfer interaction, causing the observed shifts in the visible region peak absorption spectra of Co-doped TiO2.
Fig. 3. (a) UV-Vis spectra and (b) band gap calculation for un-doped and 5 at% Co-doped TiO2 NPs.
Fig. 3(b) gives the band gap obtained from the DRS data. The calculations were made from the plot of [F(R) × E]2vs. E = hv, where 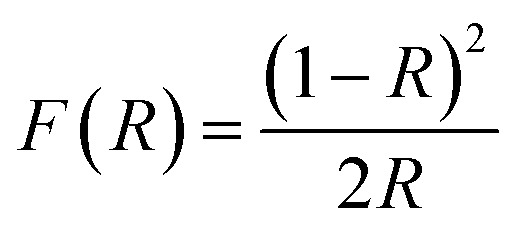 is the Kubelka–Munk equation where R is the reflectance and is equal to Rsample/Rstandard.20 The calculated band gaps for pure and Co-doped TiO2 specimens are 3.03 eV and 2.87 eV, respectively. This narrowing in the band gap emanates from substituting Ti4+ with Co2+ and the generation of oxygen vacancies, because defect states are produced in the forbidden energy gap. The introduction of new d-states close to the valence band edge may also be another reason for the reduced band gap.14,34
3.4. Dielectric constant
The variation in dielectric constant (εr) with frequency for pure and Co-doped TiO2 NPs is shown in Fig. 4(a). To facilitate the measurement of the dielectric responses and AC conductivity versus frequency, pellets (circular shaped and 9 mm in diameter) pasted with gold glue electrodes were used at 300 K, the same as in ref. 35.
Fig. 4. Variation in (a) dielectric constant, (b) dielectric loss and (c) AC conductivity with frequency for un-doped and 5 at% Co-doped TiO2 NPs.
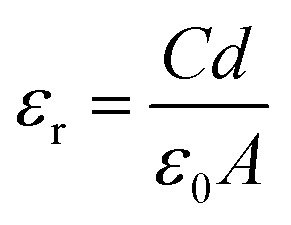
The measured capacitance was used to calculate the dielectric constant via the below equation:
 |
2 |
where C denotes the capacitance, ε0 refer to the permittivity of free space (8.85 × 10⁻¹² m−3 kg−1 s4 A2), d is the thickness of the circular-shaped sample, and A represents the pellet area, which is basically the area of the capacitor in m2.
It is observed that at low frequency, the dielectric constant is large for both specimens and gradually decreases with an increase in frequency and this behavior is in agreement with a previous report.36 Properties like space charge, electronic, ionic, and dipolar polarizations affect the dielectric properties of the material. The higher dielectric constant values at lower frequencies may be due to the simultaneous presence of interfacial polarization in all specimens. As in the case of nanoparticles, most of the atoms are situated at or near the grain boundaries, and therefore at the interface region, there are defects like vacancy clusters, oxygen vacancies, dangling bonds, etc. The charge is also trapped by grain boundaries and becomes electrically active. With the application of an external field, the charges become more concentrated at the grain boundaries and electrode surfaces, which is responsible for the larger dielectric constants at low frequency. The electronic and ionic contributions dominate at higher frequencies, while space charge polarizations are diminished. Thus, the dielectric constant decreases with an increase in frequency because dipoles lag behind the electric field, while the dielectric constant remains almost the same at high frequencies because the dipoles do not match the changing electric field.37,38
The dielectric constant for the doped TiO2 is larger than that of pure TiO2 at low frequencies, consistent with the literature.39 This enhancement in dielectric constant with Co doping at low frequencies may be due to the small grain sizes and oxygen vacancies. The particle sizes of TiO2 specimens decrease while the interface volume increases with Co doping, thereby increasing the grain boundaries and the dielectric constant. A large dielectric constant may also be due to oxygen vacancies and the appearance of defect dipoles, as reported in ref. 40. Since the valence of Co is different from that of Ti, doping TiO2 with cobalt produces some oxygen vacancies to maintain charge neutrality, such that Co-doped samples have higher oxygen vacancies. The produced vacancies donate electrons in the conduction band, and cobalt impurities accept these electrons, forming dipoles responsible for the enhanced dielectric constant in Co-doped TiO2.41
3.5. Dielectric loss
The lag between induced current and applied voltage causes a phase shift and energy dissipation in AC circuits. The changes in dielectric loss (tan δ) with frequency for both the specimens are shown in Fig. 4(b). It can be seen that the change in dielectric loss is the same as that observed for the dielectric constant, i.e., high at low frequency and decreases to a constant at high frequency. The dielectric loss is higher because of space charge polarization at lower frequencies. The Shockley–Read mechanism can adequately explain this observation, caused by capturing surface electrons by impurity ions at low frequencies. The loss at lower frequencies is slight and increases as the frequency increases until becoming constant at high frequency and decreases with further frequency increases.42 The presence of the relaxation peaks in both specimens confirms relaxing dipoles.41 The plot also shows a small loss in Co-doped TiO2 compared to pure samples.
3.6. AC conductivity
The change in AC conductivity with frequency for all fabricated specimens is shown in Fig. 4(c). The conductivity is observed to be low at low frequency and constant at a high frequency of 100 kHz before sharply increasing after 100 kHz. The hopping of charge carriers causes such a rapid increase, because the transport of charges is through the hopping of charge carriers. When the frequency increases, the conductivity increases, and charge hopping is enhanced. Fig. 4(c) also shows that at high frequency, the conductivity increases in the presence of a cobalt dopant. This effect may be due to the reduced grain size and diminished oxygen vacancies emanating from Co-doping, which increases the grain boundaries. The effect is that more charges are trapped, and conduction is enhanced.42
3.7. Ferromagnetism
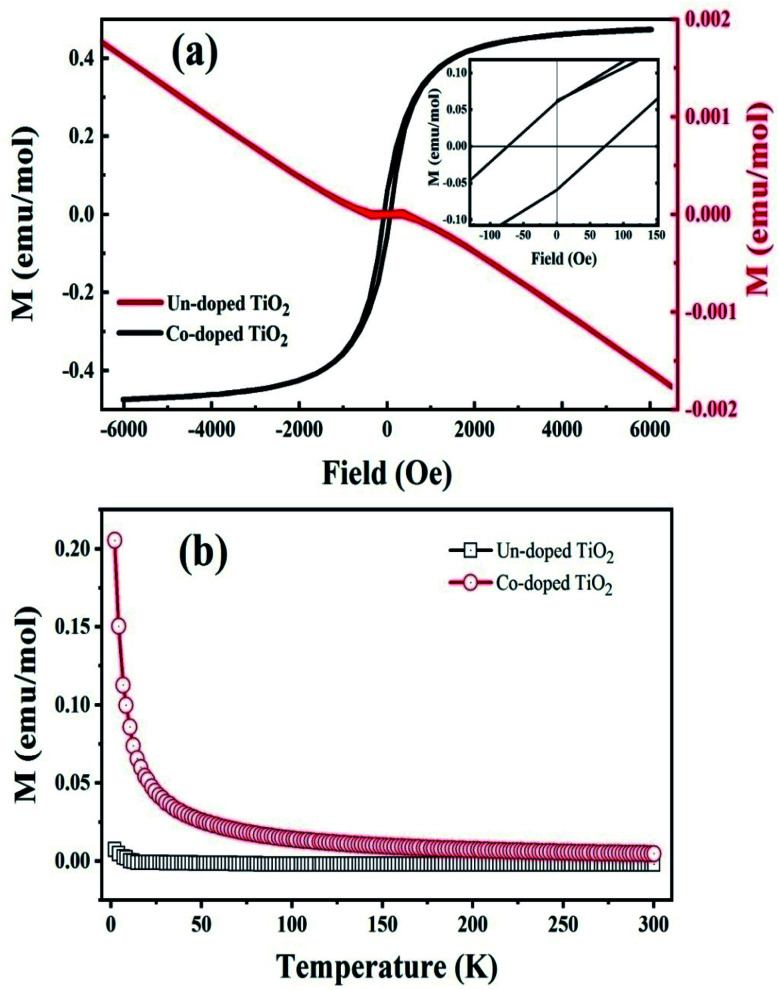
The room temperature magnetization (M–H) curve of both specimens is shown in Fig. 5(a). It is observed that pure TiO2 is diamagnetic at 300 K, whereas Co-doped TiO2 shows a ferromagnetic response. The saturation magnetization (Ms) is 0.43 emu mol−1 for the Co-doped TiO2 sample. The remanent magnetization (Mr) is 0.062 emu mol−1, and the corresponding coercive field (Hc) is 72 Oe. The displayed Mr of the Co-doped TiO2 is higher than reported.43
Fig. 5. (a) Room temperature M–H loops of the un-doped and 5 at% Co-doped TiO2 NPs. (b) Magnetization vs. temperature curves of the studied samples.
These results confirm that oxygen vacancies are not enough to produce RTFM in pure TiO2, as reported before,18 but the presence of cobalt and oxygen vacancies in the doped samples produced ferromagnetism.20 In order to balance the total charge, some O ions escape from the lattice, resulting in the creation of oxygen vacancies in the vicinity of Co doped ions.44 These oxygen-bound free carrier vacancies and the interaction between the spin of the Co ion and the trapped carriers lead to magnetization by bound magneto polarons (BMPs) in the oxygen vacancies.35,45 RTFM in oxide semiconductors can be due to BMP, which is made of magnetic cations, oxygen vacancies, and charge carriers.20 Trapping electrons in oxygen vacancies are created when Co2+ substitutes Ti4+; hence, more MBPs are formed. This phenomenon causes an increase in F-centers and enhanced exchange interaction with magnetic moments of impurity atoms, thereby inducing ferromagnetism.46
In order to further explain the magnetic behavior in Co-doped TiO2, we studied the temperature-dependent magnetization (M–T) measurements as shown in Fig. 5(b). The M–T curve shows that pure TiO2 has a negative magnetic moment in the considered range, proving a diamagnetic behavior. The plot also indicates that the magnetic moment value for the Co-doped TiO2 is higher at smaller temperatures, and rapidly decreased with temperature. Such higher magnetic moment values at lower temperatures are due to induced unidirectional magnetization of isolated cobalt ions in the specimen.47
3.8. Photocatalytic activity
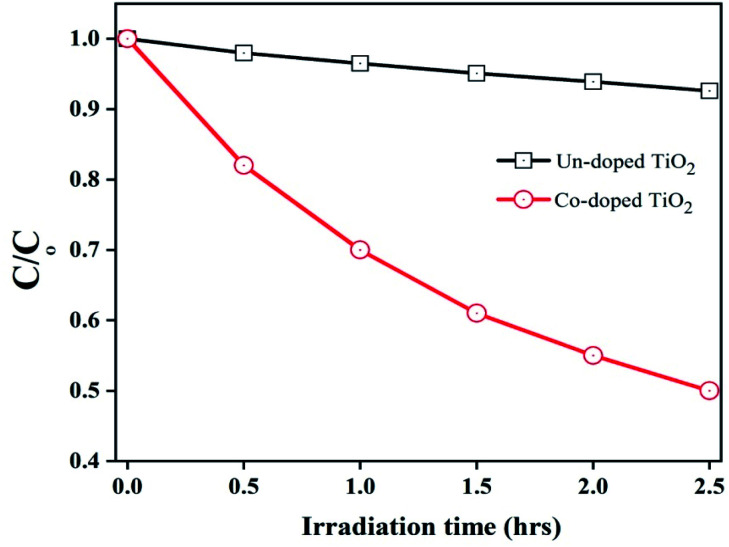
Degradation of organic pollutant 2,4-dichlorophenol (2,4-DCP) at room temperature under visible light irradiation was used to determine the photocatalytic activity of the pure and Co-doped TiO2 samples. This was achieved by adding 0.1 g of each specimen to the organic pollutant (10 mg L−1; 80 mL) with agitation in the absence of light for 30 minutes to realize adsorption–desorption equilibrium. Then after 1 h, the suspension was exposed to Vis-light (150 W Xe-lamp) irradiation, and then specimens were collected at regular intervals and tested in Model Shimadzu UV-2550 equipment. The photocatalytic activity of the pure TiO2 and Co-doped TiO2 specimens is depicted in Fig. 6.
Fig. 6. Photocatalytic degradation of 2,4-DCP using pure and 5 at% Co-doped TiO2 NPs.
Fig. 6 illustrates that Co-doped TiO2 showed enhanced photocatalytic activity compared to undoped TiO2. A comparison of the photocatalytic activity for 2,4-DCP of different photocatalysts with the present work is tabulated in Table 1.
Comparison of the photocatalytic activity for 2,4-DCP using different photocatalysts.
The three main factors controlling the photocatalytic activity are visible light absorption capability, recombination of photo-generated charges, and surface area of the photocatalysts.26 It can be seen that pure TiO2 shows deficient photocatalytic activity under visible-light irradiation. This is due to a wider band gap (low visible light absorbance) because the electron–hole (e−/h+) pairs cannot be photo-generated under visible-light irradiation. Nevertheless, its photocatalytic activity is momentously improved after doping with cobalt. This increase is mainly caused by the extended visible light response, efficient charge separation, and high surface area of the particles.26,51 The appearance of the rutile phase in the specimen is also responsible for the enhanced photocatalytic activity of the Co-doped TiO2.52 Thus, the fraction of rutile phase is also responsible for the excellent photocatalytic activity of the Co-doped TiO2.
4. Conclusions
Pure and 5 at% Co-doped TiO2 NP specimens were fabricated using a co-precipitation method. The specimens were then calcined at 600 °C, followed by characterization. XRD confirmed the tetragonal anatase structure in pure TiO2; additionally, two minor peaks belonging to the rutile phase appeared in Co-doped TiO2. The calculated crystallite size was 29.64 nm and 15.41 nm for pure and Co-doped specimens. TEM images showed that the nanoparticles were spherical, and the particle size decreased with Co-inclusion. The optical and band gap results were obtained using UV-vis DRS. The results showed that the maximum absorption shifted towards a longer wavelength in the presence of the cobalt dopant. The bandgap was narrowed in the presence of the cobalt dopant and was 3.03 eV for pure TiO2 and 2.87 eV for the cobalt-doped specimens. Dielectric measurements showed that the dielectric constant and AC conductivity increase in the presence of the cobalt dopant in the TiO2 matrix. VSM was used to obtain magnetic information of the specimens. Using M–H and M–T curves, the results revealed that pure TiO2 particles are diamagnetic, while Co-doped specimens are ferromagnetic. The ferromagnetism in Co-doped TiO2 is due to the Co incorporation in the lattice and the generation of oxygen vacancies. Vis-light irradiation was used to study the photocatalytic activity, showing that Co-doping improves the photocatalytic activity due to the efficiency of charge separation and reasonable response to visible light. The results show that Co-doped TiO2 diluted magnetic semiconductors may be a potential candidate for spintronics and photocatalytic applications.
Funding
This work was financially supported by Taif University with Project number (TURSP-2020/228), Taif University, Taif, Saudi Arabia.
Author contributions
Akif Safeen, Kashif Safeen, Rehan Ullah, Zulfqar, Wiqar H Shah, Quaid Zaman, Khaled Althubeiti and Sattam Al Otaibi handled the text of this paper and the formatting of this paper. Nasir Rahman, Shahid Iqbal, Alamzeb Khan, Aurangzeb Khan and Rajwali Khan prepared the concept for the paper and did the experimental work for the paper. All authors have read and agreed to the published version of the manuscript. Finally this whole paper submission was handled by Dr Rajwali Khan and Quaid Zaman.
Conflicts of interest
The authors declare that they have no known competing financial interests or personal relationships that could have influenced the work reported in this paper.
Supplementary Material
Acknowledgments
Authors thanks Taif University Researchers Supporting Project number (TURSP-2020/228), Taif University, Taif, Saudi Arabia.
References
- Ghamsari M. S. Radiman S. Hamid M. A. A. Mahshid S. Rahmani S. Room temperature synthesis of highly crystalline TiO2 nanoparticles. Mater. Lett. 2013;92:287–290. doi: 10.1016/j.matlet.2012.10.032. [DOI] [Google Scholar]
- Nwankwo U. Bucher R. Ekwealor A. Khamlich S. Maaza M. Ezema F. I. Synthesis and characterizations of rutile-TiO2 nanoparticles derived from chitin for potential photocatalytic applications. Vacuum. 2019;161:49–54. doi: 10.1016/j.vacuum.2018.12.011. [DOI] [Google Scholar]
- Praveen P. Viruthagiri G. Mugundan S. Shanmugam N. Sol–gel synthesis and characterization of pure and manganese doped TiO2 nanoparticles–a new NLO active material. Spectrochim. Acta, Part A. 2014;120:548–557. doi: 10.1016/j.saa.2013.12.006. [DOI] [PubMed] [Google Scholar]
- Mugundan S. Rajamannan B. Viruthagiri G. Shanmugam N. Gobi R. Praveen P. Synthesis and characterization of undoped and cobalt-doped TiO2 nanoparticles via sol–gel technique. Appl. Nanosci. 2015;5:449–456. doi: 10.1007/s13204-014-0337-y. [DOI] [Google Scholar]
- Rahimi N. Pax R. A. Gray E. M. Review of functional titanium oxides. I: TiO2 and its modifications. Prog. Solid State Chem. 2016;44:86–105. doi: 10.1016/j.progsolidstchem.2016.07.002. [DOI] [Google Scholar]
- Gupta S. M. Tripathi M. A review of TiO2 nanoparticles. Chin. Sci. Bull. 2011;56:1639–1657. doi: 10.1007/s11434-011-4476-1. [DOI] [Google Scholar]
- Behnajady M. A. Eskandarloo H. Preparation of TiO2 nanoparticles by the sol–gel method under different pH conditions and modeling of photocatalytic activity by artificial neural network. Res. Chem. Intermed. 2015;41:2001–2017. doi: 10.1007/s11164-013-1327-5. [DOI] [Google Scholar]
- Dharma H. N. C. Jaafar J. Widiastuti N. Othman M. H. D. A Review of Titanium Dioxide (TiO2)-Based Photocatalyst for Oilfield-Produced Water Treatment. Membranes. 2022;12:345. doi: 10.3390/membranes12030345. [DOI] [PMC free article] [PubMed] [Google Scholar]
- Buraso W. Lachom V. Siriya P. Laokul P. Synthesis of TiO2 nanoparticles via a simple precipitation method and photocatalytic performance. Mater. Res. Express. 2018;5:115003. doi: 10.1088/2053-1591/aadbf0. [DOI] [Google Scholar]
- Chen D. Jiang Z. Jiang J. Wang Q. Yang D. Carbon and nitrogen co-doped TiO2 with enhanced visible-light photocatalytic activity. Ind. Eng. Chem. Res. 2017;46:2741–2746. doi: 10.1021/ie061491k. [DOI] [Google Scholar]
- Bengtsson N. Castellote M. López-Muñoz M.J. Cerro L. Preparation of Co-doped TiO2 for photocatalytic degradation of NOx in air under visible light. J. Adv. Oxid. Technol. 2009;12:55–64. [Google Scholar]
- Dorraj M. Goh B. T. Sairi N. A. Woi P. M. Basirun W. J. Improved visible-light photocatalytic activity of TiO2 co-doped with copper and iodine. Appl. Surf. Sci. 2018;439:999–1009. doi: 10.1016/j.apsusc.2017.12.248. [DOI] [Google Scholar]
- Avilés-García O. Romero-Romero R. Rico-Cerda J. L. Arroyo-Albiter M. Solís-Casados D. A. Natividad-Rangel R. Enhanced photocatalytic activity of titania by co-doping with Mo and W. Catalysts. 2018;8:631. doi: 10.3390/catal8120631. [DOI] [Google Scholar]
- Khurana C. Pandey O. Chudasama B. Synthesis of visible light-responsive cobalt-doped TiO2 nanoparticles with tunable optical band gap. J. Sol-Gel Sci. Technol. 2015;75:424–435. doi: 10.1007/s10971-015-3715-3. [DOI] [Google Scholar]
- Wang T. Liu g. Kang Q. Ouyang S. In situ synthesis of ordered mesoporous Co-doped TiO2 and its enhanced photocatalytic activity and selectivity for the reduction of CO2. J. Mater. Chem. A. 2015;3:9491–9501. doi: 10.1039/C4TA05892E. [DOI] [Google Scholar]
- Chanda A. Rout K. Vasundhara M. Structural and magnetic study of undoped and cobalt doped TiO2 nanoparticles. RSC Adv. 2018;8:10939–10947. doi: 10.1039/C8RA00626A. [DOI] [PMC free article] [PubMed] [Google Scholar]
- Janisch R. Gopal P. Spaldin N.A. Transition metal-doped TiO2 and ZnO—present status of the field. J. Phys.: Condens. Matter. 2005;17:R657. doi: 10.1088/0953-8984/17/27/R01. [DOI] [Google Scholar]
- Pereira L. Nunes M. Monteiro O. Magnetic properties of Co-doped TiO2 anatase nanopowders. Appl. Phys. Lett. 2008;93:222502. doi: 10.1063/1.3036534. [DOI] [Google Scholar]
- Rana A. K. Kumar Y. Rajput P. Bhattacharyya D. Search for origin of room temperature ferromagnetism properties in Ni-doped ZnO nanostructure. ACS Appl. Mater. Interfaces. 2017;9:7691–7700. doi: 10.1021/acsami.6b12616. [DOI] [PubMed] [Google Scholar]
- Santara B. Pal B. Giri P. Signature of strong ferromagnetism and optical properties of Co doped TiO2 nanoparticles. J. Appl. Phys. 2011;110:114322. doi: 10.1063/1.3665883. [DOI] [Google Scholar]
- Safeen K. Micheli V. Bartali R. Gottardi G. Safeen A. Ullah H. Laidani N. Structural phase-dependent resistivity of intrinsic-extrinsic co-doped transparent titanium dioxide films. Mater. Sci. Semicond. Process. 2017;72:99–105. doi: 10.1016/j.mssp.2017.09.037. [DOI] [Google Scholar]
- Safeen K. Micheli K. Safeen A. Laidani N. Synthesis of Nb-doped TiO2 films on rigid and flexible substrates at low temperature. Mod. Phys. Lett. B. 2019;33:1950313. doi: 10.1142/S0217984919503135. [DOI] [Google Scholar]
- Safeen K. Micheli V. Bartali R. Gottardi G. Safeen A. Ullah H. Laidani N. Synthesis of conductive and transparent Nb-doped TiO2 films: role of the target material and sputtering gas composition. Mater. Sci. Semicond. Process. 2017;66:74–80. doi: 10.1016/j.mssp.2017.04.012. [DOI] [Google Scholar]
- Trotochaud L. Boettcher S. W. Synthesis of Rutile-Phase Snx Ti1–x O2 Solid-Solution and (SnO2)x/(TiO2)1–x Core/Shell Nanoparticles with Tunable Lattice Constants and Controlled Morphologies. Chem. Mater. 2011;23:4920–4930. doi: 10.1021/cm201737x. [DOI] [Google Scholar]
- Safeen A. Safeen K. Shafique M. Ahmed N. Asghar G. Iqbal Y. The effect of Mn and Co dual-doping on the structural, optical, dielectric and magnetic properties of ZnO nanostructures. RSC Adv. 2022;12:11923–11932. doi: 10.1039/D2RA01798A. [DOI] [PMC free article] [PubMed] [Google Scholar]
- El Mragui A. Logvina Y. Zegaoui O. Esteves da Silva J. C. Synthesis of Fe-and Co-doped TiO2 with improved photocatalytic activity under visible irradiation toward carbamazepine degradation. Materials. 2019;12:3874. doi: 10.3390/ma12233874. [DOI] [PMC free article] [PubMed] [Google Scholar]
- Asghar G. Asri S. Tariq G. H. Safeen A. Anis-ur-Rehman M. Enhanced magnetic properties of barium hexaferrite. J. Electron. Mater. 2020;49:4318–4323. doi: 10.1007/s11664-020-08125-7. [DOI] [Google Scholar]
- Safeen K. Micheli V. Gottardi G. Safeen A. Laidani N. Influence of intrinsic defects on the electrical and optical properties of TiO2: Nb films sputtered at room temperature. Thin Solid Films. 2018;645:173–179. doi: 10.1016/j.tsf.2017.10.028. [DOI] [Google Scholar]
- Safeen K. Micheli V. Gottardi G. Laidani N. Low temperature growth study of nano-crystalline TiO2 thin films deposited by RF sputtering. J. Phys. D: Appl. Phys. 2015;48:295201. doi: 10.1088/0022-3727/48/29/295201. [DOI] [Google Scholar]
- Shao Y. Tang D. Sun J. Lee Y. Xiong W. Lattice deformation and phase transformation from nano-scale anatase to nano-scale rutile TiO2 prepared by a sol-gel technique. China Particuol. 2004;2:119–123. doi: 10.1016/S1672-2515(07)60036-0. [DOI] [Google Scholar]
- Barakat M. Hayes G. Shah S. I. Effect of cobalt doping on the phase transformation of TiO2 nanoparticles. J. Nanosci. Nanotechnol. 2005;5:759–765. doi: 10.1166/jnn.2005.087. [DOI] [PubMed] [Google Scholar]
- Kite S. V. Kadam A. N. Sathe D. J. Hong S. S. Garadkar K. M. Nanostructured TiO2 sensitized with MoS2 nanoflowers for enhanced photodegradation efficiency toward methyl orange. ACS Omega. 2021;6:17071–17085. doi: 10.1021/acsomega.1c02194. [DOI] [PMC free article] [PubMed] [Google Scholar]
- Sadanandam G. Lalitha K. Shankar M. V. Subrahmanyam M. Cobalt doped TiO2: A stable and efficient photocatalyst for continuous hydrogen production from glycerol: Water mixtures under solar light irradiation. Int. J. Hydrogen Energy. 2013;38:9655–9664. doi: 10.1016/j.ijhydene.2013.05.116. [DOI] [Google Scholar]
- Jin Q. Nie C. Shen Q. Xu Y. Nie Y. Cobalt and sulfur co-doped TiO2 nanostructures with enhanced photo-response properties for photocatalyst. Funct. Mater. Lett. 2017;10:1750061. doi: 10.1142/S1793604717500618. [DOI] [Google Scholar]
- Zubair M. Khan A. Ilyas N. Safeen M. A. Khan R. Oxygen vacancies induced room temperature ferromagnetism and enhanced dielectric properties in Co and Mn co-doped ZnO nanoparticles . Mater. Sci.: Mater. Electron. 2021;32:9463–9474. [Google Scholar]
- Mangrola M. Joshi M. Parmar B. Optical and dielectric properties of the Cobalt doped TiO2 nanoparticles. Proc. Int. J. Modern Phys.: Conf. Ser. 2013:332–335. [Google Scholar]
- Malik A. Hameed S. Haque M. Muneer M. Influence of ce doping on the electrical and optical properties of TiO2 and its photocatalytic activity for the degradation of remazol brilliant blue R. Int. J. Photoenergy. 2013;2013 doi: 10.1155/2013/768348. [DOI] [Google Scholar]
- Kumar A. Kashyap M. K. Sabharwal N. Asokan K. Impedance analysis and dielectric response of anatase TiO2 nanoparticles codoped with Mn and Co ions. Mater. Res. Express. 2017;4:115035. doi: 10.1088/2053-1591/aa99ca. [DOI] [Google Scholar]
- Chao S. Dogan F. Effects of manganese doping on the dielectric properties of titanium dioxide ceramics. J. Am. Ceram. Soc. 2011;94:179–186. doi: 10.1111/j.1551-2916.2010.04039.x. [DOI] [Google Scholar]
- Khan R. de Araujo C. I. L. Khattak S. A. Safeen K. Safeen A. Effect of thermal calcination on the structural, dielectric and magnetic properties of (ZnO–Ni) semiconductor. J. Mater. Sci.: Mater. Electron. 2019;30:3396–3404. doi: 10.1007/s10854-018-00613-1. [DOI] [Google Scholar]
- Abdul Gafoor A. Thomas J. Pradyumnan P. Effects of Sm3+ doping on dielectric properties of anatase TiO2 nanoparticles synthesized by a low-temperature hydrothermal method. J. Electron. Mater. 2011;40:2152–2158. doi: 10.1007/s11664-011-1707-9. [DOI] [Google Scholar]
- Mehraj S. Ansari M. S. Rutile-type Co doped SnO2 diluted magnetic semiconductor nanoparticles: structural, dielectric and ferromagnetic behavior. Phys. B. 2013;430:106–113. doi: 10.1016/j.physb.2013.08.024. [DOI] [Google Scholar]
- Sangaletti L. Mozzati M. Galinetto P. Azzoni C. Speghini A. Bettinelli M. Calestani G. Ferromagnetism on a paramagnetic host background: the case of rutile TM: TiO2 single crystals (TM = Cr, Mn, Fe, Co, Ni, Cu) J. Phys.: Condens. Matter. 2006;18:7643. doi: 10.1088/0953-8984/18/32/012. [DOI] [PubMed] [Google Scholar]
- Lin Y. Jiang D. Lin F. Ma W. Fe-doped ZnO magnetic semiconductor by mechanical alloying. J. Alloys Compd. 2007;436:30–33. doi: 10.1016/j.jallcom.2006.07.011. [DOI] [Google Scholar]
- Jabbar I. Diluted magnetic semiconductor properties in TM doped ZnO nanoparticles. RSC Adv. 2022;12:13456–13463. doi: 10.1039/D2RA01210C. [DOI] [PMC free article] [PubMed] [Google Scholar]
- Khan Rajwali. The structural and dilute magnetic properties of (Co, Li) co‑doped‑ZnO semiconductor nanoparticles. MRS Commun. 2022;12:154–159. doi: 10.1557/s43579-022-00153-0. [DOI] [Google Scholar]
- R. Khan. Structure and magnetic properties of (Co, Ce) co-doped ZnO-based diluted magnetic semiconductor nanoparticles. J. Mater. Sci.: Mater. Electron. 2021;32:24394–24400. doi: 10.1007/s10854-021-06912-4. [DOI] [Google Scholar]
- Jian` Z. Photocatalytic degradation of 2, 4-dichlorophenol using nanosized Na2Ti6O13/TiO2 heterostructure particles. Int. J. Photoenergy. 2019;11:2019. [Google Scholar]
- Ai M. Photocatalytic degradation of 2, 4-Dichlorophenol by TiO2 intercalated talc nanocomposite. Int. J. Photoenergy. 2019;11:2019. [Google Scholar]
- Mohammadi M. Photo-catalytic degradation of 2, 4-DCP wastewater using MWCNT/TiO2 nano-composite activated by UV and solar light. Environ. Nanotechnol., Monit. Manage. 2014;1:24–29. [Google Scholar]
- Pirbazaria A. E. Co/TiO2 nanoparticles: Preparation, characterization and its application for photocatalytic degradation of methylene blue. Desalin. Water Treat. 2017;63:283–292. doi: 10.5004/dwt.2017.20205. [DOI] [Google Scholar]
- Choi J. Effects of single metal-ion doping on the visible-light photoreactivity of TiO2. J. Phys. Chem. C. 2010;114:783–792. doi: 10.1021/jp908088x. [DOI] [Google Scholar]


