
Extended Data Fig. 7 |. Levels of BA metabolites detected in the HMP2 cohort.
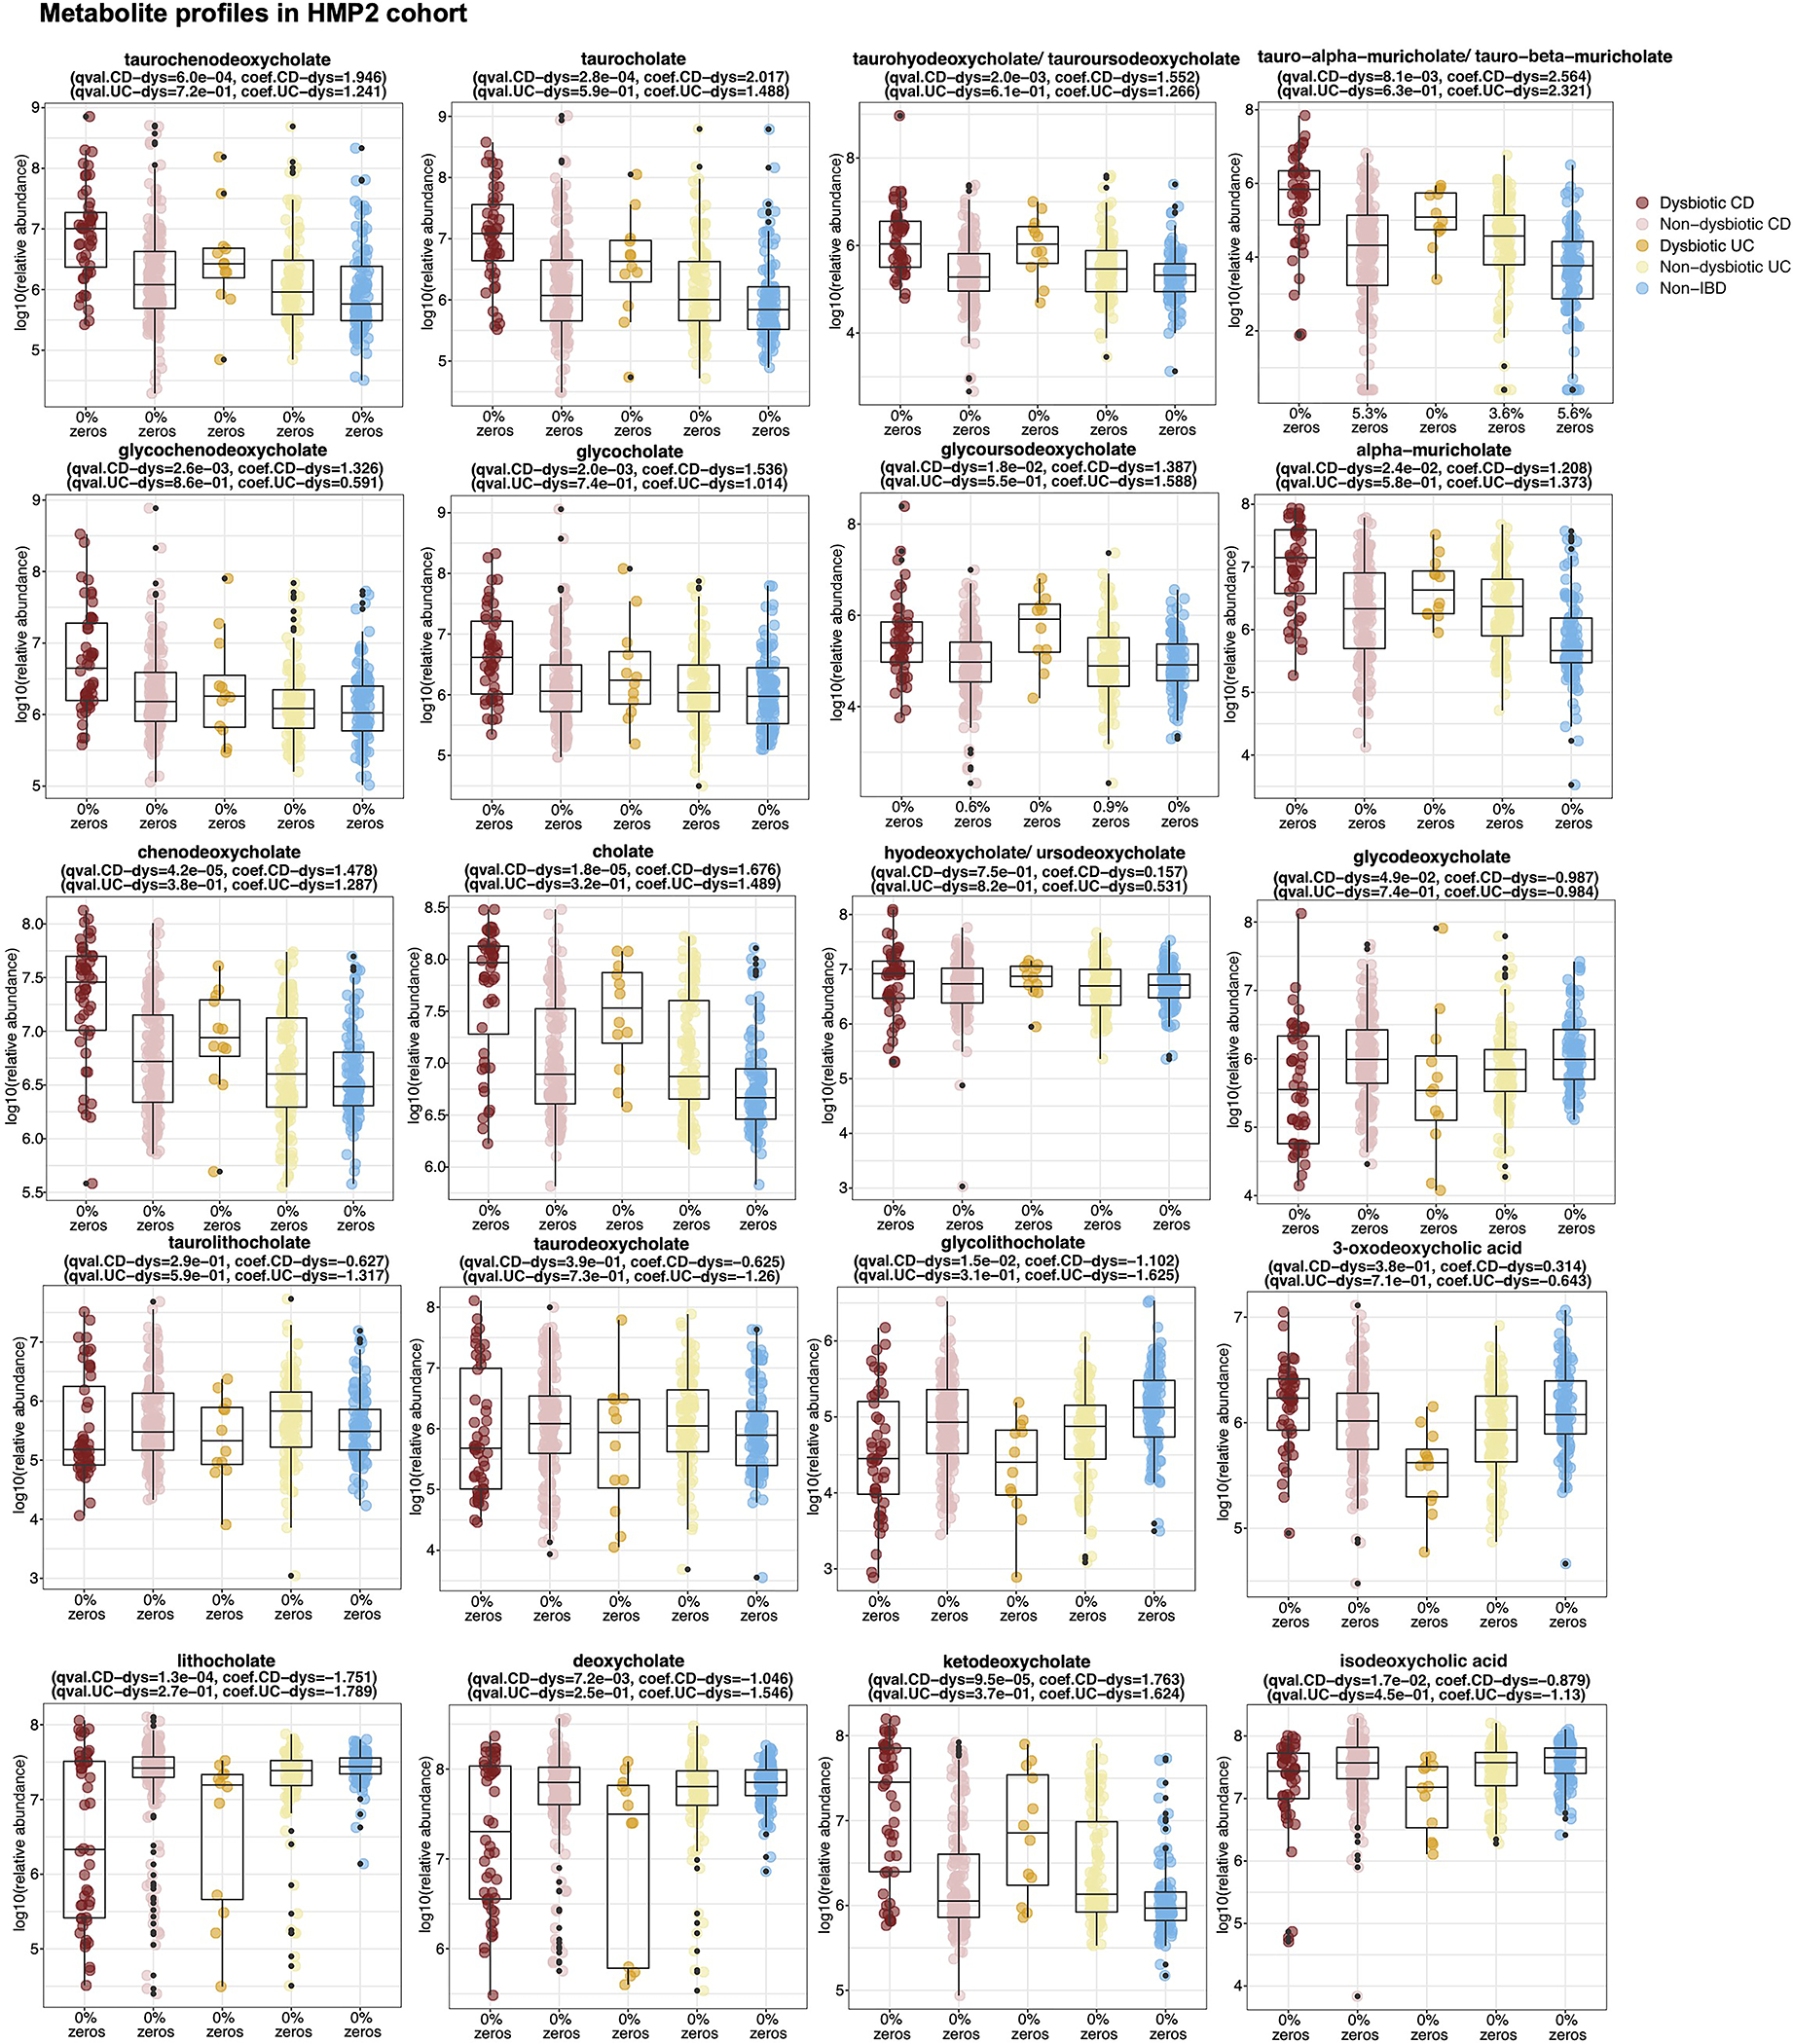
Abundances of identifiable BAs in HMP2 cohort. BA levels were not universally decreased in dysbiotic CD patients, indicating that decreased levels of LCA, 3-oxoLCA, and isoLCA were not due to lower levels of all BAs in these cohorts. Boxplots show median and lower/upper quartiles with outliers outside of boxplot ‘whiskers’ (indicating the inner fences of the data). n=47 for dysbiotic CD, n = 169 for non-dysbiotic CD, n=12 for dysbiotic UC, n=110 for non-dysbiotic UC and n=122 for non-IBD. The percentage of zeros in each condition are added as x-axis tick labels. See Table S6 for full results.