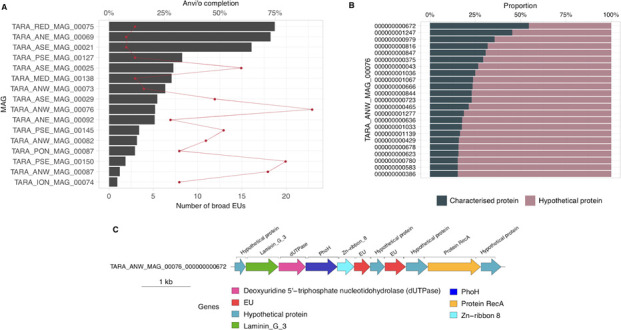
Appendix 10—figure 1. Broadly distributed EU mapping on TARA MAGs results.

(A) . Histogram of TARA MAG percent completeness (checkM). The red line represents the number of EU found in the MAGs. (B) Contigs from TARA MAGs TARA_ANW_MAG_00076 in descending order of highest proportion of non-hypothetical gene content. (C) EU communities in the context of a MAG contig. Contig genomic neighborhood around two potential EU communities.
