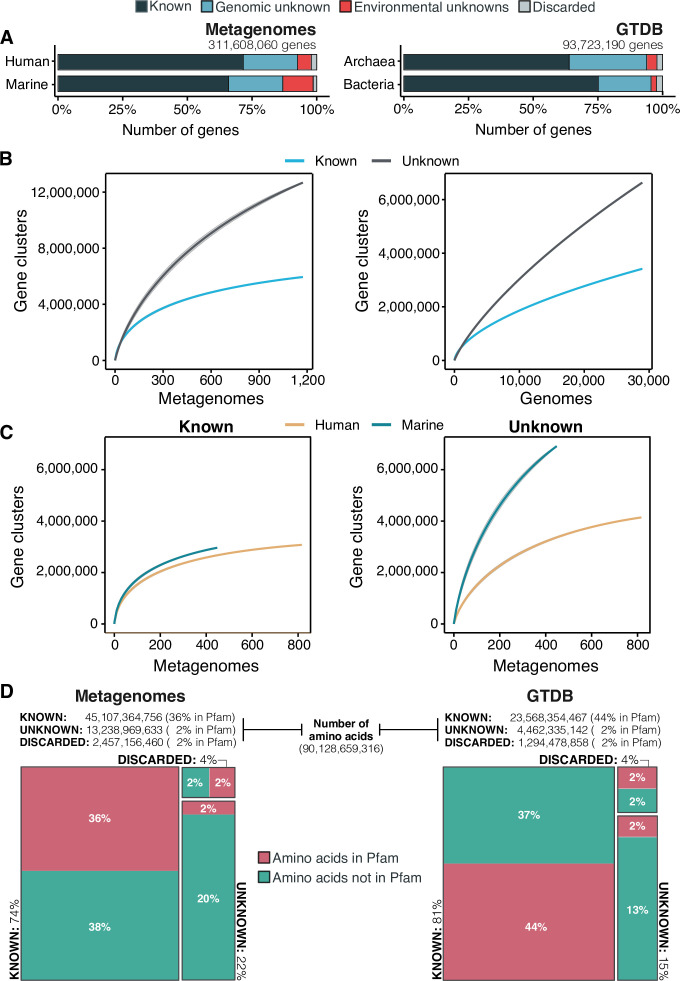
Figure 3. The extent of the known and unknown sequence space.
(A) Proportion of genes in the known and unknown. (B) Accumulation curves for the known and unknown sequence space at the GC- level for the metagenomic and genomic data. from TARA, MALASPINA, OSD2014 and HMP-I/II projects. (C) Collector curves comparing the human and marine biomes. Colored lines represented the mean of 1000 permutations and shaded in gray the standard deviation. Non-abundant singleton clusters were excluded from the accumulation curves calculation. (D) Amino acid distribution in the known and unknown sequence space. In all cases, the four categories have been simplified as known (K, KWP) and unknown (GU, EU).

