Abstract
DNA-PAINT is a powerful super-resolution microscopy method that can acquire high-fidelity images at nanometer resolution. It suffers, however, from high background and slow imaging speed, both of which can be attributed to the presence of unbound fluorophores in solution. Here we present 2-color fluorogenic DNA-PAINT which uses improved imager probe and docking strand designs to solve these problems. These self-quenching ssDNA probes are conjugated with a fluorophore and quencher at the terminals, which permits an increase in fluorescence by up to 57-fold upon binding and unquenching. In addition, the engineering of base pair mismatches between the fluorogenic imager probes and docking strands allowed us to achieve both high fluorogenicity and the fast binding kinetics required for fast imaging. We demonstrate a 26-fold increase in imaging speed over regular DNA-PAINT and show that our new implementation enables 3D super-resolution DNA-PAINT imaging without optical sectioning.
Keywords: Nanoscopy, super-resolution, single-molecule localization, single-molecule switching
Editor’s summary
2-color fluorogenic DNA-PAINT introduces self-quenching, kinetics-optimized probe designs. This approach improves imaging speed by 26-fold and eliminates the need for optical sectioning.
Introduction
Single-molecule localization microscopy (SMLM) has become an invaluable tool in biological research, revealing subcellular structure and function at ten or more times the resolution of conventional fluorescence microscopy 1. Among SMLM techniques, DNA-based points accumulation for imaging nanoscale topography (DNA-PAINT) microscopy is becoming increasingly popular because of the high-quality images that can be obtained with relative ease 2–5. DNA-PAINT, in contrast to the other techniques, does not rely on light to switch fluorescent molecules between ‘visible’ and ‘invisible’ states 2. Instead, it takes advantage of transient DNA binding to achieve the same switching or ‘blinking’ effect. Single-stranded DNA (ssDNA) ‘docking strands’ attached to a biological structure of interest are individually highlighted as they capture an ‘imager probe’, a complementary ssDNA molecule linked to a fluorophore, from a diffusing pool.
There are several advantages to this approach: (1) Binding-based blinking frequency is proportional to the imager probe concentration and is therefore easily adjustable (see Suppl. Note 2) 2. (2) Fluorophores and buffers are not limited to those suitable for photophysical blinking and can be chosen to allow for maximum brightness and thereby best localization precision 2, 6. (3) DNA-PAINT is robust against photobleaching as bleached probes are replenished from the large reservoir of probes in solution 5. (4) Sequential multiplex imaging is possible with the use of multiple pairs of orthogonal imager/docking strands 7. (5) DNA-PAINT can take advantage of the powerful toolbox available for in vitro DNA technology, for example creating libraries of fluorescence in situ hybridization (FISH) probes for OligoDNA-PAINT 4, using photoreactive nucleosides for Action-PAINT 8, or labeling via click-chemistry reactions 9.
However, the use of transient chemical binding-based switching is also responsible for the greatest weakness of DNA-PAINT: unbound imager probes can contribute massive amounts of background fluorescence, which drowns out the signal peaks of individual bound probe molecules. To minimize background, early DNA-PAINT realizations therefore relied on low probe concentrations and the use of total internal reflection fluorescence (TIRF) to minimize illumination volume 10. Consequently, DNA-PAINT was limited to imaging regions within a few hundred nanometers of the coverslip. Using a spinning disk confocal microscope, regions deeper in a cell could be imaged, but at the cost of a compromise in resolution, caused by lower detected photon numbers per blinking event 11. The constraint on probe concentration to typically less than 5 nM also limits the number of blinking events per second, leading to slow imaging speeds. This problem can be mitigated to some extent by increasing the rate constant of an imager probe binding a docking strand, kON, as recently demonstrated 12, 13. While these publications showed super-resolution images acquired in minutes instead of hours, they still required TIRF to keep background low.
None of these approaches, however, solve another background-related problem: at high camera frame rates, as required for fast imaging, exposures are so short that unbound molecules are no longer blurred by diffusion. These molecules will appear as local fluctuations in background and, at worst, erroneous binding events.
To address both background-related issues requires a reduction in the molecular brightness of the diffusing unbound probes. Recently, two groups introduced Förster resonance energy transfer (FRET)-based DNA-PAINT to achieve this effect 14–16. Donor and acceptor fluorophores were conjugated to separate imager probes; only when they coincidentally bind to the same docking strand will donor excitation lead to acceptor emission (Fig. 1aii). Unfortunately, the demonstrated localization precision was substantially worse than for regular DNA-PAINT, failing the ‘gold standard’ of resolving the hollow center of labeled microtubules. This reduction in image quality can be attributed to FRET DNA-PAINT being fundamentally limited by the trade-off between maximizing energy transfer efficiency for bright blinking events and minimizing excitation and emission crosstalk to reduce background.
Figure 1. Imager probes for DNA-PAINT.
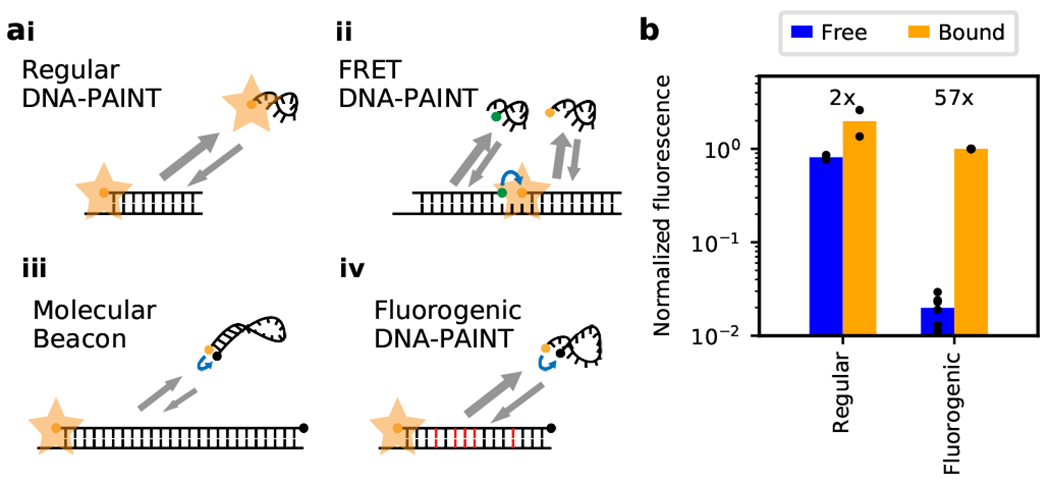
(a) Comparison of different DNA-PAINT imager probe / docking strand systems: (i) Imager probe for regular DNA-PAINT is always fluorescent and contributes to high background. (ii) In FRET DNA-PAINT, acceptor fluorescence is only observed when both donor- and acceptor-conjugated probes are bound to the docking strand. (Energy transfer indicated by blue arrows.) (iii) Regular molecular beacons are fluorogenic but their binding on- and off-rates are too slow for DNA-PAINT. (iv) Our DNA-PAINT probes are fluorogenic and have fast binding kinetics due to the absence of a stem secondary structure and mismatches between the probe and docking sequences (shown in red). (b) Comparison of fluorescence between a regular imager probe (Cy3B) and our fluorogenic imager probe (Cy3B and BHQ-2; imager probe A) in solution. In their unbound ssDNA state, the fluorogenic probe is less than 2.5% as bright as the regular probe (2.4% ± 0.8%; two-sided two-sample t-test of normalized fluorescence, t-statistic=37, p<0.001, nsample=8). On binding to their complementary docking strand, its fluorescence increases 57-fold, compared to a 2.4-fold increase for the regular probe (56.6 ± 20.3 vs 2.4 ± 0.6; two-sided two-sample unequal variance t-test, t-statistic=6, p=0.002, nsample=8).
High background fluorescence therefore remains a substantial problem in DNA-PAINT and severely limits its application: it has not yet been possible to image whole cells in 3D using DNA-PAINT without optical sectioning. Even with optical sectioning, compromises are made between quality and speed, requiring either imaging for hours at low probe concentration to acquire high-quality DNA-PAINT images or for minutes at high probe concentration at the risk of undersampling, resolution loss, the introduction of artifacts from too many molecules blinking at once and high, inhomogeneous background.
In this study, we improved upon current designs in imager probe and docking strands to develop fluorogenic DNA-PAINT. We show a 26-fold increase in imaging speed by imaging DNA origami nanostructures and immunolabelled microtubules. 3D super-resolution images of microtubules and mitochondria acquired throughout whole mammalian cells demonstrate that fluorogenic DNA-PAINT does not require optical sectioning. We further present the development of two orthogonal sets of imager probes and docking strands which allowed us to perform simultaneous 2-color fluorogenic DNA-PAINT imaging.
Results
Imager probe and docking strand design
Here we introduce fluorogenic DNA-PAINT to overcome these limitations. Our implementation is based on modifications in the design of the imager probe and docking strand so that the probe is dark when in solution and bright when bound to a docking strand, while still achieving fast binding kinetics required for fast image acquisition (Suppl. Notes 3). This development enables us to perform high-quality DNA-PAINT imaging without compulsory optical sectioning. It also allows us to substantially increase the probe concentration and record blinking events at 100 frames per second (fps), with negligible compromises in localization precision.
Our goal was to implement fluorogenic DNA-PAINT without sacrificing the many benefits of regular DNA-PAINT. To maintain resilience against photodamage, any photosensitive component should reside solely in the probes so that any damaged probes can be quickly replaced. Furthermore, a single probe system would be desirable to keep binding kinetics simple and avoid the need to titrate probe ratios.
At first glance, molecular beacons (Fig. 1aiii) might serve this purpose as they are highly fluorogenic 17. However, their fluorogenicity is maximized by sacrificing binding kinetics which makes them incompatible with DNA-PAINT. They have a slow binding on-rate as they are stabilized with a stem-loop in their unbound state (~5 bp, kON < 104 M−1s−1), and have an effectively zero off-rate after binding their target (> 15 bp, off-rate << 1 s−1) 18. FRET DNA-PAINT provided an interesting mechanism for a pseudo-fluorogenic effect based on spectral shift where acceptor fluorescence emission is only observed upon probe binding 14, 16. While faster binding kinetics can be achieved compared with molecular beacons, their fluorogenicity is limited due to FRET inefficiency and fluorophore crosstalk. To avoid these pitfalls, we developed fluorogenic DNA-PAINT based on self-quenching imager probes and partially mismatched docking strands to achieve both high fluorogenicity and fast binding kinetics (Fig. 1aiv).
Our probes, similar to molecular beacons, are conjugated with a fluorophore and a quencher at the terminals (Ext. Data Fig. 1). Unbound ssDNA is highly flexible which allows the fluorophore and quencher to be in close proximity and results in strong quenching. In contrast, when bound to its complementary strand, the resulting dsDNA takes the form of a rigid double helix and the terminals are spatially separated to minimize quenching. This effect requires a long stretch of a rigid probe of about 15 or more bases (0.34 nm per base along helical axis versus a Förster radius between the quencher and fluorophore of ~6 nm) 19. However, this conflicts with our need to achieve high off-rates for fast DNA-PAINT imaging, which demands 10 or less complementary base pairs between the imager probe and docking strand. We solved this dilemma by designing docking strand sequences with internal mismatches against a long 15-bases imager probe which destabilize the binding for a faster off-rate (Ext. Data Fig. 2). The second probe we designed in this manner was further optimized by selecting an effective contact quencher to further mitigate the need for a long probe (imager probe B; ATTO 643 / Iowa Black FQ). Additionally, the probes were designed without a self-complementary sequence (or ‘stem’ in molecular beacons) to avoid stabilizing the free imager probes in their quenched form 18.
The biggest advantage of using DNA for PAINT is that oligonucleotides are highly programable and their secondary structures, based on complementary base pairing, are predictable. To select suitable docking strands, we employed computational screening based on a number of predicted parameters (Biopython 20 and NUPACK 21; see Suppl. Note 3 and Suppl. Table 3) including melting temperature and low probability of self-dimerization. Unfortunately, it is difficult to predict unquenching efficiency based on the sequence of the docking strand since it not only depends on the specific fluorophore and quencher, but also the method and location at which they are conjugated onto the oligonucleotide, proximal nucleobases, and the 3D structure of dsDNA complex formed, which will unlikely be a perfect double helix due to the mismatches. Ultimately, computational screening generated a short list of oligonucleotides that we individually screened for suitable kinetics and brightness under optimized DNA-PAINT imaging conditions.
We first designed an imager probe conjugated with the dye Cy3B and the quencher BHQ2 (imager probe A), and quantified its fluorogenicity in solution. In its freely diffusing unbound state, our probe is less than 2.5% as bright as a regular DNA-PAINT probe (conjugated with Cy3B but no quencher; Fig. 1b) providing evidence that even in the absence of a stem, ssDNA can be sufficiently dynamic and flexible to provide strong quenching in the unbound state. On binding with its fully complementary sequence, we observed a 57-fold increase in fluorescence. Similar to previous reports, we also measured a weak fluorogenic effect of a 2-fold increase for the regular probe 2. Overall, our new imager probe was 24 times more fluorogenic than the regular DNA-PAINT probe.
Increased imaging speed
We characterized the performance of the Cy3B-BHQ2 probe with its partially mismatched docking strand by imaging DNA origami nanostructures. DNA origami technology allows for the design of custom structures with precise definition in the position and number of docking strands. The chosen ring-shaped origami was originally designed for building simplified nuclear pore mimics 22 and has an outer diameter of 62 nm (Fig. 2a). Here we extended 48 docking strands from the exterior of this DNA ring. This relatively low density of docking strands (48 per μm2) compared to typical antibody labels (hundreds per μm2) in cells makes DNA-PAINT imaging very inefficient unless the imager probe concentration is high enough to lead to substantial binding frequencies. It therefore represents an excellent test of the performance of fluorogenic DNA-PAINT under conditions where the background is high. The ring shape also provides an easy and visual way to assess the achievable resolution as well as blinking artifacts. Imaging with a fluorogenic imager probe concentration of 250 nM, around 50 times higher than regular DNA-PAINT, and a camera frame rate of 100 Hz with TIRF illumination, we could resolve the rings within 1 minute (Fig. 2c). The ring diameter was measured to be marginally less than the expected size (60.5 ± 2.0 nm (mean ± SD), norigami=20; two-sided one-sample t-test against 62 nm, t-statistic=3.31, p=0.004; Shapiro-Wilk test for normality, W-statistic=0.948, p=0.340). Fourier Ring Correlation (FRC) analysis yielded an excellent resolution of 17.8 nm (see Methods). The hollow centers of the rings could be easily resolved in individual rings as well as in an average of 20 rings (Fig. 2b) confirming that the frequency of multi-emitter artifacts is low (~9%; Suppl. Fig. 2).
Figure 2. Fast fluorogenic DNA-PAINT imaging of DNA origami nanostructures.
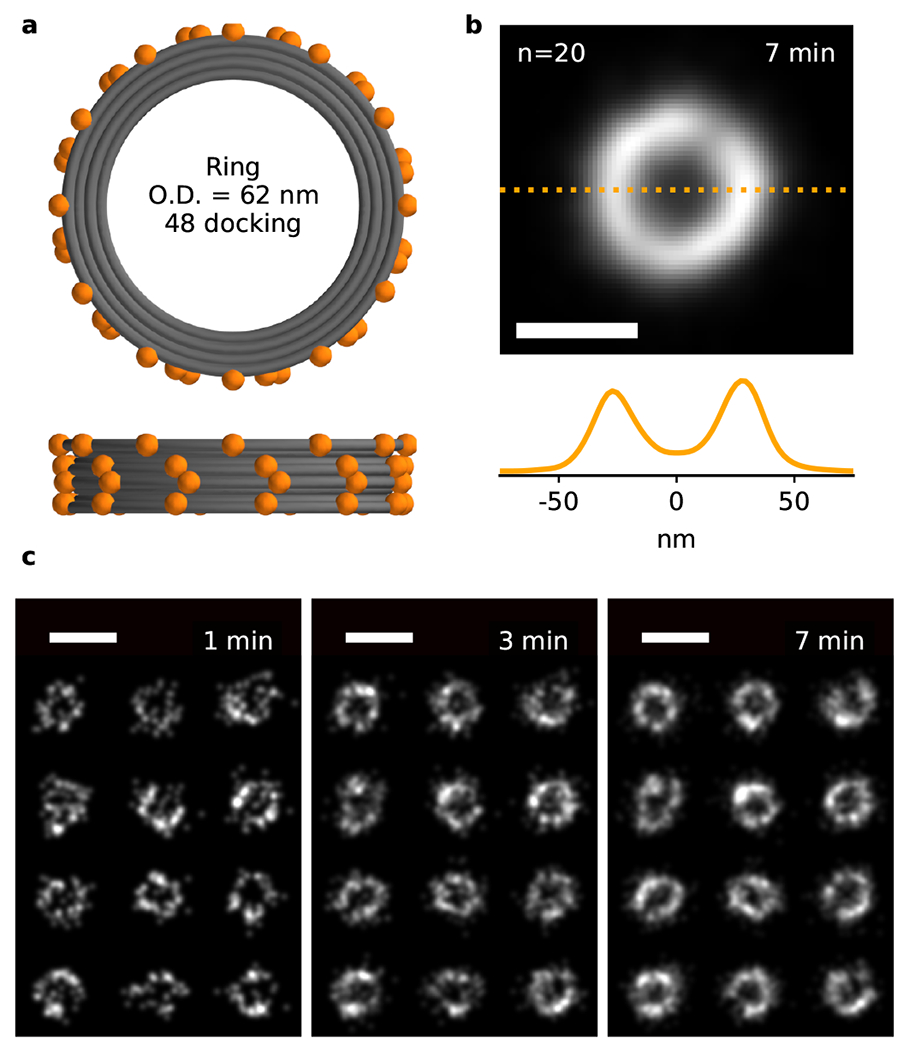
(a) Top and front schematic view of the DNA origami nanostructure, with 48 docking strands attached to the 62-nm ring. (c) Fast fluorogenic DNA-PAINT TIRF imaging ([imager probe A] = 250 nM; frame rate = 100 Hz) of origami rings (12 rings shown). Scale bar is 100 nm. (b) Average of 20 rings measuring a diameter of 60.5 ± 2.0 nm and displaying ~9% multi-emitter artifacts (Suppl. Fig. 2). Scale bar is 50 nm.
For quantification of imaging speed and resolution with a biological sample that features a large number of docking strands per diffraction-limited area, we compared 2D DNA-PAINT TIRF images of immunolabeled microtubules in COS-7 cells using a regular imager probe and our fluorogenic probe (Fig. 3). Under these high-density labeling conditions, the limiting factor is the off-rate since multi-emitter artifacts need to be avoided (Suppl. Fig. 1f) 1. Regular DNA-PAINT imaging was performed at a frame rate of 4 Hz (expected off-rate ~1 s−1) with probe concentration at 0.1 nM, similar to parameters previously used for high quality DNA-PAINT imaging 23, whereas with our fluorogenic imager probe, imaging was performed at 100 Hz (off-rate ~50 s−1) and a probe concentration of 20 nM. With both higher on- and off-rates for our fluorogenic probe, approximately 26 times more blinking events per second could be observed than with the regular DNA-PAINT probe (4.3 vs. 0.2 s−1 μm−1 of microtubules; Fig. 3b). This improvement was less than anticipated based on the 200-fold increase in probe concentration, which suggests that the additional bases of the fluorogenic probe may have reduced kON. Nonetheless, achieving 1,000 blinking events per micron of microtubule required only ~4 min of imaging with the fluorogenic probe compared to ~1.4 hr with the regular probe. With fluorogenic DNA-PAINT, 2D projections of hollow microtubules were easily observable after 3 min (Fig. 3a). Whereas with regular DNA-PAINT, in contrast, required hours of imaging to obtain similar image quality.
Figure 3. Comparison of regular and fluorogenic DNA-PAINT imaging.
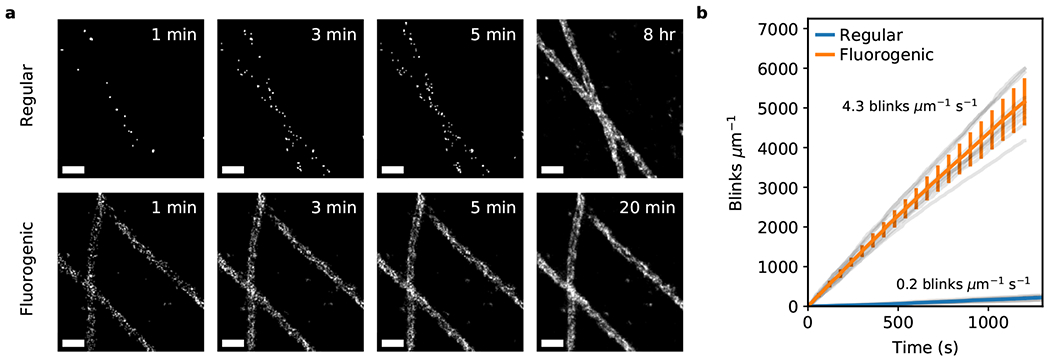
(a) Qualitative comparison of regular versus fluorogenic DNA-PAINT TIRF-imaging of fixed microtubules (regular: [probe] = 100 pM, frame rate = 4 Hz; fluorogenic: [imager probe A] = 20 nM, frame rate = 100 Hz). Scale bar is 200 nm. (b) Quantitative comparison showing that blinking data is acquired 25.8 times faster with the fluorogenic probe (quantified by the number of blinks per length of microtubule per unit of time; regular 0.17 ± 0.04 μm−1 s−1, nROI = 8, fast 4.30 ± 0.49 μm−1 s−1, nROI = 10; two-sided Mann-Whitney U test, U-statistic=0, p=0.0004). Averaged statistics presented as mean ± SD.
3D super-resolution without optical sectioning
We next tested whether the fluorogenic properties of our new probe would be strong enough to replace the background suppression provided by optical sectioning through TIRF illumination and thereby allow 3D imaging of volumes thicker than a few hundred nanometers. We first imaged microtubules using regular widefield illumination and astigmatic detection for 3D localization. We were able to image with our fluorogenic probe at 10 nM concentration and at a camera frame rate of 100 Hz to acquire a 3D super-resolution image of the microtubule network at high quality (3D FSC resolution = 41.1 nm) in only 10 minutes (Fig. 4a–c and Ext. Data Fig. 3). We halved the imager probe concentration compared to the 2D experiments to compensate for the larger size of the blinks caused by the astigmatic detection and avoid an increase in multi-emitter artifacts. The obtained localization precision (Ext. Data Fig. 3d; peak 1.7 nm for XY, 4.5 nm for Z) was comparable to that reported for regular DNA-PAINT 23. The hollow centers of microtubules can be seen in the microtubule cross-section or in the 30-nm thick z-slice as they pass through the plane (Fig. 4b and Suppl. Movie 1).
Figure 4. Fast 3D fluorogenic DNA-PAINT imaging without optical sectioning.
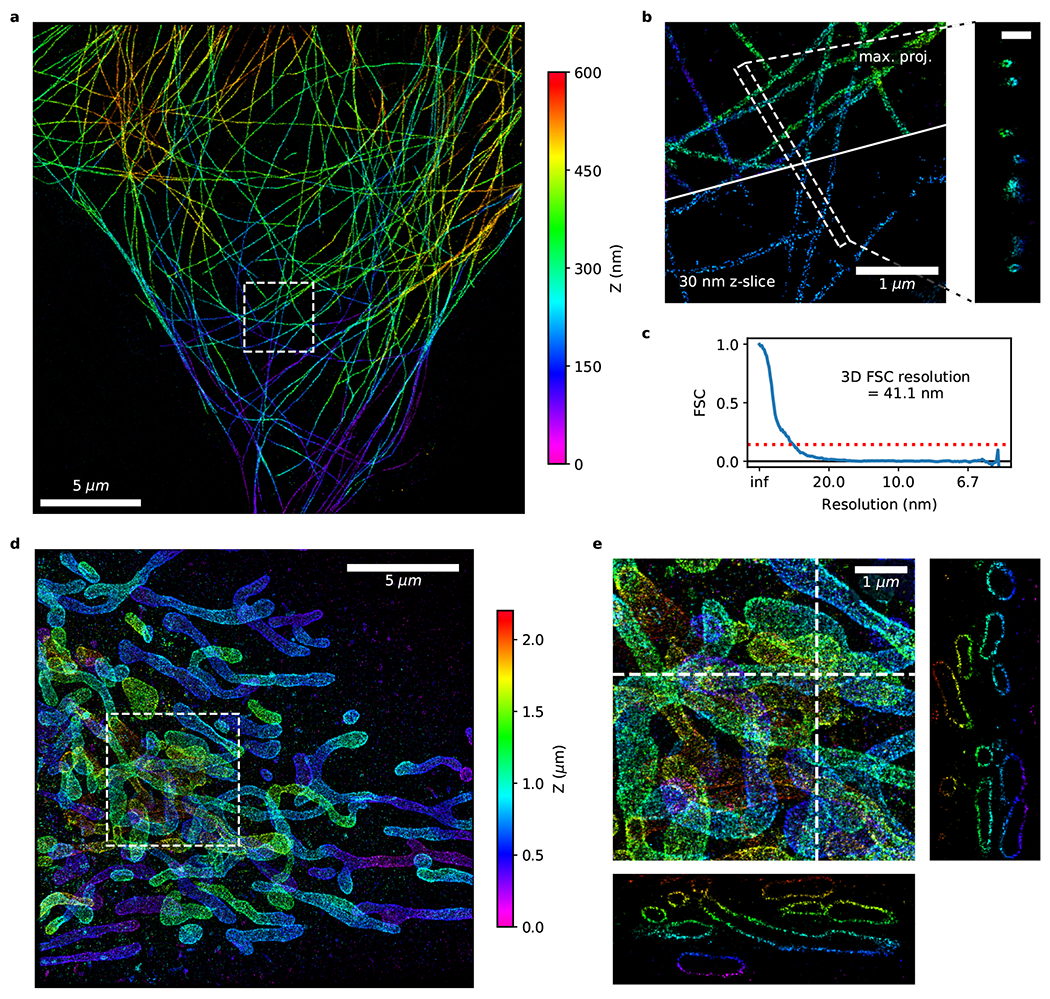
(a-c) Fast astigmatic 3D fluorogenic DNA-PAINT imaging ([imager probe A] = 10 nM; 100 Hz; 10 min) of immunolabeled microtubules in COS-7 cells without optical sectioning under widefield illumination. (a) Overview image. (b) Zoomed-in view of the dashed box in (a). The top represents a maximum projection image, the bottom a 30-nm thick slice. Hollow microtubules can be seen in the slice view as well as in the Z cross-section displayed on the right (scale bar: 250 nm). (c) Fourier shell correlation (FSC) with a threshold of 0.143 measures the 3D resolution at 41.1 nm. (d, e) Fast 3D whole-cell fluorogenic DNA-PAINT imaging of mitochondria in U-2 OS cells overexpressing GFP-OMP25 recorded with a 4Pi-SMS microscope ([imager probe A] = 2 nM; 100 Hz; 1 hr). Regular DNA-PAINT is incompatible with 4Pi-SMS due to its lack of optical sectioning. (d) Z-projection of data collected from 4 imaging volumes covering a depth range of 2 μm. (e) Magnified region from (d) with XZ and YZ cross-sections.
Having eliminated the need for optical sectioning, we were also able to perform fast fluorogenic DNA-PAINT under widefield illumination on a 4Pi-SMS microscope that interferometrically combines the fluorescence collected by two opposing objectives for improved axial localization precision 24, 25. We imaged mitochondria, immunolabeled for the outer membrane protein OMP25, throughout the cell (Fig. 4d,e; 4 overlapping imaging volumes spanning ~2 μm). Regular DNA-PAINT is incompatible with 4Pi-SMS due to its lack of optical sectioning, whereas fluorogenic DNA-PAINT allows for 4Pi-SMS imaging at high sampling density.
Simultaneous multicolor imaging
To expand fluorogenic DNA-PAINT for multicolor imaging, we developed a second set of imager probe and docking strand that are orthogonal to our first set in both emission spectrum (ATTO 643 / IBFQ) and binding affinity (Fig. 5a). In contrast to previous multiplexed DNA-PAINT approaches that are performed sequentially 7, we imaged the two imager probes simultaneously in separate color channels thereby avoiding any loss of speed compared to single-color imaging. We demonstrated this with the dual-color imaging of the endoplasmic reticulum and mitochondria in U-2 OS cells in 10 minute-recordings at high localization density without optical sectioning (Fig. 5b–f, Ext. Data Fig. 4, 5 and 6). The apparent absence of cross-talk between the two probes (Fig. 5e,f) was quantitatively confirmed by both a pixel-dependent colocalization analysis based on correlation of pixel intensity (Fig. 5b, r=0.18) and a point-dependent analysis based on correlation of neighbor distribution (Coordinate-Based Colocalization 26, C=−0.1, Ext. Data Fig. 5a–c).
Figure 5. Fast 2-color fluorogenic DNA-PAINT imaging without optical sectioning.
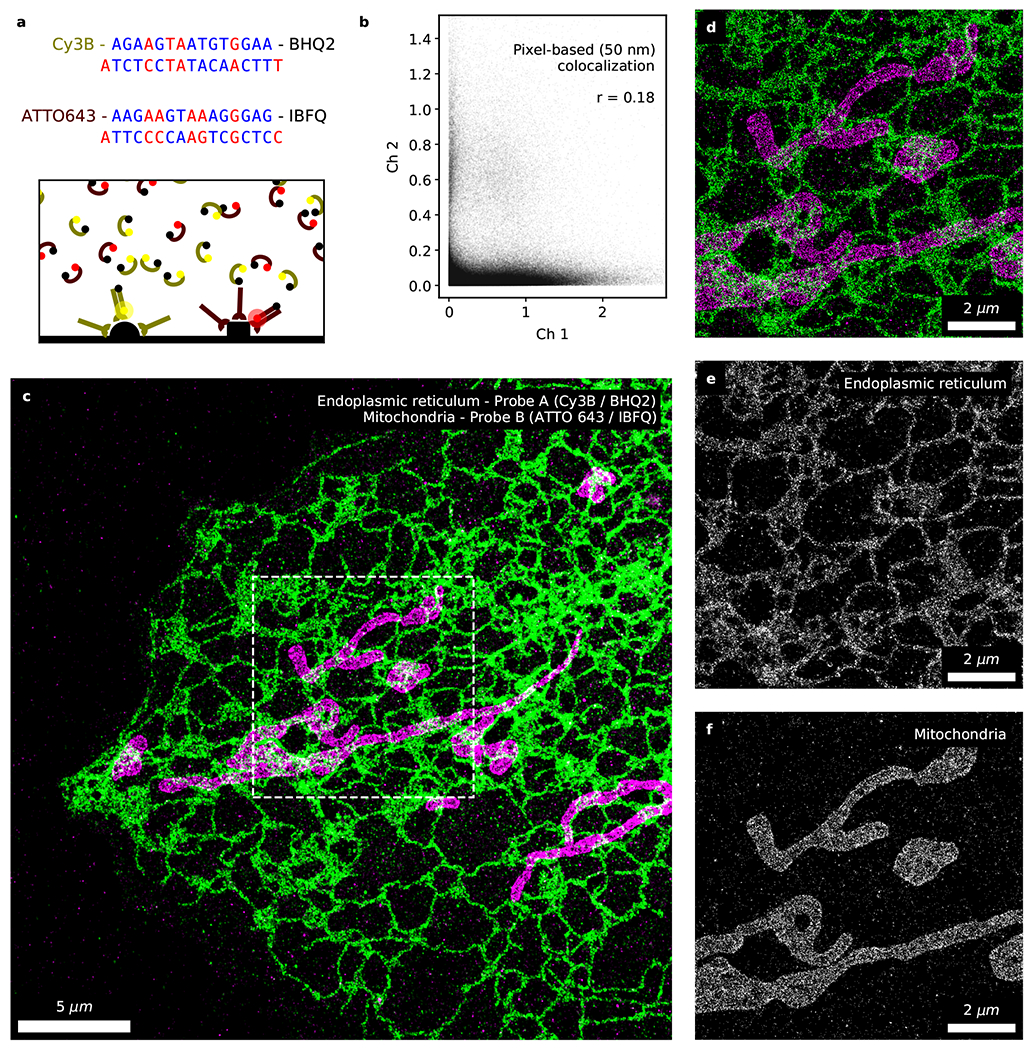
Simultaneous 2-channel DNA-PAINT imaging with fluorogenic probes ([imager probe A] = 10 nM and [imager probe B] = 1 nM; 100 Hz; 10 min) of immunolabeled endoplasmic reticulum (overexpressed Sec61β; green) and mitochondria (TOM20; magenta). (a) The two sets of fluorogenic imager probes and docking strands. Complementary bases between the imager and docking strands are marked in blue whereas mismatches in red. The two population of probes selectively binds to their corresponding docking strands during simultaneous 2-color imaging. (b) Analysis of the data rendered at ‘low’ resolution (50 nm) indicates a low level of correlation between the two channels (Pearson correlation coefficient=0.18, p<10−4, npixel=6.3×10⁵) and minimal cross-specific binding between the two sets of probes. Overview (c) and zoomed-in (d) image of the ER and mitochondria acquired with fluorogenic DNA-PAINT in 10 minutes under widefield illumination. (e, f) Direct comparison of the two channels reveals negligible levels of cross-talk. Additional 2-color fluorogenic DNA-PAINT datasets are shown in Ext. Data Fig. 6 (n=5).
Discussion
Our current implementation of fluorogenic DNA-PAINT with partially mismatched docking strands also opens the way for other multiplex imaging schemes that we have not explored in this study. Since docking strands are not fully complementary to the imager, there are potentially many suitable docking strands for any imager. On one hand, this introduces potential for cross-specific binding, which we have demonstrated to be avoidable with proper sequence design (Fig. 5). On the other hand, a single imager can be used to simultaneously image multiple targets, each with a different docking strand. Discriminating target identity can potentially be achieved, for example, by encoding docking strands with different binding kinetics, i.e. kinetics fingerprinting 27.
While in this study we demonstrate imaging at 100 fps and generating 2D and 3D super-resolution images with excellent localization density and localization precision in minutes without optical sectioning, it is worth pointing out that we have not yet experienced a fundamental limit with fluorogenic DNA-PAINT. We expect that further developments in probe chemistry and design should yield even better fluorogenicity and faster off-rates. Similarly, effective on-rates can be further optimized as recently demonstrated for regular DNA-PAINT probes 12, 28, 29. The two probes we report in this study are not only compatible with existing DNA-PAINT instruments and modalities, but liberate DNA-PAINT imaging from the dependency on optical sectioning. Importantly, imaging with the fluorogenic probe retains robustness against photobleaching; high signal-to-noise images can be acquired at essentially arbitrarily high sampling densities by extending imaging time (Ext. Data Fig. 3a and 4). Based on these strengths, we believe that fluorogenic DNA-PAINT will become the preferred form of single-molecule localization microscopy.
Methods
Imager probes and docking strands
The sequences for the regular imager probe and docking strand were taken from Auer et al., 2017 16 and share a complementary region of 9 bases.
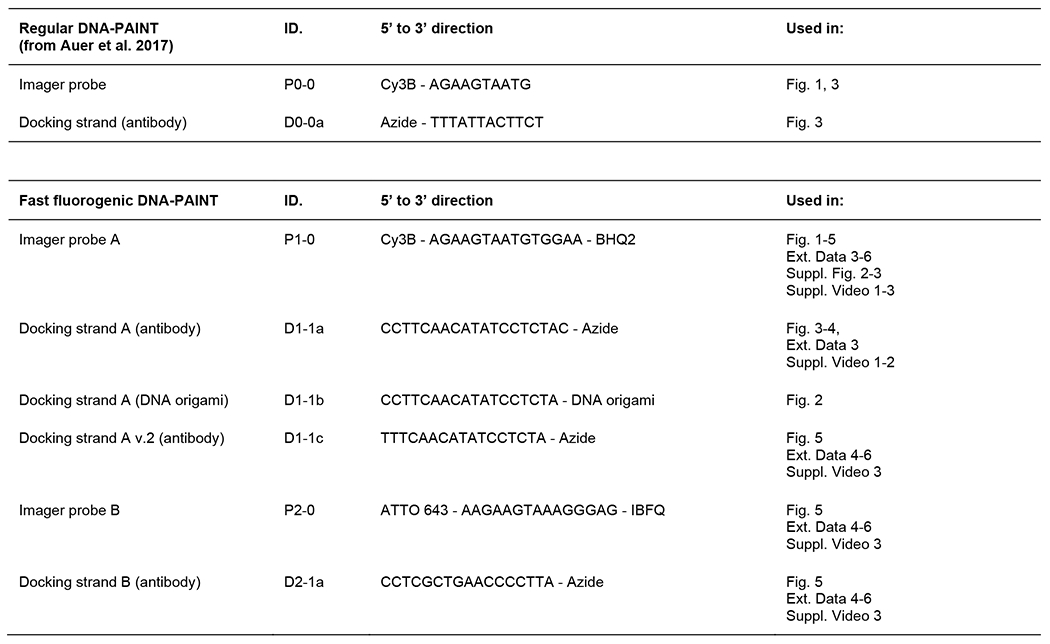
Two sets (A and B) of fluorogenic imager probes and docking strands that are orthogonal in color (orange and far red) and binding affinity were developed (see Suppl. Note 3). The imager probes are 15-bases long and conjugated with a fluorophore at the 5’ end and a quencher at the 3’ end (Ext. Data Fig. 1). The docking strands are partially mismatched to their corresponding imager probe sequences (Ext. Data Fig. 2). Slightly different versions of the docking strand with different padding bases were developed within set A. Specifically, version 2 is optimized for multiplex imaging as it is predicted to have minimal cross-specific binding against set B.
All oligonucleotides were ordered from Integrated DNA Technologies.
DNA origami
The ring-shaped DNA origami structure is based on a previously described structure 22 with only minor modifications in the positions of handles. The structure was designed using caDNAno (caDNAno.org), with an expected outer diameter of ~62 nm. DNA scaffold strands (8064-nt circular ssDNA) were produced using E. coli and M13-derived bacteriophages. All DNA oligonucleotides were purchased from Integrated DNA Technologies.
48 ssDNA handles (Ext. Data Fig. 1, docking strand D1–1b) extend from the 5’ end of staple strands on the outer helices. Additionally, 12 ssDNA handles (Suppl. Table 1, Biotin handle) extend from the 3’ end of staple strands on the bottom of the ring for biotin functionalization.
DNA origami rings were assembled from a scaffold strand (80 nM) and a pool of staple strands (480 nM each) in 1× folding buffer (25 mM TrisHCl, 1 mM EDTA, pH 8.0 with 16 mM of MgCl2) using an 18-hr thermal annealing program (85°C–25°C). Folded structures were concentrated by resuspending in half the original volume following PEG precipitation 30. Correctly assembled rings were purified via rate-zonal centrifugation through 15–45% glycerol gradients (in 1× folding buffer) in an SW 55 rotor (Beckman Coulter) at 48,000 rpm at 4°C for 1.5 hr 31.
DNA origami were attached to channel slides (ibidi USA, μ-Slide VI, 80607) for imaging following a previously published protocol 10 with minor modifications. Slides were plasma-cleaned, coated with biotin-BSA (Millipore Sigma, A8549) and incubated with streptavidin (ThermoFisher, 434302). DNA origami with biotin handles were then attached to the functionalized coverslips. Non-fluorescent beads (Spherotech, TP-08-10) and nanodiamonds (Adámas Nanotechnologies, NDNV140nmHi) were added as fiduciary markers for drift correction.
Cell culture
COS-7 cells (ATCC lot #63624240) were grown in DMEM (Gibco, 21063029) supplemented with 10% fetal bovine serum (FBS; Gibco, 10438026). U-2 OS cells (ATCC lot #70008732) were grown in McCoy’s 5A medium (ATCC, 30-2007) supplemented with 10% FBS.
Microtubule labeling:
Channel slides (ibidi USA, μ-Slide VI, 80607) were plasma-cleaned and coated with poly-l-lysine (Sigma Aldrich, P4707) before seeding COS-7 cells. Microtubules were labeled following a previously published protocol 25. COS-7 cells were incubated with 0.2% saponin for 1 min, fixed with 3% paraformaldehyde (Electron Microscopy Sciences, 15710) and 0.1% glutaraldehyde (Electron Microscopy Sciences, 16019) for 15 min, rinsed 3 times with PBS, incubated in blocking buffer (PBS + 0.2% Triton X-100 + 3% bovine serum albumin) for 30 min, and then incubated with mouse anti-alpha tubulin primary antibody (Sigma Aldrich,T5168) at a concentration of 1:200 in antibody dilution buffer (PBS + 1% BSA + 0.2% TX-100) overnight at 4°C. The cells were then washed 3 times for 5 min each and incubated with oligonucleotide-conjugated goat anti-mouse IgG secondary antibody (Jackson ImmunoResearch, 115-005-146) at a concentration of 1:200 for 1 hr at room temperature. The secondary antibody was conjugated to oligonucleotide docking strands (Ext. Data Fig. 1, D1-1a) using azide / DBCO click chemistry 10. The cells were washed 3 times for 5 min each and then rinsed 3 times with PBS.
Mitochondria labeling:
U-2 OS cells were electroporated with plasmids encoding the mitochondrial marker GFP-OMP25 25, 32 and then seeded onto ozone-cleaned 25-mm round coverslips. Mitochondria were labeled following a previously described protocol 25. The cells were fixed with 3% PFA and 0.1% GA for 15 min, rinsed three times with PBS, permeabilized for 3 min, rinsed three times with PBS, incubated in blocking buffer for 1 hr, and then labeled with rabbit anti-GFP primary antibody (Invitrogen, A-11122) at 1:500 overnight at 4°C. The cells were washed 3 times for 5 min each prior to incubation with oligonucleotide-conjugated goat anti-rabbit IgG secondary antibody (Jackson ImmunoResearch, 111-005-144) at a concentration of 1:200 for 1 hr. The secondary antibody was conjugated to oligonucleotide docking strands (Ext. Data Fig. 1, D1-1a) using azide / DBCO click chemistry 10. The cells were washed 3 times for 5 min each and finally rinsed with PBS 3 times.
Dual endoplasmic reticulum and mitochondria labelling:
U-2 OS cells were electroporated with plasmids encoding endoplasmic reticulum marker mEm-Sec61B (gift from Michael Davidson; Addgene plasmid # 54249). Samples were processed similarly to samples labelled only for mitochondria 25 with the following changes: the cells were labeled with mouse anti-GFP primary antibody (Invitrogen, A-11120) at 1:100 and rabbit anti-TOM20 (Abcam, ab78547) at 1:500 overnight at 4°C. After washing, the samples were labeled with goat anti-mouse IgG secondary antibody (Jackson ImmunoResearch, 115-005-146) and goat anti-rabbit IgG secondary antibody (Jackson ImmunoResearch, 111-005-144) conjugated with oligonucleotide docking strands (Ext. Data Fig. 1, D1-1c and D2-1a, respectively) both at a concentration of 1:200 for 1 hr at room temperature.
Fluorescence measurements in solution:
Fluorescence measurements of the probes in solution were performed with a microscope (the same microscope as described for imaging DNA origami structures) under widefield illumination provided by a xenon arc lamp (Sutter Instruments, Lambda LS). Fluorescence intensity was measured ~10 μm deep past the coverslip. Buffer-only blanks were measured for background correction. Samples were prepared in a high ionic strength PBS-based buffer (PBS, 500 mM NaCl) in channel slides (ibidi USA, μ-Slide VI, 80607).
To measure quenching efficiency, fluorophore-conjugated strands were prepared at 0.2 μM, and saturated with adapter strands at 0.3 μM and quencher-conjugated strands at 0.45 μM (Suppl. Table 2 and Suppl. Fig. 3b).
‘Unbound probes’ samples contained only the imager probe (0.2 μM), and ‘bound probes’ samples were prepared with the probe and its complementary sequence in excess (20 μM) (Fig. 1b and Suppl. Fig. 3c).
All oligonucleotides were ordered from Integrated DNA Technologies.
Microscope setup:
DNA origami samples and microtubule samples (for 2D imaging) were imaged in TIRF mode on a modified Nikon Ti-E inverted microscope with a 100× 1.45 NA oil immersion objective with a sCMOS camera (Andor, Zyla 4.2). For illumination, a 561-nm laser with a built-in acousto-optic modulator for intensity modulation (Omicron Lux) was used with a dichroic (Semrock, Di02-R488-25×36) and a band pass filter (Semrock, FF01-524/45-25). For imaging with the regular probe, data were recorded at 4 fps at ~0.2 kW/cm2. With the fluorogenic probe, data were recorded at 100 fps at ~2 kW/cm2. A custom image-based focus-lock system based on the a previously described design 33 was used.
Astigmatic 3D imaging of microtubule samples was performed on a custom-built microscope as previously described 34. Briefly, fluorescent signal was collected by an oil-immersion objective lens (Olympus, 100×, 1.49 NA) and imaged with a sCMOS camera (Hamamatsu, ORCA-Flash 4.0). A cylindrical lens (f = 500 mm) was added to the emission beam path to introduce astigmatism. Data were recorded at 100 fps with a 560-nm laser (MPB Communications, 500 mW) at an intensity of ~13 kW/cm2. 100 nm diameter fluorescent microspheres (ThermoFisher, 580/605, F8801) were imaged to generate reference PSFs. A custom-built focus-lock system based on tracking a reflected infrared laser was used to correct for axial drift.
Mitochondria samples were imaged with a custom-built 4Pi-SMS system as previously described 25. Briefly, the fluorescent signal was collected coherently by two opposing objectives (Olympus, 100×, 1.35 NA, silicone oil immersion,) and imaged with a sCMOS camera (Hamamatsu, ORCA-Flash 4.0 v2). Data were acquired at 100 fps with a 560 nm laser (MPB Communications, 2RU-VFL-P-2000–560-B1R) at an intensity of ~15 kW/cm2.
Dual mitochondria and ER-labelled samples were imaged on a custom-built microscope in 2-channel mode as previously described with modifications 35. In brief, samples were simultaneously excited at 561 nm (~1.5 kW/cm2) and 642 nm (~7.5 kW/cm2). Fluorescence emission was split using a tilted bandpass filter (Semrock, FF01–709/167) as a beam splitter, filtered (Chroma, ZET405/488/561/647m) and imaged on adjacent areas of a sCMOS camera (Hamamatsu, ORCA-Flash 4.0). An oil-immersion objective lens (Leica Microsystems, 63x, 1.47 NA) was used. Fluorescent microspheres (ThermoFisher, TetraSpeck, 100 nm diameter, T7284 or T7279) were imaged to generate sub-diffraction alignment maps between the two color channels.
Imaging buffer:
For imaging origami structures, a Tris-based buffer (5 mM Tris, 10 mM MgCl2, 1 mM EDTA, 0.05% Tween 20, 20 mM Na2SO3 and 1 mM Trolox, pH 7.3-7.5) was prepared. For imaging fixed cell samples, a high ionic strength PBS-based buffer (1× PBS, 500 mM NaCl, 20 mM Na2SO3 and 1 mM Trolox, pH 7.3-7.5) was used. Trolox (Santa Cruz Biotechnology, sc-200810) aliquots were stored at −20°C at a concentration of 50 mM in DMSO and thawed prior to the experiment. Imager probes were stored at −20°C at a concentration of 100 μM in nuclease-free H2O and serially diluted into one of the imaging buffers as necessary.
Data analysis:
Data acquired by the single-objective microscope systems were analyzed with PYME 36,37 and custom code written in Python. Localizations in 2D were performed by a weighted least square fit with a 2D Gaussian PSF model 38, 39. Astigmatic 3D localizations were performed by fitting against a PSF experimentally derived from bead images 40. For 2-color DNA-PAINT, molecules were localized independently in each channel and subsequently recombined using an experimentally acquired alignment map.
The localization routine for 4Pi-SMS microscope data has been previously described in detail 25. Images and movies were rendered using Vutara SRX software (Bruker).
Localizations that appeared in consecutive frames (allowing for 1 frame misdetection) at the same position (within < 2σ xy-localization precision) were combined into ‘blinks’. This correction takes into account that these localizations most likely do not represent independent samples of the docking strands (see Suppl. Note 2). Although this results in fewer localization counts, blinks provide better estimates of the position at higher precision, and this approach avoids artificially inflated blinking rates and overcounting artifacts due to fast camera frame rate and/or slow blinking.
Drift corrections were performed using the redundant cross-correlation method 41. Blinks were rendered as 2D or 3D Gaussians in images and movies.
Fourier ring correlation (FRC) and Fourier shell correlation (FSC) was computed based on the method described in Nieuwenhuizen, et al., 2013 42. A threshold of 0.143 was used. A 5 × 5 × 0.6 μm subregion was used for the FSC calculations presented in Fig. 4c and Ext. Data Fig. 3c.
Coordinate-based colocalization was computed based on the method described in Malkusch et al. 2012 26, and code published as part of LocAlization Microscopy Analyzer (LAMA) reported in Malkusch and Heilemann, 2016 43.
Analytic study of DNA-PAINT imaging speed and simulations of multi-emitter artifact were performed with code written in Python (shared on Github 44). Computational screens of docking strand sequences were performed with custom code written in Python (shared on Github 45) and used tools available as part of Biopython 20.
Statistics
Statistical tests were performed using functions from the SciPy library (scipy.stats) 46. Assumption of normality was tested for t-tests where sample size is > 5 using the Shapiro-Wilk test. No assumptions were tested for the Mann-Whitney U test or the Wilcoxon signed-rank test. No multiple comparison corrections were performed.
Extended Data
Extended Data Fig. 1. List of imager probes and docking strands used in this study.
Extended Data Fig. 2. Alignment between imager probes and their corresponding docking strands.
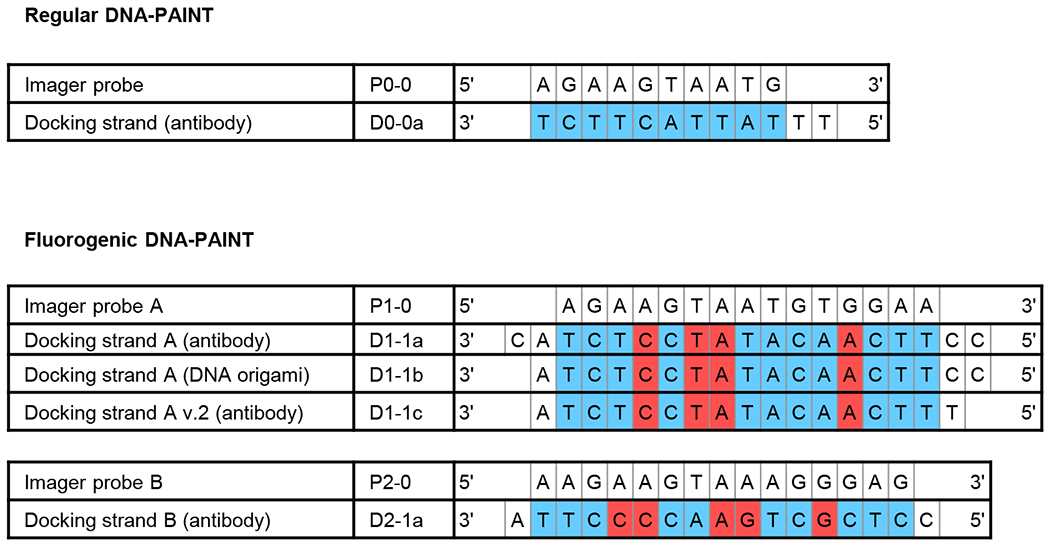
Fluorogenic DNA-PAINT uses imager probes and docking strands with internal mismatches. Complementary base pairings are colored in blue whereas mismatches in red.
Extended Data Fig. 3. Fast astigmatic 3D fluorogenic DNA-PAINT imaging without optical sectioning.
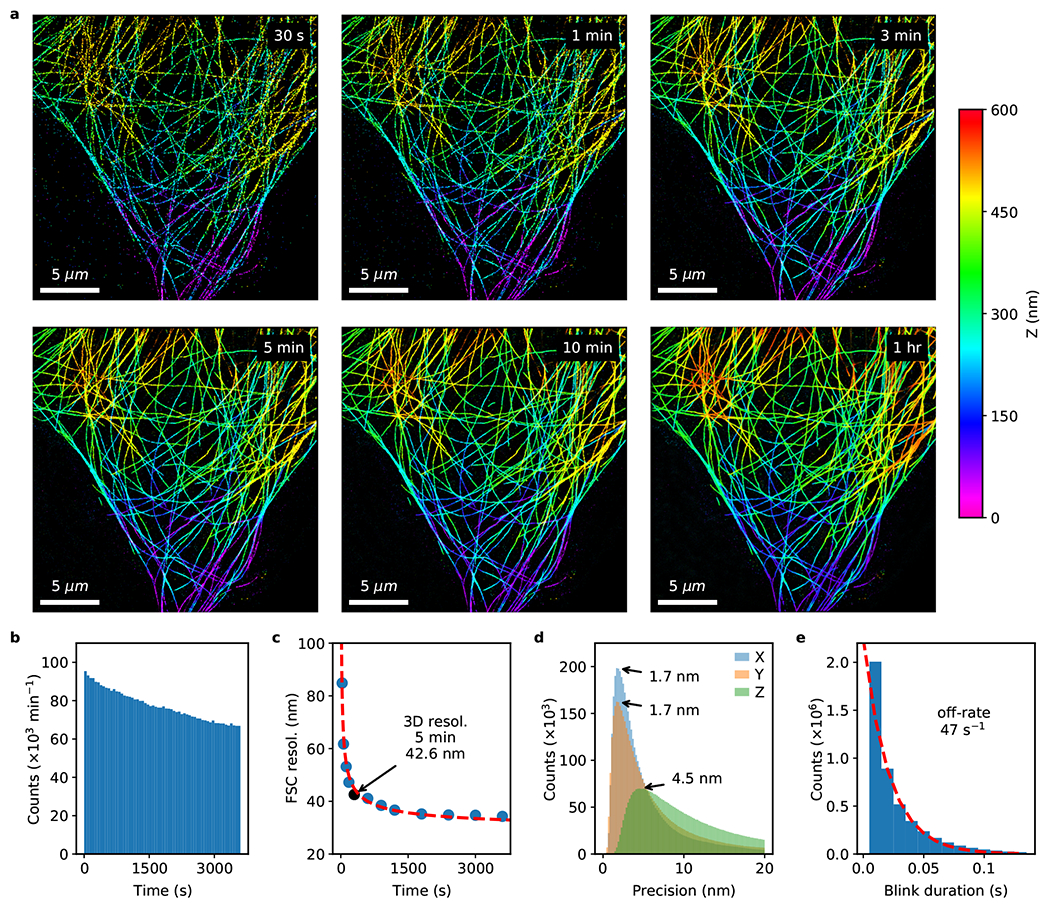
The full dataset from which Fig. 4a–c were generated. (a) Fast 3D fluorogenic DNA-PAINT imaging of immunolabeled microtubules in COS-7 cells under widefield illumination at multiple time points. A reasonable image can be acquired in 30 s. (b) Bleaching is negligible, causing only a small reduction (30%) in blinking rate over an hour. (c) 3D resolution as quantified by Fourier shell correlation (FSC) improves with longer imaging duration as more blinking events are detected. The resolution reaches 34.3 nm after 1 hr. (d) The localization precision peaks at < 5 nm for all three dimensions (X: 1.7 nm, Y: 1.7 nm, Z: 4.5 nm). (e) Fitting an exponential decay function to blink durations (blinks that are only 1 frame in duration were ignored for fitting) estimates the mean off-rate at 46.7 s−1.
Extended Data Fig. 4. Time series of fast 2-color fluorogenic DNA-PAINT imaging without optical sectioning.
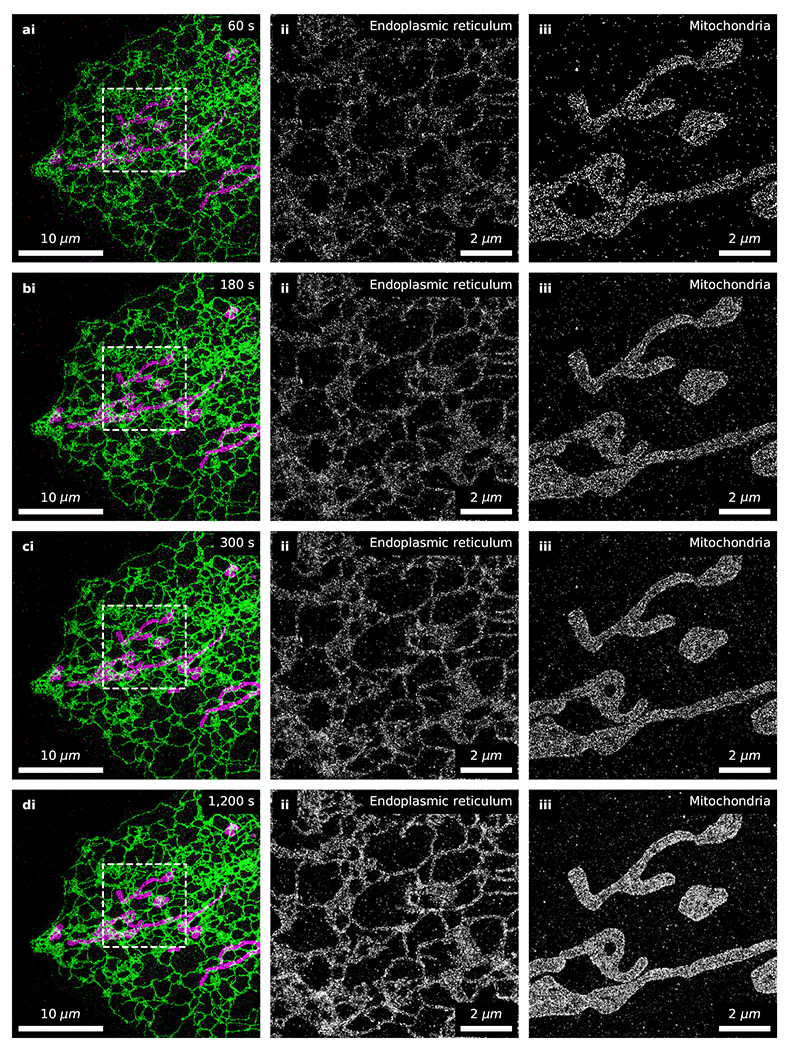
The full dataset from which Fig. 5b–f were generated, rendered at various timepoints. (a-d) Fast 2-color fluorogenic DNA-PAINT imaging of immunolabeled endoplasmic reticulum (ii; [imager probe A] = 10 nM) and mitochondria (iii; [imager probe B] = 1 nM) in U-2 OS cells under widefield illumination (100 Hz frame rate). There is no well-defined minimum imaging time as it depends on a multitude of factors including the biological question being addressed. The timepoint we reported in the main text (600 s) is more densely sampled than typical single-molecule localization microscopy images. Negligible changes are observed with prolonged imaging (d; 1,200 s) which would suggest oversampling.
Extended Data Fig. 5. Analysis of fast 2-color fluorogenic DNA-PAINT imaging without optical sectioning.
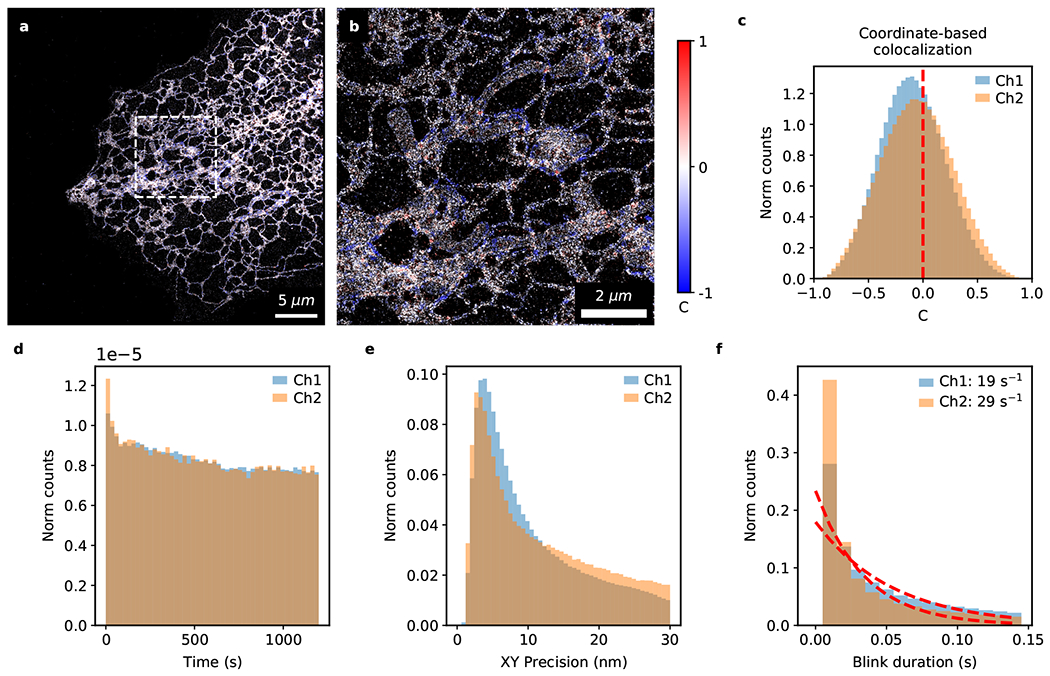
Detailed analysis of the full 20-minute 2-color fluorogenic DNA-PAINT dataset from which Fig. 5 and Ext. Data Fig. 4 were generated. Image colored by the correlation parameter (C) based on Coordinate-Based Colocalization (CBC) analysis at low (a) and high (b) magnification. (c) Histogram of the correlation parameter, C. A value of zero indicates a lack of correlation between the two color channels (C = −0.09 ± 0.30; nblink=2,322,207; two-sided one-sample Wilcoxon signed-rank test against zero, T-statistic=9×10¹¹, p<0.001). (d) Minimal bleaching is observed over a 20-minute timeframe (~20%). (e) The lateral localization precision peaks at < 5 nm for both channels. (f) Blink durations fitted with an exponential decay function to estimate the binding off-rate (blinks that are only 1 frame in duration were ignored for fitting).
Extended Data Fig. 6. Additional examples of fast 2-color fluorogenic DNA-PAINT imaging without optical sectioning.
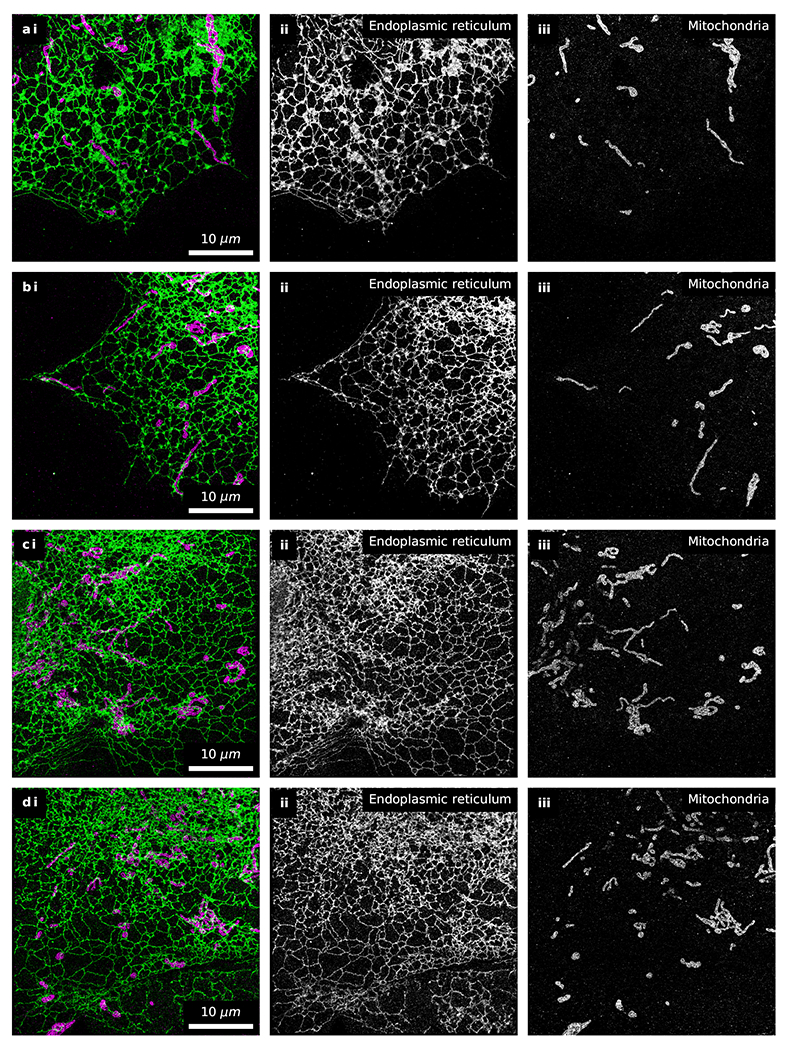
Fast 2-color fluorogenic DNA-PAINT imaging of immunolabeled endoplasmic reticulum (green; [imager probe A] = 10 nM) and mitochondria (magenta; [imager probe B] = 1 nM) in U-2 OS cells under widefield illumination (100 Hz frame rate for 10 minutes) (n=5 including the dataset presented in detail in Fig. 5 and Ext. Data Fig. 4,5).
Supplementary Material
Supplementary Video 1: Fast 3D fluorogenic DNA-PAINT imaging ([imager probe A] =10 nM; 100 Hz; 10 min) of microtubules in a COS-7 cell without optical sectioning under widefield illumination. The hollow center of microtubules can be observed in both the XY and XZ planes when viewing 30-nm thick cross-sections. 1 μm scalebar.
Supplementary Video 2: (a) Raw images from fast astigmatic 3D fluorogenic DNA-PAINT imaging ([imager probe A] =10 nM; 100 Hz) of microtubules in a COS-7 cell under widefield illumination. (b) Live kymograph of the blinking within the dashed box in (a).
Supplementary Video 3: (a) Images from fast 2-color fluorogenic DNA-PAINT using imager probe A (10 nM; Cy3B; green) and imager probe B (1 nM; ATTO 643; magenta) to image the endoplasmic reticulum and mitochondria respectively (100 Hz; raw images from the two color channels were transformed and aligned for display). (b) Heatmap of pixel intensities. Negligible spectral cross-talk between the fluorophores (Cy3B and ATTO 643) was observed as indicated by the well resolved populations (green and magenta dashed line respectively).
Acknowledgements
We thank Lukas Fuentes, Kevin Hu, Zach Marin and Florian Schueder for helpful discussions. This work was primarily supported by a 4D Nucleome grant from the National Institutes of Health (U01 DA047734 to J.B. and D.B.) and the Wellcome Trust (203285/B/16/Z). J.B. acknowledges support from NIH grant P30 DK045735 (to Robert Sherwin). C.L. acknowledges support from an NIH Director’s New Innovator Award (GM114830), an NIH grant (GM132114), and Yale University faculty startup funding. N.W. was supported by an NIH training grant (T32 EB019941).
Footnotes
Competing Interests
J. B. discloses significant financial interest in Bruker Corp., Hamamatsu Photonics and panluminate Inc.
J.B. is co-inventor of a US patent (9,769,399) related to the 4Pi-SMS system and image analysis used in this work. Y.Z. and J.B. are co-inventors of a US patent (11,209,367) relating to 4Pi-SMS microscopy.
The remaining authors declare no competing interests.
Code availability
PYME is available at https://python-microscopy.org/. PYME modules we have developed are shared at https://github.com/bewersdorflab. Code for simulating multi-emitters (Suppl. Fig. 2) and for screening docking strands (Suppl. Note 3) are available in the GitHub repository (https://github.com/bewersdorflab/fluorogenic-dna-paint-manuscript-supplement).
Data availability
The majority of datasets generated during and/or analyzed during the current study are available in the Zenodo repository, https://doi.org/10.5281/zenodo.6315337. Remaining raw datasets are available from the corresponding author on reasonable request.
References
- 1.Baddeley D & Bewersdorf J Biological Insight from Super-Resolution Microscopy: What We Can Learn from Localization-Based Images. Annu Rev Biochem 87, 965–989 (2018). [DOI] [PubMed] [Google Scholar]
- 2.Jungmann R et al. Single-molecule kinetics and super-resolution microscopy by fluorescence imaging of transient binding on DNA origami. Nano Lett 10, 4756–4761 (2010). [DOI] [PubMed] [Google Scholar]
- 3.Agasti SS et al. DNA-barcoded labeling probes for highly multiplexed Exchange-PAINT imaging. Chem Sci 8, 3080–3091 (2017). [DOI] [PMC free article] [PubMed] [Google Scholar]
- 4.Beliveau BJ et al. Single-molecule super-resolution imaging of chromosomes and in situ haplotype visualization using Oligopaint FISH probes. Nat Commun 6, 7147 (2015). [DOI] [PMC free article] [PubMed] [Google Scholar]
- 5.Jungmann R et al. Quantitative super-resolution imaging with qPAINT. Nature methods 13, 439–442 (2016). [DOI] [PMC free article] [PubMed] [Google Scholar]
- 6.Dempsey GT, Vaughan JC, Chen KH, Bates M & Zhuang X Evaluation of fluorophores for optimal performance in localization-based super-resolution imaging. Nature methods 8, 1027–1036 (2011). [DOI] [PMC free article] [PubMed] [Google Scholar]
- 7.Jungmann R et al. Multiplexed 3D cellular super-resolution imaging with DNA-PAINT and Exchange-PAINT. Nature methods 11, 313–318 (2014). [DOI] [PMC free article] [PubMed] [Google Scholar]
- 8.Liu N, Dai M, Saka SK & Yin P Super-resolution labelling with Action-PAINT. Nat Chem 11, 1001–1008 (2019). [DOI] [PMC free article] [PubMed] [Google Scholar]
- 9.Schlichthaerle T et al. Direct Visualization of Single Nuclear Pore Complex Proteins Using Genetically-Encoded Probes for DNA-PAINT. Angewandte Chemie 58, 13004–13008 (2019). [DOI] [PMC free article] [PubMed] [Google Scholar]
- 10.Schnitzbauer J, Strauss MT, Schlichthaerle T, Schueder F & Jungmann R Super-resolution microscopy with DNA-PAINT. Nature protocols 12, 1198–1228 (2017). [DOI] [PubMed] [Google Scholar]
- 11.Schueder F et al. Multiplexed 3D super-resolution imaging of whole cells using spinning disk confocal microscopy and DNA-PAINT. Nat Commun 8, 2090 (2017). [DOI] [PMC free article] [PubMed] [Google Scholar]
- 12.Schueder F et al. An order of magnitude faster DNA-PAINT imaging by optimized sequence design and buffer conditions. Nature methods 16, 1101–1104 (2019). [DOI] [PubMed] [Google Scholar]
- 13.Filius M et al. High-Speed Super-Resolution Imaging Using Protein-Assisted DNA-PAINT. bioRxiv, 2020.2002.2011.943506 (2020). [DOI] [PMC free article] [PubMed] [Google Scholar]
- 14.Lee J, Park S, Kang W & Hohng S Accelerated super-resolution imaging with FRET-PAINT. Mol Brain 10, 63 (2017). [DOI] [PMC free article] [PubMed] [Google Scholar]
- 15.Lee J, Park S & Hohng S Accelerated FRET-PAINT microscopy. Mol Brain 11, 70 (2018). [DOI] [PMC free article] [PubMed] [Google Scholar]
- 16.Auer A, Strauss MT, Schlichthaerle T & Jungmann R Fast, Background-Free DNA-PAINT Imaging Using FRET-Based Probes. Nano Lett 17, 6428–6434 (2017). [DOI] [PubMed] [Google Scholar]
- 17.Tyagi S & Kramer FR Molecular beacons: probes that fluoresce upon hybridization. Nat Biotechnol 14, 303–308 (1996). [DOI] [PubMed] [Google Scholar]
- 18.Tsourkas A, Behlke MA, Rose SD & Bao G Hybridization kinetics and thermodynamics of molecular beacons. Nucleic acids research 31, 1319–1330 (2003). [DOI] [PMC free article] [PubMed] [Google Scholar]
- 19.Clegg RM, Murchie AI, Zechel A & Lilley DM Observing the helical geometry of double-stranded DNA in solution by fluorescence resonance energy transfer. Proceedings of the National Academy of Sciences of the United States of America 90, 2994–2998 (1993). [DOI] [PMC free article] [PubMed] [Google Scholar]
- 20.Cock PJ et al. Biopython: freely available Python tools for computational molecular biology and bioinformatics. Bioinformatics 25, 1422–1423 (2009). [DOI] [PMC free article] [PubMed] [Google Scholar]
- 21.Zadeh JN et al. NUPACK: Analysis and design of nucleic acid systems. J Comput Chem 32, 170–173 (2011). [DOI] [PubMed] [Google Scholar]
- 22.Fisher PDE et al. A Programmable DNA Origami Platform for Organizing Intrinsically Disordered Nucleoporins within Nanopore Confinement. ACS Nano 12, 1508–1518 (2018). [DOI] [PMC free article] [PubMed] [Google Scholar]
- 23.Li Y et al. Real-time 3D single-molecule localization using experimental point spread functions. Nature methods 15, 367–369 (2018). [DOI] [PMC free article] [PubMed] [Google Scholar]
- 24.Huang F et al. Ultra-High Resolution 3D Imaging of Whole Cells. Cell 166, 1028–1040 (2016). [DOI] [PMC free article] [PubMed] [Google Scholar]
- 25.Zhang Y et al. Nanoscale subcellular architecture revealed by multicolor three-dimensional salvaged fluorescence imaging. Nature methods 17, 225–231 (2020). [DOI] [PMC free article] [PubMed] [Google Scholar]
- 26.Malkusch S et al. Coordinate-based colocalization analysis of single-molecule localization microscopy data. Histochemistry and cell biology 137, 1–10 (2012). [DOI] [PubMed] [Google Scholar]
- 27.Wade OK et al. 124-Color Super-resolution Imaging by Engineering DNA-PAINT Blinking Kinetics. Nano Lett 19, 2641–2646 (2019). [DOI] [PMC free article] [PubMed] [Google Scholar]
- 28.Strauss S & Jungmann R Up to 100-fold speed-up and multiplexing in optimized DNA-PAINT. Nature methods 17, 789–791 (2020). [DOI] [PMC free article] [PubMed] [Google Scholar]
- 29.Clowsley AH et al. Repeat DNA-PAINT suppresses background and non-specific signals in optical nanoscopy. Nat Commun 12, 501 (2021). [DOI] [PMC free article] [PubMed] [Google Scholar]
Method References
- 30.Stahl E, Martin TG, Praetorius F & Dietz H Facile and scalable preparation of pure and dense DNA origami solutions. Angewandte Chemie 53, 12735–12740 (2014). [DOI] [PMC free article] [PubMed] [Google Scholar]
- 31.Lin C, Perrault SD, Kwak M, Graf F & Shih WM Purification of DNA-origami nanostructures by rate-zonal centrifugation. Nucleic acids research 41, e40 (2013). [DOI] [PMC free article] [PubMed] [Google Scholar]
- 32.Nemoto Y & De Camilli P Recruitment of an alternatively spliced form of synaptojanin 2 to mitochondria by the interaction with the PDZ domain of a mitochondrial outer membrane protein. EMBO J 18, 2991–3006 (1999). [DOI] [PMC free article] [PubMed] [Google Scholar]
- 33.McGorty R, Kamiyama D & Huang B Active Microscope Stabilization in Three Dimensions Using Image Correlation. Opt Nanoscopy 2, 3 (2013). [DOI] [PMC free article] [PubMed] [Google Scholar]
- 34.Takakura H et al. Long time-lapse nanoscopy with spontaneously blinking membrane probes. Nat Biotechnol 35, 773–780 (2017). [DOI] [PMC free article] [PubMed] [Google Scholar]
- 35.Tyson J et al. Extremely Bright, Near-IR Emitting Spontaneously Blinking Fluorophores Enable Ratiometric Multicolor Nanoscopy in Live Cells. ACS Cent Sci 7, 1419–1426 (2021). [DOI] [PMC free article] [PubMed] [Google Scholar]
- 36.http://python-microscopy.org (2022). [Google Scholar]
- 37.Marin Z et al. PYMEVisualize: an open-source tool for exploring 3D super-resolution data. Nature methods 18, 582–584 (2021). [DOI] [PubMed] [Google Scholar]
- 38.Lin R, Clowsley AH, Jayasinghe ID, Baddeley D & Soeller C Algorithmic corrections for localization microscopy with sCMOS cameras - characterisation of a computationally efficient localization approach. Optics express 25, 11701–11716 (2017). [DOI] [PubMed] [Google Scholar]
- 39.Baddeley D, Jayasinghe ID, Cremer C, Cannell MB & Soeller C Light-induced dark states of organic fluochromes enable 30 nm resolution imaging in standard media. Biophysical journal 96, L22–24 (2009). [DOI] [PMC free article] [PubMed] [Google Scholar]
- 40.Baddeley D et al. 4D super-resolution microscopy with conventional fluorophores and single wavelength excitation in optically thick cells and tissues. PloS one 6, e20645 (2011). [DOI] [PMC free article] [PubMed] [Google Scholar]
- 41.Wang Y et al. Localization events-based sample drift correction for localization microscopy with redundant cross-correlation algorithm. Optics express 22, 15982–15991 (2014). [DOI] [PMC free article] [PubMed] [Google Scholar]
- 42.Nieuwenhuizen RP et al. Measuring image resolution in optical nanoscopy. Nature methods 10, 557–562 (2013). [DOI] [PMC free article] [PubMed] [Google Scholar]
- 43.Malkusch S & Heilemann M Extracting quantitative information from single-molecule super-resolution imaging data with LAMA - LocAlization Microscopy Analyzer. Sci Rep 6, 34486 (2016). [DOI] [PMC free article] [PubMed] [Google Scholar]
- 44.https://github.com/bewersdorflab/fluorogenic-dna-paint-manuscript-supplement/blob/main/simulate_ring_multiemitter.ipynb (2022). [Google Scholar]
- 45.https://github.com/bewersdorflab/fluorogenic-dna-paint-manuscript-supplement/blob/main/imagerb_docking_strand_screen.ipynb (2022). [Google Scholar]
- 46.Virtanen P et al. SciPy 1.0: fundamental algorithms for scientific computing in Python. Nature methods 17, 261–272 (2020). [DOI] [PMC free article] [PubMed] [Google Scholar]
Associated Data
This section collects any data citations, data availability statements, or supplementary materials included in this article.
Supplementary Materials
Supplementary Video 1: Fast 3D fluorogenic DNA-PAINT imaging ([imager probe A] =10 nM; 100 Hz; 10 min) of microtubules in a COS-7 cell without optical sectioning under widefield illumination. The hollow center of microtubules can be observed in both the XY and XZ planes when viewing 30-nm thick cross-sections. 1 μm scalebar.
Supplementary Video 2: (a) Raw images from fast astigmatic 3D fluorogenic DNA-PAINT imaging ([imager probe A] =10 nM; 100 Hz) of microtubules in a COS-7 cell under widefield illumination. (b) Live kymograph of the blinking within the dashed box in (a).
Supplementary Video 3: (a) Images from fast 2-color fluorogenic DNA-PAINT using imager probe A (10 nM; Cy3B; green) and imager probe B (1 nM; ATTO 643; magenta) to image the endoplasmic reticulum and mitochondria respectively (100 Hz; raw images from the two color channels were transformed and aligned for display). (b) Heatmap of pixel intensities. Negligible spectral cross-talk between the fluorophores (Cy3B and ATTO 643) was observed as indicated by the well resolved populations (green and magenta dashed line respectively).
Data Availability Statement
The majority of datasets generated during and/or analyzed during the current study are available in the Zenodo repository, https://doi.org/10.5281/zenodo.6315337. Remaining raw datasets are available from the corresponding author on reasonable request.


