

Abstract
Neurotoxicants may be widespread in the environment and can produce serious health impacts in the human population. Screening programs that use in vitro methods have generated data for thousands of chemicals. However, these methods often do not evaluate repeated or prolonged exposures, which are required for many neurotoxic outcomes. Additionally, the data produced by such screening methods may not include mechanisms which play critical biological roles necessary for in vivo neurotoxicity. The Hard-Soft Acid-Base (HSAB) in silico model focuses on chemical structure and electrophilic properties which are important to the formation of protein adducts. A group of structurally diverse chemicals have been evaluated with an in silico screening approach incorporating HSAB parameters. However, the predictions from the expanded chemical space has not been evaluated using in vivo methods. We selected three chemicals predicted to be cumulative toxicants, for in vivo neurotoxicological testing. Adult male Long-Evans rats were treated orally with citronellal (CIT), 3,4-dichloro-1-butene (DCB), or benzyl bromoacetate (BBA) for 8 weeks. Behavioral observations were recorded weekly to assess motor function. Peripheral neurophysiological measurements were derived from nerve excitability (NE) tests which involved compound muscle action potentials (CMAPs) in the tail and foot, and mixed nerve action potentials (MNAPs) in the tail. Compound nerve action potentials (CNAPs) and nerve conduction velocity (NCV) in the tail were also quantified. Peripheral inputs into the central nervous system were examined using somatosensory evoked potentials recorded from the cortex (SEPCTX) and cerebellum (SEPCEREB). CIT or BBA did not result in significant alterations to peripheral nerve or somatosensory function. DCB reduced grip-strength and altered peripheral nerve function. The MNAPs required less current to reach 50% amplitude and had a lower calculated rheobase, suggesting increased excitability. Increased CNAP amplitudes and greater NCV were also observed. Novel changes were found in the SEPCTX with an abnormal peak forming in the early portion of the waveforms of treated rats, and decreased latencies and increased amplitudes were observed in SEPCEREB recordings. These data contribute to testing an expanded chemical space from an in silico HSAB model for predicting cumulative neurotoxicity, and may assist with prioritizing chemicals to protect human health.
Keywords: Neurophysiology; Nerve Excitability; HSAB; Citronellal; 3,4-Dichloro-1-butene; Benzyl bromoacetate
1. Introduction
Environmental neurotoxicants have the potential to contribute to a variety of neurological diseases that impact humans worldwide. It has been estimated that every year approximately a 3% increase in new chemicals are introduced by the pharmaceutical, industrial, and agricultural sectors (Krimsky, 2017; Pool and Rusch, 2014; U.S. GAO, 2005; Wilson and Schwarzman, 2009), but it is unknown how many of these subsances may be toxicants. Because of this uncertainty, identification of neurotoxicants is crucial to protect humans. High-throughput screening initiatives, such as the Environmental Protection Agency’s (EPA) ToxCast program, have generated data for thousands of chemicals. While these in vitro screening methods can generate large amounts of data, that may include mechanistic details within adverse outcome pathways (AOPs), some authors have reported deficiencies in their ability to detect neurotoxicants (Shah and Greene, 2013; Silva et al., 2015). Other studies have indicated that these methods have lower sensitivity for specific chemical types, such as pharmaceutical drugs (Sirenko et al., 2019). Currently, chemicals that require metabolic activation or repeated exposures to produce toxicity may not be detected in current screening batteries (Knudsen et al., 2015; Silva et al., 2015). Because of such factors, in vivo studies remain critical for detecting and characterizing neurotoxicity, especially measuring functional changes that are relevant to adverse outcomes.
Computational models (in silico approaches), may assist with predicting toxicity. The Hard and Soft Acid-Base (HSAB) (Pearson, 1963, 2005) theory incorporates physiochemical parameters, such as softness (polarizability) and hardness (non-polarizability), to predict a chemical’s potential to target endogenous nucleophilic centers. Chemical reactions with nucleophilic proteins may result in adducts that compromise the normal biological function. The chemicals physiochemical parameters can be used to calculate an electrophilic index, which reflects the potential for reactions between xenobiotic electrophiles and biological nucleophiles to occur. While these chemical reactions can occur with appropriate proteins throughout the body, the accumulation of altered proteins in nerves can result in neurotoxicity.
Several in vivo and in vitro studies provide support for the HSAB theory to accurately predict neurotoxic effects of type II alkenes, such as acrylamide, acrolein, and methylvinyl ketone, chemicals containing α,β-unsaturated carbonyl derivatives (LoPachin et al., 2007a; LoPachin et al., 2006; LoPachin and DeCaprio, 2005; LoPachin and Gavin, 2014; LoPachin et al., 2007b). We have previously used the the HSAB theory to evaluate a set of structurally diverse chemicals, and prioritize a group of chemicals for additional neurotoxicological testing based on calculated electrophilic properties (Melnikov et al., 2020; Johnstone et al., 2020). The current work evaluates three of these chemicals to produce in vivo neurophysiological alterations after repeated exposures.
Citronellal (CIT), 3,4-dichloro-1-butene (DCB), and benzyl bromoacetate (BBA) are included in EPA/ToxCast Phase II list of chemicals, yet there are very few in vivo data on their possible neurotoxic effects. Based on the HSAB theory, CIT, DCB, and BBA have electrophilicity values within a range hypothesized to be relevant to cumulative neurotoxicity (Melnikov et al., 2020). CIT is an aldehyde that has the potential to react with nucleophilic centers on lysine residues via imine reactions (Fig. 1A). Research shows evidence of reduced nociception in mice after acute treatments (de Santana et al., 2013; Melo et al., 2010), reduced compound action potentials in ex vivo preparations of the sciatic nerves of mice or frogs (Quintans-Júnior et al., 2009; Ohtsubo et al., 2015), as well as induced cytotoxicity and alterations to neurite length using in vitro rat dorsal root ganglion (DRG) cultures (Johnstone et al., 2020). DCB is a non-type II alkene (Fig. 1B) and BBA is an ester (Fig. 1C), and both chemicals are predicted to have the potential to react with proteins that contain cysteine residues via nucleophilic substitution second order (SN2) reactions. (Melnikov et al., 2020). Additionally, DCB has shown to decrease mean firing rate (MFR) in microelectrode array recordings in in vitro rat DRGs (Johnstone et al., 2020).
Figure 1.

Chemical structures of the three compounds selected for in vivo testing. A.) Citronellal is an aldehyde. B.) 3,4-Dichlorobutene is an alkene. C.) Benzyl bromoacetate is an ester.
In the present series of studies, adult male rats were exposed to CIT, DCB, or BBA for a total of eight weeks. Behavioral observations were conducted weekly to determine possible phenotypical endpoints and adverse outcomes. Nerve excitability (NE) tests on motor and mixed axons were conducted for evaluation of effects on peripheral nerve function, as well as recordings of compound nerve action potentials (CNAPs) and measurements of nerve conduction velocity (NCV). Somatosensory evoked potentials (SEPs) were recorded over the cortex and cerebellum in order to analyze both peripheral and somatosensory function. These behavioral and in vivo neurophysiological methods were used to test the HSAB in silico predictions of cumulative neurotoxicity.
2. Methods
2.1. Animals and treatment
Adult male Long-Evans rats (Charles River Laboratories, Raleigh, NC) were received at ~9 weeks (PND 60) of age for the CIT and DCB studies, and PND 30 – PND 60 for the BBA study. The PND 30 animals were aged in-house to PND 60 before beginning the study. Rats were housed in polycarbonate cages in groups of two, until transfer to single housing for physiological testing and surgical procedures. Animals were identified by marking their tails with a permanent marker. Cages were equipped with external hanging cards for identification, heat-treated shaved pine bedding, Enviro Dri® nesting material (Shepherd Specialty Papers, Watertown, TN) for environmental enrichment, and ad libitum access to water and food (Purina 5001 Chow, PMI Nutrition International, Richmond, IN). Animal colony conditions were maintained at 21 ± 1°C, 50 ± 10% relative humidity, and 12-hour light-dark cycle (lights on at 6:00 am). This facility follows National Institutes of Health guidelines for animal care and is accredited by the American Association for Accreditation of Laboratory Animal Care International. All protocols were approved by the Office of Resource Management, Office of Research and Development Institutional Animal Care and Use Committee.
In three separate studies, animals were treated with CIT, DCB, or BBA for a total of 8 weeks. CIT (Sigma Aldrich, St. Louis, MO; CAS 106-23-0; Purity ≥ 95%; DTXSID3041790) treatments were 0, 79, 104, or 116 mg/kg/day, equivalent to 0.000, 0.514, 0.675, or 0.752 mmol/kg/day (n = 14–20 animals/treatment). DCB (TCI America, Boston, MA; CAS 760-23-6; Purity ≥ 90%; DTXSID8022113) treatments were 0, 100, 175, or 225 mg/kg/day, equivalent to 0.000, 0.800, 1.400, or 1.800 mmol/kg/day (n = 16–20 animals/treatment). BBA (Sigma Aldrich; CAS 5437-45-6; Purity 96%; DTXSID4040343) treatments were 0, 65, 75, or 90 mg/kg/day, equivalent to 0.000, 0.284, 0.327, or 0.393 mmol/kg/day (n = 10–20 animals/treatment). Doses were selected based on pilot studies which were designed to avoid acute lethality or a maximal dose of approximately 30% or reported LD50 values (when available).
Rats were weighed daily, then dosed via oral gavage (1 mL/kg) except for days they underwent physiological testing or surgery. Dosing occurred after making behavioral observations. Treatment solutions were prepared in corn oil vehicle (Mazola, ACH Food Companies, Inc., Chicago, IL) twice a week. The parent chemical was stored under nitrogen, both the pure chemical and dosing solutions were stored in a cool, dry, well-ventilated cabinet, protected from light.
2.2. Behavioral observations
A modification of the Functional Observational Battery (FOB) protocol was used to make behavioral observations once per week (McDaniel and Moser, 1993). The rat was removed from the cage and placed on the top of a laboratory cart which was lined with absorbent paper (changed between each animal) to explore for 3 minutes (open field). The observer assessed and scored the rat’s body posture, gait characteristics, activity level and arousal. The number of rears was also recorded. Next, the aerial righting reflex, and the proprioceptive positioning reaction of a forelimb and hindlimb paw were scored. Forelimb and hindlimb grip strength were measured using a digital force instrument (Chatillon Model DPP-1.0 kg, JA King Co, Greensboro, NC) followed by landing foot splay. Any findings that could impact the data were noted (for example, torn toenails). All tests were conducted by the same observer who had no knowledge of the treatment group for each animal.
2.3. Nerve Excitability (NE)
During the 6th week, peripheral nerve excitability was measured using a PC system with QTRAC software (QTRACW©, Prof Hugh Bostock, UCL) (Bostock et al., 1998; Kiernan et al., 2000; Krishnan et al., 2009; Tomlinson et al., 2018). Using the TRONDF multiple measures of nerve excitability protocol (formalized in 1999 in Trondberg, Norway and described in Kiernan et al., 2000), three types of endpoints were recorded: tail compound muscle action potentials (CMAPs), foot CMAPs, and mixed nerve action potentials (MNAPs). The computer-controlled stimulus was delivered using NI USB-6221 D/A converter (National Instruments, Austin, TX) and a DS5 bi-phasic constant-current stimulus isolator (output range of +/−10mA; Digitimer, Hertfordshire, UK). Surface 0.25 inch Ag/AgCl disc electrodes (Gereonics Inc., Irvine CA) and electrolytic gel (Signa Gel, Parker Laboratories, Inc., Fairfield, NJ) were used for CMAP stimulation, and stainless steel needle electrodes were used for MNAP stimulation (Natus Neurology, Middleton, WI) (electrode placements can be found in Table 1). Biological responses were recorded using stainless steel needle electrodes (Natus Neurology). A disposable ring electrode was used as a grounding electrode (Natus Neurology). Stimuli were presented between approximately 1 – 1.7 Hz, depending on the stimulus paradigm. The signals were pre-amplified (100 – 10,000X) and high-pass filtered at 3 Hz (Neurolog NL844; Digitimer), isolated and further amplified (1 – 5X; Neurolog NL820A, Digitimer), low pass filtered at 2,000 Hz (12 dB/octave; Neurolog NL125/ NL126, Digitimer), a Humbug 50/60 Hz noise eliminator (Quest Scientific, Digitimer), and were digitized at 16 bit and 10 kHz using a NI USB-6221 A/D converter (National Instruments). Final amplification for CMAPs was 500 or 1,000, and 10,000 for MNAPs. Data were recorded on the PC using QTRAC© software. Testing occurred inside of a custom-built Faraday cage.
Table 1.
Stimulus and recording electrode information.
| Response | Stimulating Electrode Type | Active Electrode | Reference Electrode | Cathode Location | Anode Location | Ground Location |
|---|---|---|---|---|---|---|
| Tail CMAP | Ag+/Ag+ Cl Surface | 60 mm1 | 65 mm | Tail | Thigh | Tail2 |
| Foot CMAP | Ag+/Ag+ Cl Surface | ~21 mm1* | ~26 mm* | Ankle | Thigh | Tail2 |
| Tail MNAP | 26 ga Needle | 20 mm PH1,3 | 0 mm PH | 100 mm PH | 110 mm PH | Tail2 |
| SEPCORTEX | 25 ga Needle | 2 mm PB4, 2 mm LL | 7 mm AB, 2 mm LR | 8 cm PH | 9 cm PH | Tail5 |
| SEPCEREBELLUM | 25 ga Needle | 3 mm PL4, 0 mm L | 7 mm AB, 2 mm LR | 8 cm PH | 9 cm PH | Tail5 |
| CNAP1 and CNAP2 | 25 ga Needle | 4 mm PH6 | 1 mm PH | 8 cm PH, 11 cm PH | 9 cm PH, 12 cm PH | Tail5 |
Recording electrodes: 26 ga needle, distance from the cathode
Ground electrode: ~3 cm PH, ring electrode
PH = posterior to hairline of tail, PB = posterior to Bregma, AB = anterior to Bregma, LL = lateral left of Bregma, LR = lateral right of Bregma, PL = posterior to Lambda, L = lateral to midline
Recording electrodes: 0.8 mm2 screw
Ground electrode: ~6 cm PH, 30 ga needle electrode
Recording electrodes: 25 ga needle
Nerve excitability testing was performed under isoflurane anesthesia (Precision Anesthesia Vaporizer, Highland Medical Equipment, Temecula, CA). The rat was placed in an induction chamber and anesthetized with an isoflurane concentration of 4–5% and a flow rate of 1–2 L/min. Once the rat was thoroughly anesthetized (after ~15 minutes), responsiveness was tested with a toe pinch, and the hair around the thigh and groin area was trimmed. The rat was then placed on a positive feedback heating pad (TCAT-2DF controller, HP1M heating pad, Physitemp Instruments Inc., Clifton, NJ) maintained at 37°C and a feedback loop rectal thermometer was inserted. The animal’s anesthesia was maintained using a face mask (isoflurane set to 3–3.5% during electrode preparation and 2–2.5% during testing, with a 1–2 L/min flow rate). Heart rate and oxygen level were monitored using a pulse oximeter (Nonin Medical Inc., Plymouth, MN) and respiratory rate could be observed by a balloon connected to the face mask.
Electrode stimulating sites on the animal’s thigh/groin and tail were scrubbed (Mavidon Lemon Prep Abrasive Skin Prepping Lotion, Mavidon, Lake Worth, FL) and cleaned with 70% isopropyl alcohol (Electro Prep pads, Professional Disposables International, Inc., Orangeburg, NY). The types of electrodes used and electrode placement for CMAPs and MNAPs can be found in Table 1.
Stimuli were applied to the caudle nerves of the tail for CMAP and MNAP recordings, and the sciatic nerve for foot CMAP recordings. The maximum response was determined. In these studies, 40% of the maximum response was used as the tracking level throughout NE testing. Excitability of the axon was measured by applying a depolarizing or hyperpolarizing current with varying durations and magnitudes to alter the axonal membrane potential, then tracking the percent change in stimulus intensity required to reach the tracking level. For this study, stimulus-response (SR), stimulus-duration time-constant (SDTC), threshold electrotonus (TE), current/voltage relationship (I/V), and recovery cycle (RC) were measured. If responses appeared to have artifacts, the test was run a second time. At the end of testing, tail or foot surface temperature (Fluke Model 561 IR Thermometer, Fluke Corp., Everett, WA), and core temperature were recorded. All procedures for each animal were completed in approximately 45 minutes. All variables and averages are calculated by the QTRAC program and data was exported into Excel for analysis.
2.3.1. Stimulus-response (SR)
A SR curve was generated by using a depolarizing pulse of 1 ms (CMAPs) or 0.5 ms (MNAPs) starting at 0 mA and increasing in 2% steps until the biological response has reached a maximal value. The target amplitude of 40% maximal (± 6%) was determined for threshold tracking purposes, which is on the steepest region of the SR curve (Bostock et al., 1998) and allows detection of changes altering thresholds. The current required for 50% maximal response (MA50), and the slope of the SR curve were quantified.
2.3.2. Stimulus-duration time constant (SDTC) and Rheobase (RHEO)
The SDTC (similar to chronaxie) was determined by applying depolarizing currents that are reduced from a 1 ms stimulus to 0.2 ms in 0.2 ms steps (CMAPs ), or from 0.5 ms stimulus to 0.1 ms in 0.1 ms steps (MNAPs), and measuring the current required to produce the criterion response amplitude. At the end of the recording, the data were transformed according to Weiss’ law (Bostock, 1983; Mogyoros et al., 1996; Weiss and Weiss, 1901), and fit to a straight line. Rheobase (RHEO) was quantified as the slope of the line, and the stimulus-duration time constant (SDTC) was estimated from the x-intercept. These parameters reflect persistent nodal Na+ channel activity, which can be altered by the distribution of the size of the nerve fibers and their state of depolarization (Bostock and Rothwell, 1997).
2.3.3. Threshold electrotonus (TE)
The TE response was measured by stimulating the axonal membrane with 100ms subthreshold polarizing currents set to ±40% and ±20% of the control threshold current (Bostock and Baker, 1988). The delay between the subthreshold and threshold current shifts from −10ms to +190ms, with each time-shift occuring after 3 stimuli have been accepted as accurate threshold estimates. The average threshold reduction in response to the 40% depolarizing current was quantified after a 10–20ms delay (TED10), 40–60ms delay (TED40), and 90–100ms delay (TED90), and reflect both nodal and internodal conductances (Bostock et al., 1998; Burke et al., 2001). After a depolarizing pulse there is a reduction in threshold that gradually returns toward baseline excitability. This process is known as accommodation and reflects activity in nodal and internodal slow K+ channels (Baker et al., 1987; Trevillion et al., 2007). This process was quantified as the accommodation (S2) and accommodation halftime (ACCOM) variables. At the end of the 100 ms pulse, the threshold returns to baseline, and may increase, as slow K+ channels are inactivated. The threshold increase after the hyperpolarizing pulses were calculated after 10–20ms (TEH10), 20–40ms (TEH20), and 90–100ms (TEH90), which increases for the later measures due to closing of slow K+ channels (Burke et al., 2001).
2.3.4. Current/threshold relationship (I/V)
The I/V is measured by stimulating the axonal membrane with 200ms subthreshold currents, which ramps from +50% (depolarizing currents) to −100% (hyperpolarizing currents) of the criterion threshold in 10% steps. Each current shift occurs after 3 stimuli have been accepted as accurate threshold estimates. This test reflects nodal and internodal rectification properties of the nerve. The depolarizing pulse activates outward rectifying fast and slow K+ channels. The hyperpolarizing pulses activate the inward rectification current (IH). Dependent measures include the resting I/V slope (IVSLPR), calculated as the slope of the curve where stimulation switches from −10% to +10%. Inwardly rectifying cation IH channels are measured as the minimum slope (IVSLPM), and the hyperpolarizing slope (IVHYPER) is calculated from the last three points of the curve in the bottom left quadrant.
2.3.5. Recovery cycle (RC)
The RC is measured by applying a supramaximal conditioning stimulus, then recording excitability changes to a test stimulus at intervals from 200ms to 2ms after the conditioning stimulus (Bostock et al., 1998; Kiernan et al., 2000). Inactivation of Na+ channels are reflected by the relative refractory period (RRP) where the curve first intersects the x-axis. At greater inter-stimulus intervals, the nerve becomes more easily excitable which is reflected by the measure of superexcitability (SUPERE) period. This phenomenon is related to the depolarizing after-potential from an action potential, which in turn, is related to discharge of current under the myelin sheath (Barrett and Barrett, 1982; Burke et al., 2001). The extent of superexcitability is dependent on the internodal capacitance and will change if the function of fast paranodal K+ channels is altered. The later subexcitability (SUBE) is influenced by the function of activation of slow K+ channels, which close during an action potential.
2.4. Surgery
Animals underwent surgeries during the 7th week to allow assessment of nerve function in the somatosensory cortex and cerebellum, as previously described (Boyes et al., 2014; Herr et al., 2016; Herr et al., 2007). Animals were anesthetized with isoflurane and implanted with epidural cranial stainless screw electrodes (00–90 × 1/16 in., 0.8mm2 surface area). Electrode placement can be found in Table 1.
At the onset of surgery, animals were given a subcutaneous injection (1mL/kg) of 5 mg/kg of Rimadyl (Zoetis Inc., Kalamazoo, MI). After the surgery was complete, the incision was treated with USP Neomycin and Polymyxin B Sulfates and USP Bacitracin Zinc Ophthalmic Ointment (Bausch + Lomb, Tampa, FL), and animals were administered a subcutaneous injection of USP 0.9% Sodium-Chloride (Hospira Inc., Lake Forest, IL). Animals received one 5g food pellet containing 2mg of Rimadyl (Bio-Serve, Frenchtown, NJ) for two days following surgery. Animals were allowed at least five days to recover before further neurophysiological testing.
2.5. Somatosensory Evoked Potentials (SEPs), Compound Nerve Action Potentials (CNAPs), and Nerve Conduction Velocity (NCV)
Somatosensory function from the cortex (SEPCTX) and cerebellum (SEPCEREB), CNAPs, and NCV were measured during the 8th week. An evoked potential system on a PC-based platform was used to collect data from non-anesthetized rats, as previously described (Boyes et al., 2014; Hamm et al., 2000; Herr et al., 2016; Herr et al., 2007). The system was calibrated by passing signals of known frequency and amplitude through the entire system before each study. Calibration factors were calculated and stored for automated application to the neurophysiological signals, and the correct function of the stimulators were checked before testing.
Two days prior to testing, animals were habituated to decapicone restraints with head and tail protruding. Each animal was restrained while awake and placed in their home-cage for 5 minutes on the first day, and 15 minutes on the second day. Testing was performed on non-anesthetized, restrained subjects, placed in a custom-built Velcro strap assembly inside of a sound attenuated Faraday box with a testing apparatus (Herr et al., 2004; Herr et al., 2016; Herr et al., 2007). The animal’s tail was wiped with a 70% isopropyl alcohol pad and placed in a Teflon tray with semicircular tapered groove milled into the base and top portions. Needles were wiped with alcohol pads between each subject. Needle electrodes protruded from the tray and penetrated the tail 1.5mm. Electrode locations can be found in Table 1. A needle ground electrode was inserted dorsally. Biphasic stimulation (100 μs biphasic square wave, anodal followed by cathodal, 50 μs each polarity; at 0.91 Hz) of the ventral caudal tail nerves occurred with intensities of 1, 2, and 3 mA, the order of which was randomized between subjects. This procedure ensures that evoked responses show stimulus intensity-related changes that can be quantified. SEPs and the first CNAP were recorded from the first stimulus, and a second CNAP was recorded with a second stimulus for calculation of NCV. Tail near nerve temperature was recorded during presentation of each stimulus intensity using a 26 ga needle thermistor (MT-26/2) located midway between the stimulating cathodes (10 cm post-hairline) and a TH-8 thermometer ( Physitemp Instruments Inc). Biological signals were amplified 10,000X, bandpass filtered (0.1 – 10,000 Hz; ½ amplitude frequency, 6 dB/octave rolloff), and response for 100 trials were averaged. Peak amplitudes and latencies were measured using the individual animal average waveforms. Peak amplitudes (in μV) were calculated from baseline (defined as the average voltage over the pre-stimulus period) for SEPs, and as peak-to-peak amplitudes for CNAPs (to compensate for occasional stimulus-related baseline offsets). Peak latencies (in ms) were calculated from the onset of the stimulus. The duration and area of the negative peak of CNAPs (N1) were calculated. NCV was calculated as the latency difference between the first positive peak of the two CNAPs from the 3 mA stimulus condition, divided by the distance between the two cathodes (3 cm) (Herr et al., 2004).
2.6. Statistical Analysis
Dependent variables were examined for normality using the Shapiro-Wilk test (p < 0.05) (Shapiro and Wilk, 1965) as implemented in SAS v9.4 (SAS Institute, Cary, NC). A data point was investigated if it was greater than 3 interquartile distances above or below the 25th or 75th sample percentages. If the selected result was judged to be related to an improper scoring of the data, a verification of the proper value was made. If the data was judged to be non-normal, the dependent measure was either log transformed to achieve normality and analyzed using PROC MIXED, analyzed under the assumption of a non-normal distribution using PROC GLMMIX (Poisson distribution, log link function), or a non-parametric Kruskal-Wallis analysis (Breslow, 1970; Elliott and Hynan, 2011; Kruskal, 1952) was used. Nominal data from behavioral observations were analyzed using PROC CATMOD. Parametric analysis was performed using various covariance structures (UN, AR(1), ARH(1)). The best fitting model was selected based on AICC values (Akaike, 1973; Burnham and Anderson, 2004). To help control the Type I error rate due to the number of dependant measures, a False Discovery Rate (FDR) correction (Benjamini and Hochberg, 1995, 2000; Benjamini and Yekutieli, 2001) was used when assessing treatment-related effects for variables associated within a given type of biological response (e.g. nerve excitability, SEPCTX, etc…). The critical alpha level for the FDR was set at 0.05. Dose-related trends were evaluated using a Jonckheere-Terpstra Trend test (Hollander and Wolfe, 1999; Pirie, 2004; Weller and Ryan, 1998). Appropriate step-down analysis was used to further examine effects. Post hoc comparisons were performed using Tukey-Kramer (Kramer, 1956) or the non-parametric Dwass, Steel, Critchlow-Fligner multiple comparison procedure (Douglas and Michael, 1991; Dwass, 1960; Steel, 1960). Dose was a between-subject factor, and stimulation intensity was a within-subject factor for the evoked potential data. Group average waveforms were made as statistical analysis deemed appropriate. Graphs were made using SigmaPlot v14 (Systat Software, San Jose, CA).
3. Results
Because of the differences in body weights at the start of dosing between the three studies, the body weight data was analyzed as a percentage change from the first day of the study. This allows for easier comparisons between experiments.
3.1. Citronellal (CIT)
All treatment groups gained weight over the course of 8 weeks (Week Effect: F[7,42] = 260.48, p < 0.0001) (Fig. 2A). The rate of weight gain was not altered by treatment with CIT (p-value = 0.081). On the 8th week, the animal’s percentage of weight gain since the first day averaged over all treatments was 63.2 ± 1.4%. The pre-dosing weights for the treatment groups were: 327.0 ± 3.3 (0 mg/kg/day), 330.8 ± 3.0 (79 mg/kg/day), 329.3 ± 2.6 (104 mg/kg/day), and 334.0 ± 2.2g (116 mg/kg/day).
Figure 2.

Mean body weight calculated as percent of pre-dosing day 1 weight. Bars represent standard error. Missing error bars are contained within the symbols. A.) Citronellal (CIT): (n = 14–20 rats/treatment) animals treated with 0, 79, 104, or 116 mg/kg/day of CIT. No significant treatment-related changes in body weight were observed. B.) 3,4-Dichloro-1-butene (DCB): (n = 16–20 rats/treatment) for animals treated with 0, 100, 175, or 225 mg/kg/day of DCB. Groups treated with DCB gained significantly less weight than control animals starting at week 1, and throughout the 8-week dosing period. C.) Benzyl bromoacetate (BBA): (n = 10–20 rats/treatment) for animals treated with 0, 65, 75, and 90 mg/kg/day of BBA. Groups treated with BBA gained less weight than controls. **High- and middle-dose significant from controls; ***High-, middle-, and low-dose significant from controls; #High-dose significant from low-dose; # #High- and middle-dose significant from low-dose; +High-dose significant from middle-dose.
Treatment with CIT decreased grip strength over the dosing period when averaged over weeks. Both forelimb (Dose Effect: F[3,467] = 6.25, p = 0.0004) and hindlimb (Dose Effect: F[3,518] = 5.65, p = 0.0008) grip strength measures were affected. The 79 mg/kg/day group had less forelimb grip strength than the other treatment groups (Suppl. Fig. 1A). In contrast, the 104 mg/kg/day group had lower hindlimb grip strength than controls (Suppl. Fig. 1B). However, neither of these results were dose- or time-related. No significant changes were indicated for hindlimb splay or number of open field rears.
Treatment with CIT did not affect nerve excitability measurements from tail CMAPs (Suppl. Fig. 2), foot CMAPs (Suppl. Fig. 3), or tail MNAPs (Suppl. Fig. 4).
Treatment with CIT did not alter tail CNAP peak-to-peak amplitudes, latencies, area, or NCV. The CNAP responses were under stimulus control as evidenced by intensity-related changes for latencies of peaks P1, N1, and P2, peak-to-peak amplitudes of peaks P1N1 and N1P2, as well as the area of peak N1 (p-values ≤ 0.0423) (Suppl. Fig. 5A). The tail NCV recorded between the two stimulations sites was 31.2 ± 0.5 m/s (Suppl. Fig. 5B). Tail nerve temperature was also not affected by treatment and averaged 23.6 ± 0.1 °C.
No alterations in peak amplitudes or latencies were indicated in SEPs recorded from the cortex or cerebellum after treatment with CIT. The evoked responses were under stimulus control, as indicated by significant effects of stimulus intensity for SEPCTX peak latencies (N27, P36, N53) and amplitudes (P14, N27, N53, N96) (p-values ≤ 0.0183) (Suppl. Fig. 6A). Similarly, the stimulus intensity altered SEPCEREB waveform peak P14 latency and amplitudes of peaks N24 and P55. (p-values ≤ 0.0034) (Suppl. Figs. 6B).
3.2. 3,4-Dichloro-1-butene
Groups treated with DCB gained less weight than control animals starting at week 1, with suppression in weight-gain continuing throughout the 8 weeks (DCB x Week Effect: F[21,123] = 8.36, p < 0.0001) (Fig. 2B). All treatment groups gained less weight than controls over all 8 weeks. Additionally, the 225 mg/kg/day group weighed less than the 100 mg/kg/day group over all 8 weeks, and less than the 175 mg/kg/day group on weeks 3, 4,5, and 8. The percentage weight gain ranged from 37.9 ± 1.5 (controls) to 15.0 ± 1.5% (225 mg/kg/day). The pre-dosing weights for the treatment groups were: 324.3 ± 2.6 (0 mg/kg/day), 320.6 ± 2.7 (100 mg/kg/day), 321.2 ± 3.9 (175 mg/kg/day), and 318.0 ± 3.0g (225 mg/kg/day).
Treatment with DCB led to changes in several behavioral measures. Both forelimb (F[3,541] = 3.62, p = 0.0130) (Fig. 3A) and hindlimb grip strength (F[3,541] = 12.09, p ≤ 0.0001) (Fig. 3B) were reduced in the 100 and 225 mg/kg/day groups, and these changes did not vary over the 8 week testing period (DCB Main Effects). Additionally, the 225 mg/kg/day group had less hindlimb grip strength compared to the 175 mg/kg/day group. Some differences between open-field activity were also observed on week 7, showing the 175 mg/kg/day group to be more active than the 100 and 225 mg/kg/day groups (DCB x Week Effect: X2[35.85] = 0.0227, p = 0.0058). However, these differences were not significant from controls or dose-related, and they were not observed on other weeks. Neither the hindlimb splay nor open field rearing were affected by treatment with DCB.
Figure 3.
Effect of 3,4-Dichloro-1-butene (DCB) on grip-strength. A.) Forelimb grip strength: Treatment decreased forelimb grip strength when averaged over weeks at 100 and 225 mg/kg/day. B.) Hindlimb grip-strength: Treatment decreased hindlimb grip strength when averaged over weeks, similarly to forelimb grip strength. * = significant from controls; # = significant from 175 mg/kg/day.
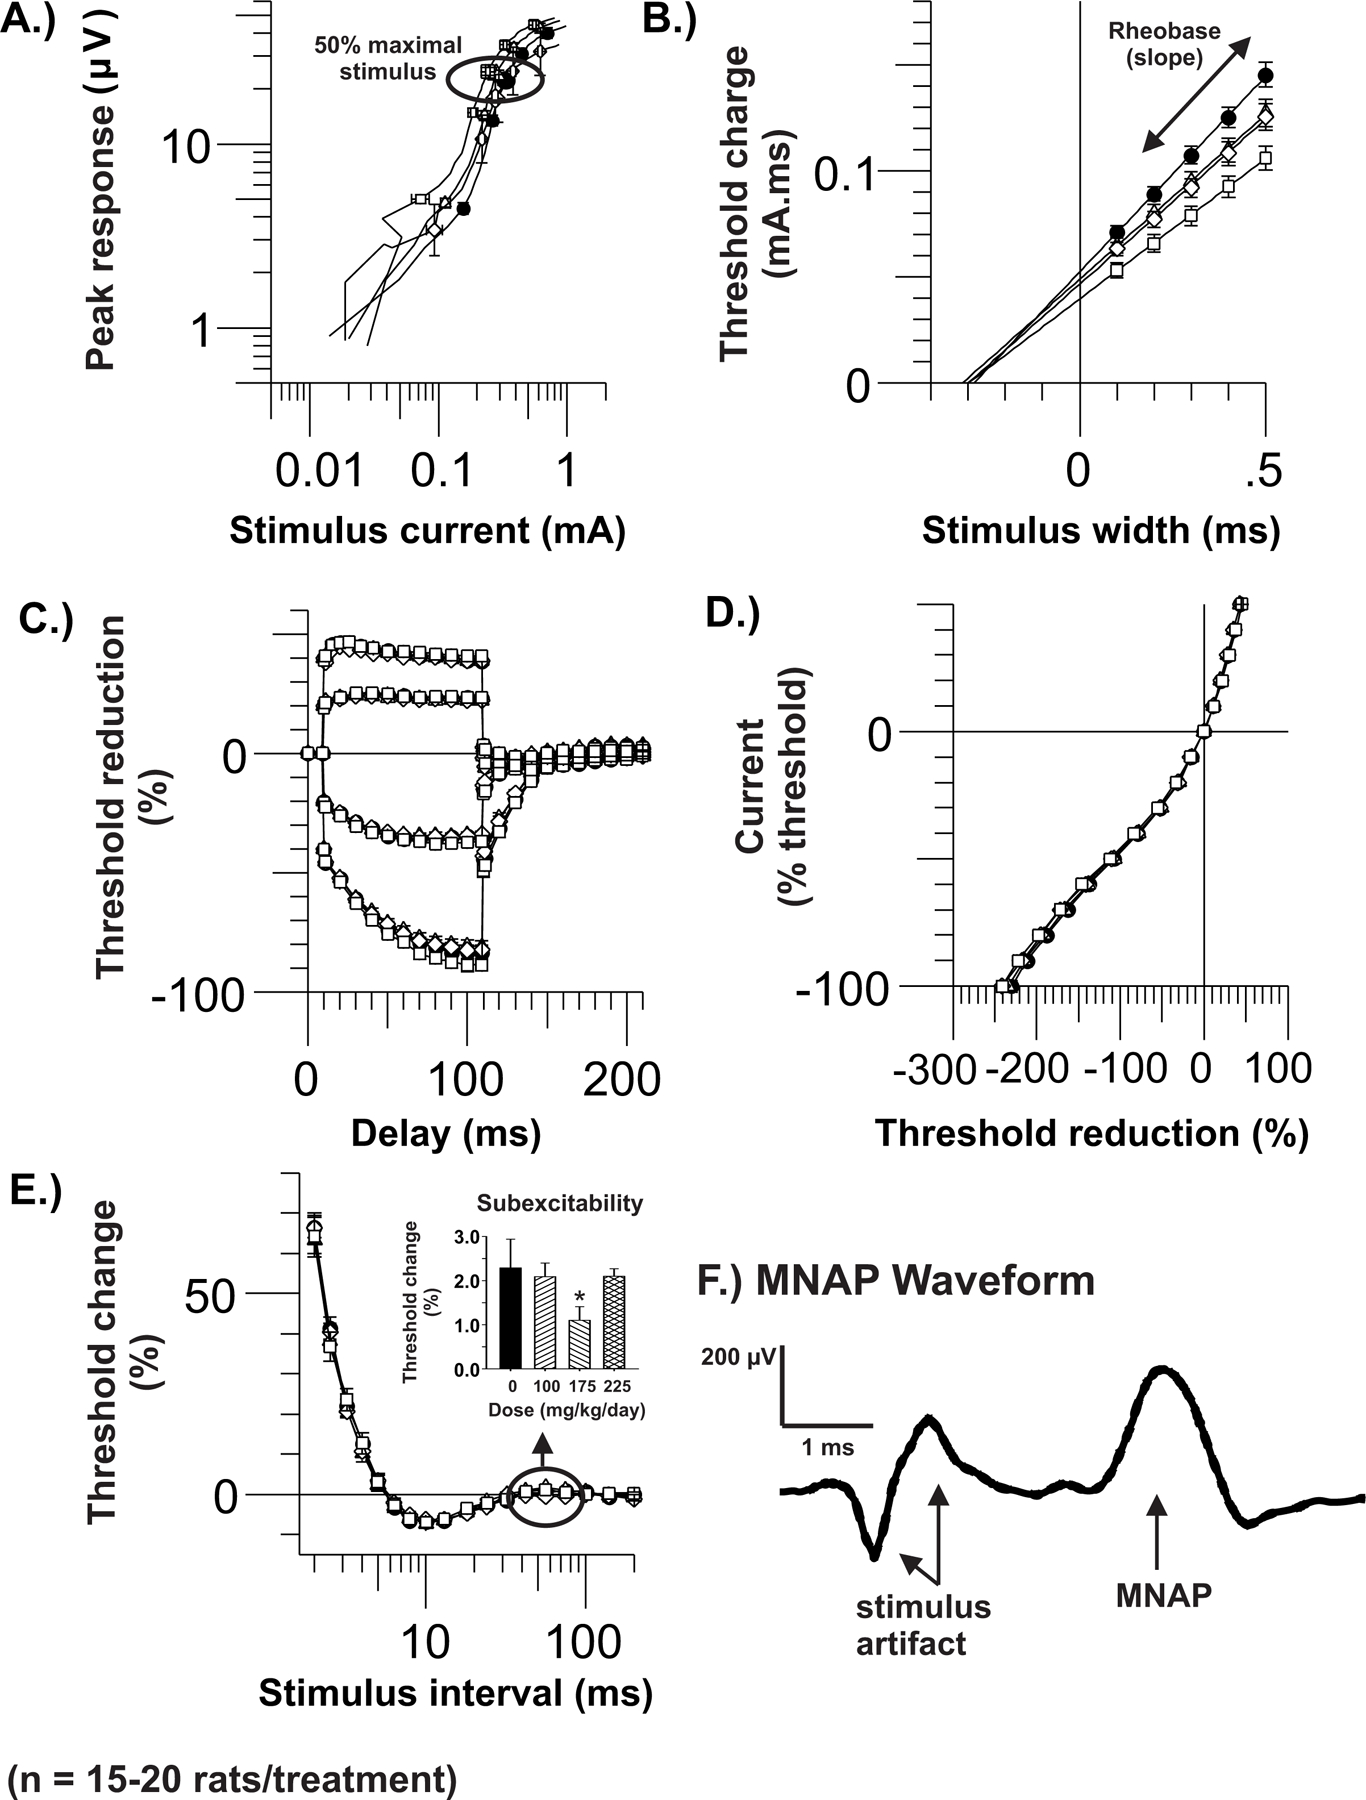
Treatment with DCB altered tail MNAP nerve excitability measurements (Fig. 4), but not tail or foot CMAP measures (Suppl. Figs. 2,3). SR measurements in the tail mixed nerves suggested an increase in excitability as indicated by reduced MA50 values in all of the DCB treatments compared to controls (DCB Effect: F[3,66] = 8.51, p ≤ 0.0001). In the SDTC test, the 100 and 225 mg/kg/day groups had lower RHEO values when compared to controls (DCB Effect: F[3,66] = 7.38, p = 0.0002). SUBE measures in RC measures indicated less subexcitability in the 175 mg/kg/day group than in the other treatments (DCB Effect: F[3,53] = 5.12, p = 0.0035), however, this result was not strictly dose-related and may need careful interpretation.
Figure 4.

Mean nerve excitability data (± SE) derived from tail mixed-nerve action potentials (MNAPs) using a 40% target threshold to tail caudal mixed-nerves after treatment with 3,4-dichloro-1-butene (DCB) (n = 15–19 rats/curve). A.) Stimulus-Response (SR): All treatment levels had a reduction in the current required to induce 50% of maximal action potential. B.) Strength-Duration Time Constant (SDTC): Treatment of 100 and 225 mg/kg/day had a lower SDTC than controls. C.) Threshold Electrotonus (TE): Data showed no changes to threshold in response to depolarizing or hyperpolarizing currents. D.) Current-Voltage Relationship (I/V): Data showed no changes to depolarizing or hyperpolarizing stimuli. E.) Recovery Cycle (RC): Less subexcitability was found in the 175 mg/kg/day group compared to the other treatments.
Treatment with DCB produced changes in the mixed nerve action potentials (Fig. 5). No changes in any CNAP peak latencies or the area of peak N1 were found (p-values ≥ 0.05). However, the peak-to-peak amplitude of P1N1 was increased by treatment with 225 mg/kg/day DCB compared to controls when averaged over stimulus intensities (DCB Effect: F[3,65] = 3.97], p = 0.0117). An increase in the peak-to-peak amplitude of N1P2 was observed when using a 2 or 3 mA stimulus intensity (DCB x Intensity Effect: F[3,66.6] = 3.78, p = 0.0145). As expected, an increase in stimulus intensity decreased the latencies of peaks P1, N1, P2, and increased the peak-to-peak amplitudes and areas of peaks P1N1, N1P2, and N1 (p-values ≤ 0.0294). Tail nerve temperature was not altered by treatment with DCB (p = 0.0607). Treatment with DCB increased the NCV in the 225 mg/kg/day group (34.6 ± 1.6 m/s) compared with controls (29.7 ± 0.6 m/s) (DCB Effect: F[3,63] = 3.01, p = 0.0127].
Figure 5.

Average compound nerve action potential (CNAP) waveforms (shaded regions represent the 95% confidence intervals) following evoked stimulation to tail caudal nerves after treatment with 3,4-dichloro-1-butene (DCB) (n = 12–20 rats/waveform). A.) CNAP1: Peak averages, with peaks P1 and N1 labeled, following a 1, 2, or 3 mA stimulus. As expected, an increase in stimulus intensity increased the peak latencies and decreased the peak-to-peak amplitudes. B.) Nerve Conduction Velocity (NCV) at 3mA: NCV measurements were based on latency difference of P1 peaks in CNAP1 and CNAP2. C.) P1N1 Peak Amplitude: Treatment of 225 mg/kg/day increased the peak-to-peak amplitude of peak P1N1 when averaged over stimulus intensities. D.) NCV: Treatment of 225 mg/kg/day increased NCV. * = significant from controls.
Treatment with DCB produced novel changes in the potentials recorded from the somatosensory cortex. None of the usual peak amplitudes or latencies of peaks were altered (Fig. 6A). However, when examining waveforms from individual animals, an additional peak (which we named peaks N1 and P1 for analysis) was observed between peaks P14 and N27 (Fig. 6B). To analyze the dose-related presence of this new peak the average peak-to-peak amplitude of manually scored peak P14-N1 amplitude + 2 standard deviations in control animals was used as a presence/absence cut-off for all animals, resulting in a binary (0,1) classification. A dose-related increase in occurrence was indicated for the 1, 2, and 3 mA stimulus intensities by a Jonckheere-Terpstra Trend Test (p-values ≤ 0.0076). Further analysis using a Kruskal-Wallis analysis followed by the Dwass, Steel, Critchlow-Fligner multiple comparison procedure showed at the 2 mA stimulus intensity, there were more occurrences of the new peak in the 225 mg/kg/day group compared to controls, and for the 3 mA stimulus the occurrence was greater in 225 mg/kg/day than in all of the other treatment groups. When averaged over stimulus intensities, the latency of the new peak N1 was greater in the 175 and 225 mg/kg/day groups than in controls, and was greater in 225 than the 100 mg/kg/day group (DCB Effect: (F[3,60.4] = 11.93, p ≤ 0.0001). Similarly, the latency of the new peak P1 was greater in all of the DCB treatments than in controls, and the latency in the 225 treatment was greater than in the 100 mg/kg/day group (DCB Effect: (F[3,59.8] = 19.97, p ≤ 0.0001). The effect of DCB treatment on peak-to-peak P14N1 amplitude varied over stimulus intensities (DCB x Intensity Effect: F[6,75.8] = 5.01, p = 0.0002) (Fig. 6C). Using a 1 mA stimulus, the amplitude of peak P14N1 was greater in the 175 and 225 mg/kg/day groups than in the controls. When a 2 mA stimulus was used, the amplitude of peak P14N1 was greater in the 225 mg/kg/day treatment than in controls and the 100 mg/kg/day group. For the 3 mA stimulus, the amplitude of peak P14N1 was larger in the 175 and 225 mg/kg/day group than in controls, and the amplitude in the 225 mg/kg/day group was larger than in the 100 mg/kg/day group. When averaged over stimulus intensities (DCB Effect: F[3,59] = 5.07, p = 0.0034), treatment with DCB decreased the peak-to-peak amplitude of P1N27, with controls having a greater amplitude than the 225 mg/kg/day group.
Figure 6.

Average somatosensory evoked potential waveforms (n = 11–19 rats/waveform) recorded from the cortex (SEPcortex) following tail stimulation after treatment with 3,4-dichloro-1-butene (DCB). A.) SEPcortex waveforms: Average waveforms with a 1, 2, or 3 mA stimulus. Shaded regions represent the 95% confidence intervals. B.) Peak N1P1: Treatment produced novel changes in the SEPcortex. A dose-related increase in occurrence of a newly formed peak (labeled N1 and P1) between peaks P14 and N27 of the SEPCTX waveform was indicated. Single animal waveforms from each treatment which represent the group median P14N1 amplitude are presented for ease of viewing. C.) Peak P14N1 amplitude: Stimulus-intensity related increase in the amplitude of peak P14N1 for the different DCB treatment groups. * = significant from controls; # = significant from 100 mg/kg/day DCB.
Treatment with DCB also altered somatosensory responses recorded from the cerebellum (Fig. 7A). When averaged over stimulus intensities, the latencies of peaks N10 (DCB Effect: F[3,58] = 5.13, p = 0.0033) and P14 (DCB Effect: F[3,57.7] = 4.71, p = 0.0052) were decreased by treatment with DCB. Peak N10 latency was decreased by treatment with 225 mg/kg/day DCB compared to the 0 and 100 mg/kg/day groups (Fig. 7B). Peak P14 latency was decreased in the 225 mg/kg/day group compared to controls (Fig. 7C). When using a 3 mA stimulus, the peak-to-peak amplitude N10P14 was increased by treatment with 175 or 225 mg/kg/day DCB compared to controls (DCB x Intensity Effect: F[6,74.2] = 3.3, p = 0.0061) (Fig. 6D).
As expected, the cortical and cerebellar somatosensory potentials were under stimulus control, as generally evidenced by stimulus intensity-related decreases in the latencies and increased amplitudes of various peaks. Changes in the latencies of cortical peaks N1, P1, N27, P36, and N53 (p-values ≤ 0.0475), and amplitudes of peaks P14, P14N1, N1, P1, P1N27, N27, P36, N53, and N96 (p-values ≤ 0.0170) were observed. Similarly, decreased latencies of cerebellar peak N10 (p = 0.0147) and increased amplitudes of peaks P14, N24, and P55 were observed (p-values ≤ 0.0019).
3.3. Benzyl bromoacetate
Initially, a high dose of 105 mg/kg/day BBA was used for 8 animals. However, due to weight loss and animal welfare concerns this dose was dropped and the lower dose of 65 mg/kg/day was added for the remainder of the study (12 animals). Only data from the 0, 65, 75, and 90 mg/kg/day groups were used for analysis.
Although all treatment groups gained weight over the course of the study, animals treated with 90 mg/kg/day BBA had less weight-gain than controls throughout the 8 weeks (Fig. 1C) (BBA x Week Effect: F[21,107] = 4.89, p ≤ 0.0001). Beginning on week 2, the 75 mg/kg/day group also had less weight gain than controls over the remaining 6 weeks. Additionally, on week 2 the 90 mg/kg/day group showed suppressed weight gain compared to the 65 mg/kg/day group. The percentage weight gain ranged from 29.1% ± 2.5% (controls) to 14.8% ± 1.6% (90 mg/kg/day). The pre-dosing weights for the treatment groups were: 366.5 ± 10.0 (0 mg/kg/day), 350.1 ± 13.5 (65 mg/kg/day), 360.6 ± 12.9 (75 mg/kg/day), and 368.6 ± 10.5 (90 mg/kg/day).
Treatment with BBA lead to decreased hindlimb grip strength in all treatment groups (Supp. Fig. 7A) (BBA Effect: F[3,477] = 4.95, p = 0.0021). However, no effects were seen in forelimb grip strength. Foot splay tended to be decreased when averaged over the 8 weeks (BBA Effect: [3,308] = 8.28, p ≤ 0.0001) (Supp. Fig. 7B). The 65 and 75 mg/kg/day groups had less foot splay than control animals and the 65 mg/kg/day group had less foot splay than the 90 mg/kg/day group. The average number of rears counted over the 8-week test period was less in the 90 mg/kg/day group compared to all other treatments (Supp. Fig. 7C). Additionally, the 65 mg/kg/day group averaged more rears than the 0, 75, or 90 mg/kg/day groups (BBA Effect: F[3,478] = 14.82, p ≤ 0.0001). Open-field activity scoring differed over weeks between the BBA treatments (BBA x Week Effect: X2[21] = 36.53, p = 0.0191) (Supp. Fig. 7D). In general, the highest scores were observed in the 65 mg/kg/day group with differences indicated on weeks 2, 3, 4, 6, 7, and 8 (p-values ≤ 0.0438). These results were not dose-related and did not progress over weeks, so they should be interpreted with caution. No changes were indicated for gait description or arousal.
Treatment with BBA did not affect nerve excitability measurements from tail CMAPs (Suppl. Fig. 2), foot CMAPs (Suppl. Fig. 3), or tail MNAPs (Suppl. Fig. 4).
Technical difficulties with the system used to record evoked responses prevented collection of compound nerve action potentials, nerve conduction velocity, or somatosensory responses from the cortex or cerebellum in 4 rats from each treatment group. The resulting sample sizes for the dose groups were n=16 (0 mg/kg/day), n=6 (65 mg/kg/day), n=13 (75 mg/kg/day), and n=12 (90 mg/kg/day). Additionally, 1 rat in the 65 mg/kg/day treatment had a shorted cortical electrode, resulting in a sample size of n=5 for the cortical somatosensory responses.
Treatment with BBA did not alter tail CNAP peak-to-peak amplitudes, latencies, area, or NCV (Suppl. Figs. 8A,B). The CNAP responses were under stimulus control as evidenced by intensity-related changes for latencies of peaks P1, N1, and P2, the peak-to-peak amplitudes of peaks P1N1 and N1P2, as well as the area of peak N1 (p-values ≤ 0.0423). The tail NCV recorded between the two stimulations sites averaged 28.3 ± 0.6 m/s. Tail temperature was not affected by treatment with BBA and averaged 22.7 ± 0.2 °C.
No alterations in peak amplitudes or latencies were indicated in somatosensory responses recorded from the cortex or cerebellum after treatment with BBA. The evoked responses were under stimulus control, as indicated by significant effects of stimulus intensity for cortical peak latencies (N27, P36, N96) and amplitudes (N27, N53, N96) (p-values ≤ 0.0204) (Suppl. Fig. 9A). Similarly, the responses recorded from the cerebellum were altered by the stimulus intensity for peak N10 latency and the amplitudes of peaks N24 and P55 (p-values ≤ 0.0016) (Suppl. Fig. 9B).
4. Discussion
This series of studies was designed to use behavioral and in vivo neurophysiological methods to examine repeated-dose neurotoxicity from chemicals predicted to be reactive based on an in silico model (Melnikov et. al., 2020). The Hard-Soft Acid-Base (HSAB) in silico model focuses on chemical structure and electrophilic properties which are important to the formation of protein adducts (LoPachin et al., 2012,2014, 2019; Schwӧbel et al., 2011). The theory has proven useful in identifying cumulative neurotoxicity produced by type II alkenes, such as acrylamide (LoPachin and Gavin, 2012; LoPachin et al., 2007b). While chemical reactions with endogenous proteins will occur throughout the body (LoPachin et al., 2019), it is the altered function in nervous tissue that can lead to neurotoxicity. Mechanistically based in silico models may help identify toxicants, as well as predict biological interactions that may be difficult to detect with standard in vivo and in vitro methods. However, in vivo testing of model predictions remains critical for assessment of functional changes. These experiments evaluated changes in neurological function using an expanded range of chemicals with a previously non-tested alkene with DCB, as well as other types of chemical structures, such as aldehydes with CIT, and esters with BBA.
A general sign of a biological effect induced by a chemical may be reflected by changes in body weight. Treatment with CIT did not have a significant impact on body weight, but a significant suppression in weight-gain was seen with the DCB and BBA treatments. The average reduction in weight gain over 8 weeks was approximately 16.7% for the high dose of DCB and 13.7% for the high dose of BBA. Therefore, we can conclude that these chemicals were effective in altering the animal’s normal homeostasis.
Behavioral observations and measurements were used to further evaluate changes in function. CIT, DCB, and BBA animals did not show any behavioral signs of distress during FOB testing. All three of the chemicals decreased grip strength, with decreases in hindlimb grip-strength being the most common observation. However, decreases were modest and the absence of time-related changes over the dosing period would indicate that this was not related to a progressive loss of proprioception or motor function. DCB produced only minor decreases in forelimb (~3–4% decrease) and hindlimb (~7–12% decrease) grip-strength compared to controls, and these changes were not strictly dose-related, complicating the biological interpretation. Changes in hindlimb grip-strength, foot splay, rearing, and activity score observed in the BBA study were also not strictly dose- or time-related.
To assist with a neurotoxicological perspective, rats treated with 1, 4, or 12 mg/kg acrylamide (known to produce peripheral nerve toxicity) via intraperitoneal injection 5 days/week for 13 weeks showed prominent effects in neuromuscular function. High-dose animals showed a progressive increase in foot splay, reaching significance by the 30 – 90 day period, with increases in the range of approximately 35 – 160%. Gait and hindlimb grip strength were also altered between 30 and 90 days of treatment (Moser et al., 1991). Another study compared the results from several different labs that evaluated effects of acrylamide with cumulative doses between 200 – 400 mg/kg via daily intraperitoneal injections for 1–2 weeks. Foot splay was increased approximately 82% and hindlimb grip strength was decreased about 16% compared to controls (Moser et al., 1997). While effects on grip-strength were measured to be significant following treatment of CIT, DCB, or BBA, a similar progressive patterning or magnitude of changes was not observed in these studies, and other symptoms of altered neuromuscular function were not detected, suggesting that these chemicals did not alter motor function in the same manner as acrylamide.
Nerve excitability testing evaluated peripheral nerve function. Tail CMAP recordings measured changes in the tail caudal motor nerves, foot CMAP recordings measured changes in the sciatic and tibial motor nerves, and tail MNAP recordings reflected changes in the tail mixed nerves containing motor and sensory fibers. The NE CMAP data from the CIT, DCB, and BBA studies did not indicate changes to CMAPs recorded from the tail or foot, arguing against any changes in motor nerves. However, alterations seen in tail MNAPs following treatment of DCB, as well as the CNAP/NCV evoked potentials, suggest evidence of significant changes to mixed nerves which include multiple sized axons and smaller sensory fibers (Herr et al., 1998; Schaumberg et al., 2010).
Tail MNAP recordings showed altered MA50 values for all treatment groups, which indicated a lower stimulus intensity required to produce a 50% maximal response. This may suggest a greater depolarization of tail mixed fibers with DCB exposure. The lower RHEO values calculated from the SDTC data also indicate that the low- and high-dose treatment groups required a lower stimulus intensity than controls to produce a criterion amplitude response. The RHEO is the minimal current applied using an infinitely long stimulus pulse that results in an action potential of a given amplitude. Nerve responses to the RHEO current primarily involve nodal Na+ conductance, and the lower values suggest that the nerve fibers were possibly in a more depolarized state compared to those in the control animals (Nodera and Kaji, 2006). It has been suggested that the lower rheobase of sensory nerves would require less current for impaired axons to maintain function compared to similarly impaired motor nerves (Burke et al., 2001). The changes produced by treatment with DCB in MNAPs and CNAPs indicate smaller motor or sensory nerves were altered, which could manifest as some effects in motor function.
The changes in CNAP/NCV responses following DCB treatment further support effects in peripheral mixed nerve neurophysiology. There was an increase in NCV on the DCB-treated animals, with the high-dose DCB group increased NCV of 4.9 m/s compared to controls. While not statistically significant, the dose-related increase of 3.5 m/s in the middle-dose and 2.8m/s in the low-dose DCB groups supports the biological changes. An increase in NCV could be explained by dysfunction of smaller nerve fibers, allowing for faster conducting larger myelinated fibers to have a greater influence on the NCV measured using CNAPs.
The somatosensory recordings evaluated spinal nerve tracts and neural activity associated with the somatosensory cortex and cerebellum. CIT and BBA did not produce changes at these levels. However, treatment with DCB produced changes in both cortical somatosensory and cerebellar responses, indicating possible changes in the central nervous system. Cortical evoked responses after treatment with DCB indicated the presence of a new cortical peak N1P1 positioned early in the waveform between peaks P14 and N27, in a dose-related manner. As the dose of DCB was increased, the amplitude of peaks P14N1 and P1N27 increased. Although the data were analyzed as an additional peak, the observed changes also could have been created by a splitting of the afferent volley, resulting in peak N27 being split into two parts (see Fig. 5b) This may have resulted in the early portion of N27 to be labeled as N1, and the latter portion to continue being labeled as N27 (at approximately 24–27 ms). A splitting of the afferent volley would be consistent with a set of faster conducting nerve fibers in the spino-thalamo-cortical tracts, in addition to a relatively normal conducting set of nerve fibers. This would also be consistent with the increase in NCV noted in peripheral nerves, which could then be propagated to the somatosensory cortex.
The cerebellar evoked responses further indicated changes in central neurophysiology after treatment of DCB, which were also in concordance with the effects found in peripheral nerves. The cerebellar somatosensory response in the high dose DCB group had decreased latencies of early peaks N10 and P14, which may be associated with faster conduction in spinocerebellar nerve tracts (Mattsson et al., 1992), similar to those observed in peripheral nerves. The increase in peak N10-P14 amplitude in the middle- and high-dose DCB treatments suggests alterations along the spinocerebellar pathway, which could be related to changes in small nerve fibers or less inhibitory influences in the cerebellum. Thus, the changes in somatosensory responses are consistent with the biological interpretation of DCB-related changes in smaller nerve fibers. These findings, coupled with DCB’s electrophilic properties, support the finding of toxicity predicted from the in silico HSAB model.
The lack of neurophysiological changes after treatment with CIT or BBA could be due to several reasons. While the HSAB model indicated the chemicals had physiochemical properties consistent with producing protein adducts (Melnikov et al., 2020), we did not attempt to measure such adducts in neural or other tissue types in this work. Chemical – protein interactions can be very selective, depending on the properties of both the chemical and the constituent proteins. Three dimensional features of chemicals or protein structures can result in steric hinderance, which can obstruct protein adduct formation (LoPachin and Gavin, 2014; LoPachin et al., 2012). Alternatively, the potential adducts may not be sufficiently stable to accumulate and induce toxicity (LoPachin and DeCaprio, 2005). Although the chemicals that were tested have fairly similar electrophilicity values (CIT=2.15, BBA=2.21, DCB=2.40; Melnikov et al., 2020), the differences in energy per mole which drive electrophilic reactions is larger (DCB – BBA = 4,387 kcal/mol, DCB – CIT = 5,773 kcal/mol, BBA – CIT = 1,385 kcal/mol). Thus, some of the differences in neurological effect between the chemicals may have been related to the relative differences in energy and chemical-protein reaction rates.
Discrepancies of toxic effects between different chemicals that share similar structural components and electrophilic indexes have also been explained by solubility, which can determine the concentration of chemical at target proteins (LoPachin and Gavin, 2014; LoPachin et al., 2019). We estimated the regional gastrointestinal absorption and systemic circulation after an oral dose of 100 mg of CIT, DCB, or BBA in fed rats were computationally simulated using the GastroPlus™ software v9.8 (Simulations Plus Inc. Lancaster, CA, USA) Advanced Compartmental and Transit (ACAT) Model. An evaluation of ACAT model is provided by Gobeau et al. 2016. Citronellal was predicted to have nearly 100% absorption from the duodenum and jejunum, but to have less than 10% of the dose available in the systemic circulation. 3,4-Dichloro-1-butene was predicted to have about 99% absorption from the duodenum, jejunum, and caecum, and have virtually all of the absorbed chemical available in the systemic circulation. Similar as CIT, BBA was predicted to have almost 100% of the chemical absorbed from the duodenum and jejunum, but to have less than 5% of the dose available in the systemic circulation. If CIT or BBA pharmacokinetics involved first pass metabolism or reactions with hepatic proteins, the chemicals would not be available to circulate to nervous tissue and produce neurophysiological changes.
The decrease in body weight gain produced by BBA is indicative of biological effects that were not manifested as alterations in peripheral nerve or somatosensory neurophysiology. In addition to possible low circulating levels of chemicals, the dosing level (or duration) may have been a factor in the lack of neurophysiological changes produced by CIT or BBA. However, the molar doses for CIT were higher than those for DCB and BBA, yet no neurophysiological changes were noted. Additionally, the original high-dose BBA treatment of 105 mg/kg/day led to biological effects, resulting in the necessity to use lower doses. Thus, the data indicate that under these dosing conditions, BBA was able to produce changes in the overall health status of the animals, without altering the neurophysiological endpoints that we quantified. Verification of altered function of other organ systems (such as the liver) will require additional experimentation.
These experiments did not specifically examine the small or unmyelinated nerves involved in nociception, where previous in vitro studies on CIT showed these fibers to be the target for toxicity (de Santana et al., 2013; Melo et al., 2010; Ohtsubo et al., 2015; Quintans-Júnior et al., 2009). A recent publication has shown that CIT can reduce the density and neurite length of dorsal root ganglion cells in culture, although at doses which had evidence of increased cytotoxicity (Johnstone et al., 2020). The neurophysiological recordings in this manuscript were similar in shape to previous data (Herr et al., 1998, 2004, 2016). The intensity-related changes for peaks and latencies showed CNAP and SEP responses were under stimulus control. These facts indicate that any biological changes in evoked responses were smaller than the intensity-related alterations, which the procedures had sufficient power to detect in each study.
Alternative explanations were considered for the results obtained in the DCB study. Several biological factors such as body weight and temperature were considered. In humans, stimulation of the median nerve has indicated that CMAP amplitude may decrease to some degree with age, and the SR slope decreases with age and body mass index (BMI; overweight persons have lower SR slopes) (Casanova et al., 2014). Other NE measurements showed little to no changes due to age and BMI. The animals in DCB showed a reduction in the current required to produce 50% maximal MNAP amplitude (lower SR slope), suggesting that the change was not related to the lower body mass of the treated animals. The BBA study did not show changes to the current required to produce 50% maximal MNAP amplitude, despite significant differences in body weights. Additionally, NE values were calculated by percent changes in threshold for each individual animal, which should control for any differences that may correlate with body weight.
The increase in NCV could also be caused by an increase in nerve temperature. Although there were no significant changes in tail temperature observed in the DCB study, the influence of tail temperature was analyzed for possible influences on NCV. Analysis of covariance did not indicate an interaction of DCB treatment with temperature, so a single regression analysis was examined. The regression of NCV vs. tail temperature predicted an increase of 2.05 m/s due to temperature, resulting in a predicted increase of 2.46 m/s due to the 1.2 °C increase in tail nerve temperature in the 225 mg/kg/day DCB group compared to controls (Suppl. Fig. 10A). However, we observed about a 4.9 m/s increase in NCV in this treatment group. Therefore, increased tail temperature can only account for about half of the observed increase in NCV.
Alternative explanations for the increased amplitude of mixed nerve CNAPs were also investigated. Rats that weigh less may have smaller tails, allowing for needle stimulating electrodes to be positioned closer to tail nerves, resulting in more efficient nerve stimulation. However, we used constant-current stimulation, which will deliver the desired current independent of tissue resistance up to the compliance voltage of the stimulator (±125V). The recording needles also could have been nearer to the tail nerves in a smaller tail. We used body weight as a surrogate for tail diameter to see if it could account for the increase in tail CNAP amplitude. When all treatment groups were combined into a single regression, a decrease of approximately 0.29 μV/g for peak P1-N1 amplitude was indicated. For the average suppression in body weight gain of 124.1g with the 225 mg/kg/day DCB group for the week of CNAP testing, this would predict an increase of 35.6 μV for peak P1-N1 amplitude, which is greater than the observed increase of 27.6 μV (over-prediction by about 29%; Suppl. Fig. 10B). Thus, a smaller tail size does not accurately explain the increase in CNAP amplitude that we observed.
It is unlikely that the lower growth rate in animals treated with DCB is related to the changes in cortical SEPs that we report. A relatively smaller head/brain could lead to surface electrodes being placed slightly further laterally on the somatosensory cortex. This in turn, would lead to a placement slightly over the trunk/forelimb cortical regions (Seelke et al., 2012). However, in contrast to the large changes in body size and shape, there is a less dramatic change in brain size from approximately post-natal day 20 to adulthood (Seelke et al., 2012). Given that the average body weight ranged from about 396g (high-dose DCB) to 520g (controls), all animals would be considered fully adult size. The area of the tail receptive area in the rodent primary somatosensory cortex (270 – 450g animals) is reported to be approximately 0.8 mm2 (Yen and Chen, 2008). Given the recording surface area of the electrodes used for this study was about 0.8 mm2, any slight deviations in electrode placement would be predicted to have minimal effects on the cortical SEPs in a treatment-related manner.
These behavioral and neurophysiological methods examined many aspects of physiological function to examine in silico HSAB predictions of neurotoxicity. Peripheral motor and mixed nerve activity were measured with NE and CNAP/NCV testing, providing evidence of altered mixed nerve function following treatment of DCB. Somatosensory potentials evaluated changes in the peripheral and central nervous system, involving spinal tracts, the thalamus, and the somatosensory cortex and cerebellum. The results from the DCB study provides support for some HSAB model predictions for in vivo cumulative neurotoxicity. Although treatment with CIT and BBA did not result in neurophysiological changes using these methods, these data contribute to refining the HSAB in silico model and assist with prioritizing known neurotoxicants to protect human health.
5. Conclusions
These studies used behavioral and in vivo neurophysiological measurements to test in silico HSAB predictions of cumulative neurotoxicity. The results provide some in vivo support for the predictions, but also indicate that additional refinement of either the HSAB model or the test methods used to evaluate cumulative neurotoxicity may be required to allow extension of the predictive theory to untested chemical classes. Continued refinement of these methods (in addition to other in vitro and in vivo testing) will allow for development of additional AOPs for neurotoxicity. Future studies, including proteomics assessment of adduct formation, will allow definitive initiating events in the AOPs to be incorporated, and may predict additional biological effects that could be influenced by different physio-chemical characteristics. These approaches can contribute to further mechanistic understanding and mitigation of neurotoxic impacts on humans.
Supplementary Material
Supplemental Figure 1. Effect of citronellal (CIT) on mean grip-strength when averaged over the course of 8 weeks. Bars represent standard error. A.) Forelimb grip strength: The 79 mg/kg/day treatment group had weaker forelimb grip strength than the 0, 104, and 116 mg/kg/day group. B.) Hindlimb grip-strength: The 104 mg/kg/day treatment group had less hindlimb grip strength compared to controls. * = significant from controls; # = significant from 104 mg/kg/day; + = significant from 116 mg/kg/day. The differences in forelimb and hindlimb grip strength were not dose-related.
Supplemental Figure 2. Mean nerve excitability data (± SE) derived from tail compound muscle action potentials (CMAPs) following stimulation to tail caudal motor nerves after treatment with citronellal (CIT), 3,4-dichloro-1-butene (DCB), or benzyl bromoacetate (BBA) (n = 14–20 rats/curve). Treatment with CIT, DCB, or BBA did not alter SR (row A.), SDTC (row B.), TE (row C.), I/V (row D.), or RC (row E.) measurements from tail CMAPs. ● = control, Δ = low-dose, ◊ = middle-dose, □ = high-dose.
Supplemental Figure 3. Mean nerve excitability data (± SE) derived from foot compound muscle action potentials (CMAPs) following stimulation to the sciatic nerve after treatment with citronellal (CIT), 3,4-dichloro-1-butene (DCB), or benzyl bromoacetate (BBA) (n = 14–20 rats/curve). Treatment with CIT, DCB, or BBA did not alter SR (row A.), SDTC (row B.), TE (row C.), I/V (row D.), or RC (row E.) measurements from foot CMAPs. ● = control, Δ = low-dose, ◊ = middle-dose, □ = high-dose.
Supplemental Figure 5. Average compound nerve action potential (CNAP) waveforms following evoked stimulation to tail caudal nerves after treatment with citronellal (CIT) (n = 12–20 rats/waveform). A.) CNAP1: Treatment did not alter peaks following a 1, 2, or 3 mA stimulus. Shaded regions represent the 95% confidence intervals. B.) NCV: Treatment did not alter NCV.
Supplemental Figure 4. Mean nerve excitability data (± SE) derived from tail mixed-nerve action potentials (MNAPs) following stimulation to tail caudal mixed-nerves after treatment of citronellal (CIT) or benzyl bromoacetate (BBA) (n = 13–19 rats/curve). Treatment with CIT or BBA did not alter SR (row A.), SDTC (row B.), TE (row C.), I/V (row D.), or RC (row E.) from tail MNAPs. ● = control, Δ = low-dose, ◊ = middle-dose, □ = high-dose.
Supplemental Figure 6. Average somatosensory evoked potential (SEP) waveforms following a 1, 2, or 3 mA stimulus to tail caudal nerves after treatment with citronellal (CIT). Shaded regions represent the 95% confidence intervals. A.) SEPcortex: Treatment did not alter peak latencies or amplitudes recorded from the somatosensory cortex (n = 12–17 rats/waveform). B.) SEPcerebellum: Treatment did not alter peak latencies or amplitudes recorded from the cerebellum (n = 12–16 rats/waveform).
Supplemental Figure 7. Means of behavioral observations and measurements following treatment with BBA. Bars represent standard error. A.) Hindlimb grip-strength: When averaged over the 8- week period, all treatment groups had decreased hindlimb grip-strength. * = significant from controls. B.) Hindlimb foot-splay: When averaged over the 8 weeks, the low- and middle-dose groups had narrower foot splay than controls. However, the low-dose group also had less foot splay compared to the high-dose group. * = significant from controls, + = significant from high-dose. C.) Rearing: When averaged over the 8 weeks, the number of rears was greater in the low-dose group compared to the other treatments. The high-dose group had less rears than controls and the middle-dose group. * = significant, # = significant from low-dose. D.) Open-field activity ratings: In general, the low-dose had greater activity ratings than the other treatment groups. However, the differences were not strictly dose- or time-related, and thus should be interpreted with caution. * = significant from controls, # = significant from middle-dose, + = significant from high-dose.
Supplemental Figure 8. Average compound nerve action potential (CNAP) waveforms following evoked stimulation to tail caudal nerves after treatment with benzyl bromoacetate (BBA) (n = 6–14 rats/waveform). A.) CNAP1: Treatment did not alter peaks following a 1, 2, or 3 mA stimulus. Shaded regions represent the 95% confidence intervals. The large size of the confidence limits was caused by occasional baseline offsets for some of the control animals. B.) NCV: Treatment did not alter NCV.
Supplemental Figure 10. A.) Relationship between NCV and tail near nerve temperature for DCB-treated animals. As expected, increased tail temperature was associated with increased NCV. This increase did not differ between the DCB treatment groups, nor did the rate of increase account for the increased NCV observed in the 225 mg/kg/day group. Solid line = overall regression, dashed line = 95% prediction intervals. B.) Relationship between tail CNAP peak P1N1 peak-to-peak amplitude and body weight (as a surrogate for tail diameter). Increases in body weight were associated with a decrease in peak P1N1 amplitude, but the regression over-predicted the observed decrease by about 29%.
Supplemental Figure 9. Average somatosensory evoked potential (SEP) waveforms following a 1, 2, or 3 mA stimulus to tail caudal nerves after treatment with benzyl bromoacetate (BBA). Shaded regions represent the 95% confidence intervals. A.) SEPcortex: Treatment did not alter peak latencies or amplitudes recorded from the somatosensory cortex (n = 5–16 rats/waveform). B.) SEPcerebellum: Treatment did not alter peak latencies or amplitudes recorded from the cerebellum (n = 6–15 rats/waveform).
HIGHLIGHTS.
In vivo testing of predictions from a Hard-Soft Acid-Base (HSAB) in silico model may help to prioritize neurotoxicants.
Nerve excitability (NE) tests provide additional mechanistic insight to the analysis of peripheral nerve function.
3,4-Dichloro-1-butene (DCB) reduced grip-strength, produced physiological changes in peripheral mixed nerves, and altered somatosensory evoked potentials (SEP).
More studies will confirm mechanistic details and further expand testing from our HSAB in silico analysis.
Acknowledgements:
The authors would like to thank Drs. William Boyes, Andrew Johnstone, and Tim Shafer for helpful discussions and critique of previous versions of this manuscript. We would also like to thank Dr. Hisham El-Masri for running the GastroPlus simulations. The authors wish to acknowledge the previous work of Drs. Fjodor Melnikov and Terrence Gavin. We also wish to acknowledge the excellent services provided by the animal care staff.
Funding:
This work was funded by the US EPA.
Footnotes
Conflict of Interest: The authors declare that the research was conducted in the absence of any commercial or financial relationships that could be construed as a potential conflict of interest.
Disclaimer: The research described in this article has been reviewed by the Center for Public Health and Environmental Assessment, U.S. Environmental Protection Agency, and approved for publication. Approval does not signify that the contents necessarily reflect the views and policies of the Agency, nor does mention of trade names or commercial products constitute endorsement or recommendation for use.
References
- Akaike H, 1973. Information theory as an extension of the maximum likelihood principle–In: Second International Symposium on Information Theory (Eds) Petrov BN, Csaki F. BNPBF Csaki Budapest: Academiai Kiado. [Google Scholar]
- Baker M, Bostock H, Grafe P, Martius P, 1987. Function and distribution of three types of rectifying channel in rat spinal root myelinated axons. J. Physiol 383(1), 45–67. [DOI] [PMC free article] [PubMed] [Google Scholar]
- Barrett EF, Barrett JN, 1982. Intracellular recording from vertebrate myelinated axons: mechanism of the depolarizing afterpotential. J. Physiol 323(1), 117–144. [DOI] [PMC free article] [PubMed] [Google Scholar]
- Benjamini Y, Hochberg Y, 1995. Controlling the false discovery rate: a practical and powerful approach to multiple testing. J. Royal Stat. Soc.: Series B (Methodological) 57(1), 289–300. [Google Scholar]
- Benjamini Y, Hochberg Y, 2000. On the adaptive control of the false discovery rate in multiple testing with independent statistics. J. Educat. Behav. Stat 25(1), 60–83. [Google Scholar]
- Benjamini Y, Yekutieli D, 2001. The control of the false discovery rate in multiple testing under dependency. Annal. Stat 1165–1188. [Google Scholar]
- Bostock H, 1983. The strength-duration relationship for excitation of myelinated nerve: computed dependence on membrane parameters. J. Physiol 341(1), 59–74. [DOI] [PMC free article] [PubMed] [Google Scholar]
- Bostock H, Baker M, 1988. Evidence for two types of potassium channel in human motor axons in vivo. Brain Res 462(2), 354–358. [DOI] [PubMed] [Google Scholar]
- Bostock H, Rothwell JC, 1997. Latent addition in motor and sensory fibres of human peripheral nerve. J. Physiol 498(1), 277–294. [DOI] [PMC free article] [PubMed] [Google Scholar]
- Bostock H, Cikurel K, Burke D, 1998. Threshold tracking techniques in the study of human peripheral nerve. Muscle & Nerve 21, 137–158. [DOI] [PubMed] [Google Scholar]
- Boyes WK, Degn LL, Martin SA, Lyke DF, Hamm CW, Herr DW, 2014. Neurophysiological assessment of auditory, peripheral nerve, somatosensory, and visual system functions after developmental exposure to ethanol vapors. Neurotoxicol.Teratol 43, 1–10. [DOI] [PubMed] [Google Scholar]
- Breslow N, 1970. A generalized Kruskal-Wallis test for comparing K samples subject to unequal patterns of censorship. Biometrika 57(3), 579–594. [Google Scholar]
- Burke D, Kiernan MC, Bostock H, 2001. Excitability of human axons. Clin. Neurophysiol 112(9), 1575–1585. [DOI] [PubMed] [Google Scholar]
- Burnham KP, Anderson DR, 2004. Multimodel inference: Understanding AIC and BIC in model selection. Sociolog. Meth. Res 33(2), 261–304. [Google Scholar]
- Casanova I, Diaz A, Pinto S de Carvalho M, 2014. Motor excitability measurements: The influence of gender, body mass index, age and temperature in healthy controls. Clin. Neurophysiol 44(2), 213–218. [DOI] [PubMed] [Google Scholar]
- de Santana MT, de Oliveira MGB, Santana MF, De Sousa DP, Sanatana DG, Camargo EA, de Oliveira AP, da Silva Almeida JRG, and Quintans-Jύnior LJ, 2013. Citronellal, a monoterpene present in Java citronella oil, attenuates mechanical nociception response in mice. Pharm. Biol 51(9), 1144–1149. [DOI] [PubMed] [Google Scholar]
- Douglas CE, Michael FA, 1991. On distribution-free multiple comparisons in the one-way analysis of variance. Comm. Statist. - Theory and Methods 20(1), 127–139. [Google Scholar]
- Dwass M, 1960. Some k-sample rank-order tests, in: Olkin I, Ghurye SG, Hoefflding W, Madow WG, Mann HB (Eds.), Contributions to probability and statistics: Essays in honor of Harold Hotelling. Stanford University Press, Stanford, CA, pp. 198–202. [Google Scholar]
- Elliott AC, Hynan LS, 2011. A SAS® macro implementation of a multiple comparison post hoc test for a Kruskal–Wallis analysis. Comput. Meth. Prog. Biomed 102(1), 75–80. [DOI] [PubMed] [Google Scholar]
- George A, Bostock H, 2007. Multiple measures of axonal excitability in peripheral sensory nerves: An in vivo rat model. Muscle & Nerve, 36(5), 628–636. [DOI] [PubMed] [Google Scholar]
- Gobeau N, Stringer R, De Buck S, Tuntland T, Faller B, 2016. Evaluation of the GastroPlus – advanced compartmental and transit (ACAT) model in early discovery. Pharm. Res 33, 2126–2139. [DOI] [PubMed] [Google Scholar]
- Hamm CW, Ali JS, Herr DW, 2000. A system for simultaneous multiple subject, multiple stimulus modality, and multiple channel collection and analysis of sensory evoked potentials. J. Neurosci. Meth 102(2), 95–108. [DOI] [PubMed] [Google Scholar]
- Herr DW, Vo KT, Morgan DL, Sills RC, 1998. Carbon disulfide neurotoxicity in rats: VI. Electrophysiological examination of caudal tail nerve compound action potentials and nerve conduction velocity. Neurotoxicology, 19(1), 129–146. [PubMed] [Google Scholar]
- Herr DW, Chanda SM, Graff JE, Barone SS Jr., Beliles RP, Morgan DL, 2004. Evaluation of sensory evoked potentials in Long Evans rats gestationally exposed to mercury (Hg0) vapor. Toxicol. Sci 82(1), 193–206. [DOI] [PubMed] [Google Scholar]
- Herr DW, Freeborn DL, Degn L, Martin SA, Ortenzio J, Pantlin L, Hamm CW, Boyes WK, 2016. Neurophysiological assessment of auditory, peripheral nerve, somatosensory, and visual system function after developmental exposure to gasoline, E15, and E85 vapors. Neurotoxicol. Teratol 54, 78–88. [DOI] [PubMed] [Google Scholar]
- Herr DW, Graff JE, Moser VC, Crofton KM, Little PB, Morgan DL, Sills RC, 2007. Inhalational exposure to carbonyl sulfide produces altered brainstem auditory and somatosensory-evoked potentials in Fischer 344N rats. Toxicol. Sci 95(1), 118–135. [DOI] [PubMed] [Google Scholar]
- Hollander M, Wolfe DA, 1999. Nonparametric statistical methods, 2 ed. John Wiley & Sons, New York, NY. [Google Scholar]
- Johnstone AFM, Mack CM, Valdez MC, Shafer TJ, Herr DW, Kodavanti PRS, 2020. Acute in vitro effects on embryonic rat dorsal root ganglion (DRG) cultures by in silico predicted neurotoxic chemicals: Evaluations on cytotoxicity, neurite length, and neurophysiology. Toxicol. in Vitro, 69, 104989. [DOI] [PMC free article] [PubMed] [Google Scholar]
- Kiernan MC, Burke D, Bostock H, 2005. Nerve excitability measures: biophysical basis and use in the investigation of peripheral nerve disease. In: Peripheral Neuropathy. W.B. Saunders, Philadelphia, PA. pp. 113–129. [Google Scholar]
- Kiernan MC, Burke D, Andersen KV, Bostock H, 2000. Multiple measures of axonal excitability: A new approach in clinical testing. Muscle & Nerve 23(3), 399–409. [DOI] [PubMed] [Google Scholar]
- Knudsen TB, Keller DA, Sander M, Carney EW, Doerrer NG, Eaton DL, Fitzpatrick SC, Hastings KL, Mendrick DL, Tice RR, Watkins PB, 2015. FutureTox II: in vitro data and in silico models for predictive toxicology. Toxicol. Sci 143(2), 256–267. [DOI] [PMC free article] [PubMed] [Google Scholar]
- Kramer CY, 1956. Extension of multiple range tests to group means with unequal numbers of replications. Biometrics 12, 307–310. [Google Scholar]
- Krimsky S, 2017. The unsteady state and inertia of chemical regulation under the US Toxic Substances Control Act. PLoS Biology 15(12), e2002404. [DOI] [PMC free article] [PubMed] [Google Scholar]
- Krishnan AV, Lin CS-Y, Park SB, Kiernan MC, 2009. Axonal ion channels from bench to bedside: a translational neuroscience perspective. Prog. Neurobiol 89(3), 288–313. [DOI] [PubMed] [Google Scholar]
- Kruskal WH, 1952. A nonparametric test for the several sample problem. Annal Mathemat. Statist 23(4), 525–540. [Google Scholar]
- LoPachin RM, Barber DS, Gavin T, 2007a. Molecular mechanisms of the conjugated α, β-unsaturated carbonyl derivatives: relevance to neurotoxicity and neurodegenerative diseases. Toxicol. Sci 104(2), 235–249. [DOI] [PMC free article] [PubMed] [Google Scholar]
- LoPachin RM, Barber DS, Geohagen BC, Gavin T, He D, Das S, 2006. Structure-toxicity analysis of type-2 alkenes: in vitro neurotoxicity. Toxicol. Sci 95(1), 136–146. [DOI] [PubMed] [Google Scholar]
- LoPachin RM, DeCaprio AP, 2005. Protein adduct formation as a molecular mechanism in neurotoxicity. Toxicol. Sci 86(2), 214–225. [DOI] [PubMed] [Google Scholar]
- LoPachin RM, Gavin T, 2012. Molecular mechanism of acrylamide neurotoxicity: Lessons learned from organic chemistry. Environ. Health Perspect 120(2), 1650–1657. [DOI] [PMC free article] [PubMed] [Google Scholar]
- LoPachin RM, Gavin T, 2014. Molecular mechanisms of aldehyde toxicity: a chemical perspective. Chem. Res. Toxicol 27(7), 1081–1091. [DOI] [PMC free article] [PubMed] [Google Scholar]
- LoPachin RM, Gavin T, Geohagen BC, Das S, 2007b. Neurotoxic mechanisms of electrophilic type-2 alkenes: soft–soft interactions described by quantum mechanical parameters. Toxicol. Sci 98(2), 561–570. [DOI] [PubMed] [Google Scholar]
- LoPachin RM, Gavin T, DeCaprio A, Barber DS, 2012. Application of the hard and soft, acids and bases (HSAB) theory to toxicant-target interactions. Chem. Res. Toxicol 25(2), 239–251. [DOI] [PMC free article] [PubMed] [Google Scholar]
- LoPachin RM, Geohagen BC, Nordstroem LU, 2019. Mechanisms of soft and hard electrophile toxicities. Toxicology 418, 62–69. [DOI] [PMC free article] [PubMed] [Google Scholar]
- Mattsson JL, Boyes WK, Ross JF, 1992. Incorporating evoked potentials into neurotoxicity test schemes. In: Neurotoxicology. Tilson H and Mitchell C, eds. Raven Press, Ltd. New York. pp 125–144. [Google Scholar]
- McDaniel KL and Moser VC, 1993. Utility of a neurobehavioral screening battery for differentiating the effects of two pyrethroids, permethrin and cypermethrin. Neurotoxicol. Teratol 15(2), 71–83. [DOI] [PubMed] [Google Scholar]
- Melnikov F, Geohagen BC, Gavin T, LoPachin RM, Anastas PT, Coish P, Herr DW, 2020. Application of the hard and soft, acids and bases (HSAB) theory as a method to predict cumulative neurotoxicity. NeuroToxicology 79, 95–103. [DOI] [PMC free article] [PubMed] [Google Scholar]
- Melo MS, Sena LCS, Barreto FJN, Bonjardim LR, Almeida JRGS, Lima JT, De Sousa DP, Quintans-Jύnior LJ, 2010. Antinociceptive effect of citronellal in mice. Pharmacol. Biol 48(4), 411–416. [DOI] [PubMed] [Google Scholar]
- Mogyoros I, Kiernan MC, Burke D, 1996. Strength-duration properties of human peripheral nerve. Brain 119, 439–447. [DOI] [PubMed] [Google Scholar]
- Moser VC, Anthony DC, Sette WF, MacPhail RC, 1992. Comparison of subchronic neurotoxicity of 2-hydroxyethyl acrylate and acrylamide in rats. Toxicol. Sci, 18(3), 343–352. [DOI] [PubMed] [Google Scholar]
- Moser VC, Becking GC, Cuomo V, Frantik E, Kulig BM, MacPhail RC, Tilson HA, Winneke G, Brightwell WS, Cagiano R Gill MW, Haggerty GC, Hornchová M, Lammers J, Larsen J-J, McDaniel KL, Nelson BK, Østergaard G, 1997. The IPCS Collaborative Study on Neurobehavioral Screening Methods: III. Results of proficiency studies. Neurotoxicol. 18(4), 939–946. [PubMed] [Google Scholar]
- Nodera H and Kaji R, 2006. Nerve excitability testing and its clinical application to neuromuscular diseases. Clin. Neurophysiol, 117(9), 1902–1916. [DOI] [PubMed] [Google Scholar]
- Ohtsubo S, Fujita T, Matsushita A, Kumamoto E, 2015. Inhibition of the compound action potentials of frog sciatic nerves by aroma oil compounds having various chemical structures. Pharma. Res. Perspect 3(2), e00127. [DOI] [PMC free article] [PubMed] [Google Scholar]
- Pearson RG, 1963. Hard and soft acids and bases. J. Am. Chem. Soc 85(22), 3533–3539. [Google Scholar]
- Pearson RG, 2005. Chemical hardness and density functional theory. J. Chem. Sci 117(5), 369–377. [Google Scholar]
- Pirie W, 2004. J onckheere Tests for Ordered Alternatives, Encyclopedia of Statistical Sciences. John Wiley & Sons, New York, NY. [Google Scholar]
- Pool R, Rusch E, 2014. Identifying and reducing environmental health risks of chemicals in our society. Workshop Summary, Identifying and reducing environmental health risks of chemicals in our society. Workshop Summary. National Academies Press. [PubMed] [Google Scholar]
- Quintans-Júnior LJ, Melo MS, De Sousa DP, Araújo AAS, Onofre AC, Gelain DP, Gonçalves JC, Araújo DA, Almeida JRGS, Bonjardim LR, 2010. Antinociceptive effects of citronellal in formalin-, capsaicin-, and glutamate-induced orofacial nociception in rodents and its action on nerve excitability. J. Orofacial Pain, 24(3), 305–12. [PubMed] [Google Scholar]
- Schaumburg HH, Zotova E, Raine CS, Tar M, Arezzo J, 2010. The rat caudal nerves: a model for experimental neuropathies. J. Peripheral Nerv. Sys 15(2), 128–139. [DOI] [PubMed] [Google Scholar]
- Shah F, Greene N, 2013. Analysis of Pfizer compounds in EPA’s ToxCast chemicals-assay space. Chem. Res. Toxicol 27(1), 86–98. [DOI] [PubMed] [Google Scholar]
- Shapiro SS, Wilk MB, 1965. An analysis of variance test for normality (complete samples). Biometrika 52(3/4), 591–611. [Google Scholar]
- Seelke AM, Dooley JC, Krubitzer LA, 2012. The emergence of somatotopic maps of the body in S1 in rats: the correspondence between functional and anatomical organization. PloS One, 7(2), e32322. [DOI] [PMC free article] [PubMed] [Google Scholar]
- Silva M, Pham N, Lewis C, Iyer S, Kwok E, Solomon G, Zeise L, 2015. A comparison of ToxCast test results with in vivo and other in vitro endpoints for neuro, endocrine, and developmental toxicities: a case study using endosulfan and methidathion. Birth Defects Res. Part B: Develop. Reproduct. Toxicol 104(2), 71–89. [DOI] [PubMed] [Google Scholar]
- Sirenko O, Parham F, Dea S, Sodhi N, Biesmans S, Mora-Castilla S, Ryan K, Behl M, Chandy G, Crittenden C, 2019. Functional and mechanistic neurotoxicity profiling using human iPSC-derived neural 3D cultures. Toxicol. Sci 167(1), 58–76. [DOI] [PMC free article] [PubMed] [Google Scholar]
- Steel RG, 1960. A rank sum test for comparing all pairs of treatments. Technometrics 2(2), 197–207. [Google Scholar]
- Schwӧbel JAH, Koleva YK, Enoch SJ, Bajot F, Hewitt M, Madden JC, Roberts DW, Schultz TW, Cronin MTD, 2011. Measurement and estimation of electrophillic reactivity for predictive toxicology. Chem. Rev 111(4), 2562–2596. [DOI] [PubMed] [Google Scholar]
- Tomlinson SE, Howells J, Burke D, 2018. In vivo assessment of neurological channelopathies: Application of peripheral nerve excitability studies. Neuropharmacol. 132, 98–107. [DOI] [PubMed] [Google Scholar]
- Trevillion L, Howells J, Burke D, 2007. Outwardly rectifying deflections in threshold electrotonus due to K+ conductances. J. Physiol 580(2), 685–696. [DOI] [PMC free article] [PubMed] [Google Scholar]
- U.S. GAO, 2005. Toxic Substances Control Act: Legislative Changes Could Make the Act More Effective. US Government Accountability Office Wash., DC. [Google Scholar]
- Weiss G, Weiss G, 1901. Sur la possibilite de rendre comparables entre eux les appareils servant a l’excitation electrique.
- Weller EA, Ryan LM, 1998. Testing for trend with count data. Biometrics, 762–773. [PubMed] [Google Scholar]
- Wilson MP, Schwarzman MR, 2009. Toward a new US chemicals policy: rebuilding the foundation to advance new science, green chemistry, and environmental health. Environ. Health Perspect 117(8), 1202–1209. [DOI] [PMC free article] [PubMed] [Google Scholar]
- Yen CT, Chen RS, 2008. Tail region of the primary somatosensory cortex and its relation to pain function. In: Novel Trends in Brain Science. Springer, Tokyo. pp. 233–252. [Google Scholar]
Associated Data
This section collects any data citations, data availability statements, or supplementary materials included in this article.
Supplementary Materials
Supplemental Figure 1. Effect of citronellal (CIT) on mean grip-strength when averaged over the course of 8 weeks. Bars represent standard error. A.) Forelimb grip strength: The 79 mg/kg/day treatment group had weaker forelimb grip strength than the 0, 104, and 116 mg/kg/day group. B.) Hindlimb grip-strength: The 104 mg/kg/day treatment group had less hindlimb grip strength compared to controls. * = significant from controls; # = significant from 104 mg/kg/day; + = significant from 116 mg/kg/day. The differences in forelimb and hindlimb grip strength were not dose-related.
Supplemental Figure 2. Mean nerve excitability data (± SE) derived from tail compound muscle action potentials (CMAPs) following stimulation to tail caudal motor nerves after treatment with citronellal (CIT), 3,4-dichloro-1-butene (DCB), or benzyl bromoacetate (BBA) (n = 14–20 rats/curve). Treatment with CIT, DCB, or BBA did not alter SR (row A.), SDTC (row B.), TE (row C.), I/V (row D.), or RC (row E.) measurements from tail CMAPs. ● = control, Δ = low-dose, ◊ = middle-dose, □ = high-dose.
Supplemental Figure 3. Mean nerve excitability data (± SE) derived from foot compound muscle action potentials (CMAPs) following stimulation to the sciatic nerve after treatment with citronellal (CIT), 3,4-dichloro-1-butene (DCB), or benzyl bromoacetate (BBA) (n = 14–20 rats/curve). Treatment with CIT, DCB, or BBA did not alter SR (row A.), SDTC (row B.), TE (row C.), I/V (row D.), or RC (row E.) measurements from foot CMAPs. ● = control, Δ = low-dose, ◊ = middle-dose, □ = high-dose.
Supplemental Figure 5. Average compound nerve action potential (CNAP) waveforms following evoked stimulation to tail caudal nerves after treatment with citronellal (CIT) (n = 12–20 rats/waveform). A.) CNAP1: Treatment did not alter peaks following a 1, 2, or 3 mA stimulus. Shaded regions represent the 95% confidence intervals. B.) NCV: Treatment did not alter NCV.
Supplemental Figure 4. Mean nerve excitability data (± SE) derived from tail mixed-nerve action potentials (MNAPs) following stimulation to tail caudal mixed-nerves after treatment of citronellal (CIT) or benzyl bromoacetate (BBA) (n = 13–19 rats/curve). Treatment with CIT or BBA did not alter SR (row A.), SDTC (row B.), TE (row C.), I/V (row D.), or RC (row E.) from tail MNAPs. ● = control, Δ = low-dose, ◊ = middle-dose, □ = high-dose.
Supplemental Figure 6. Average somatosensory evoked potential (SEP) waveforms following a 1, 2, or 3 mA stimulus to tail caudal nerves after treatment with citronellal (CIT). Shaded regions represent the 95% confidence intervals. A.) SEPcortex: Treatment did not alter peak latencies or amplitudes recorded from the somatosensory cortex (n = 12–17 rats/waveform). B.) SEPcerebellum: Treatment did not alter peak latencies or amplitudes recorded from the cerebellum (n = 12–16 rats/waveform).
Supplemental Figure 7. Means of behavioral observations and measurements following treatment with BBA. Bars represent standard error. A.) Hindlimb grip-strength: When averaged over the 8- week period, all treatment groups had decreased hindlimb grip-strength. * = significant from controls. B.) Hindlimb foot-splay: When averaged over the 8 weeks, the low- and middle-dose groups had narrower foot splay than controls. However, the low-dose group also had less foot splay compared to the high-dose group. * = significant from controls, + = significant from high-dose. C.) Rearing: When averaged over the 8 weeks, the number of rears was greater in the low-dose group compared to the other treatments. The high-dose group had less rears than controls and the middle-dose group. * = significant, # = significant from low-dose. D.) Open-field activity ratings: In general, the low-dose had greater activity ratings than the other treatment groups. However, the differences were not strictly dose- or time-related, and thus should be interpreted with caution. * = significant from controls, # = significant from middle-dose, + = significant from high-dose.
Supplemental Figure 8. Average compound nerve action potential (CNAP) waveforms following evoked stimulation to tail caudal nerves after treatment with benzyl bromoacetate (BBA) (n = 6–14 rats/waveform). A.) CNAP1: Treatment did not alter peaks following a 1, 2, or 3 mA stimulus. Shaded regions represent the 95% confidence intervals. The large size of the confidence limits was caused by occasional baseline offsets for some of the control animals. B.) NCV: Treatment did not alter NCV.
Supplemental Figure 10. A.) Relationship between NCV and tail near nerve temperature for DCB-treated animals. As expected, increased tail temperature was associated with increased NCV. This increase did not differ between the DCB treatment groups, nor did the rate of increase account for the increased NCV observed in the 225 mg/kg/day group. Solid line = overall regression, dashed line = 95% prediction intervals. B.) Relationship between tail CNAP peak P1N1 peak-to-peak amplitude and body weight (as a surrogate for tail diameter). Increases in body weight were associated with a decrease in peak P1N1 amplitude, but the regression over-predicted the observed decrease by about 29%.
Supplemental Figure 9. Average somatosensory evoked potential (SEP) waveforms following a 1, 2, or 3 mA stimulus to tail caudal nerves after treatment with benzyl bromoacetate (BBA). Shaded regions represent the 95% confidence intervals. A.) SEPcortex: Treatment did not alter peak latencies or amplitudes recorded from the somatosensory cortex (n = 5–16 rats/waveform). B.) SEPcerebellum: Treatment did not alter peak latencies or amplitudes recorded from the cerebellum (n = 6–15 rats/waveform).