

Abstract
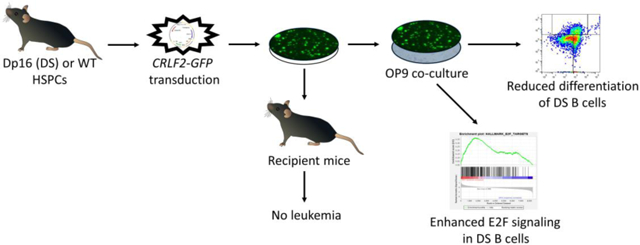
Children with Down syndrome (DS) are 10-fold more likely to develop B-cell acute lymphoblastic leukemia (B-ALL), with a higher frequency of rearrangements resulting in overexpression of cytokine receptor-like factor 2 (CRLF2). Here, we investigated the impact of CRLF2 overexpression on B-cell progenitor proliferation, immunophenotype, and gene expression profile in the Dp(16)1Yey (Dp16) mouse model of DS compared to wild-type (WT) mice. CRLF2 overexpression enhanced immature B-lymphoid colony development and increased the proportion of less differentiated pre-pro-B cells, with a greater effect in Dp16 versus WT. In CRLF2-rearranged (CRLF2-R) B-ALL patient samples, cells with higher CRLF2 expression exhibited a less differentiated B-cell immunophenotype. CRLF2 overexpression resulted in a gene expression signature associated with E2F signaling in both Dp16 B-progenitors and in DS-ALL patient samples, and PI3K/mTOR and pan-CDK inhibitors which reduce E2F-mediated signaling demonstrated cytotoxicity in CRLF2-R B-ALL cell lines and patient samples. CRLF2 overexpression alone in Dp16 stem and progenitor cells did not result in leukemic transformation in recipient mice. Thus, CRLF2 overexpression results in reduced B cell differentiation and enhanced E2F signaling in Dp16 B-progenitor cells and DS-ALL patient samples. These findings suggest a functional basis for the high frequency of CRLF2-R in DS-ALL as well as a potential therapeutically targetable pathway.
Keywords: Leukemia, Down syndrome
GRAPHICAL ABSTRACT
Introduction
Children with Down syndrome (DS) have a 10-fold increased risk of developing B cell acute lymphoblastic leukemia (B-ALL), and have poorer outcomes due to both increased relapse and treatment-related mortality [1, 2]. The spectrum of cytogenetic alterations is very different in DS compared to non-DS ALL. Approximately half of DS-ALL cases have cytokine receptor-like factor 2 rearrangements (CRLF2-R), compared to only 5-10% of non-DS ALL cases, with half of these also having Janus Kinase 2 (JAK2)-activating point mutations [3-8].
We sought to identify functional effects to explain the increased frequency of CRLF2-R ALL in individuals with DS, and identify upregulated signaling pathways in this subtype, which could be targeted therapeutically. Alternative therapeutic approaches offer benefit in patients with DS, due to their increased vulnerability to chemotherapeutic toxicity [1, 9, 10]. We utilized the Dp(16)1Yey (Dp16) mouse model of DS, which has triplication of ~115 genes with orthologues on human chromosome 21 (Hsa21), including the Down syndrome critical region (DSCR) [11]. Since none of the existing mouse models of DS spontaneously develop ALL, we evaluated ex vivo effects of CRLF2 overexpression in Dp16 versus WT hematopoietic stem and progenitor cells (HSPCs), including colony formation, lymphoid differentiation, and gene expression. We also transplanted CRLF2-overexpressing Dp16 or WT cells into recipient mice. See Supplementary Data for Methods.
Results and Discussion
Utilizing the Dp16 mouse model of DS, we compared effects of CRLF2 overexpression in Dp16 versus WT BM cells. We transduced Dp16 and WT BM HSPCs with a CRLF2-GFP or control GFP vector, and confirmed 70-95% of cells expressed GFP or hCRLF2 and GFP by flow cytometry prior to experiments (Supplemental Figure 1A). CRLF2 overexpression increased B-lymphoid colony production in both genetic backgrounds. Colonies persisted for only one replating (data not shown), indicating CRLF2 overexpression was insufficient for transformation. Colony production was lower, but the fold increase in colony formation with CRLF2 overexpression was significantly greater, in the Dp16 background (mean fold change 10.8 vs 6.4 p = 0.004, Figure 1A). These findings are consistent with prior studies reporting reduced B-lymphoid progenitors in DS models, including trisomy 21 fetal liver cells [12] and the Ts65Dn [13, 14] and Ts1Rhr [13] mouse models of DS.
Figure 1. CRLF2 overexpression enhances B-lymphoid colony formation and reduces B cell maturation, with a greater fold change in the Dp16 background.

(A) CRLF2 overexpression in BM HSPCs from both WT and Dp16 mice increased B-lymphoid colony growth compared to GFP control. Histogram depicts colony counts from six samples (two technical replicates across three independent experiments, Student’s t-test, *p<0.01, **p<0.001). Error bars indicate standard deviation. (B) CRLF2 overexpression in WT and Dp16 HSPCs grown in B cell-differentiation conditions resulted in an increased percentage of the less-differentiated pre-pro-B cells. This effect was greater in the Dp16 versus WT genetic background. Histogram shows percentage of pre-pro-B cells in the GFP+ gate of each experimental group, with mean values from three independent experiments with two biological replicates each (Student’s t-test, *p<0.05, **p<0.001). Error bars indicate standard deviation.
To characterize the effects of CRLF2 overexpression on B-lymphoid differentiation in the Dp16 and WT backgrounds, we performed Hardy fraction flow cytometric analysis [15] on CRLF2-GFP and GFP-transduced HSPC-enriched BM following one week co-culture on OP9 cells, which promote B cell differentiation [16]. Overexpression of CRLF2 significantly increased the percentage of cells in the less differentiated Hardy Fraction A (pre-pro-B) (mean of 3.9% vs 1.7% in Dp16, p=0.0002; and 2.8% vs 1.6% in WT, p=0.0002). The effect of CRLF2 overexpression was significantly greater in Dp16 versus WT cells (3.9% vs 2.8%, p=0.012) (Figure 1B).
We further evaluated the effects of CRLF2 overexpression on B-lineage differentiation by examining CRLF2-R B-ALL cases that exhibited both a less differentiated pro-B (CD34+/CD19+) population and a more differentiated pre-B (CD34−/CD19+) population. We identified two cases with these features, one DS-ALL (839) and one non-DS ALL (105127-R) (Supplemental Table 1). B-ALL cells with the highest CRLF2 staining demonstrated a significantly higher proportion of pro-B cells (78.2% versus 51.4%, p=0.024, Figure 2). We also assessed the correlation of CRLF2 and CD34 staining in non-DS CRLF2-R ALL patient samples, which only had CD34+ pro-B cells. We observed a significant (p<0.0001) positive correlation between CRLF2 and CD34 in each B-ALL patient sample. We observed the strongest correlation (by r value) between CRLF2 and CD34 in the DS-ALL patient sample (839, Supplemental Figure 2). Thus, higher levels of CRLF2 were associated with reduced B progenitor differentiation, similar to that observed in Dp16 and WT HSPCs.
Figure 2. CRLF2 overexpression is associated with reduced B cell differentiation in B-ALL patient samples.

(A) In two CRLF2-overexpressing B-ALL patient samples (DS-ALL 839 and non-DS ALL 105127-R) demonstrating both pro-B and pre-B populations, the high-CRLF2 mean fluorescence intensity (MFI) quartile demonstrated a significantly higher mean proportion of pro-B cells (p=0.024). (B) Representative flow plots showing CRLF2 overexpression correlates with a less differentiated immunophenotype in B-ALL patient samples 839 (DS) and 105127-R (non-DS).
These effects of CRLF2 overexpression in reducing B cell differentiation are concordant with prior studies [3, 4]. Our study is unique in demonstrating a significantly greater effect in the Dp16 versus WT background. The greater effect of CRLF2 overexpression in Dp16 versus WT HSPCs suggests that CRLF2 rearrangements provide a greater competitive advantage in the DS background, which may explain why this lesion occurs in a greater proportion of DS-ALL cases.
To further evaluate CRLF2 overexpression in the Dp16 and WT backgrounds, we compared transcriptional signatures associated with CRLF2 overexpression in sorted GFP+ Dp16 and WT HSPCs after one week of OP9 co-culture, which promotes B cell differentiation [16, 17]. We performed RNA sequencing and gene set enrichment analysis (GSEA) using the Hallmark gene expression sets [18] for these comparisons: (1) Dp16 CRLF2 versus Dp16 GFP; (2) Dp16 CRLF2 versus WT CRLF2; and (3) WT CRLF2 versus WT GFP. We compared three independent replicates per group, and confirmed CRLF2 overexpression (Supplemental Figure 1B). We found that CRLF2-mediated decreases in B cell differentiation in the Dp16 background are associated with upregulated E2F signaling (Figure 3). This was the only gene set with a familywise error rate p value <0.05 (Supplemental Table 2). To assess the relevance to human DS-ALL, we performed GSEA using publicly-available data from three cohorts containing CRLF2-overexpressing and CRLF2-WT DS-ALL patient samples. We observed significant upregulation of E2F signaling in two of three cohorts (GSE20910 and GSE17459-BFM) [7, 19], providing further support for the potential relevance of the E2F pathway as a therapeutic target for CRLF2-overexpressing DS-ALL (Supplemental Figure 3 and Supplemental Table 3).
Figure 3. Dp16 CRLF2 cells demonstrate enrichment for E2F targets.

Gene set enrichment analysis plots show upregulation of E2F targets in Dp16 CRLF2 cells compared to (A) Dp16 GFP cells and (B) WT CRLF2 cells. Normalized enrichment score (NES), false discovery rate (FDR) q-value, and familywise error rate (FWER) p-value are also displayed.
The majority of the leading edge genes from the E2F gene set are associated with DNA synthesis and cell cycle progression, and have potential as targets for leukemia therapies, including Wee1 [20] and Rrm2 [21] (Supplemental Table 4). We did not observe significant enrichment for Hallmark gene expression sets in WT cells overexpressing CRLF2, suggesting that CRLF2 confers a selective advantage in the DS background. In addition, a high percentage of DS-ALL [22] and iAMP21 B-ALL [23] cases have RB1 deletions, suggesting that higher E2F activity may be selected for with trisomy 21, via CRLF2 overexpression and/or RB1 deletion. Studies are needed to decipher the region of triplication contributing to this effect.
Targeting E2F directly is difficult, due to multiple E2F isoforms and limited potency of pan-E2F inhibitors [24, 25]. E2F activation involves signaling inputs from PI3K/mTOR and CDK activity [26-28]. We reasoned that inhibiting these pathways may be cytotoxic in CRLF2-overexpressing DS-ALL blasts. We tested a PI3K/mTOR inhibitor AZD2014 and a pan-CDK inhibitor AT7519, which directly reduce expression of E2F-transcribed genes [26, 29], in seven non-DS B-ALL cell lines and nine PDX-expanded B-ALL patient samples (Supplemental Table 1).
Both compounds demonstrated nanomolar-range cytotoxicity in all B-ALL cell lines, irrespective of CRLF2 mutation status. In the PDX-expanded primary samples, the compounds demonstrated nanomolar-range cytotoxicity in CRLF2-overexpressing cases, but demonstrated inconsistent potency in the CRLF2/JAK2 WT cases, and no clear specificity for CRLF2-overexpressing DS-ALL cases (Supplemental Figure 4). These experiments demonstrate preclinical utility of compounds that reduce E2F signaling in CRLF2-R DS and non-DS ALL.
Finally, we transplanted CRLF2-overexpressing Dp16 or WT HSPCs into recipient mice. We confirmed 70-95% transduction efficiency of GFP and CRLF2-GFP in Dp16 and WT HSPC cultures before transplantation. Mice engrafted with 2-20% GFP+ cells up to day 100 post-transplant, and the stained GFP+ cells of most recipients were typically B220+ B cells (Supplemental Figure 5), alongside GFP+ myeloid or T cells. However, engraftment was undetectable by day 140 post-transplant. Average engraftment was higher at every time point, and sustained for longer, in mice receiving WT versus Dp16 cells, suggesting an inherent reduction in repopulating capacity of Dp16 cells. No mice transplanted with CRLF2-overexpressing Dp16 or WT HSPCs developed leukemia, with at least 7 mice per group monitored for 6 months, which included a minimum of one month after engraftment was undetectable. Interestingly, B220+ CRLF2-overexpressing Dp16 cells displayed reduced staining intensity in most engrafted recipient mice relative to other groups and to B220+ GFP− cells within the same mice. Since B220 expression increases as B cell differentiate [15], CRLF2-overexpressing Dp16 cells may have demonstrated particularly dim B220 staining due to reduced B cell differentiation relative to the other conditions. As a control, we transplanted mice with HSPCs overexpressing NRASG12D. Mice transplanted with NRASG12D-overexpressing Dp16 or WT HSPCs developed rapid disease, with 9/24 WT mice and 10/25 Dp16 mice succumbing to CD4+CD8+ T-ALL with median latencies of 92 and 101 days (data not shown). The only current DS-ALL mouse model requires CRLF2 overexpression, JAK2R683G, and Pax5+/− [13]. However, it utilizes the Ts1Rhr mouse model of DS, which only has 31 triplicated Hsa21 orthologues. We expected the extra triplicated Hsa21 orthologues in Dp16 mice might contribute to B-ALL with only CRLF2 overexpression, but additional alterations are likely required.
Our Dp16 ex vivo differentiation model demonstrates the proliferative advantages of CRLF2 overexpression in Dp16 versus WT cells, which may contribute to the increased susceptibility to CRLF2-R ALL in children with DS. The upregulated E2F signaling may provide opportunities for therapeutic intervention. This model will be useful to test cytotoxicity of targeted therapies and combination regimens, and to investigate the leukemogenic effects of other clinically relevant oncogenes. Ultimately, insights from these studies may improve efficacy and reduce toxicity of therapy for CRLF2-R ALL, particularly in children with DS.
Supplementary Material
Supplemental Figure 1. Confirmation of CRLF2 overexpression in transduced cells. (A)CRLF2 overexpression in transduced BM HSPCs from both WT and Dp16 mice was confirmed by flow cytometry prior to downstream experiments. Representative results are shown. (B) hCRLF2 overexpression in the independent biological replicates used for RNA-Seq analysis was confirmed (hCRLF2 transcripts per million (TPM) shown, Student’s t-test, *p<0.005).
Supplemental Figure 2. CD34 and CRLF2 staining intensity is positively correlated for five independent B-ALL samples. Five PDX-expanded CRLF2-R DS- or non-DS ALL patient samples were assessed for CD34 (PE) and CRLF2 (BV605) surface staining intensity. We observed a significant (p<0.0001) positive correlation between CD34 and CRLF2 for each of the five samples. Best-fit trendlines are shown, r values were calculated by Pearson correlation.
Supplemental Figure 3. CRLF2-overexpressing DS-ALL samples display upregulation of E2F signaling. Gene set enrichment analysis plots show upregulation of E2F targets in CRLF2-overexpressing compared to CRLF2-WT DS-ALL patient samples in patient samples from (A) GSE20910 and (B) GSE17459-BFM. Normalized enrichment score (NES), false discovery rate (FDR) q-value, and familywise error rate (FWER) p-value are also displayed.
Supplemental Figure 4. B-ALL cell lines and DS-ALL and non-DS ALL patient samples are sensitive to AZD2014 and AT7519. CRLF2-R (solid circles) or CRLF2-WT (open circles) B-ALL cell lines were incubated for 72 hours with different doses of (A) AZD2014 or (B) AT7519. CRLF2-R (solid shapes) or CRLF2-WT (open shapes) DS-ALL (triangles) and non DS-ALL (circles) patient samples were incubated for 72 hours with different doses of (C) AZD2014 or (D) AT7519. Viability was measured by ATP assay, with three replicates per data point.
Supplemental Figure 5. The majority of engrafted GFP+ Dp16 or WT HSPCs are B220+ B cells. Recipient mice were bled every 2-4 weeks, and cells were stained with B, T, or myeloid cell markers. In the majority of engrafted mice, most of the stained GFP+ cells are B220+ B cells, with some myeloid and T cells. Representative examples demonstrate percentages of B220+ B cells. B220+ B cells, stained with two colors to differentiate between B220+ cells and myeloid or T cells, are displayed in the upper right gate. See Supplemental Data for methods details.
Highlights.
High CRLF2 reduces B cell differentiation in Down syndrome mouse progenitor cells
High CRLF2 is associated with less B-cell differentiation in human leukemia cells
High CRLF2 is associated with E2F signaling in Down syndrome mouse and human cells
Inhibitors of E2F signaling are cytotoxic in CRLF2+ acute lymphoblastic leukemia
High CRLF2 in Dp16 cells is not sufficient to generate leukemia in recipient mice
Acknowledgments
We thank Amos Gaikwad and Tatiana Goltsova of the Texas Children’s Cancer Center Flow Cytometry Core Laboratory, and Roger Reeves and Benjamin Devenney (Johns Hopkins University) for advice. This research was supported by a Scholar Award from the American Society of Hematology (J.J.J.); a grant from the Elsa U. Pardee Foundation (J.J.J.), funding from the NIH (P30 CA125123-12 and R01 CA249867, K.R.R.), grant RP170074 from the Cancer Prevention and Research Institute of Texas (K.R.R.), the Lynch family (K.R.R.), the Dan L. Duncan Comprehensive Cancer Center, and the John S. Dunn Gulf Coast Consortium for Chemical Genomics. This project was supported by the Cytometry and Cell Sorting Core at Baylor College of Medicine with funding from the CPRIT Core Facility Support Award (CPRIT-RP180672), the NIH (CA125123 and RR024574) and the assistance of Joel M. Sederstrom. We received support from Fabio Stossi of the Integrated Microscopy Core at BCM. Imaging for this project was supported by the Integrated Microscopy Core at Baylor College of Medicine with funding from NIH (DK56338, CA125123), and CPRIT (RP170719).
Footnotes
Publisher's Disclaimer: This is a PDF file of an unedited manuscript that has been accepted for publication. As a service to our customers we are providing this early version of the manuscript. The manuscript will undergo copyediting, typesetting, and review of the resulting proof before it is published in its final form. Please note that during the production process errors may be discovered which could affect the content, and all legal disclaimers that apply to the journal pertain.
Conflict of Interest Disclosures
The authors have no conflicts of interest to disclose.
Data Availability Statement
The datasets generated and/or analyzed during the current study are available in the European Nucleotide Archive repository: https://www.ebi.ac.uk/ena/browser/view/PRJEB43591.
References
- [1].Buitenkamp TD, Izraeli S, Zimmermann M, et al. Acute lymphoblastic leukemia in children with Down syndrome: a retrospective analysis from the Ponte di Legno study group. Blood. 2014;123:70–77. [DOI] [PMC free article] [PubMed] [Google Scholar]
- [2].Hasle H, Clemmensen IH, Mikkelsen M. Risks of leukaemia and solid tumours in individuals with Down's syndrome. Lancet. 2000;355:165–169. [DOI] [PubMed] [Google Scholar]
- [3].Mullighan CG, Collins-Underwood JR, Phillips LA, et al. Rearrangement of CRLF2 in B-progenitor- and Down syndrome-associated acute lymphoblastic leukemia. NatGenet. 2009;41:1243–1246. [DOI] [PMC free article] [PubMed] [Google Scholar]
- [4].Russell LJ, Capasso M, Vater I, et al. Deregulated expression of cytokine receptor gene, CRLF2, is involved in lymphoid transformation in B-cell precursor acute lymphoblastic leukemia. Blood. 2009;114:2688–2698. [DOI] [PubMed] [Google Scholar]
- [5].Bercovich D, Ganmore I, Scott LM, et al. Mutations of JAK2 in acute lymphoblastic leukaemias associated with Down's syndrome. Lancet. 2008;372:1484–1492. [DOI] [PubMed] [Google Scholar]
- [6].Gaikwad A, Rye CL, Devidas M, et al. Prevalence and clinical correlates of JAK2 mutations in Down syndrome acute lymphoblastic leukaemia. British journal of haematology. 2009;144:930–932 [DOI] [PMC free article] [PubMed] [Google Scholar]
- [7].Hertzberg L, Vendramini E, Ganmore I, et al. Down syndrome acute lymphoblastic leukemia, a highly heterogeneous disease in which aberrant expression of CRLF2 is associated with mutated JAK2: a report from the International BFM Study Group. Blood. 2010;115:1006–1017. [DOI] [PubMed] [Google Scholar]
- [8].Roberts KG, Li Y, Payne-Turner D, et al. Targetable kinase-activating lesions in Ph-like acute lymphoblastic leukemia. The New England journal of medicine. 2014;371:1005–1015. [DOI] [PMC free article] [PubMed] [Google Scholar]
- [9].O'Connor D, Bate J, Wade R, et al. Infection-related mortality in children with acute lymphoblastic leukemia: an analysis of infectious deaths on UKALL2003. Blood. 2014;124:1056–1061. [DOI] [PubMed] [Google Scholar]
- [10].Patrick K, Wade R, Goulden N, et al. Outcome of Down syndrome associated acute lymphoblastic leukaemia treated on a contemporary protocol. British journal of haematology. 2014;165:552–555. [DOI] [PubMed] [Google Scholar]
- [11].Li Z, Yu T, Morishima M, et al. Duplication of the entire 22.9 Mb human chromosome 21 syntenic region on mouse chromosome 16 causes cardiovascular and gastrointestinal abnormalities. Human molecular genetics. 2007;16:1359–1366. [DOI] [PubMed] [Google Scholar]
- [12].Roy A, Cowan G, Mead AJ, et al. Perturbation of fetal liver hematopoietic stem and progenitor cell development by trisomy 21. Proceedings of the National Academy of Sciences of the United States of America. 2012;109:17579–17584. [DOI] [PMC free article] [PubMed] [Google Scholar]
- [13].Lane AA, Chapuy B, Lin CY, et al. Triplication of a 21q22 region contributes to B cell transformation through HMGN1 overexpression and loss of histone H3 Lys27 trimethylation. Nature genetics. 2014;46:618–623. [DOI] [PMC free article] [PubMed] [Google Scholar]
- [14].Lorenzo LP, Chen H, Shatynski KE, et al. Defective hematopoietic stem cell and lymphoid progenitor development in the Ts65Dn mouse model of Down syndrome: potential role of oxidative stress. Antioxidants & redox signaling. 2011;15:2083–2094. [DOI] [PMC free article] [PubMed] [Google Scholar]
- [15].Hardy RR, Shinton SA. Characterization of B lymphopoiesis in mouse bone marrow and spleen. Methods in molecular biology. 2004;271:1–24. [DOI] [PubMed] [Google Scholar]
- [16].Wang H, Lee CH, Qi C, et al. IRF8 regulates B-cell lineage specification, commitment, and differentiation. Blood. 2008;112:4028–4038. [DOI] [PMC free article] [PubMed] [Google Scholar]
- [17].Cho SK, Webber TD, Carlyle JR, Nakano T, Lewis SM, Zuniga-Pflucker JC. Functional characterization of B lymphocytes generated in vitro from embryonic stem cells. Proceedings of the National Academy of Sciences of the United States of America. 1999;96:9797–9802. [DOI] [PMC free article] [PubMed] [Google Scholar]
- [18].Liberzon A, Birger C, Thorvaldsdottir H, Ghandi M, Mesirov JP, Tamayo P. The Molecular Signatures Database (MSigDB) hallmark gene set collection. Cell systems. 2015;1:417–425. [DOI] [PMC free article] [PubMed] [Google Scholar]
- [19].Loudin MG, Wang J, Leung HC, et al. Genomic profiling in Down syndrome acute lymphoblastic leukemia identifies histone gene deletions associated with altered methylation profiles. Leukemia. 2011;25:1555–1563. [DOI] [PMC free article] [PubMed] [Google Scholar]
- [20].Ghelli Luserna Di Rora A, Beeharry N, Imbrogno E, et al. Targeting WEE1 to enhance conventional therapies for acute lymphoblastic leukemia. Journal of hematology & oncology. 2018;11:99. [DOI] [PMC free article] [PubMed] [Google Scholar]
- [21].Aimiuwu J, Wang H, Chen P, et al. RNA-dependent inhibition of ribonucleotide reductase is a major pathway for 5-azacytidine activity in acute myeloid leukemia. Blood. 2012;119:5229–5238. [DOI] [PMC free article] [PubMed] [Google Scholar]
- [22].Schwartzman O, Savino AM, Gombert M, et al. Suppressors and activators of JAK-STAT signaling at diagnosis and relapse of acute lymphoblastic leukemia in Down syndrome. Proceedings of the National Academy of Sciences of the United States of America. 2017;114:E4030–E4039. [DOI] [PMC free article] [PubMed] [Google Scholar]
- [23].Schwab CJ, Chilton L, Morrison H, et al. Genes commonly deleted in childhood B-cell precursor acute lymphoblastic leukemia: association with cytogenetics and clinical features. Haematologica. 2013;98:1081–1088. [DOI] [PMC free article] [PubMed] [Google Scholar]
- [24].Kent LN, Leone G. The broken cycle: E2F dysfunction in cancer. Nature reviews Cancer. 2019;19:326–338. [DOI] [PubMed] [Google Scholar]
- [25].Ma Y, Kurtyka CA, Boyapalle S, et al. A small-molecule E2F inhibitor blocks growth in a melanoma culture model. Cancer research. 2008;68:6292–6299. [DOI] [PMC free article] [PubMed] [Google Scholar]
- [26].Michaloglou C, Crafter C, Siersbaek R, et al. Combined Inhibition of mTOR and CDK4/6 Is Required for Optimal Blockade of E2F Function and Long-term Growth Inhibition in Estrogen Receptor-positive Breast Cancer. Molecular cancer therapeutics. 2018;17:908–920. [DOI] [PMC free article] [PubMed] [Google Scholar]
- [27].Romero-Pozuelo J, Figlia G, Kaya O, Martin-Villalba A, Teleman AA. Cdk4 and Cdk6 Couple the Cell-Cycle Machinery to Cell Growth via mTORC1. Cell reports. 2020;31:107504. [DOI] [PubMed] [Google Scholar]
- [28].Zhou X, Liu W, Hu X, et al. Regulation of CHK1 by mTOR contributes to the evasion of DNA damage barrier of cancer cells. Scientific reports. 2017;7:1535. [DOI] [PMC free article] [PubMed] [Google Scholar]
- [29].Chae HD, Mitton B, Lacayo NJ, Sakamoto KM. Replication factor C3 is a CREB target gene that regulates cell cycle progression through the modulation of chromatin loading of PCNA. Leukemia. 2015;29:1379–1389. [DOI] [PMC free article] [PubMed] [Google Scholar]
Associated Data
This section collects any data citations, data availability statements, or supplementary materials included in this article.
Supplementary Materials
Supplemental Figure 1. Confirmation of CRLF2 overexpression in transduced cells. (A)CRLF2 overexpression in transduced BM HSPCs from both WT and Dp16 mice was confirmed by flow cytometry prior to downstream experiments. Representative results are shown. (B) hCRLF2 overexpression in the independent biological replicates used for RNA-Seq analysis was confirmed (hCRLF2 transcripts per million (TPM) shown, Student’s t-test, *p<0.005).
Supplemental Figure 2. CD34 and CRLF2 staining intensity is positively correlated for five independent B-ALL samples. Five PDX-expanded CRLF2-R DS- or non-DS ALL patient samples were assessed for CD34 (PE) and CRLF2 (BV605) surface staining intensity. We observed a significant (p<0.0001) positive correlation between CD34 and CRLF2 for each of the five samples. Best-fit trendlines are shown, r values were calculated by Pearson correlation.
Supplemental Figure 3. CRLF2-overexpressing DS-ALL samples display upregulation of E2F signaling. Gene set enrichment analysis plots show upregulation of E2F targets in CRLF2-overexpressing compared to CRLF2-WT DS-ALL patient samples in patient samples from (A) GSE20910 and (B) GSE17459-BFM. Normalized enrichment score (NES), false discovery rate (FDR) q-value, and familywise error rate (FWER) p-value are also displayed.
Supplemental Figure 4. B-ALL cell lines and DS-ALL and non-DS ALL patient samples are sensitive to AZD2014 and AT7519. CRLF2-R (solid circles) or CRLF2-WT (open circles) B-ALL cell lines were incubated for 72 hours with different doses of (A) AZD2014 or (B) AT7519. CRLF2-R (solid shapes) or CRLF2-WT (open shapes) DS-ALL (triangles) and non DS-ALL (circles) patient samples were incubated for 72 hours with different doses of (C) AZD2014 or (D) AT7519. Viability was measured by ATP assay, with three replicates per data point.
Supplemental Figure 5. The majority of engrafted GFP+ Dp16 or WT HSPCs are B220+ B cells. Recipient mice were bled every 2-4 weeks, and cells were stained with B, T, or myeloid cell markers. In the majority of engrafted mice, most of the stained GFP+ cells are B220+ B cells, with some myeloid and T cells. Representative examples demonstrate percentages of B220+ B cells. B220+ B cells, stained with two colors to differentiate between B220+ cells and myeloid or T cells, are displayed in the upper right gate. See Supplemental Data for methods details.
Data Availability Statement
The datasets generated and/or analyzed during the current study are available in the European Nucleotide Archive repository: https://www.ebi.ac.uk/ena/browser/view/PRJEB43591.