



Abstract
Background
Early detection and prompt intervention for clinically deteriorating events are needed to improve clinical outcomes. There have been several attempts at this, including the introduction of rapid response teams (RRTs) with early warning scores. We developed a deep-learning-based pediatric early warning system (pDEWS) and validated its performance.
Methods
This single-center retrospective observational cohort study reviewed, 50,019 pediatric patients admitted to the general ward in a tertiary-care academic children's hospital from January 2012 to December 2018. They were split by admission date into a derivation and a validation cohort. We developed a pDEWS for the early prediction of cardiopulmonary arrest and unexpected ward-to-pediatric intensive care unit (PICU) transfer. Then, we validated this system by comparing modified pediatric early warning score (PEWS), random forest (RF); an ensemble model of multiple decision trees and logistic regression (LR); a statistical model that uses a logistic function.
Results
For predicting cardiopulmonary arrest, the pDEWS (area under the receiver operating characteristic curve (AUROC), 0.923) outperformed modified PEWS (AUROC, 0.769) and reduced the mean alarm count per day (MACPD) and number needed to examine (NNE) by 82.0% (from 46.7 to 8.4 MACPD) and 89.5% (from 0.303 to 0.807), respectively. Furthermore, for predicting unexpected ward-to-PICU transfer pDEWS also showed superior performance compared to existing methods.
Conclusion
Our study showed that pDEWS was superior to the modified PEWS and prediction models using RF and LR. This study demonstrates that the integration of the pDEWS into RRTs could increase operational efficiency and improve clinical outcomes.
Keywords: Early warning score, Deep learning, Critical care, Pediatrics
Graphical abstract
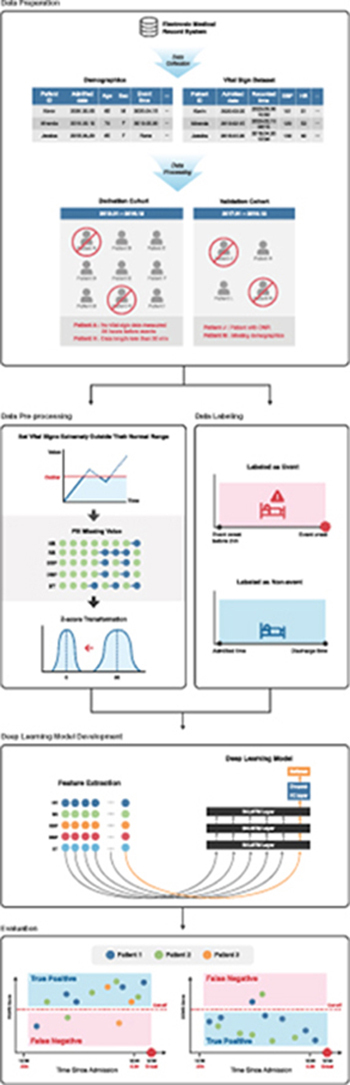
At a glance commentary
Scientific background on the subject
Early detection and prompt intervention for clinically deteriorating events are highly required to improve clinical outcomes. For this purpose, early warning scores were developed and rapid response teams are introduced. However, there have been some limitations to be effectively operated.
What this study adds to the field
In this study, we developed a deep-learning-based pediatric early warning system (pDEWS) for detecting clinical deteriorating events, which outperformed previously used early warning scoring systems. This study demonstrates that the use of the pDEWS could be promising to improve clinical outcomes.
Hospitalized children are inevitably susceptible to clinical deterioration, which leads to potentially devastating consequences [1]. The early detection of prodromal signs of clinical deterioration for prompt intervention is important to improve clinical outcomes [[2], [3], [4]]. There have been several attempts to address this, including the introduction of rapid response teams (RRTs) in hospitals [[5], [6], [7], [8], [9]]. However, it is still challenging to efficiently operate an RRT. There are several afferent and efferent components, such as prompt tracking and detection of the early signs of clinical deterioration, proper triggering of team activation, and timely qualified intervention. In terms of the afferent limb of RRTs, most institutions have their own criteria including concerns from physicians, nurses, and family members or subjective assessment with or without systematic early warning scores (EWSs) [[10], [11], [12], [13], [14], [15]]. However, an effective RRT operation has several barriers associated with personnel factors, including interpersonal differences in knowledge, awareness, training level, confidence, cultural background, hierarchies, inaccurate recording of data, and erroneous calculation of EWSs [[16], [17], [18]].
Recently, there has been a marked evolution in the field of artificial intelligence and machine learning (ML), which can use a huge amount of data, extract essential information, and find and learn significant patterns. It has rapidly revolutionized and changed numerous aspects of daily life so much so that sometimes it has been used to replace a human [19,20]. In medicine, it has shown remarkable performance in several healthcare domains, including cancer diagnosis, triage decisions and classification in emergency departments, and precise prediction of critical events [[21], [22], [23], [24]]. However, there are few studies on the use of ML in pediatric critical care.
In this study, we aimed to develop a deep-learning-based pediatric early warning system (pDEWS) and evaluated its performance in predicting cardiopulmonary arrest and unexpected ward-to-pediatric intensive care unit (PICU) transfers in general-ward-hospitalized pediatric patients and its effectiveness as an afferent limb of RRT operations compared to other prediction models.
Methods
Study population
We conducted a retrospective observational cohort study of pediatric patients admitted to the general ward of Asan Medical Center Children's Hospital between January 2012 and December 2018. This is a tertiary academic children's hospital with 176 beds for general ward inpatients and a 25-bed multidisciplinary medical-surgical PICU. This study was approved by the institutional review board of Asan Medical Center, Seoul, Korea (2019–0137). The requirement for informed consent was waived due to the retrospective nature of the study. We excluded patients with measured and recorded data lengths of less than 30 min, no vital sign data measured 24 h before events, and missing demographic data, and patients with do-not-resuscitate orders. Patient information was anonymized and de-identified before analysis. The study population was split into derivation and validation cohorts according to the admission period: the derivation cohort consisted of patients admitted from January 2012 to December 2016 and the validation cohort consisted of patients admitted from January 2017 to December 2018. All patients were only included in either the derivation or validation cohort; thus, the cohorts were mutually exclusive.
Data collection and processing for ML
In this study, we defined critical events as cardiopulmonary arrest or unexpected ward-to-PICU transfer. Unexpected ward-to-PICU was defined as “PICU admission due to acutely deteriorating clinical conditions”, which excluded PICU admissions for routine scheduled postoperative care or scheduled procedures. We collected data including age, sex, the occurrence of events, exact time and location of event occurrences, length of hospitalization, and five time-stamped basic vital signs (systolic blood pressure (SBP), diastolic blood pressure (DBP), heart rate (HR), respiratory rate (RR), and body temperature (BT)) measured during the period from admission to either event occurrence or discharge, from electronic medical record (EMR) sources. For data cleaning, considering the possibility of errors by clinical providers when generating EMR data, we set vital signs that were extremely outside their age-adjusted normal range as missing values. In cases of missing data, we used the most recently measured values. Also, if there were no past values, we used the median value of the corresponding vital sign. The ranges of outliers and missing rates of each variable are presented in Table A.1.
Development of the pDEWS
We developed a pDEWS using Python 3.0 and the TensorFlow 13.1 package. While designing the pDEWS, we considered that the structure of the data are a time-series data. In other words, the order of the data is important information for the model to effectively predict the outcome. Therefore, we chose recurrent neural network with long short-term memory units (LSTM) which is one of the most powerful choices of deep learning models in addressing sequential data. Also, in real practice, the physician attends the electronic medical record data in reverse time order. Thus, we have used bidirectional LSTM instead of traditional LSTM to provide additional context to the network. Furthermore, we have assumed the number of layers and the number of hidden units as hyperparameters and tuned them using 10% of the derivation cohort data. As a result, pDEWS consists of three bidirectional recurrent neural network layers with LSTM units, three fully connected layers with rectified linear units, dropout and batch normalization on each fully connected layer, and a softmax layer at the end to output a score between zero and one.
We tested the model configuration by using 10% of the derivation dataset. We have changed the learning rate, number of batch sizes, the rate of dropout, number of output dimensions, number of layers, and the length of the window. The hyperparameters were selected through a random search, which is known to be the most effective hyperparameter tuning method in the context of deep learning. In particular, the performance of the model was sensitive to the learning rate: we started from 0.3, 0.2, 0.1, 0.01, and 0.001 and found that 0.001 was the most effective. Furthermore, we found that the complexity of the model and the regularization methods were effective in training the deep learning model. For identifying the optimal complexity of the model, we evaluated the output dimension (16, 32, 64, 128, and 256) and the number of layers (1, 2, 3, 4, and 5). Furthermore, we tested the window length by incrementing the length using 1,5, 10, 20, 30, 50, and 100. Finally, we found that the model was most effective at a window length of 20. Although window lengths of 30 and 50 were similar to that of 20, we decided to set the length to 20 measurements since it requires more data. Thus, the LSTM units used time-series data from the previous 20 consecutive serial data as an input [Fig. 1]. We defined the prediction window for events as the interval from 0.5 to 24 h before the events. For patients with an event, the vital sign data within the prediction window were labeled as “event” and others were labeled as “non-event”. Then, the pDEWS was trained using data from five time-stamped basic vital signs from the derivation cohort by Adam optimization with default parameters and with binary-cross entropy as a loss function [25,26]. Each time we changed one of the parameters we trained our model for 1000 epochs and selected the model with the highest area under the receiver operating characteristic curve (AUROC) in the validation data. For tuning the machine learning models (i.e., logistic regression (LR) and random forest (RF)) we used grid search and similarly selected the model with the highest AUROC in the validation data.
Fig. 1.

The development process of the deep-learning-based pediatric early warning system using five vital signs. Abbreviations: BN: batch normalization; BI-LSTM: bidirectional-long short-term memory; HR: heart rate; RR: respiratory rate; SBP: systolic blood pressure; DBP: diastolic blood pressure; BT: body temperature.
Test of pDEWS performance and statistical analysis
Data analysis was performed using the Statistical Package for the Social Sciences (SPSS version 21.0 for Windows; IBM, Armonk, NY) and a scientific computing package (SciPy 1.0; community-driven project sponsored by NumFOCUS). We validated the newly developed pDEWS using a validation cohort, which was not used in the development of the prediction system. Model performance was assessed based on discrimination using the AUROC and area under the precision–recall curve (AUPRC). AUROC is measured from a plot of sensitivity against 1-specificity. Compared with the AUROC, the AUPRC is suitable for verifying false-positive rates with varying sensitivity and shows precision (i.e., 1-false alarm rate) against recall (i.e., sensitivity). It was calculated assuming a skewed large domain of true negatives. We also evaluated the positive predictive value (PPV = true positive/(true positive + false positive)), negative predictive value (NPV = true negative/(true negative + false negative)), positive likelihood ratio (PLR = sensitivity/1 – specificity), negative likelihood ratio (NLR = 1 - sensitivity/specificity), F-score (2 x (precision x recall)/(precision + recall)), net reclassification index (NRI), mean alarm count per day (MACPD), and number needed to examine (NNE) [[27], [28], [29], [30], [31], [32]]. The NRI is used to compare the improvement in prediction performance gained.
We also compared the performance of the pDEWS to that of other conventional ML methods, such as RF- and LR-based prediction models and the modified PEWS score. RF and LR are the representative models in machine learning. RF is an ensemble model of multiple decision trees. Each tree is constructed by computing the entropy of each class, in other words, by choosing the feature which can most effectively split the dataset into different classes. After multiple trees are constructed, each of them outputs a class prediction and the class with the most votes becomes the final prediction value. LR models the probability of each class by combining input values linearly using weights and transforms the output into a binary value using a logistic function. The modified PEWS was defined as a score including the five vital sign parameters (HR, RR, SBP, oxygen saturation, and temperature) of the original PEWS [11] [Table A.2].
Results
Study population
Among the 51,536 patients admitted, 1,518 were excluded. Finally, 50,019 patients were included [Fig. 2]. The derivation cohort included 28,857 patients, with 75 cases of cardiopulmonary arrest and 337 cases of unexpected ward-to-PICU transfers. The validation cohort included 21,162 patients with 37 cases of cardiopulmonary arrest and 346 cases of unexpected ward-to-PICU transfers. Most parameters showed a significant difference between the derivation and validation cohorts, which showed that the two cohorts comprised populations with different characteristics [Table 1].
Fig. 2.

A flow diagram for patient inclusion and exclusion.
Table 1.
Baseline characteristics of the study population.
| Baseline characteristics | Derivation cohort (n = 28857) | Validation cohort (n = 21162) | p-value |
|---|---|---|---|
| Total admissions, n | 28857 | 21162 | – |
| Vital sign data set, n | 978684 | 797172 | – |
| Admissions with unexpected PICU transfer | 337 | 346 | <0.001 |
| Vital sign data set, n | 2849 | 2541 | – |
| Admissions with in-hospital cardiac arrest, n | 75 | 37 | <0.001 |
| Vital sign data set, n | 2230 | 1175 | |
| Male, n (%) | 16155 (56.0) | 11597 (54.8) | 0.008 |
| Age, year (mean ± SD) | 6.08 ± 5.73 | 6.29 ± 5.54 | <0.001 |
| Length of stay, median (IQR) | 3.62 (1.7–6.7) | 3.67 (1.7–7.6) | <0.001 |
| Initial vital signs, mean ± SD | |||
| Systolic blood pressure (mmHg) | 106.61 ± 13.41 | 105.16 ± 13.27 | <0.001 |
| Diastolic blood pressure (mmHg) | 65.23 ± 12.31 | 65.52 ± 11.20 | 0.008 |
| Heart rate (bpm) | 116.12 ± 25.27 | 115.31 ± 24.28 | <0.001 |
| Respiratory rate (breaths/min) | 28.60 ± 8.87 | 27.95 ± 8.43 | <0.001 |
| Body temperature (°C) | 36.67 ± 0.53 | 36.68 ± 0.50 | 0.003 |
| Lactate | 2.70 ± 2.41 | 2.73 ± 2.50 | 0.875 |
| SpO2 | 94.54 ± 11.10 | 94.34 ± 10.91 | 0.894 |
| Vital signs within 24 h before outcome, mean ± SD | |||
| Systolic blood pressure (mmHg) | 86.23 ± 22.65 | 84.91 ± 21.69 | 0.174 |
| Diastolic blood pressure (mmHg) | 46.72 ± 16.06 | 48.99 ± 13.78 | <0.001 |
| Heart rate (bpm) | 134.24 ± 31.44 | 141.85 ± 31.48 | <0.001 |
| Respiratory rate (breaths/min) | 33.80 ± 10.65 | 30.98 ± 9.74 | <0.001 |
| Body temperature (°C) | 36.40 ± 0.92 | 36.18 ± 1.22 | <0.001 |
| Lactate | 3.64 ± 3.76 | 2.50 ± 2.11 | <0.001 |
| SpO2 | 81.01 ± 21.49 | 90.54 ± 15.48 | <0.001 |
| Total vital signs, mean ± SD | |||
| Systolic blood pressure (mmHg) | 103.81 ± 15.37 | 102.62 ± 14.71 | <0.001 |
| Diastolic blood pressure (mmHg) | 61.36 ± 13.25 | 61.66 ± 12.52 | <0.001 |
| Heart rate (bpm) | 114.49 ± 27.15 | 113.36 ± 25.82 | <0.001 |
| Respiratory Rate (breaths/min) | 27.72 ± 8.78 | 27.70 ± 8.38 | 0.083 |
| Body temperature (°C) | 36.72 ± 0.61 | 36.74 ± 0.61 | <0.001 |
| Lactate | 1.93 ± 2.12 | 1.82 ± 1.92 | <0.001 |
| SpO2 | 94.96 ± 9.68 | 94.81 ± 9.04 | <0.001 |
| Causes of admission, n (%) | <0.001 | ||
| For operation | 4601 (21.7) | 6928 (24.0) | |
| Hemato-oncologic disorders | 4619 (21.8) | 5099 (17.7) | |
| Cardiac disorders | 2957 (14.0) | 3975 (13.8) | |
| Neurologic disorders | 2147 (10.1) | 3765 (13.0) | |
| Renal disorders | 1361 (6.4) | 2472 (8.6) | |
| Gastrointestinal disorders | 1755 (8.3) | 1826 (6.3) | |
| Respiratory disorders | 1026 (4.8) | 1995 (6.9) | |
| Endocrinologic/genetic disorders | 1714 (8.1) | 1056 (3.7) | |
| Infectious diseases | 572 (2.7) | 1224 (4.2) | |
| Others | 410 (1.9) | 517 (1.8) | |
Abbreviations: n:number; PICU:pediatric intensive care unit; SD: standard deviation; IQR: interquartile range.
Validation of the pDEWS
The pDEWS yielded an AUROC of 0.923 (95% CI, 0.918–0.929) and 0.911 (95% CI, 0.906–0.917) in predicting cardiopulmonary arrest and unexpected ward-to-PICU transfers, respectively. These were larger than those of the RF model, the LR model, or the modified PEWS [Fig. 3]. The AUPRCs of the pDEWS in predicting cardiopulmonary arrest and unexpected ward-to-PICU transfers was 0.039 (95% CI, 0.036–0.045) and 0.155 (95% CI, 0.144–0.167), respectively. These were also larger than those of the RF model, the LR model, or the modified PEWS [Table 2].
Fig. 3.

Areas under the receiver operating characteristic curves for the prediction of (A) cardiopulmonary arrest and (B) unexpected ward-to-pediatric intensive care unit transfer. Abbreviations: AUROC: area under the receiver operating characteristic curve; pDEWS: deep-learning-based pediatric early warning system; modified PEWS: modified pediatric early warning score; RF: random forest; LR: logistic regression.
Table 2.
Areas under the precision–recall curves for the prediction of cardiopulmonary arrest and unexpected ward-to-pediatric intensive care unit transfer.
| AUPRC (95% CI) |
||
|---|---|---|
| Cardiopulmonary arrest | Unexpected ward-to-PICU transfer | |
| pDEWS | 0.039 (0.036–0.045) | 0.155 (0.144–0.167) |
| RF | 0.019 (0.018–0.023) | 0.083 (0.076–0.095) |
| LR | 0.018 (0.017–0.021) | 0.051 (0.047–0.057) |
| Modified PEWS | 0.010 (0.009–0.012) | 0.008 (0.008–0.009) |
Abbreviations: AUPRC: area under the precision–recall curve; PICU: pediatric intensive care unit; pDEWS: deep-learning-based pediatric early warning system; RF: random forest; LR: logistic regression; modified PEWS: modified pediatric early warning score.
We evaluated the sensitivity, specificity, PLR, NLR, PPV, NPV, F-score, MACPD, and NNE by each cut-off value for the prediction of cardiopulmonary arrest [Table 3] and unexpected ward-to-PICU transfers [Table 4]. Given that the cut-off value of the pDEWS was 95, it showed the best F-score, corresponding to the most acceptable PPV and NPV for clinical integration. It also showed an acceptable MACPD (9.8 for cardiopulmonary arrest and 9.5 for unexpected ward-to-PICU transfers) with the highest PLR and NLR and acceptable specificity and sensitivity for both critical events.
Table 3.
Performance of the deep-learning-based pediatric early warning system for prediction of cardiopulmonary arrest at different cut-off levels.
| Cut-off | Sen | Spec | PLR | NLR | PPV | NPV | F-score | MACPD | NNE |
|---|---|---|---|---|---|---|---|---|---|
| 5 | 0.956 | 0.597 | 2.372 | 0.074 | 0.003 | 1.000 | 0.007 | 439.5 | 285.7 |
| 10 | 0.933 | 0.683 | 2.944 | 0.098 | 0.004 | 1.000 | 0.009 | 345.9 | 230.4 |
| 15 | 0.923 | 0.736 | 3.496 | 0.105 | 0.005 | 1.000 | 0.010 | 288.3 | 194.2 |
| 20 | 0.911 | 0.774 | 4.029 | 0.114 | 0.006 | 1.000 | 0.012 | 247.4 | 168.6 |
| 25 | 0.897 | 0.803 | 4.552 | 0.128 | 0.007 | 1.000 | 0.013 | 215.7 | 149.4 |
| 30 | 0.878 | 0.827 | 5.076 | 0.147 | 0.007 | 1.000 | 0.015 | 189.5 | 134.0 |
| 35 | 0.856 | 0.847 | 5.606 | 0.170 | 0.008 | 1.000 | 0.016 | 167.4 | 121.5 |
| 40 | 0.842 | 0.865 | 6.226 | 0.183 | 0.009 | 1.000 | 0.018 | 148.3 | 109.5 |
| 45 | 0.820 | 0.880 | 6.856 | 0.204 | 0.010 | 1.000 | 0.020 | 131.4 | 99.5 |
| 50 | 0.795 | 0.894 | 7.506 | 0.229 | 0.011 | 1.000 | 0.022 | 116.4 | 91.0 |
| 55 | 0.771 | 0.907 | 8.267 | 0.252 | 0.012 | 1.000 | 0.024 | 102.6 | 82.7 |
| 60 | 0.739 | 0.918 | 9.049 | 0.285 | 0.013 | 1.000 | 0.026 | 89.9 | 75.6 |
| 65 | 0.698 | 0.930 | 9.925 | 0.325 | 0.014 | 1.000 | 0.028 | 77.6 | 69.0 |
| 70 | 0.652 | 0.940 | 10.944 | 0.370 | 0.016 | 0.999 | 0.031 | 65.8 | 62.7 |
| 75 | 0.609 | 0.951 | 12.462 | 0.411 | 0.018 | 0.999 | 0.035 | 54.1 | 55.2 |
| 80 | 0.554 | 0.962 | 14.401 | 0.464 | 0.021 | 0.999 | 0.040 | 42.7 | 47.9 |
| 85 | 0.504 | 0.972 | 17.802 | 0.511 | 0.026 | 0.999 | 0.049 | 31.6 | 38.9 |
| 90 | 0.437 | 0.982 | 23.842 | 0.573 | 0.034 | 0.999 | 0.063 | 20.6 | 29.3 |
| 95 | 0.327 | 0.991 | 38.359 | 0.679 | 0.054 | 0.999 | 0.092 | 9.8 | 18.6 |
Abbreviations: Sen: sensitivity; Spec: specificity; PLR: positive likelihood ratio; NLR: negative likelihood ratio; PPV: positive predictive value; NPV: negative predictive value; NRI: net reclassification index; MACPD: mean alarm count per day; NNE: number needed to examine.
Table 4.
Performance of the deep-learning-based pediatric early warning system for the prediction of unexpected ward-to-PICU transfer at different cut-off levels.
| Cut-off | Sen | Spec | PLR | NLR | PPV | NPV | F-score | MACPD | NNE |
|---|---|---|---|---|---|---|---|---|---|
| 5 | 0.964 | 0.442 | 1.727 | 0.081 | 0.005 | 1.000 | 0.011 | 610.2 | 181.8 |
| 10 | 0.939 | 0.595 | 2.321 | 0.102 | 0.007 | 1.000 | 0.015 | 442.9 | 135.5 |
| 15 | 0.917 | 0.684 | 2.902 | 0.121 | 0.009 | 1.000 | 0.018 | 346.7 | 108.6 |
| 20 | 0.894 | 0.743 | 3.480 | 0.142 | 0.011 | 1.000 | 0.022 | 282.4 | 90.7 |
| 25 | 0.870 | 0.787 | 4.084 | 0.166 | 0.013 | 0.999 | 0.025 | 234.5 | 77.5 |
| 30 | 0.842 | 0.822 | 4.719 | 0.192 | 0.015 | 0.999 | 0.029 | 196.9 | 67.2 |
| 35 | 0.819 | 0.849 | 5.426 | 0.213 | 0.017 | 0.999 | 0.033 | 167.0 | 58.6 |
| 40 | 0.798 | 0.871 | 6.198 | 0.232 | 0.019 | 0.999 | 0.038 | 142.7 | 51.4 |
| 45 | 0.776 | 0.890 | 7.059 | 0.252 | 0.022 | 0.999 | 0.043 | 122.1 | 45.2 |
| 50 | 0.754 | 0.906 | 8.048 | 0.271 | 0.025 | 0.999 | 0.049 | 104.5 | 39.8 |
| 55 | 0.729 | 0.920 | 9.165 | 0.295 | 0.029 | 0.999 | 0.055 | 89.0 | 35.1 |
| 60 | 0.704 | 0.933 | 10.504 | 0.317 | 0.033 | 0.999 | 0.062 | 75.3 | 30.7 |
| 65 | 0.678 | 0.944 | 12.155 | 0.341 | 0.037 | 0.999 | 0.071 | 63.0 | 26.7 |
| 70 | 0.647 | 0.954 | 14.127 | 0.370 | 0.043 | 0.999 | 0.081 | 52.1 | 23.1 |
| 75 | 0.616 | 0.963 | 16.744 | 0.399 | 0.051 | 0.999 | 0.094 | 42.1 | 19.6 |
| 80 | 0.580 | 0.971 | 20.093 | 0.432 | 0.060 | 0.999 | 0.110 | 33.4 | 16.5 |
| 85 | 0.538 | 0.978 | 24.993 | 0.472 | 0.074 | 0.998 | 0.130 | 25.3 | 13.5 |
| 90 | 0.481 | 0.986 | 33.348 | 0.526 | 0.096 | 0.998 | 0.161 | 17.4 | 10.4 |
| 95 | 0.406 | 0.993 | 54.309 | 0.599 | 0.148 | 0.998 | 0.217 | 9.5 | 6.7 |
Abbreviations: Sen: sensitivity; Spec: specificity; PLR: positive likelihood ratio; NLR: negative likelihood ratio; PPV: positive predictive value; NPV: negative predictive value; NRI: net reclassification index; MACPD: mean alarm count per day; NNE: number needed to examine.
In the paired comparison at the same specificity to the modified PEWS and prediction models using RF or LR, the pDEWS showed superior performance than others with the highest sensitivity, PLR, PPV, F-score, and NRI, and the lowest NLR and NNE, in both critical events. In predicting cardiopulmonary arrest, the pDEWS showed improvements in the sensitivity of up to 237.5%, in PLR of up to 518%, and in an NLR of up to 94.2% compared to the modified PEWS [Table 5]. In terms of unexpected ward-to-PICU transfers, the maximum improved sensitivity, PLR, and NLR were 2118.1%, 2793.1%, and 89.7% compared to the modified PEWS, respectively [Table 6].
Table 5.
Comparison of performance in the prediction of cardiopulmonary arrest at the same specificity.
| Cut-off | Sen | Spec | PLR | NLR | PPV | NPV | F-score | NRI | MACPD | NNE |
|---|---|---|---|---|---|---|---|---|---|---|
| Modified PEWS ≥1 | 0.927 | 0.320 | 1.362 | 0.228 | 0.002 | 1.000 | 0.004 | 740.7 | 496.5 | |
| pDEWS ≥0.36 | 0.996 | 0.320 | 1.465 | 0.013 | 0.002 | 1.000 | 0.004 | 0.0016 | 740.2 | 461.8 |
| RF ≥ 9.7 | 0.987 | 0.320 | 1.451 | 0.039 | 0.002 | 1.000 | 0.004 | 0.0002 | 740.7 | 466.1 |
| LR ≥ 7.8 | 0.986 |
0.320 | 1.452 | 0.042 |
0.002 | 1.000 | 0.004 | 0.0027 | 739.9 | 466.0 |
| Modified PEWS ≥2 | 0.706 | 0.679 | 2.199 | 0.432 | 0.003 | 0.999 | 0.006 | 350.3 | 308.1 | |
| pDEWS ≥9.6 | 0.934 | 0.679 | 2.909 | 0.096 | 0.004 | 1.000 | 0.004 | 0.0010 | 350.7 | 233.1 |
| RF ≥ 34.5 | 0.926 | 0.679 | 2.885 | 0.109 | 0.004 | 1.000 | 0.008 | 0.0015 | 350.2 | 235.0 |
| LR ≥ 30.8 | 0.912 | 0.679 | 2.844 | 0.129 | 0.004 | 1.000 | 0.008 | 0.0016 | 350.1 | 238.4 |
| Modified PEWS ≥3 | 0.494 | 0.877 | 4.015 | 0.576 | 0.006 | 0.999 | 0.012 | 134.7 | 169.2 | |
| pDEWS ≥44.1 | 0.824 | 0.878 | 6.738 | 0.200 | 0.010 | 1.000 | 0.020 | 0.0049 | 134.2 | 101.2 |
| RF ≥ 65.8 | 0.704 | 0.878 | 5.749 | 0.337 | 0.008 | 1.000 | 0.017 | 0.0033 | 134.2 | 118.4 |
| LR ≥ 62.8 | 0.719 | 0.877 | 5.886 | 0.319 | 0.009 | 1.000 | 0.017 | 0.0038 | 134.0 | 115.7 |
| Modified PEWS ≥4 | 0.303 | 0.957 | 7.121 | 0.728 | 0.010 | 0.999 | 0.020 | 46.7 | 95.8 | |
| pDEWS ≥78.1 | 0.573 | 0.958 | 13.539 | 0.446 | 0.020 | 0.999 | 0.038 | 0.0095 | 46.9 | 50.8 |
| RF ≥ 86.5 | 0.435 | 0.958 | 10.418 | 0.589 | 0.015 | 0.999 | 0.029 | 0.0054 | 46.1 | 65.8 |
| LR ≥ 87.1 | 0.399 | 0.957 | 9.565 | 0.627 | 0.014 | 0.999 | 0.027 | 0.0042 | 46.0 | 71.5 |
| Modified PEWS ≥5 | 0.162 | 0.988 | 13.195 | 0.848 | 0.019 | 0.999 | 0.034 | 13.6 | 52.2 | |
| pDEWS ≥93.3 | 0.369 | 0.988 | 31.666 | 0.638 | 0.045 | 0.999 | 0.080 | 0.0252 | 13.3 | 22.3 |
| RF ≥ 94.1 | 0.217 | 0.988 | 19.139 | 0.792 | 0.028 | 0.999 | 0.049 | 0.0075 | 12.6 | 36.2 |
| LR ≥ 94.9 | 0.209 | 0.988 | 17.996 | 0.800 | 0.026 | 0.999 | 0.046 | 0.0062 | 12.9 | 38.5 |
| Modified PEWS ≥6 | 0.050 | 0.997 | 15.968 | 0.952 | 0.023 | 0.999 | 0.032 | 3.5 | 43.3 | |
| pDEWS ≥98.4 | 0.152 | 0.997 | 60.377 | 0.849 | 0.082 | 0.999 | 0.107 | 0.0476 | 3.0 | 12.1 |
| RF ≥ 97.6 | 0.098 | 0.997 | 39.763 | 0.904 | 0.056 | 0.999 | 0.071 | 0.0226 | 2.8 | 17.9 |
| LR ≥ 98.0 | 0.083 | 0.997 | 35.257 | 0.918 | 0.050 | 0.999 | 0.062 | 0.0161 | 2.7 | 20.1 |
| Modified PEWS ≥7 | 0.008 | 0.999 | 13.875 | 0.992 | 0.020 | 0.999 | 0.011 | 0.6 | 49.7 | |
| pDEWS ≥99.8 | 0.027 | 1.000 | 85.750 | 0.973 | 0.113 | 0.999 | 0.044 | 0.0516 | 0.4 | 8.8 |
| RF ≥ 99.6 | 0.012 | 0.999 | 52.815 | 0.988 | 0.073 | 0.999 | 0.020 | 0.0115 | 0.3 | 13.7 |
| LR ≥ 99.2 | 0.025 | 0.999 | 48.353 | 0.975 | 0.067 | 0.999 | 0.036 | 0.0115 | 0.6 | 14.9 |
Abbreviations: pDEWS: deep-machine-learning-based pediatric early warning system; PEWS: pediatric early warning score; RF: random forest; LR: logistic regression; Sen: sensitivity; Spec: specificity; PLR: positive likelihood ratio; NLR: negative likelihood ratio; PPV: positive predictive value; NPV: negative predictive value; NRI: net reclassification index; MACPD: mean alarm count per day.
Table 6.
Comparison of performance in the prediction of unexpected ward-to-PICU transfer at the same specificity.
| Cut-off | Sen | Spec | PLR | NLR | PPV | NPV | F-score | NRI | MACPD | NNE |
|---|---|---|---|---|---|---|---|---|---|---|
| Modified PEWS ≥1 | 0.775 | 0.320 | 1.140 | 0.702 | 0.004 | 0.998 | 0.007 | 741.9 | 274.9 | |
| pDEWS ≥2.7 | 0.977 | 0.320 | 1.437 | 0.072 | 0.005 | 1.000 | 0.009 | 0.0020 | 742.2 | 218.2 |
| RF ≥ 32.0 | 0.963 | 0.320 | 1.416 | 0.115 | 0.005 | 1.000 | 0.009 | 0.0021 | 742.1 | 221.3 |
| LR ≥ 17.9 | 0.956 | 0.320 | 1.406 | 0.137 | 0.004 | 1.000 | 0.009 | 0.0025 | 741.9 | 222.9 |
| Modified PEWS ≥2 | 0.572 | 0.679 | 1.780 | 0.630 | 0.006 | 0.998 | 0.011 | 351.1 | 176.4 | |
| pDEWS ≥14.6 | 0.917 | 0.679 | 2.855 | 1.223 | 0.009 | 1.000 | 0.018 | 0.0036 | 352.2 | 110.3 |
| RF ≥ 42.9 | 0.835 | 0.679 | 2.601 | 0.243 | 0.008 | 0.999 | 0.016 | 0.0031 | 351.7 | 121.0 |
| LR ≥ 39.8 | 0.841 | 0.679 | 2.621 | 0.234 | 0.008 | 0.999 | 0.016 | 0.0033 | 351.6 | 120.0 |
| Modified PEWS ≥3 | 0.410 | 0.877 | 3.326 | 0.673 | 0.011 | 0.998 | 0.021 | 135.3 | 94.9 | |
| pDEWS ≥41.4 | 0.792 | 0.877 | 15.010 | 0.380 | 0.020 | 0.999 | 0.039 | 0.0098 | 136.6 | 49.5 |
| RF ≥ 54.6 | 0.701 | 0.877 | 5.721 | 0.341 | 0.018 | 0.999 | 0.035 | 0.0083 | 135.5 | 55.5 |
| LR ≥ 68.3 | 0.691 | 0.877 | 5.613 | 0.352 | 0.018 | 0.999 | 0.034 | 0.0074 | 136.1 | 56.6 |
| Modified PEWS ≥4 | 0.230 | 0.957 | 5.410 | 0.804 | 0.017 | 0.997 | 0.032 | 47.1 | 58.7 | |
| pDEWS ≥71.8 | 0.636 | 0.958 | 15.010 | 0.380 | 0.046 | 0.999 | 0.086 | 0.0302 | 48.2 | 21.8 |
| RF ≥ 64.1 | 0.501 | 0.957 | 11.967 | 0.520 | 0.037 | 0.998 | 0.069 | 0.0207 | 47.2 | 27.0 |
| LR ≥ 86.3 | 0.381 | 0.957 | 9.048 | 0.646 | 0.028 | 0.998 | 0.052 | 0.0116 | 47.0 | 35.5 |
| Modified PEWS ≥5 | 0.071 | 0.988 | 5.812 | 0.940 | 0.018 | 0.997 | 0.029 | 13.6 | 54.7 | |
| pDEWS ≥92.1 | 0.456 | 0.989 | 39.731 | 0.550 | 0.113 | 0.998 | 0.181 | 0.0995 | 14.1 | 8.8 |
| RF ≥ 74.6 | 0.293 | 0.989 | 25.090 | 0.715 | 0.074 | 0.998 | 0.119 | 0.0575 | 13.7 | 13.4 |
| LR ≥ 94.9 | 0.246 | 0.989 | 20.600 | 0.762 | 0.062 | 0.998 | 0.099 | 0.0452 | 13.8 | 16.1 |
| Modified PEWS ≥6 | 0.011 | 0.997 | 3.363 | 0.991 | 0.011 | 0.997 | 0.011 | 3.5 | 87.0 | |
| pDEWS ≥98.4 | 0.244 | 0.997 | 97.297 | 0.757 | 0.238 | 0.998 | 0.241 | 0.2352 | 3.6 | 4.2 |
| RF ≥ 80.0 | 0.165 | 0.997 | 55.723 | 0.837 | 0.151 | 0.997 | 0.158 | 0.1547 | 3.8 | 6.6 |
| LR ≥ 98.4 | 0.139 | 0.997 | 45.836 | 0.864 | 0.128 | 0.997 | 0.133 | 0.1281 | 3.8 | 7.8 |
| Modified PEWS ≥7 | 0.000 | 0.999 | 0.000 | 1.000 | 0.000 | 0.997 | N/A | 0.6 | N/A | |
| pDEWS ≥99.6 | 0.086 | 0.999 | 159.795 | 0.914 | 0.339 | 0.997 | 0.137 | 0.4977 | 0.9 | 2.9 |
| RF ≥ 87.5 | 0.000 | 0.999 | N/A | 1.000 | N/A | 0.997 | N/A | 0.0006 | 0.0 | N/A |
| LR ≥ 99.8 | 0.031 | 0.999 | 89.537 | 0.968 | 0.223 | 0.997 | 0.055 | 0.1828 | 0.5 | 4.4 |
Abbreviations: pDEWS: deep-machine-learning-based pediatric early warning system; PEWS: pediatric early warning score; RF: random forest; LR: logistic regression; Sen: sensitivity; Spec: specificity; PLR: positive likelihood ratio; NLR: negative likelihood ratio; PPV: positive predictive value; NPV: negative predictive value; NRI: net reclassification index; MACPD: mean alarm count per day.
The pDEWS provided a much lower MACPD for both cardiopulmonary arrest and unexpected ward-to-PICU transfers under the same sensitivity than the modified PEWS or prediction models with RF or LR [Fig. 4]. It markedly reduced false alarms in the detection of cardiopulmonary arrest by 82.0% (from 46.7 to 8.4 MACPD), 64.5% (from 23.7 to 8.4 MACPD), and 68.7% (from 26.9 to 8.4 MACPD) compared to the modified PEWS and prediction models by RF or LR, respectively. In the detection of unexpected ward-to-PICU transfers, the pDEWS showed a reduction in false alarms by 100% (from 3.5 to 0.0 MACPD), 66.3% (from 9.2 to 3.1 MACPD), and 100% (from 0.1 to 0.0 MACPD) compared to the modified PEWS and prediction models by RF or LR, respectively. The pDEWS also showed the highest sensitivity at the same NNE compared to the modified PEWS and prediction models by RF or LR [Fig. 5]. In particular, pDEWS showed at most 89.5% (from 0.303 to 0.807) at a NNE of 43, 43.3% (from 0.335 to 0.591) at a NNE of 52, and 51.2% (from 0.288 to 0.591) at a NNE of 52 compared to the modified PEWS and prediction models by RF or LR, respectively for detecting cardiopulmonary arrest. Furthermore, in the detection of unexpected ward-to-PICU transfers, the pDEWS showed at most 98.7% (from 0.011 to 0.89) at a NNE of 87, 13.0% (from 0.701 to 0.806) at a NNE of 54, and 15.3% (from 0.697 to 0.823) at a NNE of 58 compared to the modified PEWS and prediction models by RF or LR, respectively. The cumulative percentage of deteriorating patients for either critical event was markedly larger in the pDEWS than in the modified PEWS or prediction models by RF or LR at the same cut-off level [Fig. 6].
Fig. 4.

Comparison of mean alarm count per day at the same sensitivity for (A) cardiopulmonary arrest and (B) unexpected ward-to-pediatric intensive care unit transfer. Abbreviations used: MACPD: mean alarm count per day; pDEWS: deep-learning-based pediatric early warning system; modified PEWS: modified pediatric early warning score; RF: random forest; LR: logistic regression.
Fig. 5.

Comparison of sensitivity at the same number needed to examine for (A) cardiopulmonary arrest and (B) unexpected ward-to-pediatric intensive care unit transfer. Abbreviations used: NNE: number needed to examine; pDEWS: deep-learning-based pediatric early warning system; modified PEWS: modified pediatric early warning score; RF: random forest; LR: logistic regression.
Fig. 6.

Cumulative percentages of deteriorating patients with (A) cardiopulmonary arrest and (B) unexpected ward-to-pediatric intensive care unit transfer. Abbreviations: pDEWS: deep-learning-based pediatric early warning system; modified PEWS: modified pediatric early warning score; RF: random forest; LR: logistic regression.
Discussion
We developed pDEWS with only five vital sign parameters using deep learning, which showed good performance in predicting cardiopulmonary arrest and unexpected ward-to-PICU transfers in general-ward-hospitalized pediatric patients within 24 h before an event.
Most EWSs comprise several domains of physiologic and laboratory data [[11], [12], [13],33]. It may be beneficial to integrate more components, which could provide more information for a more precise prediction. Based on this concept, several previously developed indexes or algorithms have integrated even 25 variables or more [10,34]. However, this could increase the possibility of more missing values or an increased risk of erroneous calculation or other human-related limitations, resulting in providing inaccurate information and decreasing the predictability and performance of the EWSs.
The pDEWS comprises 5 vital signs, which are essential data in most hospitalized patients. Thus, the pDEWS is easily applicable to any patient admitted to any hospital regardless of that institution's characteristics, without correction or compensation according to institutional references (like other laboratory data), with a relatively low missing rate. Vital signs are also relatively objective data usually measured by instruments that are not influenced much by observer discrepancies or subjective assessments, unlike other symptoms or signs.
In this study, we compared the pDEWS to the modified PEWS, which included only vital sign parameters of the original PEWS. The excluded parameters were capillary refill time, pulse, and loss of consciousness, which are thought to be somewhat subjective. In the case of bolus fluid and oxygen therapy, we thought these parameters were related more to the medical personnels’ assessments and decisions for some interventions. According to the aim of this study, which was to evaluate and compare the performance of predicting critical events and effectiveness as an afferent limb for RRT activation, we also excluded these bolus fluid or oxygen therapy parameters as the modified PEWS had only vital sign parameters, similar to the pDEWS. The pDEWS outperformed the modified PEWS in all compared metrics.
The pDEWS demonstrated the largest AUROC (0.923 (95% CI, 0.918–0.929) and 0.911 (95% CI, 0.906–0.917) in predicting cardiopulmonary arrest and unexpected ward-to-PICU transfers, respectively) compared to the modified PEWS and prediction models by RF or LR. These were also comparable to those of other previously reported EWSs [11,[35], [36], [37]]. However, statistically, cardiopulmonary arrest and unexpected ward-to-PICU transfers are relatively rare critical events. In case the number of negative cases overwhelms those of event cases, the false positive rate (false positive cases/total real negative cases) does not decrease dramatically, limiting the ability of the AUROC to evaluate performance. Instead, the AUPRC could be better suited for these kinds of imbalanced data, as it considers the fraction of true positive cases among positive predictions, suggesting that the AUPRC is more important and informative than the AUROC [30]. Therefore, we also compared our results using the AUPRC, which also showed the superiority of the pDEWS. In addition, we used various statistical metrics such as sensitivity, specificity, PLR, NLR, PPV, NPV, F-score, MACPD, NNE, NRI, and the detection of the cumulative percentage of deteriorating patients over time. In particular, likelihood ratios are independent of event prevalence and could be more informative than other metrics to evaluate such rare events. The MACPD and NNE provide possible alarm count data, which could be useful in effectively operating RRTs in clinical practice. Our results showed that the pDEWS performed better in predicting critical events earlier and more accurately with fewer false alarms than the modified PEWS or prediction models by RF or LR.
These results could be partly explained by the power of deep learning. Deep learning uses multiple computational layers of non-linear processing units. It learns representations of data using a general-purpose learning procedure with multiple levels of abstraction, which are not designed by humans. The most important element of the deep learning process is feature learning. During the training process, a deep learning model learns intricate structures of datasets and determines how to change the internal parameters, which are used to compute the representation in each layer. It automatically identifies and learns features or representations needed for given tasks, such as classification and detection, using a large amount of raw data. Therefore, it is useful in finding complex relationships in high-dimensional data (such as vital signs) without information loss [[38], [39], [40]].
Previously, it was reported that subtle physiologic changes occur before a clinically deteriorating critical event [17,[41], [42], [43]]. However, these might be too subtle for easy detection with standard monitoring or intermittent personal evaluation tools at various time intervals. In contrast, deep learning could find patterns in these clinical antecedents, including subtle changes before critical events such as cardiopulmonary arrest and unexpected ward-to-PICU transfers, which could increase the chances of proper timely intervention.
Furthermore, in comparison to other ML methods, such as LR or RF models [38,39,44,45], these conventional ML methods are limited in processing data in their raw form. They are based on fixed assumptions of data behavior. Their performance is highly dependent on careful engineering and considerable domain knowledge to design a feature extractor that transforms the raw data into a suitable internal representation; the shallow classifier then classifies the data based on represented features. Thus, they are limited in discovering the intricate structures in high-dimensional data without information loss. Compared to conventional ML methods, the pDEWS outperformed these methods, consistent with previous reports [38,39].
Deep learning could also minimize human handling, thereby decreasing both human error and manpower requirements. Considering the busy nature of general wards, the limited number of medical personnel compared to the number of hospitalized patients, and the barriers for RRT activation, score generation using real-time EMR vital sign data by automatic calculation and automatically triggering alarms by setting cut-off values for RRT activation are desirable to increase accuracy and efficacy [17].
Since RRTs were introduced into clinical practice, they have been reported to significantly reduce in-hospital critical events [[46], [47], [48], [49]]. In contrast, there are also reports about the challenge of increased alarms, related alarm fatigue, and additional workload [18,50]. Our results of PLR, NLR, and MACPD indicate that the pDEWS is promising in reducing false alarms, with more true alarms and true-negative alarms, and in generating a lower MACPD at the same sensitivity compared to other models, which could be helpful to decrease alarm fatigue and workload, and for effective use of limited medical resources. In addition, as we provided predicted metrics by each cut-off value of the pDEWS, these could be adjusted and determined according to specific individual situations, such as acceptable alarm number and feasible RRT response workload.
This study has some advantages. To our knowledge, this is the first report on a pDEWS for cardiopulmonary arrest and unexpected ward-to-PICU transfers in general-ward-hospitalized pediatric patients using only five vital signs. Pediatric patients in general wards have less useful physiologic data and are exposed to more unsafe and risky situations if critical events occur compared to patients in a PICU. Therefore, the pDEWS could be helpful in early detection, prompt intervention, prevention of rescue failure, and improvement of clinical outcomes. We used deep learning to develop a pDEWS, which is better than other conventional ML methods and showed better performance. In validating the pDEWS, we evaluated it using various statistical metrics and also reported its own calibration data, which proved its better performance and usefulness.
Despite its advantages, there are several limitations to this study. First, this was a single-center retrospective observational cohort study of pediatric patients admitted to a tertiary academic children's hospital: there could be possible selection bias due to missing data, and its generalizability is limited. Further large-scale multicenter validation studies are required to ensure that this model is widely applicable and useful. Second, although we used LSTM units with 20 consecutive data inputs, ML is strongly dependent on data quality, and so missing data could affect accuracy. Third, machine learning memorizes the derivation set characteristics, which may result in overfitting issues and could affect prediction systems. Fourth, as many previous studies have pointed out, deep learning is known as a “black box” because rather than having rule-based decision criteria based on a domain knowledge, the decision boundary is ‘learned’ using universal approximation function by finding regularities in the given dataset. It is often criticized due to its non-transparent and non-traceable algorithm. Recently there have been many approaches to solve these problems by developing explainable AI or inherently interpretable ML models. However, in this study, we were unsure of the method could possibly summarize what might be going on under the hood of our time dependent LSTM networks. Due to these reasons, we omitted model interpretability in the current study. Although the pDEWS only uses five vital signs, which could be helpful for healthcare providers to guess intuitively the reason for prediction, clear interpretability of the pDEWS remains as a problem that must be solved in the future. Fifth, we used the modified PEWS, which excludes some clinical data and differs from the original PEWS, which could affect its performance results. In the future, further large-scale multi-center external validation studies are required to more accurately assess the performance of the pDEWS.
Conclusion
The pDEWS showed good performance in the accurate prediction of cardiopulmonary arrest and unexpected ward-to-PICU transfers in general-ward-hospitalized pediatric patients compared to the modified PEWS and prediction models by RF or LR. The implementation of the pDEWS could provide more precise and timely detection of critical events and an automatic triggering call for RRT activation with a reduction in false alarms and related workload, which could be helpful to more efficiently operate RRTs and improve clinical outcomes.
Funding
This study was supported by a grant (2019IT0137) from the Asan Institute for Life Sciences, Asan Medical Center, Seoul, Korea.
Conflicts of interest
The authors have no financial or ethical conflicts of interest to report.
Footnotes
Peer review under responsibility of Chang Gung University.
Appendix A.
Table A1.
Ranges of outlieroutliers and missing rates of variables in the deep-learning-based pediatric early warning system.
| Variable | Outlier range |
Missing rate (%) |
||
|---|---|---|---|---|
| Minimum | Maximum | Derivation cohort | Validation cohort | |
| Respiratory rate | 0 | 300 | 0.198 | 0.151 |
| Heart rate | 0 | 300 | 0.215 | 0.182 |
| Systolic blood pressure | 10 | 300 | 0.275 | 0.229 |
| Diastolic blood pressure | 10 | 175 | 0.275 | 0.229 |
| Body temperature | 24 | 45 | 0.128 | 0.120 |
| Saturation | 10 | 100 | 0.786 | 0.773 |
Table A2.
Modified pediatric early warning score.
| Item sub-scores |
|||||
|---|---|---|---|---|---|
| 2 | 1 | 0 | 1 | 2 | |
| Age-specific items | |||||
| <3 months | |||||
| HR | <90 | 90–109 | 110–150 | 151–180 | >180 |
| RR | <20 | 20–29 | 30–60 | 61–80 | >80 |
| SBP | <50 | 50–59 | 60–80 | 81–100 | >100 |
| 3–12 months | |||||
| HR | <80 | 80–99 | 100–150 | 151–170 | >170 |
| RR | <20 | 20–24 | 25–50 | 51–70 | >70 |
| SBP | <70 | 70–79 | 80–100 | 99–120 | >120 |
| 1–4 years | |||||
| HR | <70 | 70–89 | 90–120 | 121–150 | >150 |
| RR | <15 | 15–19 | 20–40 | 41–60 | >60 |
| SBP | <75 | 75–89 | 90–110 | 111–125 | >125 |
| 4–12 years | |||||
| HR | <60 | 60–69 | 70-110- | 111–130 | >130 |
| RR | <12 | 12–19 | 20–30 | 31–40 | >40 |
| SBP | <80 | 80–90 | 90–120 | 120–130 | >130 |
| >12 years | |||||
| HR | <50 | 50–59 | 60–100 | 101–120 | >120 |
| RR | <8 | 8–11 | 12–16 | 15–24 | >24 |
| SBP | <86 | 85–101 | 100–130 | 131–150 | >150 |
| O2 saturation (%) | <85 | 85–95 | >95 | ||
| Temperature | <35 | 35 < 36 | 36 | >38.5-< 40 | >40 |
Abbreviations: HR: heart rate (beats/min); RR: respiratory rate (breaths/min); SBP: systolic blood pressure (mm Hg).
References
- 1.Knudson J.D., Neish S.R., Cabrera A.G., Lowry A.W., Shamszad P., Morales D.L., et al. Prevalence and outcomes of pediatric in-hospital cardiopulmonary resuscitation in the United States: an analysis of the Kids' Inpatient Database∗. Crit Care Med. 2012;40:2940–2944. doi: 10.1097/CCM.0b013e31825feb3f. [DOI] [PubMed] [Google Scholar]
- 2.Hravnak M., Devita M.A., Clontz A., Edwards L., Valenta C., Pinsky M.R. Cardiorespiratory instability before and after implementing an integrated monitoring system. Crit Care Med. 2011;39:65–72. doi: 10.1097/CCM.0b013e3181fb7b1c. [DOI] [PMC free article] [PubMed] [Google Scholar]
- 3.Agulnik A., Antillon-Klussmann F., Soberanis Vasquez D.J., Arango R., Moran E., Lopez V., et al. Cost-benefit analysis of implementing a pediatric early warning system at a pediatric oncology hospital in a low-middle income country. Cancer. 2019;125:4052–4058. doi: 10.1002/cncr.32436. [DOI] [PubMed] [Google Scholar]
- 4.Bonafide C.P., Localio A.R., Song L., Roberts K.E., Nadkarni V.M., Priestley M., et al. Cost-benefit analysis of a medical emergency team in a children's hospital. Pediatrics. 2014;134:235–241. doi: 10.1542/peds.2014-0140. [DOI] [PubMed] [Google Scholar]
- 5.Jones D.A., DeVita M.A., Bellomo R. Rapid-response teams. N Engl J Med. 2011;365:139–146. doi: 10.1056/NEJMra0910926. [DOI] [PubMed] [Google Scholar]
- 6.Sandquist M., Tegtmeyer K. No more pediatric code blues on the floor: evolution of pediatric rapid response teams and situational awareness plans. Transl Pediatr. 2018;7:291–298. doi: 10.21037/tp.2018.09.12. [DOI] [PMC free article] [PubMed] [Google Scholar]
- 7.Van Voorhis K.T., Willis T.S. Implementing a pediatric rapid response system to improve quality and patient safety. Pediatr Clin. 2009;56:919–933. doi: 10.1016/j.pcl.2009.05.017. [DOI] [PubMed] [Google Scholar]
- 8.Kotsakis A., Lobos A.T., Parshuram C., Gilleland J., Gaiteiro R., Mohseni-Bod H., et al. Implementation of a multicenter rapid response system in pediatric academic hospitals is effective. Pediatrics. 2011;128:72–78. doi: 10.1542/peds.2010-0756. [DOI] [PubMed] [Google Scholar]
- 9.Hayes L.W., Dobyns E.L., DiGiovine B., Brown A.M., Jacobson S., Randall K.H., et al. A multicenter collaborative approach to reducing pediatric codes outside the ICU. Pediatrics. 2012;129:e785–e791. doi: 10.1542/peds.2011-0227. [DOI] [PubMed] [Google Scholar]
- 10.Rothman M.J., Rothman S.I., Beals Jt. Development and validation of a continuous measure of patient condition using the Electronic Medical Record. J Biomed Inf. 2013;46:837–848. doi: 10.1016/j.jbi.2013.06.011. [DOI] [PubMed] [Google Scholar]
- 11.Duncan H., Hutchison J., Parshuram C.S. The Pediatric Early Warning System score: a severity of illness score to predict urgent medical need in hospitalized children. J Crit Care. 2006;21:271–278. doi: 10.1016/j.jcrc.2006.06.007. [DOI] [PubMed] [Google Scholar]
- 12.Akre M., Finkelstein M., Erickson M., Liu M., Vanderbilt L., Billman G. Sensitivity of the pediatric early warning score to identify patient deterioration. Pediatrics. 2010;125:e763–e769. doi: 10.1542/peds.2009-0338. [DOI] [PubMed] [Google Scholar]
- 13.Haines C., Perrott M., Weir P. Promoting care for acutely ill children-development and evaluation of a paediatric early warning tool. Intensive Crit Care Nurs. 2006;22:73–81. doi: 10.1016/j.iccn.2005.09.003. [DOI] [PubMed] [Google Scholar]
- 14.Lambert V., Matthews A., MacDonell R., Fitzsimons J. Paediatric early warning systems for detecting and responding to clinical deterioration in children: a systematic review. BMJ Open. 2017;7 doi: 10.1136/bmjopen-2016-014497. [DOI] [PMC free article] [PubMed] [Google Scholar]
- 15.Vredebregt S.J., Moll H.A., Smit F.J., Verhoeven J.J. Recognizing critically ill children with a modified pediatric early warning score at the emergency department, a feasibility study. Eur J Pediatr. 2019;178:229–234. doi: 10.1007/s00431-018-3285-9. [DOI] [PubMed] [Google Scholar]
- 16.Levin A.B., Brady P., Duncan H.P., Davis A.B. Pediatric rapid response systems: identification and treatment of deteriorating children. Curr Treat Options Pediatr. 2015;1:76–89. [Google Scholar]
- 17.da Silva Y.S., Hamilton M.F., Horvat C., Fink E.L., Palmer F., Nowalk A.J., et al. Evaluation of electronic medical record vital sign data versus a commercially available acuity score in predicting need for critical intervention at a tertiary children's hospital. Pediatr Crit Care Med. 2015;16:644–651. doi: 10.1097/PCC.0000000000000444. [DOI] [PubMed] [Google Scholar]
- 18.Lyons P.G., Edelson D.P., Carey K.A., Twu N.M., Chan P.S., Peberdy M.A., et al. Characteristics of rapid response calls in the United States: an analysis of the first 402,023 adult cases from the Get with the Guidelines Resuscitation-Medical Emergency Team Registry. Crit Care Med. 2019;47:1283–1289. doi: 10.1097/CCM.0000000000003912. [DOI] [PMC free article] [PubMed] [Google Scholar]
- 19.Schmidt J., Marques M.R.G., Botti S., Marques M.A.L. Recent advances and applications of machine learning in solid-state materials science. Npj Comput Mater. 2019;5:83. [Google Scholar]
- 20.Wagner D.N. Economic patterns in a world with artificial intelligence. Evol Inst Econ Rev. 2020;17:111–131. [Google Scholar]
- 21.Ginestra J.C., Giannini H.M., Schweickert W.D., Meadows L., Lynch M.J., Pavan K., et al. Clinician perception of a machine learning-based early warning system designed to predict severe sepsis and septic shock. Crit Care Med. 2019;47:1477–1484. doi: 10.1097/CCM.0000000000003803. [DOI] [PMC free article] [PubMed] [Google Scholar]
- 22.Kwon J.M., Jeon K.H., Kim H.M., Kim M.J., Lim S., Kim K.H., et al. Deep-learning-based out-of-hospital cardiac arrest prognostic system to predict clinical outcomes. Resuscitation. 2019;139:84–91. doi: 10.1016/j.resuscitation.2019.04.007. [DOI] [PubMed] [Google Scholar]
- 23.Dugas A.F., Kirsch T.D., Toerper M., Korley F., Yenokyan G., France D., et al. An electronic emergency triage system to improve patient distribution by critical outcomes. J Emerg Med. 2016;50:910–918. doi: 10.1016/j.jemermed.2016.02.026. [DOI] [PubMed] [Google Scholar]
- 24.Verdonk C., Verdonk F., Dreyfus G. How machine learning could be used in clinical practice during an epidemic. Crit Care. 2020;24:265. doi: 10.1186/s13054-020-02962-y. [DOI] [PMC free article] [PubMed] [Google Scholar]
- 25.Kingma D.P., Ba J. arXiv.org; Ithaca, NY: 2015. Adam: a method for stochastic optimization; p. 15. (International Conference on Learning Representations (ICLR)). [Google Scholar]
- 26.Srivastava N., Hinton G., Krizhevsky A., Sutskever I., Salakhutdinov R. Dropout: a simple way to prevent neural networks from overfitting. J Mach Learn Res. 2014;15:1929–1958. [Google Scholar]
- 27.Weng C.G., Poon J. In: Proceedings of the 7th Australasian data mining conference. 87. Roddick J.F., Li J., Christen P., Kennedy P.J., editors. Australian Computer Society, Inc.; Glenelg, SA, Australia: 2008. A new evaluation measure for imbalanced datasets; pp. 27–32. [Google Scholar]
- 28.Attia J. Diagostic tests: moving beyond sensitivity and specificity: using likelihood ratios to help interpret diagnostic tests. Aust Prescr. 2003;26:111–113. [Google Scholar]
- 29.Romero-Brufau S., Huddleston J.M., Escobar G.J., Liebow M. Why the C-statistic is not informative to evaluate early warning scores and what metrics to use. Crit Care. 2015;19:285. doi: 10.1186/s13054-015-0999-1. [DOI] [PMC free article] [PubMed] [Google Scholar]
- 30.Saito T., Rehmsmeier M. The precision-recall plot is more informative than the ROC plot when evaluating binary classifiers on imbalanced datasets. PloS One. 2015;10 doi: 10.1371/journal.pone.0118432. [DOI] [PMC free article] [PubMed] [Google Scholar]
- 31.Leening M.J., Vedder M.M., Witteman J.C., Pencina M.J., Steyerberg E.W. Net reclassification improvement: computation, interpretation, and controversies: a literature review and clinician's guide. Ann Intern Med. 2014;160:122–131. doi: 10.7326/M13-1522. [DOI] [PubMed] [Google Scholar]
- 32.Ozenne B., Subtil F., Maucort-Boulch D. The precision--recall curve overcame the optimism of the receiver operating characteristic curve in rare diseases. J Clin Epidemiol. 2015;68:855–859. doi: 10.1016/j.jclinepi.2015.02.010. [DOI] [PubMed] [Google Scholar]
- 33.Solevag A.L., Eggen E.H., Schroder J., Nakstad B. Use of a modified pediatric early warning score in a department of pediatric and adolescent medicine. PloS One. 2013;8 doi: 10.1371/journal.pone.0072534. [DOI] [PMC free article] [PubMed] [Google Scholar]
- 34.Zhai H., Brady P., Li Q., Lingren T., Ni Y., Wheeler D.S., et al. Developing and evaluating a machine learning based algorithm to predict the need of pediatric intensive care unit transfer for newly hospitalized children. Resuscitation. 2014;85:1065–1071. doi: 10.1016/j.resuscitation.2014.04.009. [DOI] [PMC free article] [PubMed] [Google Scholar]
- 35.Skaletzky S.M., Raszynski A., Totapally B.R. Validation of a modified pediatric early warning system score: a retrospective case-control study. Clin Pediatr. 2012;51:431–435. doi: 10.1177/0009922811430342. [DOI] [PubMed] [Google Scholar]
- 36.McLellan M.C., Gauvreau K., Connor J.A. Validation of the children's hospital early warning system for critical deterioration recognition. J Pediatr Nurs. 2017;32:52–58. doi: 10.1016/j.pedn.2016.10.005. [DOI] [PubMed] [Google Scholar]
- 37.Egdell P., Finlay L., Pedley D.K. The PAWS score: validation of an early warning scoring system for the initial assessment of children in the emergency department. Emerg Med J. 2008;25:745–749. doi: 10.1136/emj.2007.054965. [DOI] [PubMed] [Google Scholar]
- 38.Benuwa B.B., Zhan Y.Z., Ghansah B., Wornyo D.K., Banaseka Kataka F. A review of deep machine learning. Int J Eng Res Afr. 2016;24:124–136. [Google Scholar]
- 39.LeCun Y., Bengio Y., Hinton G. Deep learning. Nature. 2015;521:436–444. doi: 10.1038/nature14539. [DOI] [PubMed] [Google Scholar]
- 40.Wolpert D.H. The supervised learning No-Free-Lunch theorems. Soft Computing and Industry. 2002:25–42. [Google Scholar]
- 41.Moss T.J., Lake D.E., Calland J.F., Enfield K.B., Delos J.B., Fairchild K.D., et al. Signatures of subacute potentially catastrophic illness in the ICU: model development and validation. Crit Care Med. 2016;44:1639–1648. doi: 10.1097/CCM.0000000000001738. [DOI] [PMC free article] [PubMed] [Google Scholar]
- 42.Forkan A.R.M., Khalil I., Atiquzzaman M. ViSiBiD: a learning model for early discovery and real-time prediction of severe clinical events using vital signs as big data. Comput Network. 2017;113:244–257. [Google Scholar]
- 43.Rusin C.G., Acosta S.I., Shekerdemian L.S., Vu E.L., Bavare A.C., Myers R.B., et al. Prediction of imminent, severe deterioration of children with parallel circulations using real-time processing of physiologic data. J Thorac Cardiovasc Surg. 2016;152:171–177. doi: 10.1016/j.jtcvs.2016.03.083. [DOI] [PMC free article] [PubMed] [Google Scholar]
- 44.Hochreiter S., Schmidhuber J. Long short-term memory. Neural Comput. 1997;9:1735–1780. doi: 10.1162/neco.1997.9.8.1735. [DOI] [PubMed] [Google Scholar]
- 45.Santurkar S., Tsipras D., Ilyas A., Madry A. NeurIPS; Montréal, Canada: 2019. How does batch normalization help optimization? p. 26. (32nd Conference on Neural Information Processing Systems (NeurIPS 2018).). [Google Scholar]
- 46.Bellomo R., Goldsmith D., Uchino S., Buckmaster J., Hart G., Opdam H., et al. Prospective controlled trial of effect of medical emergency team on postoperative morbidity and mortality rates. Crit Care Med. 2004;32:916–921. doi: 10.1097/01.ccm.0000119428.02968.9e. [DOI] [PubMed] [Google Scholar]
- 47.Tibballs J., Kinney S. Reduction of hospital mortality and of preventable cardiac arrest and death on introduction of a pediatric medical emergency team. Pediatr Crit Care Med. 2009;10:306–312. doi: 10.1097/PCC.0b013e318198b02c. [DOI] [PubMed] [Google Scholar]
- 48.Tibballs J., Kinney S., Duke T., Oakley E., Hennessy M. Reduction of paediatric in-patient cardiac arrest and death with a medical emergency team: preliminary results. Arch Dis Child. 2005;90:1148–1152. doi: 10.1136/adc.2004.069401. [DOI] [PMC free article] [PubMed] [Google Scholar]
- 49.Brilli R.J., Gibson R., Luria J.W., Wheeler T.A., Shaw J., Linam M., et al. Implementation of a medical emergency team in a large pediatric teaching hospital prevents respiratory and cardiopulmonary arrests outside the intensive care unit. Pediatr Crit Care Med. 2007;8:236–246. doi: 10.1097/01.PCC.0000262947.72442.EA. quiz 247. [DOI] [PubMed] [Google Scholar]
- 50.Panesar R., Polikoff L.A., Harris D., Mills B., Messina C., Parker M.M. Characteristics and outcomes of pediatric rapid response teams before and after mandatory triggering by an elevated Pediatric Early Warning System (PEWS) score. Hosp Pediatr. 2014;4:135–140. doi: 10.1542/hpeds.2013-0062. [DOI] [PubMed] [Google Scholar]