

Summary
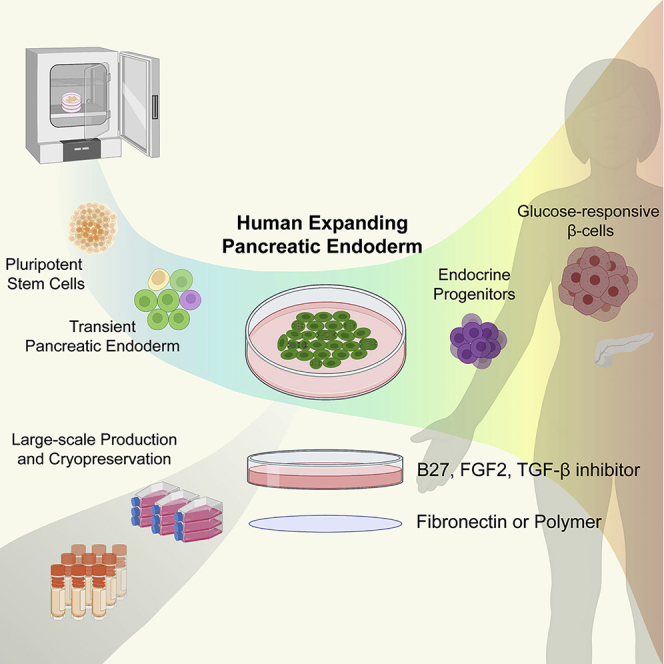
With the aim of producing β cells for replacement therapies to treat diabetes, several protocols have been developed to differentiate human pluripotent stem cells to β cells via pancreatic progenitors. While in vivo pancreatic progenitors expand throughout development, the in vitro protocols have been designed to make these cells progress as fast as possible to β cells. Here, we report on a protocol enabling a long-term expansion of human pancreatic progenitors in a defined medium on fibronectin, in the absence of feeder layers. Moreover, through a screening of a polymer library we identify a polymer that can replace fibronectin. Our experiments, comparing expanded progenitors to directly differentiated progenitors, show that the expanded progenitors differentiate more efficiently into glucose-responsive β cells and produce fewer glucagon-expressing cells. The ability to expand progenitors under defined conditions and cryopreserve them will provide flexibility in research and therapeutic production.
Keywords: pancreatic progenitors, endocrine cells, pancreas, transcriptome, screening, long-term culture, beta cells, human, differentiation
Graphical abstract
Highlights
-
•
hPSC-derived pancreatic progenitors can be expanded long term without feeders
-
•
Expansion can be achieved on fibronectin or on a polymer identified by screening
-
•
Expansion enables increased NKX6-1 expression, which is crucial for β cell generation
-
•
Expansion potentiates glucose-responsive β-like cells and decreases α cells
In this article, Grapin-Botton and colleagues describe a culture system where human pluriopotent stem cell-derived pancreatic progenitors can be expanded long term in a defined medium on either fibronectin or polymer. The expanded cells have hallmarks of pancreatic progenitors, expressing PDX1 and NKX6-1, and give rise preferentially to glucose-responsive β-like cells when differentiated. This system can be useful for therapeutic applications and research.
Introduction
There has been considerable interest in recapitulating pancreas development in vitro with the aim of producing β cells for replacement therapies to treat diabetes. With this in mind, several protocols have been developed to differentiate human pluripotent stem cells (hPSCs) to β cells (Hogrebe et al., 2020; Nostro et al., 2015; Pagliuca et al., 2014; Rezania et al., 2014; Russ et al., 2015). These protocols rely on the sequential control of specific developmental pathways with soluble growth factors and small molecules, guiding hPSCs in a stepwise fashion through intermediate endodermal and pancreatic progenitor stages.
While in vitro differentiation is generally based on these sequential stages, in vivo development involves the expansion of progenitor cells (Jennings et al., 2015). Pancreatic progenitors have been defined as cells that are proliferative and can give rise to differentiated cell types of the pancreas: acinar cells that secrete digestive enzymes, ductal cells forming ducts, and endocrine cells secreting hormones into the blood. Among the last of these, β cells, α cells, δ cells, PP cells (γ cells), and ε cells secrete respectively insulin, glucagon, somatostatin, pancreatic polypeptide, and ghrelin (Gu et al., 2002; Teitelman et al., 1987). Pancreatic progenitors are characterized by the expression of a specific set of transcription factors, notably PDX1, SOX9, and NKX6-1 (Jennings et al., 2015), and their ability to differentiate has been shown by lineage tracing in mice (Larsen et al., 2017). These experiments revealed that individual cells behave as multipotent progenitors that can give rise to the ductal, acinar, and endocrine cells, at the early stage, and at a later stage, they become bipotent progenitors that generate only ductal and endocrine cells. Although in humans, single-cell lineage tracing has not been performed, and it is therefore uncertain whether individual cells are multipotent or bipotent progenitors, cells expressing the same progenitor markers as in mice have been characterized as early as at around 30 days post conception (Jennings et al., 2013, 2015; Petersen et al., 2018). Moreover, grafting pancreatic endoderm cells derived from human embryonic stem cells (hESCs) in the kidney capsule enables the formation of both endocrine and exocrine cells, arguing for the population being multipotent as a collective (Kroon et al., 2008). The progenitor markers remain throughout the gestational period, and the cells expressing them are largely responsible for the growth of the organ in size by expanding the progenitor pool as well as differentiating into pancreatic cell types. In-depth analyses of the pancreas molecular signature have revealed that mRNAs from numerous genes associated with developmental defects that result in neonatal diabetes, maturity-onset diabetes of the young, or type 2 diabetes are expressed in pancreatic progenitors (Petersen et al., 2018).
The development of in vitro systems recapitulating human pancreas development in a dish can complement descriptive studies on isolated human fetal pancreas and enable testing of the effects of specific gene mutations or drugs on the developmental process. Most protocols have been optimized to promote β cell formation in non-physiological proportions and time scales and have thus not put emphasis on maintaining intermediate steps, notably pancreatic progenitors, in culture. For therapy, millions of cells of the final cell type, namely β cells, need to be produced, and currently the expansion step takes place at the stage of PSCs, necessitating differentiation of millions of cells in parallel, which is time consuming and costly. A few attempts at expanding cells along the differentiation pipeline have been made, showing benefits of endoderm expansion steps on the later differentiation (Cheng et al., 2012; Morrison et al., 2008). Human pancreatic progenitors were also expanded on feeder layers (Trott et al., 2017), after conversion from fibroblasts (Zhu et al., 2016), or in three-dimensional (3D) culture (Goncalves et al., 2021; Huang et al., 2015). Here, we established a feeder-free and Matrigel-free system in two dimensions (2D) for the long-term expansion and cryopreservation of pancreatic progenitors in a simple, fully defined medium. This culture system includes a defined substrate, either fibronectin or, alternatively, a polymer identified through polymer screening. We show that the expansion enables the increase of NKX6-1 in progenitors, a gene that is necessary for β cell differentiation and function (Nostro et al., 2015), and whose expression in vitro has often been a bottleneck. We further show that the expanded progenitors can efficiently differentiate into glucose-responsive insulin-secreting β-like cells and that expansion promotes an increase of the ratio of β cells to other endocrine cells.
Results
A polymer screen identifies extracellular matrix-free substrates supporting pancreatic progenitor culture
To identify culture conditions conducive to the expansion of pancreatic progenitors in the absence of feeder layers and Matrigel, we screened polymer libraries that would support their adhesion and proliferation at the pancreatic epithelium (PE) stage differentiated from hESCs (Figures 1A and 1B). A library of 382 polymer solutions in the family of polyacrylates/acrylamides was contact printed (Table S1) onto a glass slide (Figure 1B). An hESC line (HUES4) with a GFP reporter tagged to the PDX1 gene was utilized for the production of PE cells using a protocol adapted from Ameri et al. (2010, 2017), and GFP-high and GFP-negative cells were plated, as well as undifferentiated ESCs, to test for the specificity of adhesion (Figure 1C). To culture PE cells, we used a simple culture medium that we originally developed for the culture of mouse (Greggio et al., 2013, 2014) and human (Goncalves et al., 2021) pancreatic progenitors in 3D spheres. Based on DAPI and GFP staining (Figure 1D), we identified 20 polymers with enhanced binding properties, and 6 polymers appeared to be potential selective binders (Figure 1E). Thirty polymers, including the 26 “hit” polymers and 4 non-binding polymers (Figure S1A), were selected for a secondary screen, and 13 polymers confirmed cell binding by DAPI and GFP (Table 1). These polymers were then printed as 3-mm-diameter spots on a new array to evaluate PE proliferation (Figure S1B), as monitored by 5-ethynyl-2′-deoxyuridine (EdU) incorporation (Figure S1C). Six polymers enabled proliferation by more than 4% of EdU incorporation, which are the levels we detected at day 15 of directly differentiated PE cells prior to re-plating (Figure 1F). Although PE cells could adhere and proliferate on all six polymers, we focused on the best-performing polymer, PA98, in all subsequent studies, using in situ polymerized polymers on coverslips (Figure S1D).
Figure 1.

Screening of defined substrate/conditions for pancreatic epithelium (PE) expansion
(A) Schematic of in vitro differentiation of HUES4-PDX1-eGFP reporter hESC line to generate pancreatic progenitors and sorting by GFP intensity. Cells were differentiated into PE (PDX1-eGFP+) using the Ameri protocol (Ameri et al., 2010, 2017).
(B) Schematic of the contact printing process used to produce the polymer microarray with the 384 polyacrylate/acrylamide spots detailed in Table S1. Top: printing field organization. Bottom: a glass slide was coated with agarose, and the polymers were printed on top. Cells were re-plated on the polymer microarray glass slide and incubated in PE medium for 72 h.
(C) Representative fluorescence-activated cell sorting (FACS) plots of HUES4-PDX1-GFP hESCs and PE cells. Gating of GFP-high and GFP-negative cells is shown.
(D) Representative images of the GFP-high and GFP-negative cells on the microarray stained by DAPI. Scale bar: 50 μm.
(E) Plot of the best-performing polymers from the initial screen, quantifying the number of cells on each polymer 72 h after plating. The GFP-negative (black dots) cells and GFP-high pancreatic progenitors (green dots) are shown. n = 2 biological repeats and 16 replicated polymer spots per experiment.
(F) Quantification of the percentage of proliferative cells (EdU) and total cell numbers (DAPI) on the surface of the six selected candidate polymers. Error bars represent the SEM of n = 3 replicated polymer spots.
Table 1.
The 13 polymers selected from the screening, with monomer composition, molar ratio, and monomer type
| Polymer reference number | Polymer structure |
|||||
|---|---|---|---|---|---|---|
| Monomer 1 | Monomer 2 | Monomer 3 | Ratio (mol %) |
|||
| M1 | M2 | M3 | ||||
| 98a | MEMA | DEAEMA | – | 50 | 50 | – |
| 298 | MEMA | GMA | – | 70 | 30 | – |
| 299 | MEMA | GMA | – | 50 | 50 | – |
| 350a | MMA | GMA | – | 50 | 50 | – |
| 356a | MMA | DEAEMA | – | 50 | 50 | – |
| 359 | MMA | DMAEMA | – | 50 | 50 | – |
| 395 | EMA | DMAEMA | – | 50 | 50 | – |
| 464a | MEMA | DEAEMA | HEA | 60 | 30 | 10 |
| 470a | MEMA | DEAEMA | HEMA | 40 | 30 | 30 |
| 500 | MEMA | DEAEA | DMAA | 60 | 30 | 10 |
| 502 | MEMA | DEAEMA | DAAM | 40 | 30 | 30 |
| 528 | MEMA | DEAEMA | – | 70 | 30 | – |
| 529a | MEMA | DEAEMA | – | 65 | 35 | – |
Top six polymers are indicated.
Fibronectin and a simple culture medium enable efficient proliferation of pancreatic progenitors
Although PE cells proliferated on the tested polymers, we could not observe long-term expansion and noticed cell detachment over time. We thus explored the suitability of diverse extracellular matrices (ECMs) to address whether the limiting factor was the culture medium or the polymer. Previous investigations have shown that PE cells can attach to fibronectin (FN), laminin, and collagen, but expansion and passaging have not been reported on these substrates (Hogrebe et al., 2020; Mamidi et al., 2018). We thus seeded PE cells onto plates coated with a variety of ECM proteins, namely FN, laminin, vitronectin, collagen, and Matrigel (Figure S2A). We found that only FN, and to a lesser extent Matrigel, maintained PE cell attachment after two passages (Figure 2A), although PE cells could bind to all substrates at passage 0 (P0, Figure 2B). However, no cell expansion was observed, even on FN and Matrigel, beyond P2. GFP expression and EdU-labeled cells were reduced over passages, and cells started to detach (Figures 2C and 2D), indicating that the culture medium may be limiting for cell survival and proliferation.
Figure 2.

Screening of defined conditions for PE expansion
(A) Representative images of FACS-sorted HUES4-PDX1-GFP (green) PE cells on different substrates at P2 stained by Hoechst 33342 (blue). Only fibronectin enables efficient cell attachment after passaging. Images are representative of three differentiations. Scale bar: 500 μm.
(B–D) Quantification of attached HUES4-PDX1-GFP PE cells on different substrates at P0, P1, and P2. Total number recovered (B), percentage of GFP+ cells (C), and percentage of EdU+ cells (D) were analyzed. Error bars represent the SEM of n = 3 experimental repeats; ∗p < 0.05, ∗∗p < 0.01, ∗∗∗p < 0.001, ∗∗∗∗p < 0.0001, Dunnett’s multiple comparison of no coating control with fibronectin, laminin, vitronectin, collagen, or Matrigel.
(E–G) Quantification of HUES4-PDX1-GFP PE cells on fibronectin by different signaling molecules at P0, P1, and P2. Total number recovered (E), percentage of GFP+ cells (F), and percentage of EdU+ cells (G) were analyzed. Error bars represent the SEM of n = 3 experimental repeats; ∗p < 0.05, ∗∗p < 0.01, ∗∗∗p < 0.001, ∗∗∗∗p < 0.0001, Dunnett’s multiple comparison of PE medium with PE medium containing SB431452, EGF, RA, or N-[N-(3,5-Difluorophenacetyl)-L-alanyl]-S-phenylglycine t-butyl ester (DAPT) individually, or all four molecules combined (Trott’s medium).
(H) Representative immunofluorescence images of PDX1 (green), EdU (magenta), and DAPI (blue) on expandable PE (ePE) cells at P2 generated from H1 ESCs. Scale bar: 100 μm.
Previous observations have shown that a combination of signaling molecules, including epidermal growth factor (EGF), retinoic acid (RA), and inhibitors of TGF-β and Notch signaling, enables PE self-renewal (Trott et al., 2017). Thus, we screened a small set of signaling molecules individually added to our PE medium in which PE cells on FN were cultured (Figure S2A). Among the molecules, the TGF-β inhibitor SB431542 significantly outperformed other molecules, maintaining PDX1-GFP expression, increasing EdU incorporation, and increasing total cell recovery and expansion (Figures 2E–2G). The supplementation of 10 μM SB431542 to PE medium enabled PE expansion on both FN and PA98 (Figures S2B and S2C) and also that of the H1 hESC-derived PE cells (Figure 2H).
Pancreatic progenitor long-term expansion leads to enrichment of cycling PDX1+NKX6-1+ cells
Our next aim was to test if the combination of coating with either FN or the best polymer PA98 and the simple culture medium enables a long-term expansion of pancreatic progenitors. In addition, to test the sensitivity of the expansion protocol to the method used to produce PE, we explored another protocol developed by Rezania et al. (2014), as well as the protocol of Ameri et al. (2010, 2017).
Differentiated PE cells from the HUES4 PDX1-GFP line at stage 4, day 3 (S4d3) (Rezania et al., 2014), were sorted (Figure S3A), and GFP-high cells were plated on polymer- or FN-coated wells in PE medium supplemented with SB431542. Quantification of cell numbers showed a cell loss in the first 24 h after re-plating followed by efficient increases of cell numbers with both differentiation protocols (Figure S3B), leading to an average doubling time of 37.5–40.5 h. Consistent with this observation, at early passages (below P5), the cells grew relatively slowly, reaching confluency and requiring passage every 5–7 days, whereas above P5, expanding PE (ePE) cells grew stably, requiring passage every 3–4 days without loss of GFP expression up to P10 (Figure S3C). On polymer PA98, more cells were lost in the first 24 h at P0 than on FN, and confluency was thus reached in 15 days. However, the cells performed as well as on FN at subsequent passages (Figure S3D). Of note, directly differentiated PE cells at S4d3 were sensitive to low-density plating, requiring 1.5 × 10⁵ cells/cm2 density at P0, preferably in small clusters. After P5, ePE cells required less seeding density at 5 × 10⁴ to 6 × 10⁴ cells/cm2. In addition, hESC line H1-derived PE cells could also be adapted to ePE conditions successfully (Figure S3E). Although both differentiation protocols led to effective expansion, all quantitative subsequent work was performed with the Rezania protocol.
To assess whether ePE cells maintain pancreatic progenitor identity, we examined expression of pancreatic and endoderm markers and compared ePE cells on FN at early (P0–P2) and late (P7–P10) passages, as well as cells cultured on PA98 with directly differentiated cells at S4d3 (Figure 3A). While the expression of PDX1 and that of HNF1B were comparable under all conditions, FOXA2 and ONECUT1 decreased approximately by half during expansion, a significant decrease in HES1 occurred in late ePE, and SOX9 increased. Strikingly, NKX6-1 expression increased by over 15-fold at late passages (P7–P10) (Figure 3A). While NKX6-1+ cells were hardly detected in HUES4-PDX-GFP- and WTC-11 (induced PSC, iPSC)-derived PE cells at S4d3, about 20% of H1 cells were NKX6-1+ by flow cytometry analysis at this stage (Figures 3B and 3C). While in all three lines there was a small increase at early passages, the percentage of NKX6-1+ cells reached 40% on average at P7–P10 (Figures 3B and 3C). In addition, the strong decrease in NEUROG3 expression during expansion suggests that the progenitors expanded without differentiation (Figure 3A). Immunostaining confirmed co-expression of PDX1 with SOX9 and NKX6-1 proteins in ePE cells (Figure 3D). NKX6-1+ ePE cells were proliferative as indicated by EdU incorporation (Figures 3E, S3D, and S3E). From flow cytometry analysis, we found that ePE cells with the highest NKX6-1 expression levels incorporated more EdU than the negative population (Figures 3F and 3G), reflecting the increase in the NKX6-1+ cell population over time. The H1 cell line that was ascertained to be karyotypically normal at the onset of culture remained normal at P5 (Figure 3H). In addition, ePE cells could be cryopreserved, and thawed ePE cells retained their characteristics. To access multilineage differentiation potency of ePE cells, they were exposed to a minimal regime that promotes multilineage differentiation (Trott et al., 2017). Over the course of 12 days, we observed upregulation of multiple endocrine, acinar, and ductal marker gene expression (Figure S3F), suggestive of a multipotent progenitor state. Taken together, our ePE conditions enabled the enrichment of proliferating pancreatic progenitors expressing progenitor genes, notably, a marked increase in proliferative NKX6-1+ cells.
Figure 3.

Characterization of ePE cells
(A) Gene expression of PE markers (HES1, HNF1B, PDX1, FOXA2, ONECUT1, SOX9, and NKX6-1) and endocrine progenitor marker, NEUROG3, in PE and ePE cells derived from HUES4-PDX1-GFP (open-circle dots) and H1 (red dots) ESCs. Direct differentiation indicates PE cells at S4d3 of the Rezania protocol, and ePE cells are categorized by early ePE (P0–P2), late ePE (P5–P10), and polymer ePE (P3–P4) cells. The expression levels were normalized to directly differentiated PE cells at S4d3. The error bars represent the SEM of n = 5 or 3 experimental replicates; ∗p < 0.05, ∗∗p < 0.01, Mann-Whitney test comparing the result from direct differentiation PE S4d3 cells with matching ePE cells, as well as from late to early ePE samples.
(B) Representative flow cytometry histograms showing the NKX6-1+ population of PE S4d3 (Rezania protocol), ePE early (P1–P2), and late (P7–P8) passage cells from HUES4-PDX1-GFP (top) and H1 (bottom).
(C) Quantification of NKX6-1+ cells from HUES4-PDX1-GFP (open-circle dots), H1 (red dots), and WTC-11 (gray dots) ePE cells by flow cytometry. The error bars represent the SEM of n = 8 (S4d3 and ePE early) and n = 7 (ePE late) experimental replicates; ∗p < 0.05, ∗∗p < 0.01, Mann-Whitney test.
(D) Representative immunostaining images of (top) SOX9 (gray) and PDX1 (red) and (bottom) NKX6-1 (gray) and PDX1 (red), including DAPI (blue), of HUES4-PDX1-GFP ePE cells at P7. Scale bar: 50 μm.
(E) Representative immunostaining images of EdU labeling (gray) and NKX6-1 (red), including DAPI (blue), of HUES4-PDX1-GFP ePE cells at P7. Scale bar: 50 μm.
(F) Representative analysis of the proliferative NKX6-1+ population from ePE cells by flow cytometry. (Left) Representative flow cytometry plot showing NKX6-1 low 25% (green) and high 25% (red) gating of ePE cells among PDX1+ cells. (Right) EdU labeling histograms of NKX6-1 gated populations from the left plot. NKX6-1 high 25% population (red) shows more EdU+ events (23.9%), compared with NKX6-1 low 25% population (6.9%).
(G) Quantification of EdU+ cells among NKX6-1 low and high ePE cells from HUES4-PDX1-GFP (open-circle dots) and H1 (red dots) cells by flow cytometry as shown in (F). The error bars represent the SEM of n = 4 experimental replicates; ∗p < 0.05, Mann-Whitney test.
(H) Karyogram of ePE cells derived from H1 ESCs at P5.
Transcriptome analysis of expandable pancreatic progenitors
To thoroughly evaluate the genome-wide effects of the expansion, we performed RNA-sequencing analyses on PE cells from direct differentiation at S4d3 and ePE cells on FN at early passages and late passages, as well as early-passage ePE cells on polymer PA98. For a comparison with previous expansion on feeder layers, we also included the transcriptomic dataset of directly differentiated pancreatic progenitor cells (PPd15) and feeder-layer expanded (cPP) cells from Trott et al. (2017) in the subsequent analyses. Principal-component and clustering analyses showed that the first and second principal components separated directly differentiated cells from expanded cells (Figures 4A and 4B). Early and late ePE mingled, suggesting an overall stability across time in expansion culture, and ePE cells on FN and polymer could not be distinguished (Figure 4B). Then, we analyzed a number of pancreas and endoderm markers by comparing the five core ePE samples (Figure 4B) to cells at S4d3, as well as the Trott et al. (2017) PPd15 and cPP samples in parallel (Figures 4C and S4A–S4D). In agreement with qPCR and immunostaining observations, no or small changes (lower than 2-fold) in pancreatic progenitor markers were observed between ePE and PE S4d3 (Figures 4C and S4A; Tables S2A and S2B), and NKX6-1 was again found enriched during expansion in ePE, whereas it was decreased in cPP. We also observed a general downregulation of endocrine markers in ePE (NEUROG3, RFX6, NKX2-2, and PAX4), which was not seen in cPP (Figure 4C). Consistently, we found that PE S4d3 cells highly expressed endocrine-enriched genes, and ePE cells expressed more pancreatic progenitor-enriched genes than PE cells (Figure S4E), when we compared ePE and PE S4d3 cells with the top 50 genes differentially expressed in sorted populations of human fetal pancreas cells (Ramond et al., 2018).
Figure 4.

Transcriptome analysis for PE expansion and comparison to a previous protocol
(A) Principal-component analysis of transcriptomic data with top 1,000 differentially expressed genes for PE S4d3, early passage ePE (P0–P2), and late passage ePE (P7–P9), as well as ePE cells cultured on polymers (P3). Sequencing was performed on biological triplicates for each category. The expression dataset of PPd15 (directly differentiated PE cells) and cPP (expanded progenitor) cells from Trott et al. (2017) was also included.
(B) Hierarchical clustering of the transcriptome datasets specified in (A), showing sample-to-sample distances. The cell types are color coded as in (A). Colored boxes correspond to the ePE (red), cPP (green), PE S4d3 (blue), and PPd15 (yellow) samples selected for further analysis in (C).
(C) Expression analysis of selected genes from PE S4d3 and ePE cells, as well as cells from Trott et al. (2017). Normalized transcript counts of genes are shown. Expanded cells were compared between two protocols, as well as with their respective control of directly differentiated cells; ∗p < 0.05, ∗∗p < 0.01, Mann-Whitney test.
(D) Volcano plot representing differential expression analysis of ePE compared with PE S4d3 cells, where red dots indicate genes that are upregulated (log2FC > 2, padj < 0.05), and blue dots indicate genes that are downregulated (log2FC < −2, padj < 0.05).
(E) Gene set enrichment analysis (GSEA) for Gene Ontology biological process (GOBP) and Kyoto Encyclopedia of Genes and Genomes (KEGG) pathway of ePE cells compared with PE S4d3 cells. Normalized enrichment scores (NES) for significant GOBP and KEGG pathway terms enriched for ePE are shown in red and for those enriched in PE S4d3 cells are shown in blue (false discovery rate [FDR] < 0.05).
Overall, we found 763 upregulated genes and 1,550 downregulated genes (absolute log2 fold change >2, adjusted p < 0.05), comparing ePE cells with PE S4d3 cells (Figures 4D, S4B, and S4C; Table S2A). Among them, ePE showed upregulation of cell-cycle genes such as CCND1 and 2, CDKN1A, and CDKN2A (Figure 4D). Gene set enrichment analysis (GSEA) for Gene Ontology biological process (GOBP) and Kyoto Encyclopedia of Genes and Genomes (KEGG) pathway revealed the upregulation of genes involved in inflammation, including activation of TNF and other cytokines, as well as activation of the complement and coagulation cascades, both known to be activated by TNF-β signaling (Figures 4E and S4D; Tables S2A and S2C). Taken together, ePE cells maintain the gene expression profiles of pancreatic progenitors in the absence of endocrine gene expression.
Potency of expanding pancreatic progenitors to differentiate into β-like cells
A hallmark of pancreatic progenitors is their ability to differentiate into endocrine cells. We tested whether differentiation could be triggered in ePE cells by applying the differentiation stage 5 and 6 media of the Rezania protocol and compared them with directly differentiated cells using the same protocol (Figure 5A). Cells at P5 or above were differentiated either in 2D or at the air-liquid interface (Figure 5A). This led to a significant upregulation of the pan-endocrine differentiation marker CHGA but no significant difference in acinar differentiation assessed by AMY expression (Figure 5B). Expression of INS was similar to direct differentiation, but the pan-endocrine marker CHGA and β cell markers MAFA, NKX6-1, and PDX1 were significantly upregulated in differentiated ePE cells compared with direct differentiation (Figures 5C, S5A, and S5B). A comparison with human islets revealed lower levels of INS and MAFA but similar levels of NKX6-1 and PDX1 (Figures 5C and S5A) in differentiated ePE cells. Notably, α cell marker GCG and δ cell marker SST were significantly decreased in ePE differentiation (Figure 5C), which was also confirmed by immunohistochemistry and flow cytometry (Figures 5D–5F and S5C–S5E). However, ARX was similar under both differentiation conditions (Figure S5A), indicating that NKX6-1-negative cells may have initiated differentiation but failed to differentiate further toward α cells. We noted that the air-liquid interface increased the levels of PDX1 and INS but was similar to planar culture on FN for CHGA, NKX6-1, GCG, and MAFA in ePE differentiation, although there was no difference between planar and air-liquid interface conditions in direct differentiation (Figure S5B). By flow cytometry we observed that 50% of ePE cells differentiated into insulin-producing β-like cells at the liquid-air interface (Figures 5E and 5F). Significantly fewer glucagon-producing cells or INS/GCG double-positive cells were detected in ePE differentiation than in direct differentiation (Figures 5E, 5F, and S5F). The variability of differentiation efficiency depended on cell lines (HUES4 versus H1) and culture modes (planar culture versus air-liquid interface), rather than passage number (Figures 5B, 5C, 5F, S5A, S5B, and S5F). Abundant numbers of β-like cells co-expressing INS/NKX6-1 and C-PEP/MAFA were also detected by immunostaining (Figures 5C and S5E). From these observations, we conclude that differentiation of ePE was more efficient to drive insulin-producing cells than direct differentiation and decreased glucagon-producing cells.
Figure 5.

Endocrine differentiation of ePE cells
(A) Schematic diagram of endocrine cell differentiation from PE S4d3 and ePE cells at P5, P7, or P10 in planar culture or on the air-liquid interface.
(B) Gene expression profile of CHGA and AMY from HUES4-PDX1-GFP (open symbols) and H1 (red symbols) cells at S6d15 differentiation, from either directly differentiated or ePE cells (FN at P5–P10 or polymer at P3). Samples were normalized to directly differentiated samples, and ePE cells (n = 5) were used as a negative control. Error bars represent the SEM of n = 9 or 12 experimental replicates; ∗∗∗∗p < 0.0001, Mann-Whitney test comparing the data of ePE differentiation with those of direct differentiation.
(C) Gene expression profile of NKX6-1, INS, MAFA, GCG, and SST from HUES4-PDX1-GFP (open) and H1 (red) cells at S6d15 differentiation, from either directly differentiated or ePE cells (FN at P5–P10 or polymer at P3). Samples were normalized to directly differentiated samples. Human islets (n = 3) and ePE cells (n = 5) were used as positive and negative controls, respectively, for endocrine genes. Error bars represent the SEM of n = 9 or 12 experimental replicates; ∗∗p < 0.01, ∗∗∗p < 0.001, ∗∗∗∗p < 0.0001, Mann-Whitney test comparing the data of ePE differentiation at S6d15 with those of direct differentiation.
(D) Representative immunostaining images of NKX6-1, INS, GCG, C-PEP, and MAFA (as color-coded on the corresponding lines) for ePE (P9) differentiation at S6d15. Scale bar: 50 μm.
(E) Representative flow cytometry plots showing INS and GCG staining in populations of direct differentiation and ePE differentiation at S6d15.
(F) Quantification of INS+ and GCG+ cells in populations of direct differentiation (gray bars) and ePE differentiation (white bars) at S6d15 at the air-liquid interface with legend shown in (B). The error bars represent the SEM of n = 9 experimental replicates; ∗p < 0.05, Mann-Whitney test comparing the data of ePE differentiation at S6d15 with those of direct differentiation.
(G) Functional characterization of insulin-producing cells generated from ePE (open-circle dots) or direct differentiations (black dots). Sequential static glucose-stimulated insulin secretion (GSIS) assay comparing the insulin secretion of ePE or directly differentiated aggregates at S6d15 challenged with low (2.8 mM) and high (20 mM) glucose in the interval of 1 h and also with 3-Isobutyl-1-methylxanthine (IBMX) + forskolin and KCl in the interval of 30 min. The dot plot shows insulin content in 1,000 cells for each condition. Error bars represent the SEM of n = 6 or 4 experimental replicates, two technical replicates, ∗p < 0.05, ∗∗p < 0.01, ∗∗∗p < 0.001, ∗∗∗∗p < 0.0001, paired two-tailed t test comparing the data of insulin secretions with treatment with high glucose (20 mM), high glucose with IBMX + forskolin, or high glucose with KCl with low glucose (2.8 mM) stimulation; unpaired two-tailed t test comparing the data of each treatment between ePE and direct differentiation.
β-like cells differentiated from ePE secrete insulin in response to glucose
An important feature for the production of therapeutic β cells is their functionality. To address this question, we performed glucose-induced insulin secretion tests on clusters of endocrine cells at the end of differentiation. We observed that the endocrine clusters differentiated from ePE cells exhibited a 2-fold increase in insulin release at a high glucose level (20 mM) compared with a low glucose level (2.8 mM; Figure 5G). Treatments with forskolin and KCl triggered further insulin secretion from insulin storage. Compared with directly differentiated endocrine clusters, clusters differentiated from ePE showed a significantly increased level of insulin secretion in response to both low and high glucose as well as KCl, which may reflect increased insulin content and higher differentiation efficiency in ePE-differentiated clusters (Figure 5G). Taken together, we confirmed that insulin-producing cells differentiated from ePE were functional by secreting insulin in response to glucose.
Discussion
In this study we have defined a method enabling the expansion of human pancreatic progenitors in 2D cultures. Our screening identifies two matrices suitable for expansion, FN and a new synthetic polymer, as well as a new, minimal, and cost-effective fully defined medium formulation. Its simplicity and reproducibility provide useful opportunities in the development of β cell therapies for diabetes treatment, to expand cells in the middle of the production pipeline, in addition to hESC expansion. Importantly, we show that the expansion conditions enable the accumulation of cycling NKX6-1+ cells over time, which facilitates β-like cell production. In addition, differentiation of ePE toward β cells generates mostly single-hormone-producing β-like cells, possibly due to the enrichment of NKX6-1+ cells during the expansion. We further demonstrate the capacity of ePE cells to differentiate into β-like cells that are able to secrete insulin in response to glucose. We validated this protocol with two hESC lines (H1 and HUES4) and an hiPSC (WTC-11) line and note that cluster seeding and reaching high confluency in early passages are critical to achieve a successful ePE adaptation.
While expansion of pancreatic progenitor cells during the process of pancreatic differentiation toward β cell production has been previously pioneered (Trott et al., 2017), this condition requires a feeder layer, and the cells lose an important hallmark of progenitors, NKX6-1. Our observed rate of expansion without feeders under fully defined conditions is similar to that previously reported (Trott et al., 2017). Based on the transcriptome of our ePE cells, the culture conditions enable the maintenance of stable genetic profiles of bona fide pancreatic progenitors. Enrichment of NKX6-1 during differentiation has been previously reported, but none of the components that promoted its expression (EGF, nicotinamide, NOGGIN) are included in our medium (Nostro et al., 2015). However, longer exposure to FGF10 was shown to promote NKX6-1, and it is possible that FGF2, which we include, acts in a similar way. In addition, long exposure to a medium containing RA, which is used in the formulation of the Trott medium (Trott et al., 2017), decreases the NKX6-1+ population (Nostro et al., 2015). NKX6-1 expression would suggest that ePE cells are bipotent progenitors with high β cell differentiation potency by analogy to mice (Schaffer et al., 2010), and high levels of NKX6-1 have also been proposed to be necessary to produce β cells in humans (Russ et al., 2015). Since ePE cells can increase amylase and more moderately other acinar markers in a multilineage differentiation protocol, it is possible that some cells are multipotent. We hypothesize that our culture conditions increase the number of NKX6-1-expressing cells over time, because they preferentially promote the proliferation of the NKX6-1+ population. However, at this point, it is not clear how the simple conditions can promote proliferation of NKX6-1+ cells. As TGF-β signaling is known to inhibit pancreatic progenitor proliferation (Sanvito et al., 1994), TGF-β inhibition may have caused the increased proliferation of ePE cells. This increased proliferation may be through NKX6-1 regulation of progenitor proliferation, since NKX6-1 occupies multiple cell-cycle genes, such as Cdk8, Cdkn1b, and Ccnl1, and indirectly regulates CCND2 in mouse β cells (Taylor et al., 2015). A surprising feature of ePE cells is the increase of TNF-α and its downstream signaling cascades. While these cytokines are frequently produced by immune cells, notably macrophages, the absence of SPI1 (PU.1) and FLT3 and lack of upregulation of RUNX1 and major histocompatibility complex (MHC) class II genes make the presence of macrophages/antigen-presenting cells unlikely. Interestingly, a sorted pancreatic progenitor population of human fetal pancreas exhibits upregulation of inflammatory response genes compared with more differentiated cell populations (Ramond et al., 2018), and TNF-α, other cytokines, and coagulation and complement cascade genes have previously been seen to be produced by epithelia (Roulis et al., 2011). It is notably upregulated upon epithelial disruption (Poernbacher and Vincent, 2018) and promotes regeneration and wound healing in multiple tissues (Akerman et al., 1992; Nguyen-Chi et al., 2017), indicating that ePE cells may self-activate the TNF-α response following passaging. We also note that some of the genes upregulated in ePE compared with directly differentiated S4d3 cells have been reported as ductal markers in the adult pancreas (SPP1, AREG, TM4SF1, C3, CCL20, and SERPINE1) (Baron et al., 2016; Qadir et al., 2020). Although these markers may also be expressed in progenitors, it is conceivable that some ductal cells are also propagated along with the progenitors, although the numerous cells expressing NKX6-1 are expected to be progenitors.
Interestingly, the gene expression signatures detected on FN and on the polymer PA98 were very similar. Our results show that this polymer can be used to expand pancreatic progenitors in the absence of exogenous ECM. Under these conditions, the cells tend to form more clusters, although they also adhere to the substrate or polymer. While we have performed validation of expansion on one polymer, other polymers would be worth further investigations. The polymers selected during screening were all based on the two monomers 2-methoxyethyl acrylate (MEMA) and 2-(diethylamino)ethyl methacrylate (DEAEMA), with, in some instances, a third monomer such as 2-hydroxyethyl acrylate (HEA) or dimethyl acrylamide (DMAA).
From a therapeutic perspective, expanding pancreatic progenitors will be advantageous to scale up the production of β cells. Our method gives the opportunity to conduct differentiation on fewer hESCs or iPSCs and fewer differentiation experiments, as well as fewer steps of differentiation by bypassing four differentiation steps, all of which can be a source of variability. This system thus shortens the differentiation time frame. It also enables further expansion from frozen stocks of ePE, as thawed cells perform well. We expect ePE cells to be a useful tool for basic studies to investigate what controls pancreatic progenitor proliferation and how gene variants that predispose to diabetes may affect β cell development at this stage. To be useful for therapeutic purposes, a further increase in the differentiation efficiency will be desirable, but the glucose responsiveness of the cells is a promising feature, as well as the minimal numbers of α cells and double-positive hormonal cells produced. As PE expansion can be performed in 2D and in 3D Matrigel (Goncalves et al., 2021), it may be adaptable to production in suspension, which would be beneficial for further scale-up.
Experimental procedures
Detailed methods are provided in the supplemental experimental procedures. Antibodies, primers, and all the reagents are listed in Tables S3, S4, and S5, respectively.
Human ESC and iPSC lines
The H1 hESC line was obtained from WiCell, and the HUES4 PDX1-GFP reporter hESC line was previously reported (Ameri et al., 2017). The WTC-11 hiPSC line was obtained from the NIGMS Human Genetic Cell Repository of the Coriell Institute Biobank. Human ESC lines were approved for use in this project by De Videnskabsetiske Komiteer, Region Hovedstaden, under no. H-4-2013-057, Denmark, as well as by the Robert Koch Institute, Germany.
In vitro differentiation of pancreatic progenitors from hPSCs
We generated pancreatic progenitors with two distinct protocols, as previously described (Ameri et al., 2010; Rezania et al., 2014), with small modifications as described in the supplemental experimental procedures.
Polymer library synthesis and printing
The library of polyacrylates/acrylamides was described previously and was synthesized as reported by Mizomoto (2004), and detailed information is available in the supplemental experimental procedures. Three hundred eighty-two selected polyacrylate/acrylamide solutions (1% w/v in N-Methyl-2-pyrrolidone (NMP)) and two negative controls (NMP) were printed on agarose-coated slides in a Genetix Q Array mini contact printer, with pins of 4 × 8, tip diameter of 150 μm, spaced 4.5 mm from one another (Figure 1B and Table S1). Second-generation microarrays (hit arrays) were obtained by printing 30 polymers, with 16 replicas of each.
Polymer microarray assay and imaging
Sorted GFP-positive or GFP-negative PE cells (1 × 10⁶) as well as undifferentiated ESCs were plated per microarray slide and cultured for 24 h. After fixation, high-content imaging was performed and cells were counted as a readout. For the second array, 13 polymer solutions were spotted on agarose-coated glass slides (1 μL/spot) alongside an NMP control, in triplicate. Seeded PE cells on arrays were incubated for 72 h and then with EdU (Thermo Fisher) for 30 min for a proliferation assay followed by EdU labeling and immunostaining for DAPI, PDX1, and GFP (Table S3).
Screening of defined coating substrate and condition for PE expansion
ECM substrate coatings were tested with 1 × 10⁵ sorted GFP-high PE cells of the HUES4-PDX1-GFP line from the Ameri protocol in a 24-well plate format, including 100 μg/mL collagen IV, FN, laminin, or vitronectin (Sigma), as well as with Matrigel (GRF-Matrigel; Corning) diluted 1/30 in DMEM/F12 GlutaMAX.
Different signaling molecules or inhibitors reported in Trott et al. (2017) were also tested with 1 × 10⁵ sorted GFP-high PE cells on FN.
At day 7, P0 cells were dissociated with Accutase (Thermo Fisher Scientific) for 5 min and collected for cell counting, GFP and EdU detection by flow cytometry, and passaging.
ePE cell expansion under 2D conditions
Polystyrene cell culture plates (Corning) were coated with FN human plasma solution (Sigma-Aldrich) for 1–2 h at room temperature at the concentration of 100 μg/mL. Differentiated PE cells or sorted PE cells were re-suspended in ePE medium (DMEM/F12 GlutaMAX (Thermo Fisher Scientific), 64 ng/mL FGF2 (Peprotech), 1× B-27 (Thermo Fisher Scientific), and 10 μM SB431542 (Santa Cruz Biotechnology) supplemented with 10 μM ROCK inhibitor Y-27632 (Sigma). The cells were plated at a density of 1.58 × 10⁵/cm2 at P0. The medium was changed to ePE medium without ROCK inhibitor 24 h after re-plating and then the cells were fed every 2–3 days until passaging after 5–7 days in culture for cells at P0–P5 or 3–4 days cells at later passages.
Flow cytometry and immunohistochemistry analysis of hESCs and ePE cells
The detailed methods are described in the supplemental experimental procedures. Antibody sources and concentrations are listed in Table S3.
EdU detection in differentiated hESCs and ePE cells
After 3–5 days of culture in ePE medium, ePE cells were incubated with 10 μM EdU in ePE medium for 1 h at 37°C. Following this, they were prepared for flow cytometry or imaging as described in the supplemental experimental procedures. Permeabilization, blocking, and Click-iT reaction for EdU detection were performed according to the manufacturer’s instructions.
Karyotyping
The karyogram was analyzed on metaphase spreads of ePE cells derived from H1 cells at P5 (Organisation Genetische Diagnostik Institut für Klinische Genetik Medizinische Fakultät Carl Gustav Carus TU Dresden).
Multilineage pancreatic differentiation of ePE cells
Multilineage differentiation was performed with a protocol adapted from Trott et al. (2017), for both planar culture and air-liquid interface differentiation from ePE cells.
Endocrine differentiation of hPSCs and ePE cells
For planar endocrine differentiation, hESCs were differentiated by the Rezania protocol until stage 6 (Rezania et al., 2014). For air-liquid interface endocrine differentiation, 1 × 10⁵ cells at S4d3 or in ePE were spotted on the membrane surface of a Millicell insert (Millipore) and cultured in stage 5 and 6 medium (Rezania et al., 2014).
Static glucose-stimulated insulin secretion (GSIS) assay
ePE cells at P5 and P10 were differentiated as described above. At the end of stage 6 of differentiation, 10–15 aggregates were rinsed twice with incubation buffer and exposed sequentially to glucose and secretagogues. Supernatants were collected after each incubation step and analyzed using a Mercodia human insulin ELISA kit (Mercodia). At the end of the experiment, cell aggregates were dissociated into single cells, and the cell numbers were counted to normalize the GSIS.
RNA-sequencing analysis of gene expression
Sequencing libraries were prepared from 250 ng of purified total mRNA using the NEBNext Ultra II RNA Library Prep Kit for Illumina (NEB). Single-read RNA sequencing was performed using the NextSeq 500 (Illumina) with the 75 High Output Kit (Illumina). Fastq files were aligned to the hg38/GRCh38 genome. Detailed analysis methods are provided in the supplemental experimental procedures.
Statistical analyses
Data representation and statistical analyses were performed using GraphPad Prism. Unless mentioned otherwise, data are shown as the mean ± SEM and numbers (n) refer to biologically independent replicates. Statistical significance (p < 0.05) was determined, as indicated in the figure legends, using Dunnett’s multiple comparison, Mann-Whitney test, paired two-tailed t test, or unpaired two-tailed t test.
Data and code availability
The accession number for the sequencing data reported in this paper is [https://www.ebi.ac.uk/arrayexpress/]: E-MTAB-9992.
Author contributions
A.G.-B., M.B., and J.B. conceptualized the study. A.N., Y.F.W., C.G., M. Larsen, M. Leuschner, and Y.H.K. performed the investigations. A.V., S.V., and M.S. performed polymer screen and fabrication. A.N., Y.F.W., and Y.H.K. analyzed data. M.M. analyzed transcriptome data. A.N., Y.F.W., A.V., M.M., Y.H.K., and A.G.-B. wrote the original draft. S.V., M.S., C.G., M. Larsen, M. Leuschner, J.B., and M.B. reviewed and edited the manuscript. J.B., M.B., and A.G.-B acquired funding. Y.H.K., J.B., M.B., and A.G.-B. supervised.
Conflicts of interests
The authors declare no competing interests.
Acknowledgments
The Novo Nordisk Foundation Center for Stem Cell Biology is supported by Novo Nordisk Foundation, Denmark grant NNF17CC0027852, and the Novo Nordisk Foundation Center for Stem Cell Medicine is supported by Novo Nordisk Foundation, Denmark grant NNF21CC0073729. We thank Helen Neil and the DanStem Genomics Platform and the facilities of Stem Cell Culture, Flow Cytometry, and Imaging at DanStem, as well as the facilities of Organoid and Stem Cell and Cell Technologies at MPI-CBG, and their staff for technical expertise, support, and the use of instruments. Data processing and analysis were performed using the DeiC National Life Science Supercomputer at DTU (www.computerome.dk).
Published: April 21, 2022
Footnotes
Supplemental information can be found online at https://doi.org/10.1016/j.stemcr.2022.03.013.
Supplemental information
References
- Akerman P., Cote P., Yang S.Q., McClain C., Nelson S., Bagby G.J., Diehl A.M. Antibodies to tumor necrosis factor-alpha inhibit liver regeneration after partial hepatectomy. Am. J. Physiol. 1992;263:G579–G585. doi: 10.1152/ajpgi.1992.263.4.G579. [DOI] [PubMed] [Google Scholar]
- Ameri J., Borup R., Prawiro C., Ramond C., Schachter K.A., Scharfmann R., Semb H. Efficient generation of glucose-responsive beta cells from isolated GP2 + human pancreatic progenitors. Cell Rep. 2017;19:36–49. doi: 10.1016/j.celrep.2017.03.032. [DOI] [PubMed] [Google Scholar]
- Ameri J., Stahlberg A., Pedersen J., Johansson J.K., Johannesson M.M., Artner I., Semb H. FGF2 specifies hESC-derived definitive endoderm into foregut/midgut cell lineages in a concentration-dependent manner. Stem Cell. 2010;28:45–56. doi: 10.1002/stem.249. [DOI] [PubMed] [Google Scholar]
- Baron M., Veres A., Wolock S.L., Faust A.L., Gaujoux R., Vetere A., Ryu J.H., Wagner B.K., Shen-Orr S.S., Klein A.M., et al. A single-cell transcriptomic map of the human and mouse pancreas reveals inter- and intra-cell population structure. Cell Syst. 2016;3:346–360.e4. doi: 10.1016/j.cels.2016.08.011. [DOI] [PMC free article] [PubMed] [Google Scholar]
- Cheng X., Ying L., Lu L., Galvao A.M., Mills J.A., Lin H.C., Kotton D.N., Shen S.S., Nostro M.C., Choi J.K., et al. Self-renewing endodermal progenitor lines generated from human pluripotent stem cells. Cell Stem Cell. 2012;10:371–384. doi: 10.1016/j.stem.2012.02.024. [DOI] [PMC free article] [PubMed] [Google Scholar]
- Goncalves C.A., Larsen M., Jung S., Stratmann J., Nakamura A., Leuschner M., Hersemann L., Keshara R., Perlman S., Lundvall L., et al. A 3D system to model human pancreas development and its reference single-cell transcriptome atlas identify signaling pathways required for progenitor expansion. Nat. Commun. 2021;12:3144. doi: 10.1038/s41467-021-23295-6. [DOI] [PMC free article] [PubMed] [Google Scholar]
- Greggio C., De Franceschi F., Figueiredo-Larsen M., Gobaa S., Ranga A., Semb H., Lutolf M., Grapin-Botton A. Artificial three-dimensional niches deconstruct pancreas development in vitro. Development. 2013;140:4452–4462. doi: 10.1242/dev.096628. [DOI] [PMC free article] [PubMed] [Google Scholar]
- Greggio C., De Franceschi F., Figueiredo-Larsen M., Grapin-Botton A. In vitro pancreas organogenesis from dispersed mouse embryonic progenitors. J. Vis. Exp. 2014:e51725. doi: 10.3791/51725. [DOI] [PMC free article] [PubMed] [Google Scholar]
- Gu G., Dubauskaite J., Melton D.A. Direct evidence for the pancreatic lineage: NGN3+ cells are islet progenitors and are distinct from duct progenitors. Development. 2002;129:2447–2457. doi: 10.1242/dev.129.10.2447. [DOI] [PubMed] [Google Scholar]
- Hogrebe N.J., Augsornworawat P., Maxwell K.G., Velazco-Cruz L., Millman J.R. Targeting the cytoskeleton to direct pancreatic differentiation of human pluripotent stem cells. Nat. Biotechnol. 2020;38:460–470. doi: 10.1038/s41587-020-0430-6. [DOI] [PMC free article] [PubMed] [Google Scholar]
- Huang L., Holtzinger A., Jagan I., BeGora M., Lohse I., Ngai N., Nostro C., Wang R., Muthuswamy L.B., Crawford H.C., et al. Ductal pancreatic cancer modeling and drug screening using human pluripotent stem cell- and patient-derived tumor organoids. Nat. Med. 2015;21:1364–1371. doi: 10.1038/nm.3973. [DOI] [PMC free article] [PubMed] [Google Scholar]
- Jennings R.E., Berry A.A., Kirkwood-Wilson R., Roberts N.A., Hearn T., Salisbury R.J., Blaylock J., Piper Hanley K., Hanley N.A. Development of the human pancreas from foregut to endocrine commitment. Diabetes. 2013;62:3514–3522. doi: 10.2337/db12-1479. [DOI] [PMC free article] [PubMed] [Google Scholar]
- Jennings R.E., Berry A.A., Strutt J.P., Gerrard D.T., Hanley N.A. Human pancreas development. Development. 2015;142:3126–3137. doi: 10.1242/dev.120063. [DOI] [PubMed] [Google Scholar]
- Kroon E., Martinson L.A., Kadoya K., Bang A.G., Kelly O.G., Eliazer S., Young H., Richardson M., Smart N.G., Cunningham J., et al. Pancreatic endoderm derived from human embryonic stem cells generates glucose-responsive insulin-secreting cells in vivo. Nat. Biotechnol. 2008;26:443–452. doi: 10.1038/nbt1393. [DOI] [PubMed] [Google Scholar]
- Larsen H.L., Martin-Coll L., Nielsen A.V., Wright C.V.E., Trusina A., Kim Y.H., Grapin-Botton A. Stochastic priming and spatial cues orchestrate heterogeneous clonal contribution to mouse pancreas organogenesis. Nat. Commun. 2017;8:605. doi: 10.1038/s41467-017-00258-4. [DOI] [PMC free article] [PubMed] [Google Scholar]
- Mamidi A., Prawiro C., Seymour P.A., de Lichtenberg K.H., Jackson A., Serup P., Semb H. Mechanosignalling via integrins directs fate decisions of pancreatic progenitors. Nature. 2018;564:114–118. doi: 10.1038/s41586-018-0762-2. [DOI] [PubMed] [Google Scholar]
- Mizomoto H. University of Southampton; 2004. The Synthesis and Screening of Polymer Libraries Using a High Throughput Approach. [Google Scholar]
- Morrison G.M., Oikonomopoulou I., Migueles R.P., Soneji S., Livigni A., Enver T., Brickman J.M. Anterior definitive endoderm from ESCs reveals a role for FGF signaling. Cell Stem Cell. 2008;3:402–415. doi: 10.1016/j.stem.2008.07.021. [DOI] [PubMed] [Google Scholar]
- Nguyen-Chi M., Laplace-Builhe B., Travnickova J., Luz-Crawford P., Tejedor G., Lutfalla G., Kissa K., Jorgensen C., Djouad F. TNF signaling and macrophages govern fin regeneration in zebrafish larvae. Cell Death Dis. 2017;8:e2979. doi: 10.1038/cddis.2017.374. [DOI] [PMC free article] [PubMed] [Google Scholar]
- Nostro M.C., Sarangi F., Yang C., Holland A., Elefanty A.G., Stanley E.G., Greiner D.L., Keller G. Efficient generation of NKX6-1+ pancreatic progenitors from multiple human pluripotent stem cell lines. Stem Cell Rep. 2015;4:591–604. doi: 10.1016/j.stemcr.2015.02.017. [DOI] [PMC free article] [PubMed] [Google Scholar]
- Pagliuca F.W., Millman J.R., Gurtler M., Segel M., Van Dervort A., Ryu J.H., Peterson Q.P., Greiner D., Melton D.A. Generation of functional human pancreatic beta cells in vitro. Cell. 2014;159:428–439. doi: 10.1016/j.cell.2014.09.040. [DOI] [PMC free article] [PubMed] [Google Scholar]
- Petersen M.B.K., Goncalves C.A.C., Kim Y.H., Grapin-Botton A. Recapitulating and deciphering human pancreas development from human pluripotent stem cells in a dish. Curr. Top. Dev. Biol. 2018;129:143–190. doi: 10.1016/bs.ctdb.2018.02.009. [DOI] [PubMed] [Google Scholar]
- Poernbacher I., Vincent J.P. Epithelial cells release adenosine to promote local TNF production in response to polarity disruption. Nat. Commun. 2018;9:4675. doi: 10.1038/s41467-018-07114-z. [DOI] [PMC free article] [PubMed] [Google Scholar]
- Qadir M.M.F., Alvarez-Cubela S., Klein D., van Dijk J., Muniz-Anquela R., Moreno-Hernandez Y.B., Lanzoni G., Sadiq S., Navarro-Rubio B., Garcia M.T., et al. Single-cell resolution analysis of the human pancreatic ductal progenitor cell niche. Proc. Natl. Acad. Sci. U S A. 2020;117:10876–10887. doi: 10.1073/pnas.1918314117. [DOI] [PMC free article] [PubMed] [Google Scholar]
- Ramond C., Beydag-Tasoz B.S., Azad A., van de Bunt M., Petersen M.B.K., Beer N.L., Glaser N., Berthault C., Gloyn A.L., Hansson M., et al. Understanding human fetal pancreas development using subpopulation sorting, RNA sequencing and single-cell profiling. Development. 2018;145:dev165480. doi: 10.1242/dev.165480. [DOI] [PMC free article] [PubMed] [Google Scholar]
- Rezania A., Bruin J.E., Arora P., Rubin A., Batushansky I., Asadi A., O'Dwyer S., Quiskamp N., Mojibian M., Albrecht T., et al. Reversal of diabetes with insulin-producing cells derived in vitro from human pluripotent stem cells. Nat. Biotechnol. 2014;32:1121–1133. doi: 10.1038/nbt.3033. [DOI] [PubMed] [Google Scholar]
- Roulis M., Armaka M., Manoloukos M., Apostolaki M., Kollias G. Intestinal epithelial cells as producers but not targets of chronic TNF suffice to cause murine Crohn-like pathology. Proc. Natl. Acad. Sci. U S A. 2011;108:5396–5401. doi: 10.1073/pnas.1007811108. [DOI] [PMC free article] [PubMed] [Google Scholar]
- Russ H.A., Parent A.V., Ringler J.J., Hennings T.G., Nair G.G., Shveygert M., Guo T., Puri S., Haataja L., Cirulli V., et al. Controlled induction of human pancreatic progenitors produces functional beta-like cells in vitro. EMBO J. 2015;34:1759–1772. doi: 10.15252/embj.201591058. [DOI] [PMC free article] [PubMed] [Google Scholar]
- Sanvito F., Herrera P.L., Huarte J., Nichols A., Montesano R., Orci L., Vassalli J.D. TGF-beta 1 influences the relative development of the exocrine and endocrine pancreas in vitro. Development. 1994;120:3451–3462. doi: 10.1242/dev.120.12.3451. [DOI] [PubMed] [Google Scholar]
- Schaffer A.E., Freude K.K., Nelson S.B., Sander M. Nkx6 transcription factors and Ptf1a function as antagonistic lineage determinants in multipotent pancreatic progenitors. Dev. Cell. 2010;18:1022–1029. doi: 10.1016/j.devcel.2010.05.015. [DOI] [PMC free article] [PubMed] [Google Scholar]
- Taylor B.L., Benthuysen J., Sander M. Postnatal β-cell proliferation and mass expansion is dependent on the transcription factor Nkx6.1. Diabetes. 2015;64:897–903. doi: 10.2337/db14-0684. [DOI] [PMC free article] [PubMed] [Google Scholar]
- Teitelman G., Lee J.K., Alpert S. Expression of cell type-specific markers during pancreatic development in the mouse: implications for pancreatic cell lineages. Cell Tissue Res. 1987;250:435–439. doi: 10.1007/BF00219089. [DOI] [PubMed] [Google Scholar]
- Trott J., Tan E.K., Ong S., Titmarsh D.M., Denil S., Giam M., Wong C.K., Wang J., Shboul M., Eio M., et al. Long-term culture of self-renewing pancreatic progenitors derived from human pluripotent stem cells. Stem Cell Rep. 2017;8:1675–1688. doi: 10.1016/j.stemcr.2017.05.019. [DOI] [PMC free article] [PubMed] [Google Scholar]
- Zhu S., Russ H.A., Wang X., Zhang M., Ma T., Xu T., Tang S., Hebrok M., Ding S. Human pancreatic beta-like cells converted from fibroblasts. Nat. Commun. 2016;7:10080. doi: 10.1038/ncomms10080. [DOI] [PMC free article] [PubMed] [Google Scholar]
Associated Data
This section collects any data citations, data availability statements, or supplementary materials included in this article.
Supplementary Materials
Data Availability Statement
The accession number for the sequencing data reported in this paper is [https://www.ebi.ac.uk/arrayexpress/]: E-MTAB-9992.