Abstract
The acid tolerance response (ATR) of chemostat cultures of Lactococcus lactis subsp. cremoris NCDO 712 was dependent on the dilution rate and on the extracellular pH (pHo). A decrease in either the dilution rate or the pHo led to a decrease in the cytoplasmic pH (pHi) of the cells, and similar levels of acid tolerance were observed at any specific pHi irrespective of whether the pHi resulted from manipulation of the growth rate, manipulation of the pHo, or both. Acid tolerance was also induced by sudden additions of acid to chemostat cultures growing at a pHo of 7.0, and this induction was completely inhibited by chloramphenicol. The end products of glucose fermentation depended on the growth rate and the environmental pHo of the cultures, but neither the spectrum of end products nor the total rate of acid production correlated with a specific pHi. The rate of ATP formation was not correlated with pHi, but a good correlation between the cellular level of H+-ATPase and pHi was observed. Moreover, an inverse correlation between the cytoplasmic levels of ATP and pHi was established. Each pHi below 6.6 was characterized by unique levels of ATR, H+-ATPase, and ATP. High levels of H+-ATPase also coincided with high levels of acid tolerance of cells in batch cultures induced with sublethal levels of acid. We concluded that H+-ATPase is one of the ATR proteins induced by acid pHi through growth at an acid pHo or a slow growth rate.
Recent studies have shown that a number of bacteria, including lactococci, possess an inducible acid tolerance response (ATR); that is, they acquire the ability to survive otherwise lethal acid concentrations following preexposure to mildly acidic conditions (6, 8, 16, 20, 21, 23). Exposure of log-phase Lactococcus lactis subsp. cremoris NCDO 712 cells to an extracellular pH (pHo) of 5.0 for 1 h resulted in a 100-fold increase in survival after a 2-h challenge with acetic acid at pHo 4.0 (21). The cells acquired acid tolerance by a mechanism which involved protein synthesis. The magnitude of the ATR was dependent on the degree of acidification of the growth medium, as indicated by its pHo. However, it was clearly established that pHo participated in the ATR through its effect on the pH of the cell cytoplasm (pHi).
Several factors could affect the pHi of cells and in so doing might be involved in induction of the ATR. Nannen and Hutkins (18) showed that during log-phase growth of a number of strains of lactic acid bacteria, including strains of lactococci, the pHi decreased as the pHo decreased due to the production of lactic acid. Usually, more than 95% of either lactose or glucose is converted to l-lactic acid when lactococci are grown anaerobically in batch culture. However, a number of reports have shown that at low growth rates in chemostat cultures the spectrum of fermentation end products changes (4, 25). Thomas et al. (25) demonstrated that when growing anaerobically at low growth rates in glucose-limited chemostat cultures, strains of lactococci switched their fermentation pathway from homolactic fermentation to mixed-acid fermentation and that the end products were formic, acetic, and lactic acids. Formic acid has a pKa similar to the pKa of lactic acid, but acetic acid has a higher pKa than lactic acid and at equimolar concentrations is more effective at reducing the pHi of cells (24). There is good evidence from both batch (13) and chemostat (1) culture studies that the membrane H+-ATPase plays a key role in regulating the pHi of lactic acid bacteria and may be the most important mechanism involved in pHi regulation in these bacteria.
In the present study we were mainly concerned with changes in the ATR induced by changes in the growth rate and the pHo of glucose-limited chemostat cultures of L. lactis. We observed that as the pHo of batch cultures decreased, the level of the ATR increased. However, the growth rate also decreased as the pHo decreased. In addition, in batch cultures the level of the ATR increased from early in the log phase to the stationary phase (see Table 1). Chemostat cultures allowed us to vary the pHo and the growth rate of a culture independently, and therefore, the role of each of these parameters in the induction of an ATR in L. lactis subsp. cremoris NCDO 712 could be assessed independently. Variations attributable to the phase of growth were also eliminated in chemostat cultures. In addition, other factors, such as the cytoplasmic ATP levels, the rate of ATP generation, the levels of H+-ATPase, and the rate of acid production, were examined for possible correlations with changes in the pHi of L. lactis.
TABLE 1.
Acid resistance of L. lactis subsp. cremoris NCDO 712 at various stages of growth in batch cultures at several constant pHo values
| pHo | Growth rate (h−1)a | % Survival after a 2-h challenge at pHo 4.0
|
|
|---|---|---|---|
| Early-exponential-phase cellsb | Late-exponential-phase and early-stationary-phase cells | ||
| 7.0 | 1.06 | 0.18 | 27.75 |
| 6.5 | 0.98 | 0.35 | 75.40 |
| 6.0 | 0.68 | 14.77 | 92.72 |
| 5.5 | 0.52 | 91.89 | 100.00 |
Growth rate was determined as follows: (ln x2 − ln x1)/(t2 − t1).
The optical density at 580 nm was 0.1 to 0.2.
MATERIALS AND METHODS
Bacterial strain and growth conditions.
The culture used in this study was L. lactis subsp. cremoris NCDO 712 (3). This strain is now classified as an L. lactis subsp. cremoris strain on the basis of DNA homology data (5). Batch cultures were grown as described previously (21).
Chemostat cultures.
Continuous cultures were established in a BioFlo chemostat (New Brunswick Scientific Co. Inc., Edison, N.J.) with a 360-ml working volume. The medium used was TYG, which contained (per liter) 17 g of tryptone, 3 g of yeast extract, 3.25 g of KH2PO4, 2.28 g of Na2HPO4, and 3 g of glucose (16.7 mM) as the growth-limiting substrate. The pH was controlled by automatic addition of 2 N NaOH. All cultures were grown anaerobically under an N2 gas headspace, the temperature was maintained at 30°C, the cultures were agitated at 200 rpm. Continuous cultures were grown at pH values of 7.0, 6.5, 6.0, and 5.5 and at dilution rates of 0.7, 0.5, 0.33, and 0.17 h−1. To ensure that measurements were made under steady-state conditions, the culture medium was replaced with fresh medium 10 times before any measurements were made. When the pHi values of chemostat cultures were measured, the working volume was reduced to 60 ml; all other growth conditions were unchanged.
Cell numbers were estimated as described previously (21). Acid resistance was measured by determining the fraction of cells which survived a 2-h exposure to TYG acidified to pH 4.0 with acetic acid (21).
Measurement of pHi.
The pHi values of cells growing in glucose-limited chemostat cultures were determined by measuring [14C]benzoic acid accumulation by a modification of the method of Kroll and Booth (15). [14C]benzoic acid (1 μCi/ml) was added directly to a culture in a growth vessel. Portions (1 ml) of growth medium containing labelled cells were removed, and the cells were rapidily separated from the medium by centrifugation through 1-bromodecane. The pHi was calculated by determining the difference between the concentration of [14C]benzoic acid in the cytoplasm of cells growing in the chemostat and the concentration of [14C]benzoic acid in the growth medium (as described by O’Sullivan and Condon [21]). The cytoplasmic volume of cells was determined separately by determining the difference between accumulation of the cytoplasmic impermeable marker d-[U-14C]sorbitol and accumulation of the permeable marker 3H2O (22). To limit perturbation of the continuous growth conditions, the isotopes were added directly to the cultures in the growth vessel; cells were then removed and rapidly separated from the medium by centrifugation through 1-bromodecane. On the basis of a large number of measurements obtained by using cells grown at the range of growth rates and pHo values used in these experiments, the intracellular volumes and the extracytoplasmic volumes were found to be constant (4.04 ± 0.033 and 4.37 ± 0.086 μl/mg of protein, respectively).
Determination of the concentrations of fermentation substrate and end products.
Glucose, lactic acid, acetic acid, formic acid, and ethanol contents were determined by high-performance liquid chromatography by using an LKB apparatus equipped with a refractive index detector. The column used was an Aminex HPX-87H cation-exchange column (Bio-Rad Laboratories, Richmond, Calif.), and 0.01 N H2SO4 at a flow rate of 0.6 ml/min was the elution fluid. The temperature of the column was maintained at 65°C. Ethanol and acetic acid contents were also determined by gas-liquid chromatography performed with a Shimadzu model GC-8A gas chromatograph equipped with a flame ionization detector. The column used consisted of Tween 80 on Chromosorb WAW. The ethanol and acetic acid concentrations determined by high-performance liquid chromatography and gas-liquid chromatography were consistently similar.
The direction of pyruvate metabolism to lactic acid or a mixed-acid spectrum of end products was calculated as the percentage of homolactic fermentation, which was defined as the molar ratio of lactic acid to lactic acid plus acetic acid plus ethanol. The following metabolic quotients were estimated: qglu was the millimoles of glucose used per gram of protein per hour; qlactate was the millimoles of lactate generated per gram of protein per hour; qacetate was the millimoles of acetate generated per gram of protein per hour; and qformate was the millimoles of formate generated per gram of protein per hour. The rate of ATP generation (qATP) and the rate of acid production (qH+) were also estimated, as follows: qATP = 2qglu + qacetate; and qH+ = qlactate + qacetate + qformate.
Measurement of intracellular ATP levels.
The level of cytoplasmic ATP was measured by using a commercial microbial ATP assay kit (Lumac b.v., Landgraaf, The Netherlands). As outlined below, the kit procedure was modified to enhance quantitative measurement of ATP. A 200-μl aliquot of culture was removed from the chemostat, instantaneously mixed with 200 μl of the nucleotide-releasing reagent supplied with the assay kit, and incubated for 2 min with gentle agitation. A 100-μl aliquot of this mixture was added to 900 μl of assay buffer (25 mM Tris, 2 mM EDTA; pH 7.75) and incubated for 1 min. One hundred microliters of this mixture was mixed in a sample cuvette with 100 μl of reconstituted luciferase-luciferin from the assay kit, and the resulting bioluminescence was measured immediately by using a model Lumac Biocounter 1500 apparatus. A standard curve prepared by using a stock ATP solution was used to relate bioluminescence readings to ATP concentrations.
Measurement of ATPase specific activity.
Cells were permeabilized by the method described by Belli and Marquis (1), with minor modifications. A 25-ml culture sample was removed from the chemostat culture vessel and centrifuged immediately at 4°C, and the cell pellet was resuspended in 2.5 ml of 75 mM Tris-HCl buffer (pH 6.5) containing 10 mM MgSO4. Then 250 μl of toluene was added, and the cell suspension was vortexed vigorously prior to incubation at 37°C for 5 min. The cells were then subjected to two cycles of freezing in a dry ice-ethanol bath and thawing at 37°C. The permeabilized cells were harvested by centrifugation and resuspended in 1 ml of 75 mM Tris-HCl–10 mM MgSO4 (pH 6.5). The suspension was quickly frozen in a dry ice-ethanol bath and stored at −80°C. The ATPase assay used was a modified version of the assay described by Chan et al. (2). A 10-μl sample of the permeabilized cell suspension was added to 990 μl of 50 mM Tris-malate buffer containing 10 mM MgSO4 (pH 6.5), and the mixture was warmed at 37°C for 5 min. The reaction was initiated by adding 125 μl of prewarmed 0.02 M ATP (pH 6.5) and was stopped after 5 min by adding 1 ml of malachite green reagent, which contained 5.7% (wt/vol) ammonium molybdate in 6 N HCl, 2.3% (wt/vol) polyvinyl alcohol (Sigma Chemical Co.), 0.08% (wt/vol) malachite green (Sigma Chemical Co.), and distilled water at a ratio of 1:1:2:2. Color was allowed to develop at room temperature, and after 5 min absorbance at 630 nm was measured by using a Beckman model DU-600 spectrophotometer. A standard curve prepared from a stock KH2PO4 solution was used to relate absorbance to phosphate concentration. The specific activity of H+-ATPase was expressed in micromoles of phosphate released per gram of cell protein per minute.
Measurement of cellular protein content.
The cellular protein content was determined by using a commercial protein assay (Bio-Rad Laboratories GmbH, Munich, Germany) and bovine serum albumin as the standard. The protein content of a culture having an optical density at 580 nm of 1.0 was 0.16 ± 0.01 mg/ml.
RESULTS AND DISCUSSION
Acid resistance during growth in batch cultures at constant pHo values.
L. lactis subsp. cremoris NCDO 712 cells were grown in batch cultures in TYG medium at constant pHo values of 7.0, 6.5, 6.0, and 5.5, and the ability of each of the cultures to survive an acid challenge (acetic acid at pHo 4.0) was determined (Table 1). Cells growing at a constant pHo of 7.0 were extremely sensitive to the low pH in the early exponential growth phase but were much more tolerant in the late log phase. Cultures grown at a constant pHo of 6.5 were similar but were slightly less sensitive at each growth phase. At a constant pHo of 6.0, cultures were quite acid tolerant during exponential growth and were almost completely resistant to the acid challenge in the late log phase. Cells growing more slowly at a constant pHo of 5.5 were not sensitive at any stage of growth but acquired a high level of acid tolerance by the early exponential phase. These results suggested that an ATR was induced as cells progressed from the exponential phase to the stationary phase and also by growth at acid pHo values. However, cells grown at acid pHo values grew more slowly than cells grew at neutral pHo. Whether the acid pHo values of the growth media or the resulting slow growth rates were responsible for the increased levels of ATR could not be distinguished in these batch culture experiments.
Influence of growth rates and pH values of chemostat cultures on acid tolerance.
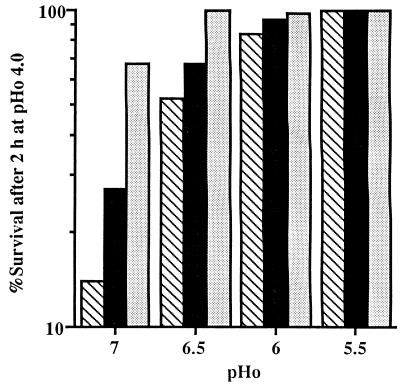
To distinguish between ATR induced by an acid pHo and ATR resulting from a slow growth rate, chemostat cultures were used. The growth rate was varied independent of the pHo by varying the dilution rate, and the pHo was varied independent of the growth rate by varying the pH of the culture at a constant dilution rate. Furthermore, any changes in the ATR due to changes in the growth phase of a batch culture were eliminated in the constant environment of the chemostat. Figure 1 shows profiles of the acid tolerance of chemostat cultures of L. lactis subsp. cremoris NCDO 712 for a range of growth rates (dilution rates, 0.5 to 0.17 h−1) limited by the glucose concentration at constant pHo values of 7.0, 6.5, 6.0, and 5.5. Although acid tolerance remained constant in the steady state at each constant pHo and growth rate, the extent of the tolerance was affected by both parameters. At pHo values of 7.0, 6.5, and 6.0, the ATR increased as the growth rate decreased. The growth rate effect, which was greatest at pHo 7.0, became less obvious as the pHo was reduced, and at pHo 5.5 cells were completely resistant to an acetic acid challenge at pHo 4.0 for 2 h at all of the growth rates tested. Thus, both reduced growth rate and acid pHo induced an ATR.
FIG. 1.
Induction of acid tolerance (expressed as percentages of survival after a pHo 4.0 challenge) in L. lactis subsp. cremoris NCDO 712 by slow growth rates and sublethal pHo values in steady-state chemostat cultures growing at pHo values of 5.5 to 7.0 and dilution rates of 0.5 h−1 (cross-hatched bars), 0.33 h−1 (solid bars), and 0.17 h−1 (stippled bars). The data are the means of values from five replicate experiments; the standard deviation in each case was less than 10% of the mean.
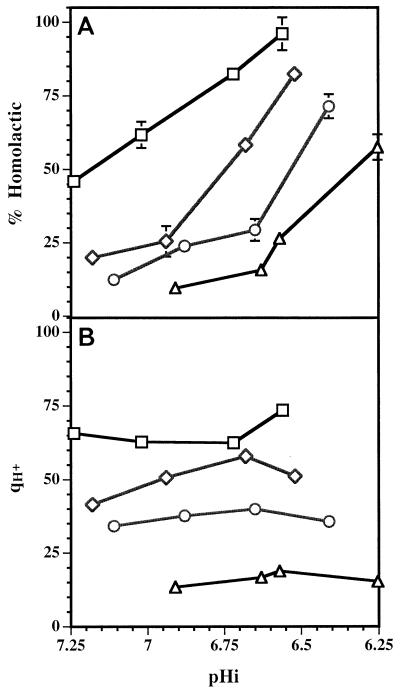
The adaptations of Streptococcus mutans to acid stress in continuous culture, which were investigated by Belli and Marquis (1), were somewhat similar to the adaptations of L. lactis subsp. cremoris NCDO 712. Cells grown continuously at pHo values close to 5.0 survived an acid challenge better than cells from continuous cultures maintained at pHo 7.0. In other experiments the same authors (1) measured acid tolerance by determining the lowest pH at which glycolysis occurred. They showed that cells of S. mutans and Enterococcus hirae from a chemostat culture grown at a pHo of approximately 5.0 were capable of glycolysis at a lower pH than cells grown at a pHo of 7.0 were. In addition, a slightly lower pH for glycolysis was observed with cells grown at a rate of 0.29 h−1 than with cells grown at a rate of 0.08 h−1 at the same pHo. This seems to contradict our observations with NCDO 712 cells, which were more acid tolerant when they were grown at a slow rate than when they were grown at a fast rate. However; the methods of assessing acid tolerance were very different. We noted that in chemostat cultures fast-growing cells of L. lactis produced acid from glucose at a faster rate than slowly growing cells produced acid (Fig. 2B): however, the latter survived a lethal acid challenge much better than the former.
FIG. 2.
Changes in the fermentation of glucose by L. lactis subsp. cremoris NCDO 712 growing in chemostat cultures at dilution rates of 0.7 h−1 (□), 0.5 h−1 (◊), 0.33 h−1 (○), and 0.17 h−1 (▵) and at pHo values of 5.5 to 7.0. The corresponding pHi values are shown. (A) Amount of lactic acid produced, expressed as a percentage of the total amount of fermentation end products. (B) Overall qH+ (in millimoles per gram of protein per hour) for each culture. The standard deviations are indicated by error bars; in some cases the standard deviation was less than 3.8% and the error bar is smaller than the symbol.
Changes in pHi with pHo values and growth rates of continuous cultures.
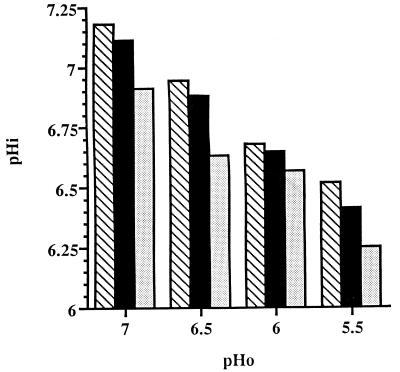
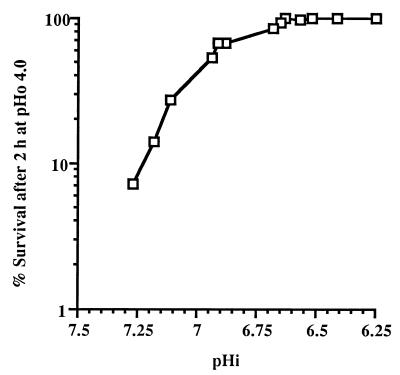
It has been demonstrated previously that the ATR conferred by exposure of log-phase, batch culture L. lactis subsp. cremoris NCDO 712 cells to sublethal acid stress is dictated by the pHi rather than the pHo (21). To determine if the ATR values displayed by chemostat cultures were similarly influenced, the pHi values of chemostat cultures were determined. As expected, at each growth rate the pHi decreased as the pHo decreased (Fig. 3). Surprisingly, at each pHo the pHi decreased as the growth rate decreased (Fig. 3). When the ATR values for each of the chemostat cultures growing at three different growth rates and four different pHo values were plotted versus the pHi values, a clear correlation between pHi and the level of the ATR was evident (Fig. 4), confirming the observation previously made with batch cultures. At pHi values of ≥6.65, the lower the pHi, whether established by a low pHo or a low dilution rate, the greater the ability of the cells to tolerate exposure to a lethal acid challenge. At pHi values below 6.65, the level of survival after the pHo 4.0 acid challenge was 100% irrespective of the growth rate.
FIG. 3.
pHi values of cells of L. lactis subsp. cremoris NCDO 712 growing in chemostat cultures at pHo values of 5.5 to 7.0 and dilution rates of 0.5 h−1 (cross-hatched bars), 0.33 h−1 (solid bars), and 0.17 h−1 (stippled bars). The data are the means of values from at least three replicate experiments; the standard deviation in each case was less than 10% of the mean.
FIG. 4.
Acid tolerance of L. lactis subsp. cremoris NCDO 712 cells from steady-state chemostat cultures in which the pHi was varied by changing the pHo or the dilution rate. The data are the means of values from at least three replicate experiments; the standard deviation in each case was less than 10% of the mean.
As previously observed for batch cultures (21), the ATR of continuous cultures induced by a sublethal pHo or a reduced growth rate was accompanied by protection against heat (42°C), ethanol (15%), osmotic stress (20% NaCl), and oxidative stress (1.15 mM H2O2) (data not shown). The tolerance response to each type of stress was similar to the response to acid stress; the level of tolerance induced increased as the pHi of the steady-state culture decreased and was characteristic of the actual pHi. This confirms that changes in the pHi have a major impact on the level of proteins which protect cells against a variety of stresses and is in agreement with the findings of Hartke et al. (9), who demonstrated that there is an overlap in the stress proteins induced in Lactococcus lactis subsp. lactis in response to acid stress and other environmental stresses. Comparisons of two-dimensional gels containing whole-cell proteins of acid-adapted and unadapted cells revealed that increased synthesis of at least 33 proteins occurred in cells exposed to lactic acid at pH 5.5 for 30 min. These acid-induced proteins included a subset of nine heat shock proteins, including DnaK and GroEL, four UV light-induced proteins, and one protein that was also induced in response to exposure to H2O2.
ATR of transition chemostat cultures.
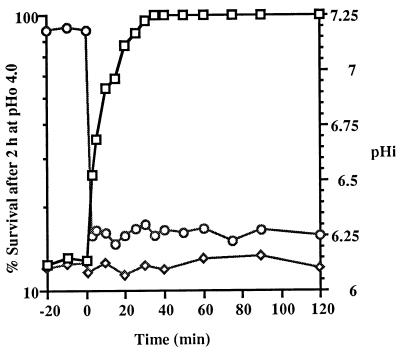
The ATR of chemostat cultures was also studied in cultures in transition from the steady state (following a sudden change in pHo). Alteration of the pHi values of chemostat cultures by direct addition of acid or NaOH resulted in corresponding rapid changes in the ability to survive a lethal acid challenge. A chemostat culture at a constant pHo of 7.0 and a dilution rate of 0.5 h−1 was allowed to stabilize for 10 displacement times. The cells maintained a pHi of 7.19 ± 0.02 and an ATR of 12% survival following the lethal pHo 4.0 challenge (Fig. 5). Acetic acid was added directly to the chemostat growth vessel to reduce the pHo to 5.5. As quickly as could be determined (within 3 min), the pHi dropped to 6.25 ± 0.03. At 3 min after the addition of the acetic acid, the culture was twice as acid tolerant as the chemostat culture at pHo 7.0 (pHi 7.19), and the level of acid tolerance continued to increase until the response was fully induced within 40 min (Fig. 5). The rate at which acid tolerance was acquired was similar to the rate previously observed in a batch culture upon acidification (21). Immediately after the pHo transition it might be expected that the cells would still be in the physiological state of cells with a pHi of 7.2, even though the actual pHi was 6.25. The rapid increase in the ATR seemed to occur almost too quickly to involve protein synthesis. However, when protein synthesis was inhibited by the addition of chloramphenicol to the chemostat 30 min prior to the addition of the acid, no increase in the ATR was observed even though the pHi decreased to 6.24 ± 0.02 (Fig. 5). This confirmed that protein synthesis was needed for the immediate increase in acid tolerance in chemostat cultures. If some other factor besides protein synthesis was involved, then some increase in acid tolerance would be expected, even in the presence of chloramphenicol.
FIG. 5.
Rapid increase in acid tolerance (□) following a sudden decrease in the pHi (○) of a continuous culture of L. lactis subsp. cremoris NCDO 712 due to the addition of acetic acid at zero time to a steady-state culture at a dilution rate of 0.5 h−1. In the presence of chloramphenicol (25 μg/ml) the increase in the ATR (◊) in the transition culture was completely abolished.
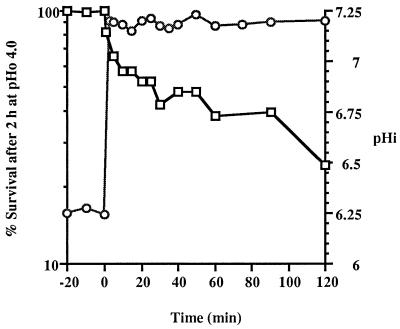
A chemostat culture stabilized at a constant pHo of 5.5 and a dilution rate of 0.5 h−1 maintained a pHi of 6.25 ± 0.03, and the cells were completely resistant to acetic acid at pHo 4.0 for 2 h (Fig. 6). When the pHo of the culture was increased to 7.0 by adding NaOH, the pHi increased to 7.19 ± 0.02 within 3 min (the first sampling point), and the ability of the cells to survive the acid stress decreased from 100 to 80%. The acid tolerance decreased gradually, and about 25% of the cells survived the acid challenge after 2 h (Fig. 6). This suggested that when the pHi was suddenly increased, the L. lactis subsp. cremoris NCDO 712 cells quickly reduced their complement of acid protection proteins. The rate at which the ATR was lost after NaOH was added approximately coincided with the rate at which the culture was diluted (dilution rate, 0.5 h−1) and was much slower than the rate at which acid tolerance was acquired following sudden acidification.
FIG. 6.
Gradual loss of acid tolerance (□) following an increase in the pHi (○) of a continuous culture of L. lactis subsp. cremoris NCDO 712 due to the addition of NaOH at zero time to a steady-state culture at a dilution rate of 0.5 h−1.
In experiments performed with continuous cultures of S. mutans (1), the pHo of a steady-state culture growing at a dilution rate of 0.42 h−1 was reduced gradually from 7.0 to 5.5 by allowing the cells to decrease the pHo by acid production. The cells exhibited a gradual increase in acid tolerance. Acid adaptation was lost more slowly when the pHo of the chemostat was allowed to readjust to 7.0.
Factors contributing to the pHi values of chemostat cultures which may influence the ATR.
Lactococcal cells growing in acidic environmental conditions or growing continuously at rates limited by the availability of an energy source have been reported to possess markedly different physiological and metabolic traits than cells growing in a batch culture at neutral pHo. Increased H+-ATPase activity has been observed for a number of species in response to acidification at sublethal pHo values in batch cultures (12–14) and continuous cultures (1). A decrease in the growth yield per mole of glucose consumed, which implied that there was an increase in the rate of energy consumption not related to growth, has also been observed during growth under acidic conditions (7, 17). When grown in chemostat cultures with limited amounts of glucose or lactose, a number of species exhibited changed glycolytic pathways (4, 25, 26). We decided to try to determine whether metabolic changes could be related to induction of an ATR in L. lactis subsp. cremoris NCDO 712 and to try to gain a better understanding of the physiological response of this bacterium to acidification of its cytoplasm brought about by a low pHo or a slow growth rate in chemostat cultures. The following four metabolic parameters were examined in chemostat cultures grown at several different growth rates and pHo values: changes in acid end products of fermentation; changes in the rates of acidification; changes in the qATP and the cytoplasmic levels of ATP; and changes in H+-ATPase activity.
Changes in acidic end products of fermentation.
In agreement with results obtained by Thomas et al. (25), at any specific controlled pHo the fermentation pathway of L. lactis subsp. cremoris NCDO 712 changed from homolactic fermentation to mixed-acid fermentation as the dilution rate of the chemostat culture decreased (Table 2). At a constant pHo of 7.0 and at the highest dilution rate examined (0.7 h−1) approximately 50% of the glucose was converted to lactic acid. However, as the dilution rate was reduced, the fermentation end products shifted to a mixture of formic acid, acetic acid, lactic acid, and ethanol, end products characteristic of a mixed-acid type of fermentation. At the lowest dilution rate examined (0.17 h−1) only about 10% of the glucose was converted to lactic acid.
TABLE 2.
Changes in the fermentation end products of continuous cultures of L. lactis subsp. cremoris NCDO 712 at different growth rates and pHo values
| Dilution rate (h−1) | pHo | Lactic acid concn (mM) | Formic acid concn (mM) | Acetic acid concn (mM) | Ethanol concn (mM) |
|---|---|---|---|---|---|
| 0.7 | 7.0 | 11.03 ± 1.05a | 11.26 ± 2.06 | 9.67 ± 0.77 | 3.31 ± 0.87 |
| 6.5 | 13.54 ± 1.91 | 8.61 ± 1.69 | 4.81 ± 0.36 | 3.58 ± 1.05 | |
| 6.0 | 22.78 ± 0.84 | 3.06 ± 0.89 | 1.36 ± 0.52 | 3.53 ± 98 | |
| 5.5 | 25.36 ± 3.10 | 0.00 ± 0.14 | 0.92 ± 0.05 | 0.12 ± 0.04 | |
| 0.5 | 7.0 | 3.69 ± 0.97 | 15.35 ± 3.05 | 7.55 ± 1.33 | 7.24 ± 1.16 |
| 6.5 | 5.33 ± 1.35 | 15.65 ± 1.98 | 8.47 ± 1.58 | 7.09 ± 0.88 | |
| 6.0 | 12.86 ± 0.05 | 11.47 ± 1.78 | 5.84 ± 0.02 | 3.37 ± 0.89 | |
| 5.5 | 19.36 ± 2.03 | 3.47 ± 1.93 | 2.78 ± 0.56 | 1.48 ± 0.64 | |
| 0.33 | 7.0 | 2.29 ± 0.05 | 20.42 ± 4.02 | 10.48 ± 2.13 | 10.02 ± 2.01 |
| 6.5 | 5.06 ± 1.26 | 19.40 ± 1.44 | 9.82 ± 1.27 | 6.33 ± 1.22 | |
| 6.0 | 6.35 ± 1.97 | 16.32 ± 1.26 | 8.85 ± 0.79 | 6.44 ± 1.15 | |
| 5.5 | 14.90 ± 2.01 | 7.72 ± 1.13 | 4.43 ± 0.75 | 1.55 ± 0.03 | |
| 0.17 | 7.0 | 1.90 ± 0.08 | 15.73 ± 1.12 | 9.81 ± 1.24 | 7.94 ± 0.15 |
| 6.5 | 2.99 ± 1.05 | 19.65 ± 3.11 | 8.06 ± 3.50 | 7.94 ± 1.26 | |
| 6.0 | 5.79 ± 0.99 | 17.02 ± 1.24 | 7.74 ± 2.86 | 7.37 ± 1.62 | |
| 5.5 | 9.58 ± 1.35 | 7.20 ± 1.15 | 5.24 ± 1.55 | 1.96 ± 1.05 |
Mean ± standard deviation (n = 3).
At each specific growth rate the fermentation became more homofermentative as the pHo became more acidic. For example, at a constant dilution rate of 0.7 h−1 approximately 50% of the fermentation end products was lactic acid at pHo 7.0, whereas at pHo 5.5 the fermentation was almost 100% homolactic (Table 2). Similar results were reported previously for a number of strains of oral streptococci (10, 17). When grown at a constant dilution rate in a glucose-limited chemostat culture, the streptococcal cells produced mainly formate and acetate when the pHo was maintained at 7.0. However, when the pHo of the culture was reduced to 5.5, an increase in the concentration of lactate and a corresponding decrease in formate and acetate production were observed (10).
However, when the overall change from homolactic fermentation to mixed-acid fermentation was compared to the corresponding changes in the pHi values of each culture (Fig. 2A), it was clear that the pHi was not uniquely defined by the spectrum of end products formed during glucose fermentation. Similar fermentation ratios (percentages of homolactic fermentation) were observed at up to four different pHi values, and cultures with similar pHi values produced very different spectra of fermentation end products. Since the level of induction of the ATR in chemostat cultures is correlated with a unique pHi, it is unlikely that changes in the identities of the acids produced during fermentation are intimately involved with induction of the ATR.
Changes in the rate of acidification.
For each 1 mol of glucose fermented, homolactic fermentation yields 2 mol of acid (lactic acid), compared to the 3 mol of acid (2 mol of formic acid and 1 mol of acetic acid) formed in a mixed-acid fermentation. We might expect, therefore, that changes in fermentation pattern accompaning changes in growth rate and pHo would be accompanied by changes in qH+. We calculated qH+ values (ignoring any small changes which could be attributed to changes in rates of H+ dissociation) for the spectrum of acid end products produced in chemostat cultures grown at different pH values and growth rates. The data showed that qH+ was clearly dependent on the growth rate but relatively independent of the pHi (Fig. 2B). As the pHi decreased at a specific growth rate, the rate of glycolysis increased such that the qH+ remained characteristic of the growth rate. It is quite clear from Fig. 2B that a specific pHi is not correlated with a unique rate of acid development, and therefore qH+ is unlikely to be a major factor in induction of the ATR.
Changes in the rate of ATP production.
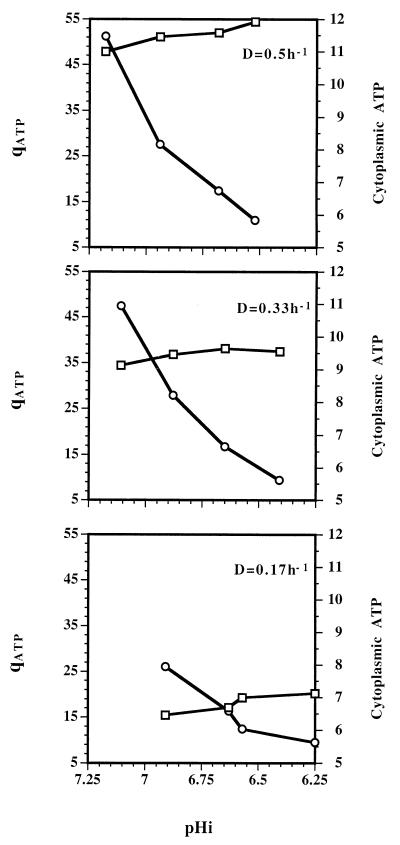
Another important factor involved in establishment of a particular pHi in L. lactis subsp. cremoris NCDO 712 is the rate at which H+ ions are removed from the cells. It has been demonstrated that in E. hirae the main mechanism for H+ extrusion is the F0F1 membrane bound H+-ATPase, which exports protons at the expense of ATP hydrolysis (11). This suggests that there may be a relationship between ATP generation and/or cytoplasmic ATP levels and pHi. We calculated the qATP and measured the cytoplasmic levels of ATP for each of the chemostat cultures grown at different rates and pHo values (Fig. 7). It is clear that qATP was strongly influenced by the growth rates but was only slightly affected by the pHi values of the chemostat cultures. However, the cytoplasmic ATP levels were strongly influenced by the pHi values of the cultures, as well as the growth rates. At each constant growth rate, the cytoplasmic ATP levels of cultures with low pHi values were much less than the cytoplasmic ATP levels of cultures with pHi values closer to neutral, even though the rates of ATP production did not decrease at acid pHi values. Since at any particular growth rate, the pHi was directly affected by the pHo (Fig. 3), the data suggest that a substantial portion of the ATP produced at an acid pHo was used to counteract effects of acidification of the cytoplasm.
FIG. 7.
Relationships among qATP (in millimoles per gram of protein per hour) (□), cytoplasmic ATP pool levels (in micromoles per gram of protein) (○), and pHi values of chemostat cultures of L. lactis subsp. cremoris NCDO 712 growing at dilutions rates (D) of 0.5, 0.33, and 0.17 h−1.
Changes in H+-ATPase activity.
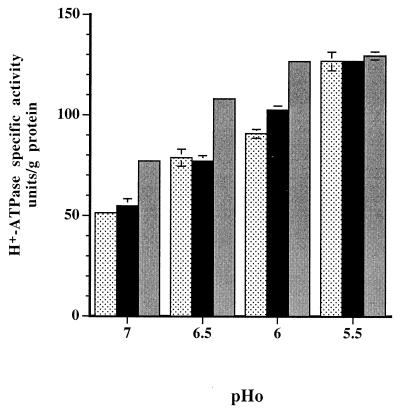
As there was no direct correlation between cytoplasmic levels of ATP and rates of ATP generation, the key factor in regulating cytoplasmic ATP levels was likely to be the level of membrane H+-ATPase activity, which pumps H+ out of cells at the expense of ATP hydrolysis (11). The influence of pH on the rate of the H+-ATPase reaction in permeabilized cells of L. lactis subsp. cremoris NCDO 712 was assessed to determine the optimum pH of the reaction and to calculate the likely impact that the pHi had on the overall enzyme activity. The graph of the reaction rate versus pH was broad bell shaped, and the optimum pH was 6.5 (data not shown). The extremes of the pHi values of chemostat cultures encountered in these experiments were 6.25 and 7.25; at these values the rates of H+-ATPase activity were 95 and 80%, respectively, of the optimum rate. For a number of oral streptococci, such as, S. mutans (1, 8) and Streptococcus rattus (17), and for E. hirae (1) growing continuously at rates limited by glucose availability, it has been observed previously that the levels of H+-ATPase activity increase as the pHo values decrease. For L. lactis subsp. cremoris NCDO 712 the specific activity of the H+-ATPase depended on both the pHo values and the specific growth rates of chemostat cultures (Fig. 8). The maximum enzyme levels (approximately 125 U/g of protein) were observed in cells grown at pHo 5.5 irrespective of the growth rate. The specific activity decreased as the pHo values of the cultures increased from 6.0 to 7.0; in addition, faster-growing cells exhibited less H+-ATPase activity than more slowly growing cells at these pHo values.
FIG. 8.
Changes in the specific activity of ATPase of L. lactis subsp. cremoris NCDO 712 cells grown in steady-state chemostat cultures at growth rates of 0.5 h−1 (stippled bars), 0.33 h−1 (black bars), and 0.17 h−1 (gray bars) at pHo values of 7.0, 6.5, 6.0, and 5.5. The data are the means of values from at least three experiments. The standard deviations are indicated by error bars; in some cases the standard deviation was less than 2.25 U/g of protein and no error bar is shown.
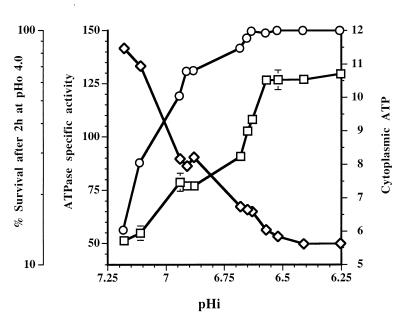
When the H+-ATPase activities and cytoplasmic levels of ATP of the chemostat cultures were plotted versus the relevant pHi values, clear relationships among H+-ATPase activity, cytoplasmic levels of ATP, and pHi values were evident (Fig. 9). Although the relationship was not exactly inverse, the cytoplasmic levels of ATP determined over the pHi range from 7.25 to 6.25 clearly reflected the levels of H+-ATPase activity in the cells. More importantly, each pHi between 6.6 and 7.25 corresponded to a unique level of H+-ATPase activity and a unique intracellular ATP level. At pHi values below 6.6 the level of H+-ATPase activity was at a maximum (125 U/g of protein) and the cytoplasmic ATP level was at a minimum.
FIG. 9.
Relationships between percentage of survival after an acid challenge (pHo 4.0 for 2 h) (○), ATPase specific activity (in units per gram of protein per minute) (□), or cytoplasmic ATP concentration (in micromoles per gram of protein (◊) and pHi values of L. lactis subsp. cremoris NCDO 712 growing in chemostat cultures at dilution rates of 0.5, 0.33, and 0.17 h−1 and at pHo values of 5.5 to 7.0.
In support of these observations obtained with L. lactis subsp. cremoris NCDO 712, the amount of H+-ATPase in E. hirae cells increased as the pHi decreased at values below the range of values at which optimum growth occurred (14). The H+-ATPase levels of a number of lactococcal strains during growth in batch cultures also increased as the pHo decreased (19).
Correlations were established among the ATR data, the cytoplasmic ATP data, and the H+-ATPase data (Fig. 9). All of the cells with a pHi of 6.6 or less which had approximately 125 U of H+-ATPase activity per g of protein and less than 6 μmol of ATP per g of protein survived the acid challenge. From pHi 6.6 to 7.25 the rate of survival decreased approximately in parallel with the decrease in the specific activity of H+-ATPase and the corresponding increase in ATP levels. In previous studies of chemostat cultures of S. mutans (1), cells grown at acid pHo values had increased levels of H+-ATPase activity and enhanced resistance to acid killing compared to cells grown at pH 7.0.
The significance of the correlation among pHi, H+-ATPase activity, and acid tolerance was confirmed with a batch culture of L. lactis subsp. cremoris NCDO 712. When the culture was growing exponentially at a constant pHo of 7.0, the H+-ATPase specific activity was 43.2 ± 3.2 U/g of protein. A sample of this culture was induced for an ATR by acidifying it to pH 5.0 with acetic acid. After 1 h the specific activity had increased to 124 ± 2.2 U/g of protein. When the culture was subjected to the a lethal acid challenge consisting of acetic acid at pH 4.0, 100% of the induced cells survived, whereas less than 1% of the uninduced cells survived a 2-h challenge.
H+-ATPase is part of the ATR in L. lactis subsp. cremoris NCDO 712 in that it is a protein whose synthesis increases in response to a decrease in pHi both in batch cultures and in chemostat cultures. The data in this paper indicate that when the pHi was changed by changing the pHo or the growth rate, the level of H+-ATPase changed accordingly, presumably such that the ability of the cells to export protons was balanced with the need to support the growth rate. Other aspects of energy metabolism changed in response to changes in the pHo and growth rate, but none of them was correlated with induction of an ATR. Based on our data, we do not suggest that proteins such as chaperonins are not a significant part of the ATR, but we identified H+-ATPase as an ATR protein that probably plays a role in the ability of lactococcal cells to survive an acid challenge.
ACKNOWLEDGMENTS
This work was funded in part by Forbairt (The Irish Science and Technology Agency).
We acknowledge the excellent technical assistance of Dan Walsh, and we thank Ian Booth, University of Aberdeen, for his assistance and advice concerning pHi measurement.
REFERENCES
- 1.Belli W A, Marquis R E. Adaptation of Streptococcus mutans and Enterococcus hirae to acid stress in continuous culture. Appl Environ Microbiol. 1991;57:1134–138. doi: 10.1128/aem.57.4.1134-1138.1991. [DOI] [PMC free article] [PubMed] [Google Scholar]
- 2.Chan K H, Delfert D, Junger K D. A direct colorimetric assay for Ca2+ stimulated ATPase activity. Anal Biochem. 1986;157:375–380. doi: 10.1016/0003-2697(86)90640-8. [DOI] [PubMed] [Google Scholar]
- 3.Davies F L, Underwood H M, Gasson M J. The value of plasmid profiles for strain identification in lactic streptococci and the relationship between Streptococcus lactis 712, ML3, and C2. J Appl Bacteriol. 1981;51:325–337. [Google Scholar]
- 4.de Vires W, Kapteyn W M C, van der Beek E G, Stouthamer A H. Molar growth yields and fermentation balances of Lactobacillus casei L3 in batch culture and in continous cultures. J Gen Microbiol. 1970;63:333–345. doi: 10.1099/00221287-63-3-333. [DOI] [PubMed] [Google Scholar]
- 5.Godon J J, Delorme C, Ehrlich S D, Renault P. Divergence of genomic sequences between Lactococcus lactis subsp. lactis and Lactococcus lactis subsp. cremoris. Appl Environ Microbiol. 1992;58:4045–4047. doi: 10.1128/aem.58.12.4045-4047.1992. [DOI] [PMC free article] [PubMed] [Google Scholar]
- 6.Goodson M, Rowbury R J. Habituation to normally lethal acidity by prior growth of Escherichia coli at a sublethal acid pH. Lett Appl Microbiol. 1989;8:77–79. [Google Scholar]
- 7.Hamilton I R. Growth metabolism and acid production by Streptococcus mutans. In: Hamada S, Michalek S M, Kiyons H, Menaker L, McGhee J R, editors. Molecular microbiology and immunology of Streptococcus mutans. Amsterdam, The Netherlands: Elsevier Science Publishers; 1986. pp. 145–155. [Google Scholar]
- 8.Hamilton I R. Adaptation by Streptococcus mutans to acid tolerance. Oral Microbiol Immunol. 1991;6:65–71. doi: 10.1111/j.1399-302x.1991.tb00453.x. [DOI] [PubMed] [Google Scholar]
- 9.Hartke A, Bouché S, Giard J-C, Benachour A, Boutibonnes P, Auffray Y. The lactic acid stress response of Lactococcus lactis subsp. lactis. Curr Microbiol. 1996;33:194–199. doi: 10.1007/s002849900099. [DOI] [PubMed] [Google Scholar]
- 10.Iwami Y, Abbé K, Takahashi-Abbé S, Yamada T. Acid production by streptococci growing at low pH in a chemostat under anaerobic conditions. Oral Microbiol Immunol. 1992;7:304–308. doi: 10.1111/j.1399-302x.1992.tb00593.x. [DOI] [PubMed] [Google Scholar]
- 11.Kobayashi H. Regulation of cytoplasmic pH in streptococci. In: Reizer J, Peterkofsky A, editors. Sugar transport and metabolism in Gram-positive bacteria. London, United Kingdom: Ellis Harwood; 1987. pp. 255–269. [Google Scholar]
- 12.Kobayashi H, Murakami N, Unemoto T. Regulation of cytoplasmic pH in Streptococcus faecalis. J Biol Chem. 1982;257:13246–13252. [PubMed] [Google Scholar]
- 13.Kobayashi H, Suzuki T, Unemoto T. Streptococcal cytoplasmic pH is regulated by changes in the amount and activity of a proton-translocating ATPase. J Biol Chem. 1986;261:627–630. [PubMed] [Google Scholar]
- 14.Kobayashi H, Suzuki T, Kinoshita N, Unemoto T. Amplification of the Streptococcus faecalis proton translocating ATPase by a decrease in cytoplasmic pH. J Bacteriol. 1984;158:1157–1160. doi: 10.1128/jb.158.3.1157-1160.1984. [DOI] [PMC free article] [PubMed] [Google Scholar]
- 15.Kroll R G, Booth I R. The role of potassium transport in the generation of a pH gradient in Escherichia coli. Biochem J. 1981;198:691–698. doi: 10.1042/bj1980691. [DOI] [PMC free article] [PubMed] [Google Scholar]
- 16.Leyer G J, Wang L L, Johnson E A. Acid adaptation of Escherichia coli O157:H7 increases survival in acidic foods. Appl Environ Microbiol. 1995;61:3752–3755. doi: 10.1128/aem.61.10.3752-3755.1995. [DOI] [PMC free article] [PubMed] [Google Scholar]
- 17.Miyagi A, Ohta H, Kodama T, Fukui K, Kato K, Shimono T. Metabolic and energetic aspects of the growth response of Streptococcus rattus to environmental acidification in anaerobic continuous culture. Microbiology. 1994;140:1945–1952. doi: 10.1099/13500872-140-8-1945. [DOI] [PubMed] [Google Scholar]
- 18.Nannen N L, Hutkins R W. Intracellular pH effects in lactic acid bacteria. J Dairy Sci. 1991;74:741–746. [Google Scholar]
- 19.Nannen N L, Hutkins R W. Proton translocating adenosine triphosphatase activity in lactic acid bacteria. J Dairy Sci. 1991;74:747–751. [Google Scholar]
- 20.O’Driscoll B, Gahan C G M, Hill C. Adaptive acid tolerance in Listeria monocytogenes: isolation of an acid-tolerant mutant which demonstrates increased virulence. Appl Environ Microbiol. 1996;62:1693–1698. doi: 10.1128/aem.62.5.1693-1698.1996. [DOI] [PMC free article] [PubMed] [Google Scholar]
- 21.O’Sullivan E, Condon S. Intracellular pH is a major factor in the induction of tolerance to acid and other stresses in Lactococcus lactis. Appl Environ Microbiol. 1997;63:4210–4215. doi: 10.1128/aem.63.11.4210-4215.1997. [DOI] [PMC free article] [PubMed] [Google Scholar]
- 22.Poolman B, Hellingwerf K J, Konings W N. Regulation of the glutamate-glutamine transport system by intracellular pH in Streptococcus lactis. J Bacteriol. 1987;169:2272–2276. doi: 10.1128/jb.169.5.2272-2276.1987. [DOI] [PMC free article] [PubMed] [Google Scholar]
- 23.Rallu F, Gruss A, Maguin E. Lactococcus lactis and stress. Antonie Leeuwenhoek. 1996;70:243–251. doi: 10.1007/BF00395935. [DOI] [PubMed] [Google Scholar]
- 24.Salmond C V, Kroll R G, Booth I R. The effect of food preservatives on pH homeostasis in Escherichia coli. J Gen Microbiol. 1984;130:2845–2850. doi: 10.1099/00221287-130-11-2845. [DOI] [PubMed] [Google Scholar]
- 25.Thomas T D, Ellwood D C, Longyear M V C. Change from homo- to heterofermentation by Streptococcus lactis resulting from glucose limitation in anaerobic chemostat cultures. J Bacteriol. 1979;138:106–117. doi: 10.1128/jb.138.1.109-117.1979. [DOI] [PMC free article] [PubMed] [Google Scholar]
- 26.Yamada T, Carlsson J. Regulation of lactate dehydrogenase and change in fermentation products in streptococci. J Bacteriol. 1975;124:55–61. doi: 10.1128/jb.124.1.55-61.1975. [DOI] [PMC free article] [PubMed] [Google Scholar]


