Abstract
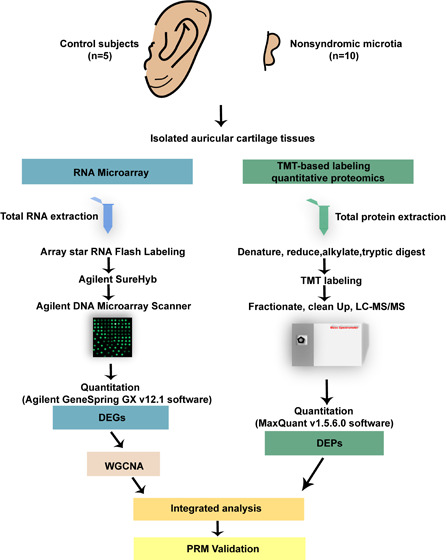
As one of the common birth defects worldwide, nonsyndromic microtia is a complex disease that results from interactions between environmental and genetic factors. However, the underlying causes of nonsyndromic microtia are currently not well understood. The present study determined transcriptomic and proteomic profiles of auricular cartilage tissues in 10 patients with third-degree nonsyndromic microtia and five control subjects by RNA microarray and tandem mass tag-based quantitative proteomics technology. Relative mRNA and protein abundances were compared and evaluated for their function and putative involvement in nonsyndromic microtia. A total of 3971 differentially expressed genes and 256 differentially expressed proteins were identified. Bioinformatics analysis demonstrated that some of these genes and proteins showed potential associations with nonsyndromic microtia. Thirteen proteins with the same trend at the mRNA level obtained by the integrated analysis were validated by parallel reaction monitoring analysis. Several key genes, namely, LAMB2, COMP, APOA2, APOC2, APOC3, and A2M, were found to be dysregulated, which could contribute to nonsyndromic microtia. The present study is the first report on the transcriptomic and proteomic integrated analysis of nonsyndromic microtia using the same auricular cartilage sample. Additional studies are required to clarify the roles of potential key genes in nonsyndromic microtia.
1. Introduction
Microtia is a common congenital maxillofacial anomaly, second only to cleft lip and palate, with a global incidence of 0.84–17.4/10,000 births.1 It presents with external and middle ear deformity caused by abnormal development of the first and second branchial arch; the deformity can be classified into four degrees according to the severity, ranging from slight structural abnormality to complete absence of the ear.1,2 Microtia not only affects appearance and hearing function but also leads to a series of psychological problems and economic burden. Although auricular reconstruction with autogenous rib cartilage, meatoplasty, or implantation of bone conduction hearing aids can improve the appearance and hearing function, there are individual differences in curative efficacy, and surgical complications such as infection, skin necrosis, cartilage exposure and resorption, delayed wound healing, and keloid are inevitable.3 Depending on whether there are other organ abnormalities, microtia can be classified into nonsyndromic and syndromic types, among which the nonsyndromic type accounts for 73% of the cases.4 Most microtia-related syndromes are monogenic diseases with definite pathogenic genes, while nonsyndromic microtia (NSM) is a complex disease resulting from interactions between environmental and genetic factors.5 At present, the cause and pathogenesis of NSM remain unknown, but it is widely recognized that genetics plays a key role in this disease process.6 Although some sequence variants in susceptibility genes, such as HOXA1, HOXA2, BMP5, GSC, and TBX1, have been suggested to be involved in NSM,6−13 they are inadequate to explain all of the cases. The precise control of gene expression is of vital importance in embryonic development. However, limited studies have been conducted on the relationship between abnormal gene expression patterns and NSM. The current study characterized the transcriptomic and proteomic profiles of auricular cartilage tissues from patients with NSM and explored its potential pathogenesis.
2. Results
2.1. Identification and Analysis of Differentially Expressed Genes in NSM by Microarray
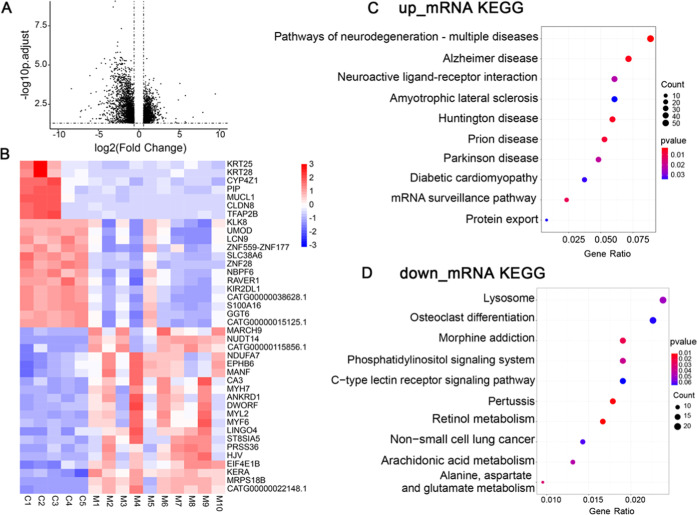
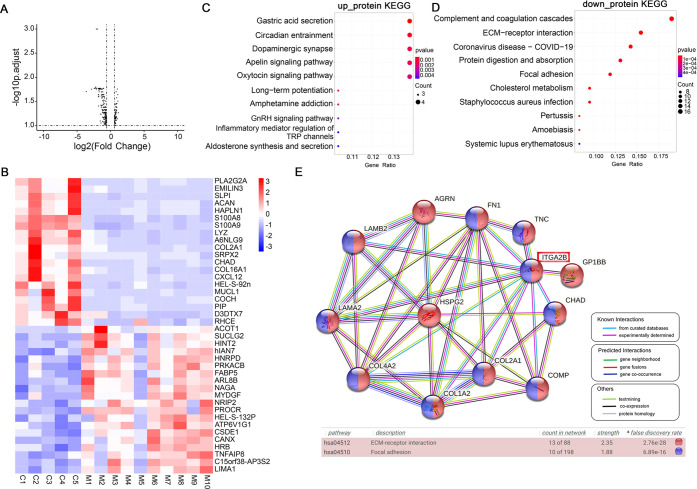
We detected a total of 18,692 mRNAs from the auricular cartilage tissues. By comparison with control subjects (CS), 3971 differentially expressed genes (DEGs) (including 1776 upregulated and 2195 downregulated DEGs) were identified in NSM, as shown in the volcano plot (Figure 1A; Table S1). The top 20 upregulated and top 20 downregulated DEGs based on fold-change (FC) are displayed in the heatmap (Figure 1B) to show the differential genes that can differentiate NSM from CS.
Figure 1.
Identification and analysis of DEGs in NSM by microarray. A. Volcano plot of transcriptomics. The right dots show 1776 significantly upregulated genes, and the left dots show 2195 significantly downregulated genes; FC > 1.5, false discovery rate (FDR) < 0.05. B. Heatmap showing the top 20 upregulated and top 20 downregulated DEGs based on the expression of genes (red, upregulated; blue, downregulated). (C, D) KEGG analysis of the upregulated and downregulated DEGs. The dot size represents gene count, and the color represents the P-value. P < 0.05 is considered to be statistically significant.
Kyoto encyclopedia of genes and genomes (KEGG) analysis was performed to investigate the potential role of DEGs in NSM. The results showed that upregulated DEGs were involved in neuroactive ligand–receptor interaction, mRNA surveillance pathway, and protein export pathway (Figure 1C), while the downregulated DEGs were enriched in the lysosome, osteoclast differentiation, and phosphatidylinositol signaling system (Figure 1D).
2.2. Key Gene Module Associated with NSM
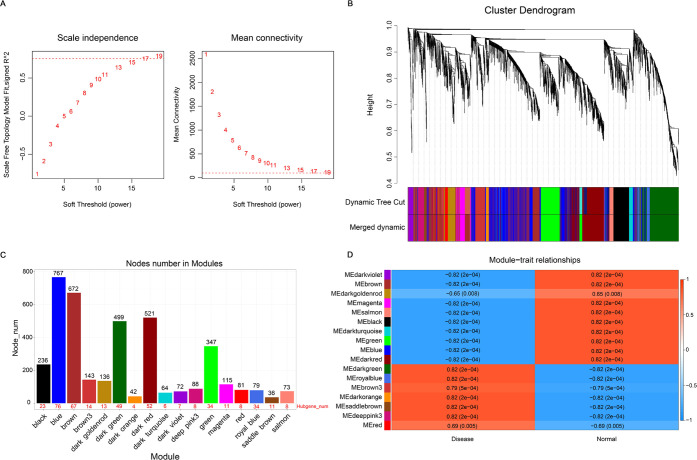
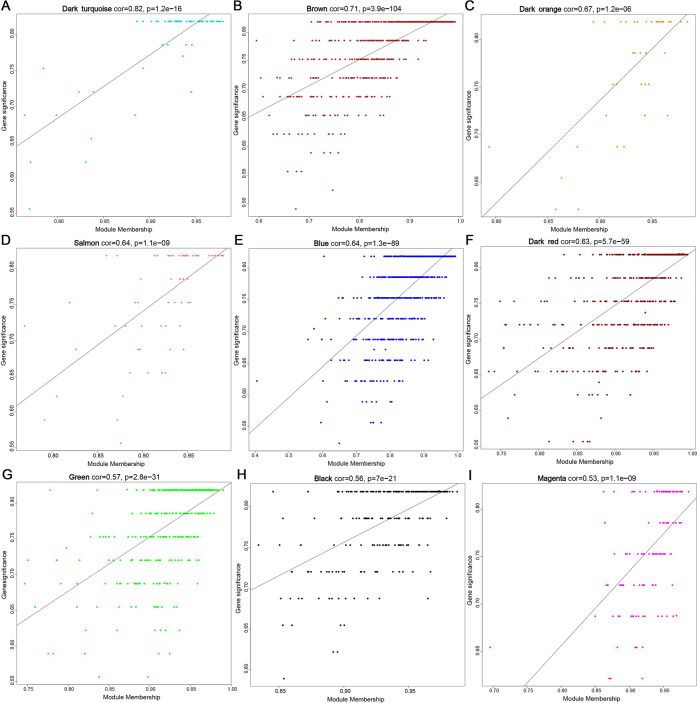
To find the key gene modules that are most relevant to NSM, we carried out weighted correlation network analysis (WGCNA) on DEGs and identified 17 modules (Figure 2A–C). According to the module–trait relationships, we identified that five modules (dark green, royal blue, dark orange, saddle brown, deeppink3) were highly negatively correlated with NSM, while nine modules (dark violet, brown, magenta, salmon, black, dark turquoise, green, blue, dark red) showed a significant positive correlation with NSM (Figure 2D). Correlations between module membership (MM) and NSM were plotted for all of the modules, and nine modules were regarded as the most associated with NSM based on P < 0.05 and correlation coefficient (CC) > 0.5 (Figure 3). Among the nine key modules, the dark turquoise module showed the most significant correlation between MM and gene significance (GS) (CC = 0.82, P = 1.2 × 10⁻¹⁶).
Figure 2.
Determination of hub gene modules associated with NSM through WGCNA. (A) Identification of soft-threshold power by analyzing the scale-free index (left) and the mean connectivity (right) in the WGCNA. (B) Dendrogram of all DEGs clustered based on a dissimilarity measure (1-TOM). Clustering DEGs are shown in colors. (C) Numbers of hub genes in each module. (D) Heatmap showing the correlation between ME and NSM. The CC and P-values of each module in NSM and CS are presented in the center of the panels. Positive and negative associations are separately shown in red and blue, respectively.
Figure 3.
Scatter plots of the GS vs MM for the modules. (A) Dark turquoise module (CC = 0.82, P = 1.2 × 10⁻¹⁶). (B) Brown module (CC = 0.71, P = 3.9 × 10–104). (C) Dark orange module (CC = 0.67, P = 1.2 × 10–06). (D) Salmon module (CC = 0.64, P = 1.1 × 10–09). (E) Blue module (CC = 0.64, P = 1.3 × 10–89). (F) Dark red module (CC = 0.63, P = 5.7 × 10–59). (G) Green module (CC = 0.57, P = 2.8 × 10⁻³¹). (H) Black module (CC = 0.56, P = 7 × 10–21). (I) Magenta module (CC = 0.53, P = 1.1 × 10–09).
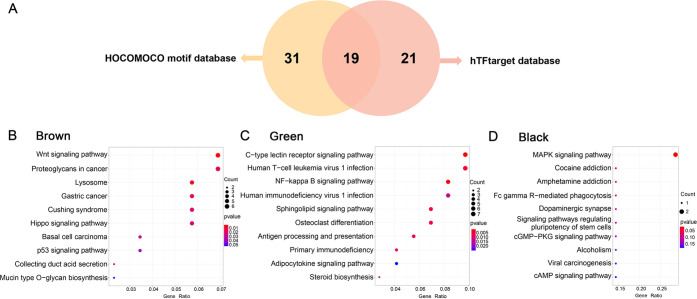
Among 71 transcription factors (TFs) in the nine key modules, 19 TFs were present in both databases (Figure 4A). Their predicted target genes were present in the same module with the 19 corresponding TFs, respectively (Table S2). KEGG analysis of the 19 TFs and their target genes in the nine key modules showed that genes in the brown module were primarily involved in Wnt and Hippo signaling pathways; genes in the green module were associated with osteoclast differentiation, C-type lectin receptor, and NF-kappa B signaling pathways; and genes in the black module were markedly enriched in MAPK signaling pathway (Figure 4B–D; Table S3). Genes in the dark turquoise, blue, and dark red modules are enriched in the pathways associated with infection and cancer (Figure S1, Table S3). In addition, the number of genes in the magenta, dark orange, and salmon modules was too small to analyze (Table S2). The enriched pathways in the brown module were most closely related to NSM.14,15 Thus, the genes in the brown module may be of critical importance in NSM.
Figure 4.
Identification of the gene modules highly correlated with NSM. (A) Venn diagram shows that a total of 71 TFs are predicted to have target genes in the same module, of which 19 are predicted by the two databases. (B–D) KEGG analysis for TFs and their target genes in the brown, green, and black modules. The dot size represents gene count, and the color represents the P-value. P < 0.05 is considered to be statistically significant.
2.3. Identification and Analysis of Differentially Expressed Proteins in NSM by Tandem Mass Tag (TMT)-Based Quantitative Proteomics
We detected 3976 proteins in the samples, of which 3516 were successfully quantified. By comparison with CS, 256 differentially expressed proteins (DEPs) (70 upregulated and 186 downregulated DEPs) were identified in NSM, as shown in the volcano plot (Figure 5A; Table S4). The top 20 upregulated and top 20 downregulated DEPs based on FC are exhibited in the heatmap (Figure 5B) to show that the differential proteins can distinguish NSM from CS.
Figure 5.
Analysis of DEPs by proteomics. (A) Volcano plot of proteomics. The right dots show 94 significantly upregulated proteins, while the left dots show 210 significantly downregulated proteins. FC > 1.5, P < 0.05. B. Heatmap of the top 20 upregulated and top 20 downregulated DEPs based on the expression of proteins (red, upregulated; blue, downregulated). (C, D) KEGG pathway analysis of the upregulated and downregulated DEPs. The size of dots represents gene count, and the color represents the P-value. P < 0.05 is thought to be statistically significant. (E) Protein–protein interactions (PPI) network composes of downregulated DEPs in extracellular matrix (ECM)–receptor interaction and focal adhesion pathways. Different colored nodes indicate the proteins in the two pathways, and the line color represents the type of interaction evidence.
To evaluate the potential function of DEPs in NSM, we carried out KEGG analysis and found that the upregulated DEPs were mainly associated with some hormone-related pathways, such as circadian entrainment, dopaminergic synapse, GnRH, and oxytocin signaling pathways (Figure 5C), while the downregulated DEPs were enriched in the ECM–receptor interaction and focal adhesion pathways (Figure 5D), which were reported to be involved in microtia.16−19 The protein–protein interaction (PPI) network was then constructed by the downregulated DEPs in the two pathways, and the results showed that ITGA2B could be the most significant hub protein according to the number of interacting proteins (Figure 5E).
2.4. Combined Analysis of Transcriptomics and Proteomics in NSM
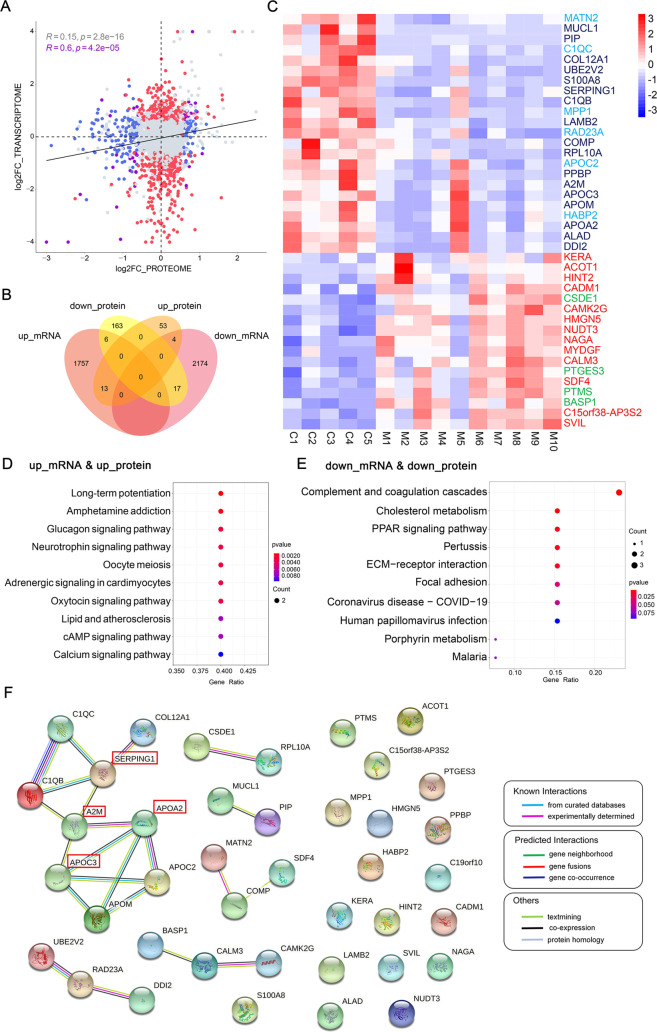
A total of 2773 mRNAs/proteins could be matched as the intersection between both all transcriptomics and proteomics, and correlations were calculated for products of individual genes (Figure 6A). The correlation between protein and mRNA levels of 2773 genes was low (R = 0.15), in line with the general observation that mRNA levels are insufficient to predict protein levels (Figure 6A). However, the correlation was higher (R = 0.6) when 40 genes with significantly differential expression at both transcriptional and protein levels were reanalyzed, indicating they may be more crucial to the pathogenesis of microtia (Figure 6A). The 40 genes were shown by the Venn diagram and heatmap (Figure 6B,C). KEGG analysis showed that the 13 genes upregulated at both levels were primarily involved in the cAMP, calcium, and some hormone-related signaling pathways (Figure 6D), and the 17 genes downregulated at both levels were markedly enriched in the ECM–receptor interaction, focal adhesion, cholesterol metabolism, and peroxisome proliferator-activated receptors (PPAR) signaling pathways (Figure 6E). In addition, the number of genes expressed inconsistently at both levels was too small to perform the KEGG analysis. The PPI network was then plotted based on the 40 genes.16−19 APOA2, APOC3, A2M, and SERPING1 were identified as the potential key protein in this network according to the number of interacting proteins (Figure 6F).
Figure 6.
Combined analysis of transcriptomics and proteomics. (A) Scatter plot of the correlation relationships between mRNA and protein levels of all of the genes overlapped in transcriptomics and proteomics. The genes with significant differential expression at protein levels (FC > 1.5, FDR < 0.1) but with no significant change at mRNA level are indicated in blue. The genes that are only significantly regulated (FC > 1.5, FDR < 0.05) in the transcriptomics are depicted in red. The genes with or without significant changes at both levels are presented in purple or gray color. The R-value shows the correlation between the mRNA and protein levels of genes, and the R-value for all genes overlapped in transcriptomics and proteomics is 0.15 (P = 2.8 × 10⁻¹⁶), while the R-value for the genes marked by purple is 0.6 (P = 4.2 × 10–05). (B) Venn diagram showing 40 overlapping genes with significantly differential expression at both mRNA and protein levels in NSM. (C) Heatmap showing the 40 genes (red in the square, upregulated; blue in the square, downregulated; font color: navy blue, genes downregulated at both levels; sky blue, genes upregulated at the mRNA level but downregulated at the protein level; red, genes upregulated at both levels; green, genes downregulated at the mRNA level but upregulated at the protein level). The expression value of each gene corresponds to the proteomic data. (D, E) KEGG pathway analysis of the 30 genes with the same trends at mRNA and protein levels. The size of dots represents gene count, and the color represents the P-value. P < 0.05 is considered statistically significant. (F) PPI network composes of the 40 genes with significantly differential expression at both levels in NSM. The color of lines represents the type of interaction evidence.
2.5. Parallel Reaction Monitoring (PRM) Validation
Parallel reaction monitoring (PRM) proteomics was conducted on the 30 DEPs with the same trend of differential expression at the mRNA level in NSM obtained by integrated analysis, and the validation results of 13 DEPs (12 downregulated and 1 upregulated) were similar to the previous TMT-based proteomics results (Figure 7).
Figure 7.
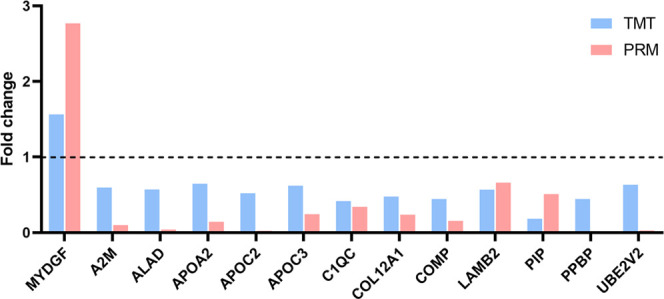
PRM verification. One upregulated DEPs (FC > 1.5) and 12 downregulated DEPs (FC < 0.67) are consistent with the TMT-based proteomics results.
3. Discussion
NSM is due to abnormal development of auricular cartilage. During auricular chondrogenesis, chondrocytes, derived from neural crest cells and mesenchymal stem cells (MSCs), undergo a multistep process characterized by continuous changes in cell morphology and gene expression.17 Cell proliferation, apoptosis, and differentiation are affected by chemical and mechanical signals between the ECM and chondrocytes.17 Any disturbance in chondrocytes and ECM may lead to abnormal cartilage development.
According to the enrichment analysis of the genes with the same trends at both mRNA and protein levels, several pathways may be related to microtia pathogenesis. Two of the pathways associated with the downregulated genes were ECM–receptor interaction and focal adhesion, which was consistent with Dong et al.’s study.20 The interaction of the ECM with tissue-resident multipotent MSCs contributes importantly to the maintenance, proliferation, and differentiation of MSCs.21 Focal adhesion connects the ECM with the actin cytoskeleton by interacting with the receptor–integrin of the ECM and the internal integrin–adaptor protein, which can recruit focal adhesion kinase and coordinate downstream signaling events to influence the differentiation of MSCs.22 These two pathways have been reported to be associated with cartilage destruction.18 Additionally, cholesterol metabolism and PPAR signaling pathway were also enriched among the downregulated genes, and the PPAR signaling pathway has a major regulatory effect on lipid metabolism and energy homeostasis.23,24 Lipid equilibration is crucial for the development of cartilage,25,26 and its dysregulation is involved in microtia.24 Then, the significantly upregulated genes enriched in the cAMP and calcium signaling pathways. The cAMP signaling pathway plays a prominent role in MSC fate decision.27 Chondrocytes are responsible for the homeostasis of the ECM through communication, which can be mediated by the calcium ions,28,29 and calcium ions take part in the regulation of chondrogenesis.30 However, the specific mechanism of these pathways in cartilage dysplasia of NSM is still unclear and needs further research.
In the present study, to investigate the potential role of abnormal gene expression patterns in NSM, we performed transcriptomics and proteomics analysis on the same auricular cartilage samples from patients with NSM for the first time. Among the 3971 identified DEGs (FDR < 0.05; FC > 1.5) and 256 DEPs (FDR < 0.1; FC > 1.5) in NSM patients, there were 40 genes were differentially expressed at both mRNA and protein levels. Through in-depth bioinformatics analysis and PRM validation, the abnormal expression of several genes was suggested to be involved in NSM. Dong et al. also performed the combined detection of changes in gene expression in NSM at both levels, and identified 7610 DEGs (P < 0.05; FC > 2) and 254 DEPs (P < 0.05; FC > 1.5).20 There were 47 genes differentially expressed at both levels. However, different samples were used for transcriptomics and proteomics analysis in their study. Moreover, compared with TMT-based quantitative proteomics in our study, data-independent acquisition detection used in their study is not suitable for a small sample size and has lower sensitivity. Then, compared with the FDR value in our study, the P-value used to assess the significance of differences in their study increases the false-positive rate. Finally, the differential expression of the selected gene was not further verified by other methods in their study.
We identified only 30 genes with the same change trend at both mRNA and protein levels in NSM. The reason for the different enrichment patterns of mRNA and protein may be multifactorial, such as post-transcriptional or post-translational regulation or different turnover rates at mRNA and protein levels. It may also be due to the limitations of the MS technique, particularly for low-expression proteins.31−34
Among the 30 genes, the dysregulation of 13 genes at the protein level in NSM was validated by PRM. LAMB2 encoded the ECM glycoproteins and mediates the attachment and migration of chondrocytes for cartilage formation by interacting with other ECM components during embryonic development.35 COMP, a noncollagenous ECM protein, expresses primarily in cartilage and participates in mesenchymal chondrogenesis by promoting the organization and assembly of the ECM.36 Mutations of COMP have also been identified in pseudoachondroplasia and craniofacial malformation.37,38 In the PPI network of integrated analysis, APOA2, APOC2, APOC3, and A2M have direct or indirect interactions. As the cholesterol metabolism pathway members, dysregulation of APOA2, APOC2, and APOC3 may contribute to cartilage dysplasia.39APOA2 is also a hub gene in the brown module closely associated with NSM in WGCNA. A2M has a chondroprotective effect40 and can inhibit the degradation of COMP.41 These findings suggest that the dysregulation of these genes may be involved in the occurrence and development of NSM.
4. Conclusions
This study provides the first report of transcriptomics and proteomics integrated analysis in NSM subjects using the same auricular cartilage tissues. We also identified that the dysregulation of several key genes could contribute to the occurrence and development of NSM, and further investigation is required to clarify the association of these genes with NSM.
5. Materials and Methods
5.1. Patients and Sample Collection
Our study was reviewed and approved by the Institutional Research Ethics Committee of Eye & ENT Hospital of Fudan University (2020069). The auricular cartilage samples were obtained from surgically dissected tissues of 10 patients with third-degree NSM and five CS. Third-degree NSM is the most common indication for surgery. The samples of CS were obtained from patients with acquired external auditory canal stenosis (one patient), cholesteatoma of the middle ear (two patients), or tympanitis (two patients). All of them had no additional physical abnormalities. Specific details of all samples are provided in Table S5.
5.2. RNA Isolation and Microarray Hybridization
The isolated cartilage tissues were rapidly immersed in TRIzol reagent (Invitrogen). RNA was extracted by adding chloroform and then precipitated with isopropyl alcohol. The RNA precipitates were washed twice with 70% ethanol, dried, and resolved in water without RNase. RNA quantity and quality were detected by a NanoDrop ND-1000 spectroscope (Thermo Fisher Scientific). Sample labeling and array hybridization were carried out following the Agilent One-color Microarray-Based Gene Expression Analysis protocol with a slight adjustment. An Agilent DNA Microarray Scanner (Agilent) was used to wash, fix, and scan the hybridized arrays.
5.3. Transcriptomics Data Analysis
The acquired array images were analyzed using Agilent Feature Extraction software (version 11.0.1.1). Quantile normalization and subsequent data processing were conducted using the GeneSpring GX software package (version 12.1) (Agilent). Biological variability between NSM and CS was assessed by conducting principal component analysis (PCA) on the pre- and postnormalization data using the R package (version 3.6.1). Box plots using the ggplot2 package in R (version 3.6.1) indicated relatively uniform standardized data distribution (Figure S2A–D). After standardization of the raw data, mRNAs of at least 5 out of 15 samples with current or edge markers were selected for further data analysis. P-values for assessing differences in transcriptional levels were calculated using unpaired t-test and then adjusted with the Benjamini–Hochberg FDR method. Differentially abundant mRNAs were then further filtered to identify DEGs by FC > 1.5 and FDR < 0.05. The volcano plot and heatmap of DEGs were constructed using GraphPad Prism (version 8.0.1) and R/pheatmap package (version 1.0.12).
5.4. Identification of Modules by WGCNA
We extracted all DEGs from the transcriptomics data to perform WGCNA using the R package (version 3.6.1).42 DEGs with similar expression patterns were selected according to the soft-threshold power. The topological overlap matrix (TOM) was used to decrease false correlation and calculate the association degree between the genes. Then, the genes were divided into various modules according to the TOM-based dissimilarity measurements. Module eigengene (ME) represented the gene expression profile of each module. The correlation between ME and clinical phenotype was calculated by Pearson’s product–moment correlation to assess the relationship between each module and clinical phenotype. MM represented the correlation between ME and all of the gene expression profiles. GS represented the association between gene expression and clinical phenotype. The association between a module and clinical phenotype was denoted by the correlation between GS and MM of the module, calculated by the linear model in the limma R package (version 3.6.1). The hub genes of each module were identified by the criteria of MM > 0.8 and GS > 0.3. The TFs were extracted from the hub genes of modules, and their target genes were predicted by the HOCOMOCO motif (https://hocomoco11.autosome.org/) and hTFtarget databases (http://bioinfo.life.hust.edu.cn/hTFtarget/#!/). The most relevant module was identified according to the association of TFs and their target genes with NSM.
5.5. Protein Identification by TMT-Based Labeling Quantitative Proteomics
Proteins extracted with RIPA (Beyotime, China) were quantitatively analyzed by a bicinchoninic acid assay. An equal amount of protein from each sample was digested by trypsin (Promega) and labeled by 6-plex TMT reagents following the manufacturer’s protocol (Thermo Fisher Scientific). TMT-labeled peptide mixtures were homogeneously mixed, dissociated by off-line high-pH reversed-phase chromatography, and then subjected to liquid chromatography–mass spectrometry (LC-MS) analysis with the EASY-nLC 1200 nano-flow LC system (Thermo Fisher Scientific).
5.6. Proteomics Data Analysis
The raw proteomics data were processed with MaxQuant (version 1.5.6.0). The MS data were analyzed using the UNIPROT website (version 2018.10). The value of peptide confidence was set to 0.01. The 75% precursor intensity fraction was considered the best trade-off value for identification and quantification at the protein level. A “pseudocount”, indicating relative protein abundance, was calculated using the TMT ratio and the standardized spectral abundance factor. The maximum FDR was set to 1% for peptide and protein identification. The raw quantitative values were standardized using the median normalization method. Biological variability between NSM and CS was assessed by PCA on the data before and after normalization using the R package (version 3.6.1). Box plots plotted using the ggplot2 package in R (version 3.6.1) showed a relatively uniform distribution of the standardized data (Figure S2E–H). P-values for assessing differences in protein expression levels were calculated using the SAM function in the R-language siggenes package (version 3.6.1) and then adjusted with the Benjamini–Hochberg FDR method. Differentially abundant proteins (P < 0.05) were further filtered for the identification of DEPs by FC > 1.5 and FDR < 0.1. Volcano plot and heatmap of DEPs were constructed using the GraphPad Prism software (version 8.0.1) and R/pheatmap package (version 1.0.12).
5.7. Correlation Analysis
The correlation between transcriptomics and proteomics data of genes was assessed by calculating CC using the ggpubr package and visualizing using the ggplot2 packages in R (version 3.6.1).
5.8. KEGG and PPI Network Analysis
KEGG analysis was performed for DEGs and DEPs in NSM using the ClusterProfiler package43 (version 3.12.0), and the filters of P-value were set as 0.05.
PPI network analysis was performed using the online database STRING44 (version 11.5) with the confidence of parameter (interaction score > 0.400) to explore the interactions among the DEPs in NSM.
5.9. Verification of DEPs by PRM-Based Quantitation
PRM proteomics is currently the most popular technology for verifying the quantified proteins through unique peptides.45 To verify the abundance of proteins with the same trend at the mRNA level in NSM obtained by integrated analysis, PRM-MS analysis was performed through LC-MS/MS with Q Exactive Plus (Thermo Fisher Scientific) coupled online to the ultrahigh-performance LC in the same samples used in TMT-based labeling quantitative proteomics. The results were analyzed with Skyline software (version 3.5), in which the signal intensities for the identified peptide sequences were relatively quantified and standardized with a reference standard.
Acknowledgments
This project was funded by National Natural Science Foundation of China (81771014, 81800920) and Natural Science Foundation Project of Shanghai Science and Technology Innovation Action Plan (20ZR1409900).
Glossary
Abbreviations
- BP
biological process
- CC
correlation coefficient
- CS
control subjects
- DEG
differentially expressed gene
- DEP
differentially expressed protein
- ECM
extracellular matrix
- FC
fold-change
- FDR
false discovery rate
- GO
gene ontology
- GS
gene significance
- KEGG
Kyoto encyclopedia of genes and genomes
- LC
liquid chromatography
- LC-MS
liquid chromatography–mass spectrometry
- ME
module eigengene
- MM
module membership
- MSC
mesenchymal stem cell
- NSM
nonsyndromic microtia
- PCA
principal component analysis
- PPI
protein–protein interactions
- PRM
parallel reaction monitoring
- TF
transcription factor
- TMT
tandem mass tag
- TOM
topological overlap matrix
Supporting Information Available
The Supporting Information is available free of charge at https://pubs.acs.org/doi/10.1021/acsomega.1c07059.
DEGs in NSM (Table S1) (XLSX)
TFs and their target genes in key modules (Table S2) (XLSX)
EGG pathway analysis for key modules (Table S3) (XLSX)
DEPs in NSM (XLSX)
Specific information of samples (Table S5) (XLSX)
KEGG analysis for TFs and their target genes enriched in the blue, dark red, and dark turquoise modules (Figure S1) and distribution features of gene expression before and after normalization of data among CS and NSM samples (Figure S2) (PDF)
Author Contributions
X.C., Y.X., and C.L. contributed equally to this work. T.Z., J.M., and D.M. were responsible for the idea, project design, and concept of the paper. X.C. and Q.H. performed bioinformatics analysis. C.L., X.L., and Y.F. collected the clinical samples and information. X.C., J.M., and Y.X. wrote, edited, and revised the manuscript. All authors read and approved the manuscript.
The authors declare no competing financial interest.
Supplementary Material
References
- Luquetti D. V.; Heike C. L.; Hing A. V.; Cunningham M. L.; Cox T. C. Microtia: epidemiology and genetics. Am. J. Med. Genet., Part A 2012, 158A, 124–139. 10.1002/ajmg.a.34352. [DOI] [PMC free article] [PubMed] [Google Scholar]
- Zhang T. Y.; Bulstrode N.; Chang K. W.; Cho Y. S.; Frenzel H.; Jiang D.; Kesser B. W.; Siegert R.; Triglia J. M. International Consensus Recommendations on Microtia, Aural Atresia and Functional Ear Reconstruction. J. Int. Adv. Otol. 2019, 15, 204–208. 10.5152/iao.2019.7383. [DOI] [PMC free article] [PubMed] [Google Scholar]
- Fu Y. Y.; Li C. L.; Zhang J. L.; Zhang T. Y. Autologous cartilage microtia reconstruction: Complications and risk factors. Int. J. Pediatr. Otorhinolaryngol. 2019, 116, 1–6. 10.1016/j.ijporl.2018.09.035. [DOI] [PubMed] [Google Scholar]
- Deng K.; Dai L.; Yi L.; Deng C.; Li X.; Zhu J. Epidemiologic characteristics and time trend in the prevalence of anotia and microtia in China. Birth Defects Res., Part A 2016, 106, 88–94. 10.1002/bdra.23462. [DOI] [PubMed] [Google Scholar]
- Alasti F.; Van Camp G. Genetics of microtia and associated syndromes. J. Med. Genet. 2009, 46, 361–369. 10.1136/jmg.2008.062158. [DOI] [PubMed] [Google Scholar]
- Gendron C.; Schwentker A.; van Aalst J. A. Genetic Advances in the Understanding of Microtia. J. Pediatr. Genet. 2016, 05, 189–197. 10.1055/s-0036-1592422. [DOI] [PMC free article] [PubMed] [Google Scholar]
- Minoux M.; Kratochwil C. F.; Ducret S.; Amin S.; Kitazawa T.; Kurihara H.; Bobola N.; Vilain N.; Rijli F. M. Mouse Hoxa2 mutations provide a model for microtia and auricle duplication. Development 2013, 140, 4386–97. 10.1242/dev.098046. [DOI] [PubMed] [Google Scholar]
- Brown K. K.; Viana L. M.; Helwig C. C.; Artunduaga M. A.; Quintanilla-Dieck L.; Jarrin P.; Osorno G.; McDonough B.; DePalma S. R.; Eavey R. D.; et al. HOXA2 haploinsufficiency in dominant bilateral microtia and hearing loss. Hum. Mutat. 2013, 34, 1347–1351. 10.1002/humu.22367. [DOI] [PMC free article] [PubMed] [Google Scholar]
- Piceci F.; Morlino S.; Castori M.; Buffone E.; De Luca A.; Grammatico P.; Guida V. Identification of a second HOXA2 nonsense mutation in a family with autosomal dominant non-syndromic microtia and distinctive ear morphology. Clin. Genet. 2017, 91, 774–779. 10.1111/cge.12845. [DOI] [PubMed] [Google Scholar]
- Gavalas A.; Studer M.; Lumsden A.; Rijli F. M.; Krumlauf R.; Chambon P. Hoxa1 and Hoxb1 synergize in patterning the hindbrain, cranial nerves and second pharyngeal arch. Development 1998, 125, 1123–1136. 10.1242/dev.125.6.1123. [DOI] [PubMed] [Google Scholar]
- Mailhot G.; Yang M.; Mason-Savas A.; Mackay C. A.; Leav I.; Odgren P. R. BMP-5 expression increases during chondrocyte differentiation in vivo and in vitro and promotes proliferation and cartilage matrix synthesis in primary chondrocyte cultures. J. Cell. Physiol. 2008, 214, 56–64. 10.1002/jcp.21164. [DOI] [PMC free article] [PubMed] [Google Scholar]
- Zhang Q.; Zhang J.; Yin W. Pedigree and genetic study of a bilateral congenital microtia family. Plast. Reconstr. Surg. 2010, 125, 979–987. 10.1097/PRS.0b013e3181ccdbba. [DOI] [PubMed] [Google Scholar]
- Moraes F.; Novoa A.; Jerome-Majewska L. A.; Papaioannou V. E.; Mallo M. Tbx1 is required for proper neural crest migration and to stabilize spatial patterns during middle and inner ear development. Mech. Dev. 2005, 122, 199–212. 10.1016/j.mod.2004.10.004. [DOI] [PubMed] [Google Scholar]
- Webb B. D.; Metikala S.; Wheeler P. G.; Sherpa M. D.; Houten S. M.; Horb M. E.; Schadt E. E. Heterozygous Pathogenic Variant in DACT1 Causes an Autosomal-Dominant Syndrome with Features Overlapping Townes-Brocks Syndrome. Hum. Mutat. 2017, 38, 373–377. 10.1002/humu.23171. [DOI] [PMC free article] [PubMed] [Google Scholar]
- Vanyai H. K.; Prin F.; Guillermin O.; Marzook B.; Boeing S.; Howson A.; Saunders R. E.; Snoeks T.; Howell M.; Mohun T. J.; Thompson B. Control of skeletal morphogenesis by the Hippo-YAP/TAZ pathway. Development 2020, 147, dev187187 10.1242/dev.187187. [DOI] [PMC free article] [PubMed] [Google Scholar]
- Chen X.; Zhang R.; Zhang Q.; Xu Z.; Xu F.; Li D.; Li Y. Microtia patients: Auricular chondrocyte ECM is promoted by CGF through IGF-1 activation of the IGF-1R/PI3K/AKT pathway. J. Cell. Physiol. 2019, 234, 21817–21824. 10.1002/jcp.27316. [DOI] [PubMed] [Google Scholar]
- Prein C.; Beier F. ECM signaling in cartilage development and endochondral ossification. Curr. Top. Dev. Biol. 2019, 133, 25–47. 10.1016/bs.ctdb.2018.11.003. [DOI] [PubMed] [Google Scholar]
- Kita K.; Kimura T.; Nakamura N.; Yoshikawa H.; Nakano T. PI3K/Akt signaling as a key regulatory pathway for chondrocyte terminal differentiation. Genes Cells 2008, 13, 839–850. 10.1111/j.1365-2443.2008.01209.x. [DOI] [PubMed] [Google Scholar]
- Klein S. D.; Nguyen D. C.; Bhakta V.; Wong D.; Chang V. Y.; Davidson T. B.; Martinez-Agosto J. A. Mutations in the sonic hedgehog pathway cause macrocephaly-associated conditions due to crosstalk to the PI3K/AKT/mTOR pathway. Am. J. Med. Genet., Part A 2019, 179, 2517–2531. 10.1002/ajmg.a.61368. [DOI] [PMC free article] [PubMed] [Google Scholar]
- Dong W.; Jiang H.; He L.; Pan B.; Yang Q. Changes in the Transcriptome and Proteome of Cartilage in Microtia. J. Craniofacial Surg. 2021, 32, 2301–2304. 10.1097/SCS.0000000000007660. [DOI] [PubMed] [Google Scholar]
- Burk J.; Sassmann A.; Kasper C.; Nimptsch A.; Schubert S. Extracellular Matrix Synthesis and Remodeling by Mesenchymal Stromal Cells Is Context-Sensitive. Int. J. Mol. Sci. 2022, 23, 1758 10.3390/ijms23031758. [DOI] [PMC free article] [PubMed] [Google Scholar]
- Huber A. K.; Patel N.; Pagani C. A.; Marini S.; Padmanabhan K. R.; Matera D. L.; Said M.; Hwang C.; Hsu G. C.; Poli A. A.; et al. Immobilization after injury alters extracellular matrix and stem cell fate. J. Clin. Invest. 2020, 130, 5444–5460. 10.1172/JCI136142. [DOI] [PMC free article] [PubMed] [Google Scholar]
- Huang G.; Jiang W.; Xie W.; Lu W.; Zhu W.; Deng Z. Role of peroxisome proliferator-activated receptors in osteoarthritis (Review). Mol. Med. Rep. 2021, 23, 159 10.3892/mmr.2020.11798. [DOI] [PubMed] [Google Scholar]
- Qiu Y. Y.; Zhang H. S.; Tang Y.; Liu F. Y.; Pang J. Q.; Zhang X. Y.; Xiong H.; Liang Y. S.; Zhao H. Y.; Chen S. J. Mitochondrial dysfunction resulting from the down-regulation of bone morphogenetic protein 5 may cause microtia. Ann. Transl. Med. 2021, 9, 418. 10.21037/atm-21-831. [DOI] [PMC free article] [PubMed] [Google Scholar]
- Papathanasiou I.; Anastasopoulou L.; Tsezou A. Cholesterol metabolism related genes in osteoarthritis. Bone 2021, 152, 116076 10.1016/j.bone.2021.116076. [DOI] [PubMed] [Google Scholar]
- Choi W. S.; Lee G.; Song W. H.; Koh J. T.; Yang J.; Kwak J. S.; Kim H. E.; Kim S. K.; Son Y. O.; Nam H.; et al. The CH25H-CYP7B1-RORalpha axis of cholesterol metabolism regulates osteoarthritis. Nature 2019, 566, 254–258. 10.1038/s41586-019-0920-1. [DOI] [PubMed] [Google Scholar]
- Kim J. M.; Choi J. S.; Kim Y. H.; Jin S. H.; Lim S.; Jang H. J.; Kim K. T.; Ryu S. H.; Suh P. G. An activator of the cAMP/PKA/CREB pathway promotes osteogenesis from human mesenchymal stem cells. J. Cell. Physiol. 2013, 228, 617–626. 10.1002/jcp.24171. [DOI] [PubMed] [Google Scholar]
- Zhou Y.; Lv M.; Li T.; Zhang T.; Duncan R.; Wang L.; Lu X. L. Spontaneous calcium signaling of cartilage cells: from spatiotemporal features to biophysical modeling. Faseb J. 2019, 33, 4675–4687. 10.1096/fj.201801460R. [DOI] [PMC free article] [PubMed] [Google Scholar]
- Clapham D. E. Calcium signaling. Cell 2007, 131, 1047–1058. 10.1016/j.cell.2007.11.028. [DOI] [PubMed] [Google Scholar]
- McDonough R. C.; Price C. Targeted Activation of G-Protein Coupled Receptor-Mediated Ca(2+) Signaling Drives Enhanced Cartilage-Like Matrix Formation. Tissue Eng., Part A 2022, 28 (9-10), 405–419. 10.1089/ten.tea.2021.0078. [DOI] [PMC free article] [PubMed] [Google Scholar]
- Liu Y.; Beyer A.; Aebersold R. On the Dependency of Cellular Protein Levels on mRNA Abundance. Cell 2016, 165, 535–550. 10.1016/j.cell.2016.03.014. [DOI] [PubMed] [Google Scholar]
- Jiang L.; Wang M.; Lin S.; Jian R.; Li X.; Chan J.; Dong G.; Fang H.; Robinson A. E.; Snyder M. P.; et al. A Quantitative Proteome Map of the Human Body. Cell 2020, 183, 269–283.e19. 10.1016/j.cell.2020.08.036. [DOI] [PMC free article] [PubMed] [Google Scholar]
- Vogel C.; Marcotte E. M. Insights into the regulation of protein abundance from proteomic and transcriptomic analyses. Nat. Rev. Genet. 2012, 13, 227–232. 10.1038/nrg3185. [DOI] [PMC free article] [PubMed] [Google Scholar]
- Payne S. H. The utility of protein and mRNA correlation. Trends Biochem. Sci. 2015, 40, 1–3. 10.1016/j.tibs.2014.10.010. [DOI] [PMC free article] [PubMed] [Google Scholar]
- Radner S.; Banos C.; Bachay G.; Li Y. N.; Hunter D. D.; Brunken W. J.; Yee K. T. beta2 and gamma3 laminins are critical cortical basement membrane components: ablation of Lamb2 and Lamc3 genes disrupts cortical lamination and produces dysplasia. Dev. Neurobiol. 2013, 73, 209–229. 10.1002/dneu.22057. [DOI] [PubMed] [Google Scholar]
- Haleem-Smith H.; Calderon R.; Song Y.; Tuan R. S.; Chen F. H. Cartilage oligomeric matrix protein enhances matrix assembly during chondrogenesis of human mesenchymal stem cells. J. Cell. Biochem. 2012, 113, 1245–1252. 10.1002/jcb.23455. [DOI] [PMC free article] [PubMed] [Google Scholar]
- Lv H.; Wang H.; Quan M.; Zhang C.; Fu Y.; Zhang L.; Lin C.; Liu X.; Yi X.; Chen J.; et al. Cartilage oligomeric matrix protein fine-tunes disturbed flow-induced endothelial activation and atherogenesis. Matrix Biol. 2021, 95, 32–51. 10.1016/j.matbio.2020.10.003. [DOI] [PubMed] [Google Scholar]
- Burger A.; Roosenboom J.; Hossain M.; Weinberg S. M.; Hecht J. T.; Posey K. L. Mutant COMP shapes growth and development of skull and facial structures in mice and humans. Mol. Genet. Genomic Med. 2020, 8, e1251 10.1002/mgg3.1251. [DOI] [PMC free article] [PubMed] [Google Scholar]
- Zhang T.; Yao S.; Wang P.; Yin C.; Xiao C.; Qian M.; Liu D.; Zheng L.; Meng W.; Zhu H.; et al. ApoA-II directs morphogenetic movements of zebrafish embryo by preventing chromosome fusion during nuclear division in yolk syncytial layer. J. Biol. Chem. 2011, 286, 9514–25. 10.1074/jbc.M110.134908. [DOI] [PMC free article] [PubMed] [Google Scholar]
- Zhang Y.; Wei X.; Browning S.; Scuderi G.; Hanna L. S.; Wei L. Targeted designed variants of alpha-2-macroglobulin (A2M) attenuate cartilage degeneration in a rat model of osteoarthritis induced by anterior cruciate ligament transection. Arthritis Res. Ther. 2017, 19, 175 10.1186/s13075-017-1363-4. [DOI] [PMC free article] [PubMed] [Google Scholar]
- Luan Y.; Kong L.; Howell D. R.; Ilalov K.; Fajardo M.; Bai X. H.; Di Cesare P. E.; Goldring M. B.; Abramson S. B.; Liu C. J. Inhibition of ADAMTS-7 and ADAMTS-12 degradation of cartilage oligomeric matrix protein by alpha-2-macroglobulin. Osteoarthritis Cartilage 2008, 16, 1413–20. 10.1016/j.joca.2008.03.017. [DOI] [PMC free article] [PubMed] [Google Scholar]
- Langfelder P.; Horvath S. WGCNA: an R package for weighted correlation network analysis. BMC Bioinf. 2008, 9, 559 10.1186/1471-2105-9-559. [DOI] [PMC free article] [PubMed] [Google Scholar]
- Yu G.; Wang L. G.; Han Y.; He Q. Y. clusterProfiler: an R package for comparing biological themes among gene clusters. Omics. 2012, 16, 284–287. 10.1089/omi.2011.0118. [DOI] [PMC free article] [PubMed] [Google Scholar]
- Szklarczyk D.; Franceschini A.; Wyder S.; Forslund K.; Heller D.; Huerta-Cepas J.; Simonovic M.; Roth A.; Santos A.; Tsafou K. P.; et al. STRING v10: protein-protein interaction networks, integrated over the tree of life. Nucleic Acids Res. 2015, 43, D447–D452. 10.1093/nar/gku1003. [DOI] [PMC free article] [PubMed] [Google Scholar]
- Peterson A. C.; Russell J. D.; Bailey D. J.; Westphall M. S.; Coon J. J. Parallel reaction monitoring for high resolution and high mass accuracy quantitative, targeted proteomics. Mol. Cell. Proteomics 2012, 11, 1475–1488. 10.1074/mcp.O112.020131. [DOI] [PMC free article] [PubMed] [Google Scholar]
Associated Data
This section collects any data citations, data availability statements, or supplementary materials included in this article.


