

Abstract
Background:
We investigated 92 blood biomarkers implicated in the pathophysiological pathways of ischemic injury, inflammation, hemostasis, and regulation of vascular resistance to predict post-stroke mortality.
Aim:
Based on the most promising markers, we aimed to create a novel Biomarker Panel Index (BPI) for risk stratification.
Methods:
In this prospective study, we measured 92 biomarkers in 320 stroke patients. The primary outcome measure was mortality within 90 days. We estimated the association of each biomarker using logistic regression adjusting for multiple testing. The most significant 16 biomarkers were used to create the BPI. We fitted regression models to estimate the association and the discriminatory accuracy of the BPI with mortality and stroke etiology.
Results:
Adjusted for demographic and vascular covariates, the BPI remained independently associated with mortality (odds ratio (OR) 1.68, 95% confidence interval (CI): 1.29–2.18) and cardioembolic stroke etiology (OR 1.38, 95% CI: 1.10–1.74), and improved the discriminatory accuracy to predict mortality (area under the receiver operating characteristic curve (AUC) 0.93, 95% CI: 0.89–0.96) and cardioembolic stroke etiology (AUC 0.70, 95% CI: 0.64–0.77) as compared to the best clinical prediction models alone (AUC 0.89, 95% CI: 0.84–0.94 and AUC 0.66, 95% CI: 0.60-0.73, respectively).
Conclusions:
We identified a novel BPI improving risk stratification for mortality after ischemic stroke beyond established demographic and vascular risk factors. Furthermore, the BPI is associated with underlying cardioembolic stroke etiology. These results need external validation.
Keywords: Stroke, ischemic, prognosis, mortality, biomarker, cardioembolic
Introduction
Stroke, with a mortality rate of approximately 8% at 90 days, is the second leading cause of death worldwide after ischemic heart disease. 1 Prognostic biomarkers may identify patients at increased risk for adverse outcome after stroke, and help optimize health care resources. A plethora of literature exists on single biomarkers and their ability to predict mortality or functional disability in ischemic stroke.2–4
Recently, interest has grown into establishing biomarker panels to help accumulate the informative value of various biomarkers into one score. A combination of biomarkers may be superior to a single biomarker as it may reflect different pathophysiological processes. 5 A few studies have investigated the predictive capacity of up to 5 biomarkers regarding post-stroke mortality.6,7 None of these have yet been implemented into the clinical routine. In this prospective study, we evaluated a preselected set of 92 blood biomarkers implicated in the pathogenesis of cardio- and cerebrovascular diseases,8,9 including biomarkers of cardiac wall stress, platelet activation, and coagulation among others, for the prediction of post-stroke mortality. Based on the best performing markers, we aimed to create a combined, novel Biomarker Panel Index (BPI) comprising as many independently significant biomarkers as possible for risk stratification after acute ischemic stroke.
Furthermore, etiological biomarkers may discriminate the underlying source of stroke and help implementing more specific secondary prevention. By being comprised by several biomarkers implicated in the pathogenesis of underlying cardiac disease, we hypothesized that the BPI may be a measure of cardiac disease burden, and, therefore, may be associated with underlying cardioembolic stroke etiology more so than with other stroke etiologies.
Methods
Study design and setting
The data of this study are available from the corresponding author upon reasonable request. The study design of this prospective cohort study was described in detail elsewhere (ClinicalTrials.gov number, NCT00390962). 10 Briefly, stroke patients presenting within 72 h from symptom onset to the emergency department were enrolled in the study after obtaining written informed consent from the patient or patients’ next of kin. The study protocol was approved by the Ethics Committee of Basel, Switzerland. This reporting adheres to the established standards for the reporting of observational studies. 11
Clinical variables
On admission, vital signs, comorbidities, risk factors, and stroke severity assessed by the National Institutes of Health Stroke Scale (NIHSS) score were evaluated. The clinical stroke syndrome (total anterior circulation syndrome (TACS), partial anterior circulation syndrome (PACS), lacunar syndrome, and posterior circulation syndrome (POCS)) was determined applying the criteria of the Oxfordshire Community Stroke Project. Stroke etiology was defined according to the Trial of Org 10172 in Acute Stroke Treatment (TOAST) classification. 12
Outcome variables and follow-up
The primary outcome variable was mortality from any cause within 90 days after stroke and assessed by a structured follow-up telephone interview with the patient, the closest relative or family physician. The secondary outcome variable was cardioembolic stroke etiology.
Blood sampling and assay
Serum blood samples collected on admission were frozen at −80°C until the time of analysis. Serum samples were assessed by a proximity extension assay (designed by Olink Proteomics, Uppsala, Sweden) which simultaneously measures 92 proteins and 4 control proteins. 13 For further information regarding the measurement technique, see Supplemental Material. All testing was performed blinded to clinical data and outcome.
Statistical analysis
Discrete variables are expressed as counts, continuous variables as medians with interquartile ranges (IQRs). Comparison between groups were made using χ2 and Mann-Whitney U test, respectively. The association of each individual biomarker with the primary outcome variable was assessed by logistic regression calculating odds ratios (ORs) and 95% confidence intervals (CIs). We further assessed those biomarkers (n = 29) with a significant Bonferroni corrected p-value for multiple testing (p-value <0.000543, Bonferroni correction of 92 tests) and adjusted for potential confounding (age, NIHSS on admission, and the presence of TACS). Eighteen biomarkers remained independently associated with mortality with a p-value <0.01.
These 18 biomarkers were examined for multicollinearity using the variance inflation factor (VIF, cut-off <10). Two biomarkers were excluded due to high collinearity with each other. The remaining 16 biomarkers were then used to create the BPI as follows: In each patient, the standardized deviation of each biomarker value from the same biomarker’s median across the cohort was calculated. The sum of these standardized deviations of the 16 biomarkers compose the BPI for each patient.
Next, we fitted prognostic models. The final model was obtained using the Forward Stepwise Method. It included age, NIHSS on admission, and the BPI. The goodness of fit of the model was assessed by the Hosmer-Lemeshow test. We compared model A (i.e. age and NIHSS on admission) with the biomarker model B (i.e. age, NIHSS on admission and the BPI) by comparing the areas under the receiver operating characteristic curves (ROC) of these two nested logistic regression models, the Bayesian Information Criterion (BIC) and pseudo R-square (McFadden’s R-square). In addition, the continuous net reclassification improvement (NRI) was calculated to assess the incremental value of the BPI. We further assessed the maximum value of the Youden index of the combined model B and its sensitivity and specificity. We adjusted for the optimistic bias of in-sample prediction error estimates by bootstrapping and 10-fold cross-validation.
We also performed interaction analyses to investigate if the predictive value of the BPI is modified by baseline risk factors.
Lastly, to investigate the association of the created BPI with stroke etiology, we assessed its incremental value for the outcome variable cardioembolic stroke adjusting for specific confounding variables likewise as described above for the outcome variable mortality.
All testing was two tailed, performed using STATA 14.2 (StataCorp, College Station, TX), and p < 0.05 was considered statistically significant unless otherwise stated.
Results
Patients
Forty-two patients with ischemic stroke were excluded from the analysis because of incomplete data (Supplemental Figure 1). There was no difference regarding the baseline characteristics between the original cohort (362 patients) 10 and the 320 patients used in this study (Supplemental Table 1). The main baseline characteristics are provided in Table 1.
Table 1.
Baseline characteristics stratified by mortality at 90 days after stroke.
| All patients (n = 320) | Alive (n = 283) | Dead (n = 37) | p-Value † | |
|---|---|---|---|---|
| Demographics | ||||
| Age, median (IQR), y | 75 (63–82) | 74 (61–81) | 83 (80–87) | <0.0001 ‡ |
| Women, n (%) | 130 (41) | 113 (40) | 17 (46) | 0.483 |
| Medical history, n (%) | ||||
| Hypertension | 244 (76) | 213 (75) | 30 (81) | 0.4371 |
| Atrial fibrillation | 62 (19) | 48 (17) | 14 (38) | 0.0026 ‡ |
| Smoking | 114 (36) | 104 (37) | 9 (24) | 0.1376 |
| Diabetes mellitus | 59 (18) | 52 (18) | 7 (19) | 0.9361 |
| Coronary heart disease | 84 (26) | 68 (24) | 16 (43) | 0.0126 |
| Heart failure | 46 (14) | 36 (13) | 10 (27) | 0.0199 |
| Dyslipidemia | 83 (26) | 73 (26) | 10 (27) | 0.8725 |
| Previous stroke | 80 (25) | 73 (26) | 7 (19) | 0.3644 |
| Positive family history | 100 (31) | 90 (32) | 9 (24) | 0.3555 |
| Charlson comorbidity index (IQR) | 1 (0–2) | 1 (0–2) | 1 (0–2) | 0.0469 |
| Clinical data, median (IQR) | ||||
| Systolic blood pressure, mmHg | 159 (140–180) | 160 (140–180) | 152 (130–164) | 0.0323 |
| Diastolic blood pressure, mmHg | 90 (79–100) | 91 (80–101) | 86 (74–94) | 0.0147 |
| NIHSS at admission (points) | 5 (2–10) | 5 (2–8) | 17 (9–25) | <0.0001 ‡ |
| Stroke syndrome, n (%) | ||||
| Total anterior circulation syndrome | 38 (12) | 24 (8) | 14 (38) | <0.001 ‡ |
| Partial anterior circulation syndrome | 147 (46) | 132 (47) | 15 (41) | 0.484 |
| Lacunar syndrome | 63 (20) | 59 (21) | 4 (11) | 0.149 |
| Posterior circulation syndrome | 72 (23) | 68 (24) | 4 (11) | 0.07 |
| DWI lesion size, n (%) § | ||||
| Small (<10 mL) | 125 (68) | 122 (69) | 3 (33) | 0.024 |
| Medium (10–100 mL) | 49 (26) | 45 (26) | 4 (45) | 0.211 |
| Large (>100 mL) | 11 (6) | 9 (5) | 2 (22) | 0.034 |
| Stroke etiology, n (%) | ||||
| Large-vessel disease | 60 (19) | 56 (20) | 4 (11) | 0.52 |
| Cardioembolic | 114 (35) | 99 (34) | 15 (40) | 0.02 |
| Small-artery disease | 49 (15) | 48 (17) | 1 (3) | 0.06 |
| Other known | 17 (6) | 16 (6) | 1 (3) | 0.624 |
| Undetermined | 80 (25) | 64 (23) | 16 (43) | - // |
p-Value assessed using Mann-Whitney U test for continuous measures and χ2 test for categorical measures, respectively.
After adjusting for multiple testing of baseline variables (Bonferroni correction), p values <0.002941 were considered statistically significant.
In milliliters (for patients where information on DWI lesion was present (n = 100)).
Due to many patients in the undetermined stroke etiology group later being reclassified to other categories, we exclude these in the association analysis.
Selected biomarkers and death within 90 days
Higher levels of 29 out of 92 biomarkers were associated with mortality following adjustment for multiple testing (Bonferroni correction p < 0.000543) (Supplemental Table 2). After adjustment for the most significant predictors (age, the NIHSS score on admission and the presence of TACS), 18 biomarkers remained independently associated with death (p < 0.01). We excluded the biomarkers TNFR1 (VIF 18.5) and TNFR2 (VIF 17.3) due to collinearity. The remaining 16 biomarkers were taken to create the BPI: Ephrin-type-B-receptor-4 (EPHB4), insulin-like-growth-factor-binding-protein-2 (IGFBP2), complement-component-C1q-receptor (CD93), urokinase-type-plasminogen-activator-receptor (UPAR), bleomycin-hydrolase (BLMhydrolase), growth-differentiation-factor-15 (GDF15), von-Willebrand-factor (vWF), lymphotoxin-beta-receptor (LTBR), interleukin-18-binding-protein (IL18BP), interleukin-2-receptor-subunite-alpha (IL2RA), CC-chemokine-ligand-15 (CCL15), resistin (RETN), NTproBNP, insulin-like-growth-factor-binding-protein-1 (IGFBP1), trefoil-factor-3 (TFF3), and interleukin-1-receptor-like-1 (ST2).
BPI and death within 90 days
The BPI (median 2.06, IQR 1.56–2.85) was associated with mortality after stroke (OR 1.80, 95% CI: 1.45–2.23; AUC 0.75, 95% CI: 0.65–0.85). After adjusting for demographic and vascular risk factors the BPI remained independently associated with mortality (OR 1.68, 95% CI: 1.29–2.18, Table 2). Regarding a potential change in terms of the predictive value of the BPI over time, we found that the BPI was associated with mortality within the first 9 days (i.e. median time to death during the follow-up time of 90 days) after the index stroke (OR 1.61, 95% CI: 1.21–2.15) as well as after 9 days (OR 1.68, 95% CI: 1.17–2.41).
Table 2.
Univariable and multivariable logistic regression for mortality 90 days after stroke.
| Predictor † | Mortality | |||
|---|---|---|---|---|
| Univariable | Multivariable | |||
| OR (95% CI) | p ‡ | OR (95% CI) § | p | |
| BPI | 1.80 (1.45–2.23) | <0.001 | 1.68 (1.29–2.18) | <0.001 |
| Age (increase per year) | 1.09 (1.05–1.14) | <0.001 | 1.10 (1.05–1.16) | <0.001 |
| NIHSS at admission (per point) | 1.20 (1.14–1.25) | <0.001 | 1.18 (1.11–1.26) | <0.001 |
| TACS | 6.67 (3.19–13.96) | <0.001 | 1.42 (0.39–5.09) | 0.592 |
| Atrial fibrillation | 3.16 (1.62–6.15) | 0.001 | 0.80 (0.27–2.31) | 0.674 |
Baseline variables which remained significantly associated with mortality (after Bonferroni correction).
p < 0.001 was included in the multivariable analysis.
OR for the BPI corresponds to an increase per unit of the index.
The goodness of fit test revealed a stable model B (Hosmer-Lemeshow, p = 0.84). Compared to the clinical model A (AUC 0.89, 95% CI: 0.84–0.94), model B improved the prediction of mortality (AUC 0.93, 95% CI: 0.89–0.96; p = 0.001; Figure 1). A cut off of 0.71 (the maximum value of the Youden Index) of the ROC curve of model B revealed a sensitivity of 40.54% and a specificity of 99.29% (positive predictive value (PPV) 88.24%, negative predictive value (NPV) 92.74%). In comparison, the maximum value of the Youden Index of 0.63 of the ROC curve for model A showed a sensitivity of 35.14%, a specificity of 98.94% (PPV 81.25%, NPV 92.11%). The difference in BIC of 12 provided very strong support for the biomarker model B compared to the clinical model A. Similarly, the McFadden’s R-square showed preference for model B over model A (McFadden’s R-square 0.453 vs 0.376). Including the BPI into the model led to a statistically significant continuous non-event NRI of 64% of patients who survived being reclassified (95% CI: 0.25–0.78) to a correct lower risk, whereas the continuous event NRI of 14% was not significant (95% CI: −0.08 to 0.50) compared to the best clinical model.
Figure 1.
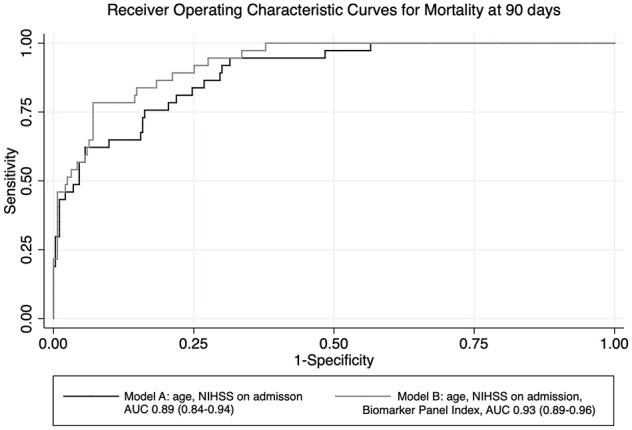
Receiver operating characteristic curves.
Subgroup and interaction analysis of the BPI with baseline risk factors
The BPI was more strongly associated with mortality in patients without diabetes (OR 1.77, 95% CI: 1.30–2.41), among male patients (OR 1.76, 95% CI: 1.26–2.45), in patients with heart failure (OR 6.45, 95% CI: 1.30–31.96), hypertension (OR 1.69, 95% CI: 1.27–2.24), mild NIHSS (0–5 points) (OR 1.78, 95% CI: 1.15–2.75), smokers (OR 3.69, 95% CI: 1.67–8.16), and in patients who presented less than 24 h from symptom onset (OR 1.72, 95% CI: 1.31–2.26). Across all other subgroups (age, atrial fibrillation, coronary heart disease, prior stroke, recanalization therapy), there was no difference observed (Supplemental Figure 2).
The interaction analysis revealed only a significant interaction between the BPI and the presence of heart failure (p = 0.041) and smoking (p = 0.014), for all other baseline variables there was no statistically significant difference.
BPI and its associations with stroke etiology
Considering stroke etiology, based on our hypothesis that the BPI may be a measure of underling cardiac disease burden, we found a positive association of the BPI with cardioembolic stroke (OR 1.42, 95% CI: 1.14–1.78). The otherwise most significant predictors for cardioembolic stroke were the NIHSS on admission and the presence of PACS (Bonferroni-adjusted p-value <0.002941) (Supplemental Table 3). The BPI remained an independent predictor for cardioembolic stroke (OR 1.38, 95% CI: 1.10–1.74, Table 3) after adjustment.
Table 3.
Multivariable logistic regression for cardioembolic stroke etiology.
| Cardioembolic stroke | ||||
|---|---|---|---|---|
| Univariable | Multivariable | |||
| Predictor † | OR (95% CI) ‡ | p § | OR (95% CI) ‡ | p § |
| BPI | 1.42 (1.14–1.78) | 0.002 | 1.38 (1.10–1.74) | 0.005 |
| PACS | 2.38 (1.41–4.02) | 0.001 | 2.46 (1.43–4.23) | 0.001 |
| NIHSS | 1.06 (1.02–1.10) | 0.007 | 1.05 (1.01–1.10) | 0.020 |
Baseline variables which remained significantly associated with mortality (after Bonferroni correction).
OR for the BPI corresponds to an increase per unit of the index.
p < 0.01 was included in the multivariable analysis.
The goodness of fit test of the model including the BPI, the NIHSS and the presence of PACS revealed a stable model (Hosmer-Lemeshow, p = 0.74). The addition of the BPI to NIHSS score and presence of PACS (model Y; AUC 0.70, 95% CI: 0.64–0.77; p = 0.0029) improved the prediction of cardioembolic stroke etiology compared to the clinical predictors alone (model X; AUC 0.66, 95% CI: 0.60–0.73). A cut off of 0.35 (the maximum value of the Youden Index) of the ROC curve using model Y revealed a sensitivity of 81.59% and a specificity of 46.83% (PPV 58.13%, NPV 73.75%). For model X, the maximum value of the Youden Index of 0.31 of the ROC curve showed a sensitivity of 91.23%, a specificity of 16.67% (PPV 49.76%, NPV 67.75%). Adding the BPI to the prediction model helped re-classify non-events (i.e. no cardioembolic stroke etiology) in 41% of patients who would have been otherwise classified into the cardioembolic stroke group (95% CI: 0.24–0.52). The continuous NRI to re-classify events correctly was 2%, but did not reach statistical significance (95% CI: −0.18 to 0.17).
Discussion
In this prospective cohort study, we evaluated 92 blood biomarkers implicated in the pathogenesis of cardiovascular diseases for the prediction of stroke mortality. Based on the most promising 16 biomarkers (EPHB4, IGFBP2, CD93, UPAR, BLMhydrolase, GDF15, vWF, LTBR, IL18BP, IL2Ra, CCL15, RETN, NTproBNP, IGFBP1, TFF3, and ST2), we created a novel BPI for risk stratification. We could demonstrate that the BPI was associated with mortality within 90 days after ischemic stroke, and showed to predict short-term mortality (in the first 9 days) similarly well as in the long-term (10–90 days after stroke). While the short-term mortality might rather be due to immediate consequences of the stroke, the long-term mortality might be caused by consequences in the long run (e.g. hear failure). Among male patients, patients with hypertension or heart failure, and patients without diabetes the BPI had a more pronounced association with mortality. Even though the power of the comparison for diabetes is rather small and our analysis for this is statistically insignificant, based on the literature, 14 we assume that patients with diabetes in our cohort are also more likely to suffer from stroke due to small vessel disease (SVD) (OR 1.24, 95% CI: 0.56–2.72) than due to cardioembolic stroke (OR 0.76, 95% CI: 0.39–1.49). On the other hand, SVD was significantly negatively associated with both mortality (OR 0.13, 95% CI: 0.02–0.99) and the BPI (OR 0.58, 95% CI: 0.40–0.85). We assume that patients with diabetes would thus more likely suffer from SVD while patients without diabetes would more likely suffer from other stroke etiologies that have a stronger association with mortality as for example cardioembolic stroke. This might explain the stronger association of the BPI and mortality in patients without diabetes. However, only the presence of heart failure and smoking significantly modified the association of the BPI with mortality. Last but not least, the BPI was also associated with cardioembolic stroke etiology after adjustment for known demographic and vascular predictors which supports our hypothesis of the BPI being a measure of cardiac disease burden. The association of the BPI and mortality was not significantly modified by cardioembolic stroke etiology.
Among the aforementioned 16 biomarkers, NT-proBNP, GDF-15, RETN, and vWF have been most extensively studied in stroke. High serum levels of BNP/NT-proBNP are associated with mortality after stroke. 15 RETN and GDF15, both regulators of inflammation, were related to stroke incidence and outcome,16,17 ST2 to stroke incidence and mortality. 18 The hemostasis-regulating glycoprotein vWF was associated with worse functional outcome after stroke. 19 Cell proliferation and adhesion regulator IGFBP-2 was related to stroke risk. 20 BLM-hydrolase catalyzes homocysteine thiolactone contributing to endothelial injury. Hyperhomocysteinemia was associated with mortality after stroke. 21 EPHB4 is involved in cerebral swelling after ischemia in a mouse model, 22 but no clinical studies have been performed so far. IL2RA, IL18BP, and IGFBP-1 are inflammatory markers involved in the formation of atherosclerosis. IL2RA is associated with stroke incidence. 23 IGFBP-1 predicted heart failure after acute myocardial infarction, but showed no association with stroke risk. 24 For IL18BP, no specific data concerning stroke exist, however it is associated with cardiovascular disease outcome. 25 The remaining biomarkers have not been explicitly studied in the context of stroke but there is a biological rational for their association (e.g. soluble UPAR is associated with inflammation in the vulnerable human atherosclerotic plaque 26 ; for further information on each biomarker please see Supplemental Table 4).
A plethora of literature exists on single biomarkers and their ability to predict mortality, or functional disability.2–4 The interest increasingly shifts from studying one biomarker to studying biomarker panels which accumulate the information of various biomarkers into one score representing the heterogeneity of a disease. One recent study with 3405 patients showed a higher risk for death at 3 months after stroke if five combined biomarkers were elevated (high-sensitivity C-reactive protein, matrix metalloproteinase-9 (MMP-9), complement C3, antiphosphatidylserine antibodies, hepatocyte growth factor) adjusted for clinical covariates (OR 5.67, 95% CI: 1.09–29.52). 7 However, the size of the subgroup in which all five biomarkers were elevated comprised only 87 patients, contributing to a wide confidence interval. In another study with 244 patients using a point-of-care multimarker immunoassay detecting BNP, D-Dimers, MMP-9, and S100β, a “Triage Stroke Panel”-score of >4 predicted mortality with an AUC of 0.62 (95% CI: 0.55–0.69) without including clinical variables into the prediction model. However, this study did not differentiate between ischemic and hemorrhagic stroke. 27 Finally, a study with 5560 patient-years of follow-up showed a higher predictive value when four biomarkers (vWF, NTproBNP, heart-type fatty-acid-binding protein, tumor necrosis factor α-receptor-1) were taken together compared to clinical risk factors. 6 In comparison to the aforementioned studies, we created our BPI with as many as 16 biomarkers which could also be incorporated into a point-of-care tool that would be applied on hospital admission, specifically for mortality prognosis. Despite age and the NIHSS score at admission being already strong predictors, the BPI showed a good discriminatory ability and significantly added incremental value to mortality risk prediction. Further validation studies for the prediction of mortality with the BPI are needed, and its effectiveness as a useful adjunct in risk stratification and clinical decision-making (e.g. choosing patients who would need no further intensive monitoring) has to be proven.
Concerning cardioembolic stroke, a study with 707 patients using a combination of two biomarkers (BNP, D-dimer) with clinical variables (age, female sex, atrial fibrillation, baseline NIHSS, ischemic, and other embolic cardiomyopathy) showed that the combined model had a better discriminating ability to predict cardioembolic stroke etiology (AUC 0.89, 95% CI: 0.86–0.92) than the clinical model (AUC 0.86) or the biomarkers alone (AUC 0.75), respectively. 28 However, in our study, the magnitude of discrimination seemed to be higher when using the BPI (AUC 0.93). Moreover, the BPI showed its association with cardioembolic stroke etiology even in absence of clinically manifest cardiac ischemic disease or heart failure. After further validation and effectiveness studies, the BPI may become a helpful tool in selecting those patients who may need more intensive cardiac evaluation to search for atrial fibrillations and other cardiac sources of stroke.
The strengths of this study are the prospective design, well-characterized patients and a low lost-to-follow-up rate. The outcome assessment was blinded to biomarker measurements. The BPI comprises information on 16 biomarkers mirroring the heterogeneity and complexity of ischemic stroke. The incremental prognostic value of the BPI was assessed using not one but several statistical methods (comparison of the AUC, BIC, McFadden’s R, NRI) which all underlined its incremental value. The highest incremental value of the BPI was in reclassifying 64% more patients with a good prognosis as compared to the clinical model alone. In our sample, this corresponds to 33 patients. However, randomized clinical trials are needed to assess the clinical significance of the BPI.
The limitations are: (1) Patients presenting up to 72 h from symptom onset were included. This reflects the real, less-than-ideal clinical routine, where a subgroup of patients presents after the acute intervention window. However, there was no significant interaction between the time of symptom onset and the association of the BPI with mortality. (2) Due to our sample size, we could not perform a validation analysis within our cohort. But bootstrapping and 10-fold cross-validation showed a robust model. Nevertheless, our results need external validation in an independent cohort study and the evaluation of improved patient care in interventional studies before being implemented into the clinical practice. (3) Blood samples were stored at −80°C for several years before analysis. This could have potentially led to some protein degradation. However, without unnecessary thawing, frozen proteins remain stable for several years, and protein degradation would have affected survivors and non-survivors similarly.
Conclusion
In conclusion, adding the BPI to the prediction model may especially help to identify those patients with a high chance of surviving. However, these data certainly need independent external validation and effectiveness has to finally be proven in interventional studies.
Supplemental Material
Supplemental material, sj-docx-4-eso-10.1177_23969873221090798 for A novel biomarker panel index improves risk stratification after ischemic stroke by Antonela Bicvic, Natalie Scherrer, Juliane Schweizer, Felix Fluri, Mirjam Christ-Crain, Gian Marco De Marchis, Andreas R Luft and Mira Katan in European Stroke Journal
Supplemental material, sj-jpg-3-eso-10.1177_23969873221090798 for A novel biomarker panel index improves risk stratification after ischemic stroke by Antonela Bicvic, Natalie Scherrer, Juliane Schweizer, Felix Fluri, Mirjam Christ-Crain, Gian Marco De Marchis, Andreas R Luft and Mira Katan in European Stroke Journal
Supplemental material, sj-tiff-1-eso-10.1177_23969873221090798 for A novel biomarker panel index improves risk stratification after ischemic stroke by Antonela Bicvic, Natalie Scherrer, Juliane Schweizer, Felix Fluri, Mirjam Christ-Crain, Gian Marco De Marchis, Andreas R Luft and Mira Katan in European Stroke Journal
Supplemental material, sj-tiff-2-eso-10.1177_23969873221090798 for A novel biomarker panel index improves risk stratification after ischemic stroke by Antonela Bicvic, Natalie Scherrer, Juliane Schweizer, Felix Fluri, Mirjam Christ-Crain, Gian Marco De Marchis, Andreas R Luft and Mira Katan in European Stroke Journal
Acknowledgments
Design of the study: M.K., F.F., M.C.C., G.M.D.M. Acquisition of data: M.K., F.F., M.C.C. Analysis of data: A.B., N.S., J.S., M.K. Drafting the text and preparing the figures: A.B., M.K. All authors intellectually contributed to the final version of this manuscript.
Footnotes
Declaration of conflicting interests: The author(s) declared no potential conflicts of interest with respect to the research, authorship, and/or publication of this article.
Funding: The author(s) disclosed receipt of the following financial support for the research, authorship, and/or publication of this article: This work was supported by the Swiss National Science Foundation (M.K.) and the Fondation Leducq (M.K.). All supporting entities had no role in the collection, management, analysis, and interpretation of the data, the preparation, or approval of the manuscript.
Informed consent: Written informed consent was obtained from all subjects or subjects’ next of kin before the study.
Ethical approval: Ethical approval for this study was obtained from the Ethics Committee of Basel, Switzerland.
Author contributions: Not Applicable.
Trial registration: ClinicalTrials.gov number, NCT00390962.
ORCID iDs: Antonela Bicvic  https://orcid.org/0000-0002-4999-9439
Gian Marco De Marchis
https://orcid.org/0000-0002-0342-9780
Supplemental material: Supplemental material for this article is available online.
References
- 1. Berkhemer OA, Fransen PS, Beumer D, et al. A randomized trial of intraarterial treatment for acute ischemic stroke. New Engl J Med 2015; 372: 11–20. [DOI] [PubMed] [Google Scholar]
- 2. Simats A, García-Berrocoso T, Montaner J. Neuroinflammatory biomarkers: from stroke diagnosis and prognosis to therapy. Biochim Biophys Acta 2016; 1862: 411–424. [DOI] [PubMed] [Google Scholar]
- 3. Bicciato G, Arnold M, Gebhardt A, et al. Precision medicine in secondary prevention of ischemic stroke: how may blood-based biomarkers help in clinical routine? An expert opinion. Curr Opin Neurol 2022; 35: 45–54. [DOI] [PubMed] [Google Scholar]
- 4. Esenwa CC, Elkind MS. Inflammatory risk factors, biomarkers and associated therapy in ischaemic stroke. Nat Rev Neurol 2016; 12: 594–604. [DOI] [PubMed] [Google Scholar]
- 5. Jickling GC, Sharp FR. Biomarker panels in ischemic stroke. Stroke 2015; 46: 915–920. [DOI] [PMC free article] [PubMed] [Google Scholar]
- 6. Greisenegger S, Segal HC, Burgess AI, et al. Biomarkers and mortality after transient ischemic attack and minor ischemic stroke: population-based study. Stroke 2015; 46: 659–666. [DOI] [PMC free article] [PubMed] [Google Scholar]
- 7. Zhong C, Zhu Z, Wang A, et al. Multiple biomarkers covering distinct pathways for predicting outcomes after ischemic stroke. Neurology 2019; 92: e295–e304. [DOI] [PubMed] [Google Scholar]
- 8. Lind L, Siegbahn A, Lindahl B, et al. Discovery of new risk markers for ischemic stroke using a novel targeted proteomics chip. Stroke 2015; 46: 3340–3347. [DOI] [PubMed] [Google Scholar]
- 9. Stenemo M, Nowak C, Byberg L, et al. Circulating proteins as predictors of incident heart failure in the elderly. Eur J Heart Fail 2018; 20: 55–62. [DOI] [PubMed] [Google Scholar]
- 10. Katan M, Fluri F, Morgenthaler NG, et al. Copeptin: a novel, independent prognostic marker in patients with ischemic stroke. Ann Neurol 2009; 66: 799–808. [DOI] [PubMed] [Google Scholar]
- 11. von Elm E, Altman DG, Egger M, et al. The strengthening the reporting of observational studies in epidemiology (STROBE) statement: guidelines for reporting observational studies. Lancet 2007; 370: 1453–1457. [DOI] [PubMed] [Google Scholar]
- 12. Adams HP, Jr, Bendixen BH, Kappelle LJ, et al. Classification of subtype of acute ischemic stroke. Definitions for use in a multicenter clinical trial. TOAST. Trial of Org 10172 in Acute Stroke Treatment. Stroke 1993; 24: 35–41. [DOI] [PubMed] [Google Scholar]
- 13. Assarsson E, Lundberg M, Holmquist G, et al. Homogenous 96-plex pea immunoassay exhibiting high sensitivity, specificity, and excellent scalability. PLoS One 2014; 9: e95192. [DOI] [PMC free article] [PubMed] [Google Scholar]
- 14. Hauer AJ, Ruigrok YM, Algra A, et al. Age-specific vascular risk factor profiles according to stroke subtype. J Am Heart Assoc 2017; 6: e005090. [DOI] [PMC free article] [PubMed] [Google Scholar]
- 15. Mäkikallio AM, Mäkikallio TH, Korpelainen JT, et al. Natriuretic peptides and mortality after stroke. Stroke 2005; 36: 1016–1020. [DOI] [PubMed] [Google Scholar]
- 16. Gröschel K, Schnaudigel S, Edelmann F, et al. Growth-differentiation factor-15 and functional outcome after acute ischemic stroke. J Neurol 2012; 259: 1574–1579. [DOI] [PMC free article] [PubMed] [Google Scholar]
- 17. Prugger C, Luc G, Haas B, et al. Multiple biomarkers for the prediction of ischemic stroke: the prime study. Arterioscler Thromb Vasc Biol 2013; 33: 659–666. [DOI] [PubMed] [Google Scholar]
- 18. Dieplinger B, Bocksrucker C, Egger M, et al. Prognostic value of inflammatory and cardiovascular biomarkers for prediction of 90-day all-cause mortality after acute ischemic stroke-results from the Linz Stroke Unit Study. Clin Chem 2017; 63: 1101–1109. [DOI] [PubMed] [Google Scholar]
- 19. Whiteley W, Wardlaw J, Dennis M, et al. The use of blood biomarkers to predict poor outcome after acute transient ischemic attack or ischemic stroke. Stroke 2012; 43: 86–91. [DOI] [PubMed] [Google Scholar]
- 20. Prentice RL, Zhao S, Johnson M, et al. Proteomic risk markers for coronary heart disease and stroke: validation and mediation of randomized trial hormone therapy effects on these diseases. Genome Med 2013; 5: 112. [DOI] [PMC free article] [PubMed] [Google Scholar]
- 21. Tu WJ, Dong X, Zhao SJ, et al. Prognostic value of plasma neuroendocrine biomarkers in patients with acute ischaemic stroke. J Neuroendocrinol 2013; 25: 771–778. [DOI] [PubMed] [Google Scholar]
- 22. Ghori A, Freimann FB, Nieminen-Kelhä M, et al. Ephrinb2 activation enhances vascular repair mechanisms and reduces brain swelling after mild cerebral ischemia. Arterioscler Thromb Vasc Biol 2017; 37: 867–878. [DOI] [PubMed] [Google Scholar]
- 23. Durda P, Sabourin J, Lange EM, et al. Plasma levels of soluble interleukin-2 receptor alpha: associations with clinical cardiovascular events and genome-wide association scan. Arterioscler Thromb Vasc Biol 2015; 35: 2246–2253. [DOI] [PMC free article] [PubMed] [Google Scholar]
- 24. Kaplan RC, McGinn AP, Pollak MN, et al. Association of total insulin-like growth factor-i, insulin-like growth factor binding protein-1 (igfbp-1), and igfbp-3 levels with incident coronary events and ischemic stroke. J Clin Endocrinol Metab 2007; 92: 1319–1325. [DOI] [PubMed] [Google Scholar]
- 25. Tiret L, Godefroy T, Lubos E, et al. Genetic analysis of the interleukin-18 system highlights the role of the interleukin-18 gene in cardiovascular disease. Circulation 2005; 112: 643–650. [DOI] [PubMed] [Google Scholar]
- 26. Edsfeldt A, Nitulescu M, Grufman H, et al. Soluble urokinase plasminogen activator receptor is associated with inflammation in the vulnerable human atherosclerotic plaque. Stroke 2012; 43: 3305–3312. [DOI] [PubMed] [Google Scholar]
- 27. Iemolo F, Sanzaro E, Duro G, et al. The prognostic value of biomarkers in stroke. Immun Ageing 2016; 13: 19. [DOI] [PMC free article] [PubMed] [Google Scholar]
- 28. Montaner J, Perea-Gainza M, Delgado P, et al. Etiologic diagnosis of ischemic stroke subtypes with plasma biomarkers. Stroke 2008; 39: 2280–2287. [DOI] [PubMed] [Google Scholar]
Associated Data
This section collects any data citations, data availability statements, or supplementary materials included in this article.
Supplementary Materials
Supplemental material, sj-docx-4-eso-10.1177_23969873221090798 for A novel biomarker panel index improves risk stratification after ischemic stroke by Antonela Bicvic, Natalie Scherrer, Juliane Schweizer, Felix Fluri, Mirjam Christ-Crain, Gian Marco De Marchis, Andreas R Luft and Mira Katan in European Stroke Journal
Supplemental material, sj-jpg-3-eso-10.1177_23969873221090798 for A novel biomarker panel index improves risk stratification after ischemic stroke by Antonela Bicvic, Natalie Scherrer, Juliane Schweizer, Felix Fluri, Mirjam Christ-Crain, Gian Marco De Marchis, Andreas R Luft and Mira Katan in European Stroke Journal
Supplemental material, sj-tiff-1-eso-10.1177_23969873221090798 for A novel biomarker panel index improves risk stratification after ischemic stroke by Antonela Bicvic, Natalie Scherrer, Juliane Schweizer, Felix Fluri, Mirjam Christ-Crain, Gian Marco De Marchis, Andreas R Luft and Mira Katan in European Stroke Journal
Supplemental material, sj-tiff-2-eso-10.1177_23969873221090798 for A novel biomarker panel index improves risk stratification after ischemic stroke by Antonela Bicvic, Natalie Scherrer, Juliane Schweizer, Felix Fluri, Mirjam Christ-Crain, Gian Marco De Marchis, Andreas R Luft and Mira Katan in European Stroke Journal