

SUMMARY
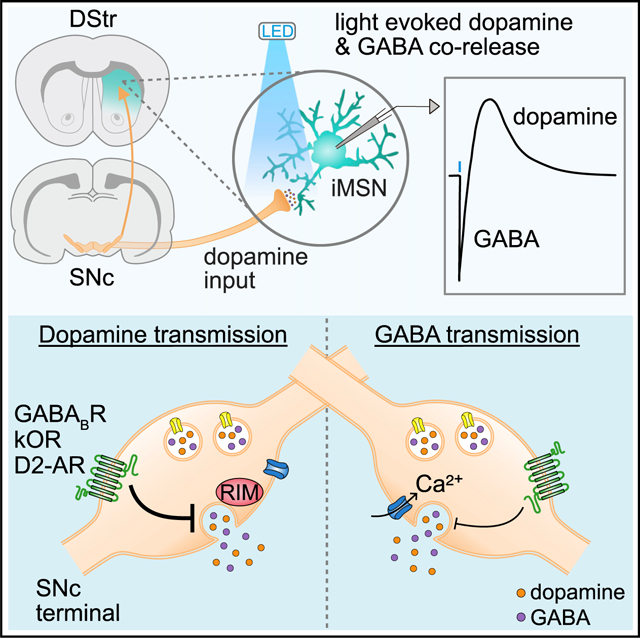
Substantia nigra pars compacta (SNc) dopamine neurons play a key role in regulating the activity of striatal circuits within the basal ganglia. In addition to dopamine, these neurons release several other transmitters, including the major inhibitory neurotransmitter γ-aminobutyric acid (GABA). Both dopamine and GABA are loaded into SNc synaptic vesicles by the vesicular monoamine transporter 2 (VMAT2), and co-release of GABA provides strong inhibition to the striatum by directly inhibiting striatal medium spiny projection neurons (MSNs) through activation of GABAA receptors. Here, we found that despite both dopamine and GABA being co-packaged by VMAT2, the properties of transmission, including Ca2+ sensitivity, release probability, and requirement of active zone scaffolding proteins, differ between the two transmitters. Moreover, the extent by which presynaptic neuromodulators inhibit co-transmission also varied. Differences in modulation and the mechanisms controlling release allow for independent regulation of dopamine and GABA signals despite both being loaded via similar mechanisms.
Graphical abstract
In brief
Zych and Ford uncover physiological differences in the modulation and release mechanisms of co-transmitted dopamine and GABA in the striatum. Despite dopamine and GABA being co-packaged by VMAT2 in SNc terminals, their transmission properties differed, including their release probability, calcium sensitivity, active zone scaffolding protein requirements, and presynaptic neuromodulation.
INTRODUCTION
Substantia nigra pars compacta (SNc) dopamine (DA) inputs to the dorsal striatum regulate a range of behavioral functions, including motor control, motivation, habit formation, and reward encoding, such that dysfunction of striatal DA signaling is thought to underlie several neurological and neuropsychiatric disorders, including Parkinson’s disease, addiction, depression, schizophrenia, and ADHD. Dopaminergic transmission in the striatum serves a neuromodulatory role by acting on metabotropic DA receptors expressed on glutamatergic terminals, striatal interneurons, and medium spiny neurons (MSNs), and causes circuit-specific modulation by activating excitatory D1 and inhibitory D2 DA receptors on direct-pathway MSNs and indirect-pathway MSNs, respectively. DA neurons also shape striatal output through the co-transmission of other neurotransmitters, including glutamate, γ-aminobutyric acid (GABA), and neuropeptides (Chuhma et al., 2014; Hnasko et al., 2010; Joyce and Rayport, 2000; Sulzer et al., 1998; Tritsch et al., 2012; Zhang et al., 2015). Although the functional and behavioral consequences of co-released GABA have yet to be well characterized, it has been found that co-released GABA inhibits MSN firing through GABAA receptors (Tritsch et al., 2012), and reducing GABA co-release enhances ethanol consumption and preference (Kim et al., 2015), suggesting an important role in rewarding behaviors.
Although midbrain DA neurons do not express glutamate decarboxylases or the vesicular GABA transporter VGAT (Slc32a1), they instead acquire GABA through presynaptic uptake via the plasma membrane GABA transporter mGAT1 (Slc6a1) (Tritsch et al., 2014; Poulin et al., 2014), as well as possibly synthesizing GABA via aldehyde dehydrogenase1A1 (ALDH1A1) (Kim et al., 2015), but see (Melani and Tritsch, 2022). The expression of mGAT1 in 89% of midbrain DA neurons (Tritsch et al., 2014) and their broad axonal arborization in the striatum (Matsuda et al., 2009) suggests that striatal GABA co-transmission is likely widespread. GABA is loaded into vesicles in midbrain DA neurons by the vesicular monoamine transporter Slc18a2 (VMAT2), despite lacking the characteristic aromatic ring structure and positive charge of canonical VMAT2 substrates (Tritsch et al., 2012; Yelin and Schuldiner, 1995). As VMAT2 is required for loading of both GABA and DA into vesicles in midbrain DA neurons, it follows that both may occupy the same synaptic vesicles and thus be co-released together. However, little is currently known about the mechanisms controlling DA and GABA co-release from DA neurons and if these two transmitters may be independently modulated.
Here, we directly compared the co-release of GABA and DA from midbrain dopamine neurons by simultaneously measuring D2 and GABAA receptor-mediated synaptic events in D2-MSNs. We found that the release of DA and GABA from SNc terminals was differentially regulated, exhibiting distinct sensitivity to extracellular calcium, divergent release probabilities, and different requirements for scaffolding proteins. Additional functional specializations could be seen in the extent by which neuromodulators were able to differentially inhibit release. Examining the actions of neuromodulators revealed that presynaptic GABAB receptors, kappa opioid receptors (κORs), and D2 autoreceptors had different effects in the extent of inhibition on striatal DA and GABA co-release. These results suggest a heterogeneity in transmitter release properties, which may enable fine-tuning of the actions of neuromodulators across different striatal synapses and circuits.
RESULTS
Photoactivation of SNc terminals drives DA and GABA co-transmission in D2-MSNs
To compare the co-release of DA and GABA from striatal DA terminals, we recorded D2 receptor and GABAA receptor-mediated synaptic events in D2 receptor-expressing medium spiny neurons (D2-MSNs) in response to selective photoactivation of DA axons in the dorsal striatum. Channelrhodopsin (ChR2) was expressed in midbrain DA neurons by injecting a Cre-dependent AAV encoding ChR2 (AAV.DIO.ChR2.eYFP) bilaterally into the SNc of DAT-IRES-Cre mice (DAT-Cre+/−). Mice also received unilateral striatal injection of an AAV encoding G-protein-coupled inwardly rectifying K+ channels (KIR3.2; GIRK2) and a tdTomato fluorophore (AAV.GIRK2.tdTomato) to drive de novo expression of GIRK2 channels in MSNs (Figure 1A). As D2 receptors in MSNs signal via second-messenger cascades that modulate activity instead of directly activating postsynaptic conductances, the viral overexpression of GIRK2 was used to provide a functional readout of D2 receptor activation in D2-MSNs (Marcott et al., 2014). In the presence of antagonists to block NMDA, AMPA, GABAB, muscarinic, nicotinic, and D1 receptors, optogenetic stimulation of ChR2-expressing DA axons (1 ms) evoked GABAA- and D2- inhibitory postsynaptic currents (IPSCs) in dorsal striatal D2-MSNs (Figure 1B). As D2-IPSCs can be evoked in D2-MSNs but not in D1-MSNs (Gong et al., 2021; Marcott et al., 2018), D2-MSNs were identified by the presence of D2-IPSCs. GABAA-IPSCs were present in 97.4% of MSNs (371 out of 381 cells). To simultaneously resolve both D2- and GABAA-IPSCs, a high-chloride internal recording solution was used, producing inward GABAA receptor currents and outward D2 receptor-mediated currents. Stimulating DA terminals once per minute revealed no reduction in D2 and GABAA-IPSC amplitude for at least 30 min (Figure 1B). Optogenetically evoked D2- and GABAA-IPSCs were abolished by sulpiride (1 μM) and picrotoxin (100 μM), respectively (Figures 1C and 1D). Although D2 and GABAA currents were recorded simultaneously from the same D2-MSN, the slower kinetics of G-protein-coupled receptor (GPCR)-mediated D2-IPSCs provides temporal separation between the peak of D2- and GABAA-IPSCs. To verify that GABAA- and D2-IPSCs can be accurately recorded simultaneously and that activation of both receptors does not shunt the opposing conductance, sulpiride was bath applied to isolate GABAA-IPSCs, and picrotoxin was applied to isolate D2-IPSCs. Application of sulpiride (1 μM) had no effect on the amplitude of GABAA-IPSCs (Figure 1C) and picrotoxin (100 μM) had no effect on the amplitude of D2-IPSCs (Figure 1D). To confirm that D2 receptor signaling in D2-MSNs was not saturated during synaptic events, we compared the amplitude of D2-IPSCs evoked by optogenetic stimulation with the amplitude of D2 receptor-mediated currents evoked by a prolonged application of exogenous DA via iontophoresis (50 ms). Normalizing the amplitude of D2-IPSCs to the maximal current evoked by DA iontophoresis revealed that D2 receptor activation during D2-IPSCs was only 56.9% of that compared with iontophoresis (Figure 1E). Finally, we confirmed that the IPSCs were monosynaptic as they were blocked by tetrodotoxin (500 nM; TTX) yet restored by subsequent application of 4-aminopyridine (4-AP) (100 μM) (Figure 1F). Together these results confirm that DA and GABA are monosynaptically released from DA terminals upon optogenetic stimulation and that this release can be simultaneously measured by recording D2- and GABAA-IPSCs.
Figure 1. Photoactivation of SNc terminals evokes DA and GABA co-transmission in D2-MSNs.
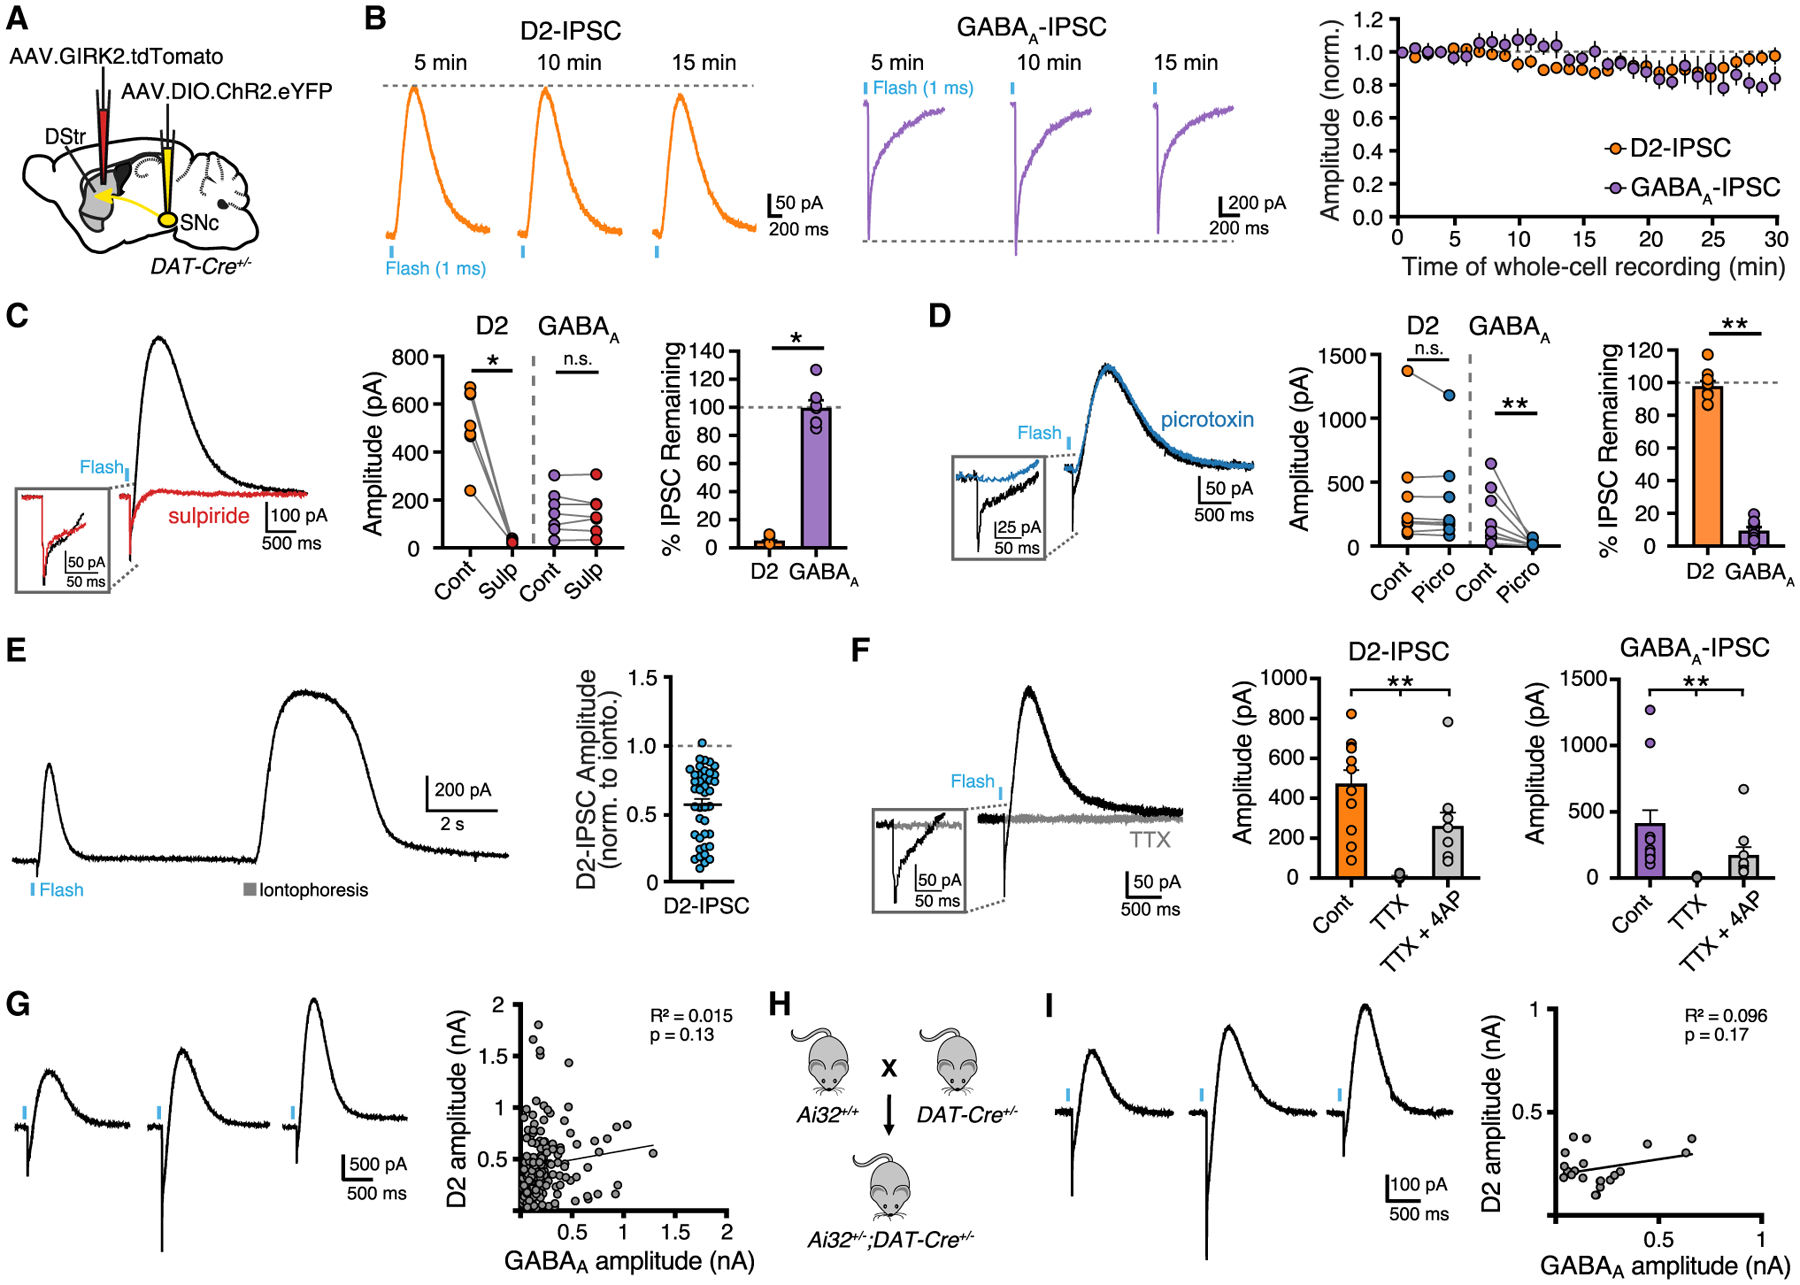
(A) Illustration of injection of AAV5.EF1a.DIO.hChR2.eYFP in the SNc and AAV9.hSyn.tdTomato.T2A.GIRK2 in the DStr of DAT-IRES-Cre mice.
(B) Optically evoked D2- and GABAA-IPSCs and plot of IPSC amplitudes normalized to the first response (D2, n = 7; GABAA, n = 6; p > 0.05, Kruskal-Wallis test).
(C) Representative trace and summary data of IPSCs showing D2-IPSC component is blocked by sulpiride (1 μM) (control, black; sulpiride, red) (n = 7, D2, p < 0.05; GABAA, p > 0.05, paired t test).
(D) Representative trace and summary of IPSCs showing GABAA-IPSC component is blocked by picrotoxin (100 μM) (control, black; picrotoxin, blue) (n = 8, D2, p > 0.05; GABAA, p < 0.01, paired t test).
(E) Example trace and summary data of opto-evoked D2-IPSCs and D2 receptor-mediated currents evoked by the iontophoretic application of DA (n = 41).
(F) Representative trace in presence of TTX (500 nM) and summary data of current amplitudes in TTX and 4-AP (100 μM) (control, black; TTX, gray) (D2, n = 10; GABAA, n = 10; D2, p < 0.01; GABAA, p < 0.01, Wilcoxon).
(G) D2 and GABAA-IPSC amplitude correlation in AAV injected DAT-Cre mice (n = 154, p > 0.05, Pearson correlation).
(H) Generation of Ai32+/−;DAT-Cre+/− mice.
(I) D2 and GABAA-IPSC amplitude correlation in Ai32+/−;DAT-Cre+/− mice (n = 21, p > 0.05, Pearson correlation). Summary data are mean ± SEM. ns, p > 0.05, *p < 0.05, **p < 0.01, ***p < 0.001, ****p < 0.0001. See Table S1.
Since DA and co-released GABA are both loaded into synaptic vesicles by VMAT2, DA and GABA may occupy the same vesicles and be released from the same vesicle pools at all release sites. To examine whether the physiological release of DA and GABA are correlated, we plotted the ratio of D2:GABAA-IPSC amplitudes recorded from the same D2-MSNs but found no correlation across neurons (Figure 1G). As an alternative approach, we also crossed Ai32 mice with DAT-Cre mice to genetically express ChR2 in midbrain DA neurons (Figure 3C). In this case, when ChR2 was expressed more uniformly, we again found a lack of correlation between D2 and GABAA amplitudes (Figure 1H). We centered recordings in regions of the dorsal striatum with the highest levels of tdTomato expression, which we have previously found limits the variability in GIRK2 expression across cells such that dopamine evokes consistent D2 receptor-mediated GIRK2 currents (Gong et al., 2021). As such the distribution of D2-IPSCs is unlikely to be due to cellular variability in the expression of GIRK2.
Figure 3. Vesicular release of DA and GABA exhibit different sensitivity to calcium.
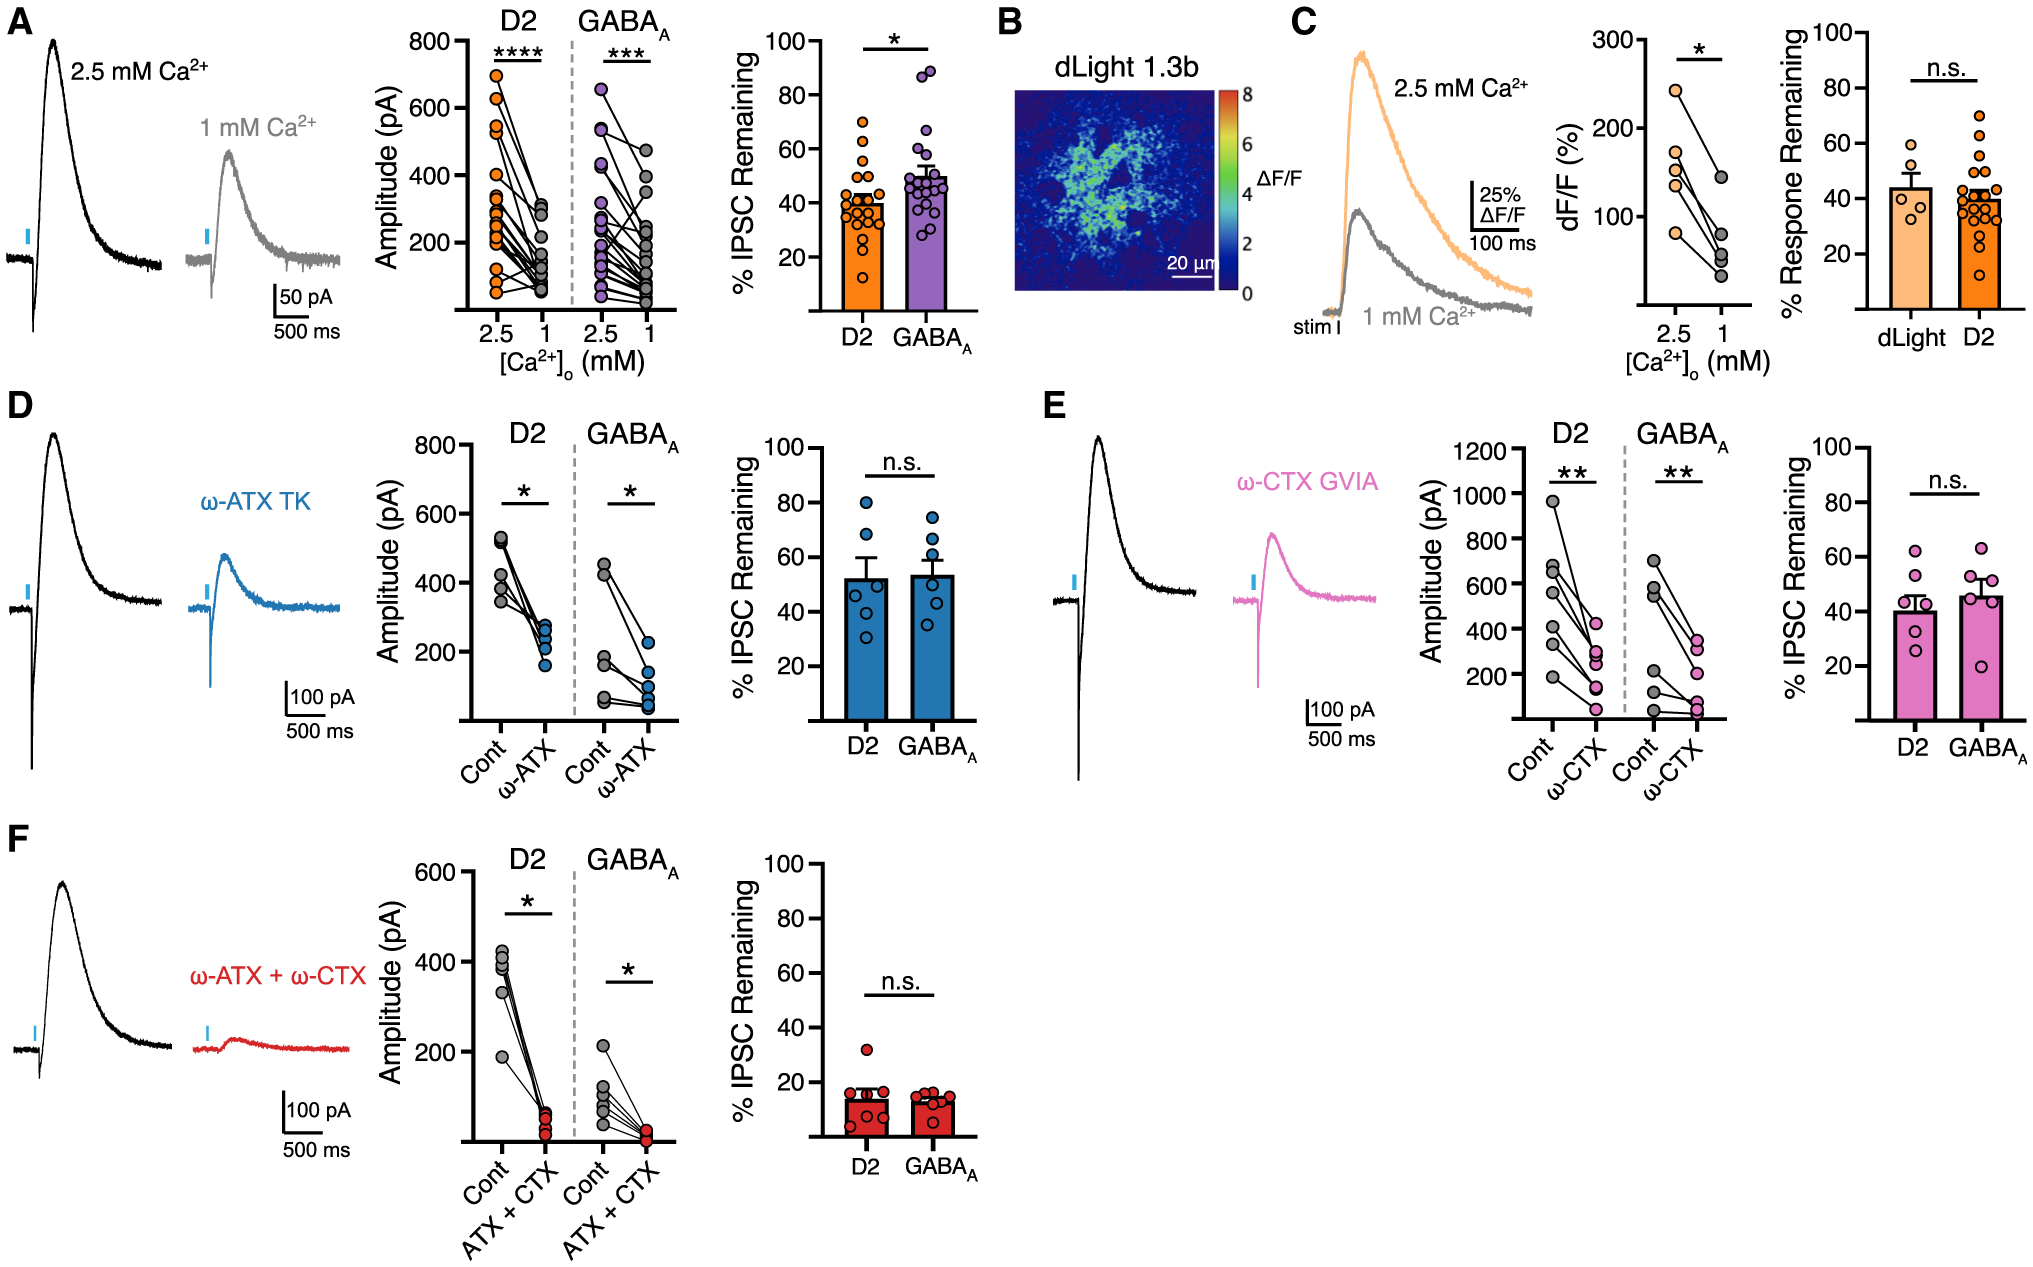
(A) Representative traces and summary data of D2 and GABAA-IPSC amplitudes in 2.5 and 1 mM Ca2+ (D2, n = 19; GABAA, n = 19, p < 0.05, paired t test).
(B) Representative fluorescent change in dLight1.3b following electrically evoked DA release (ΔF/F).
(C) Photometry trace of dLight1.3b fluorescence and summary data of paired change in fluorescence and percent reduction of fluorescence in 1 mM Ca2+ (n = 5, p > 0.05, Mann-Whitney).
(D) Representative trace and summary data of the effect of ω-agatoxin TK (200 nM) (n = 6, p > 0.05, Mann-Whitney).
(E) Representative trace and summary data of the effect of ω-conotoxin GVIA (200 nM) (n = 6, p > 0.05, Mann-Whitney).
(F) Representative traces and summary data of the effect of in ω-agatoxin TK (200 nM) and ω-conotoxin GVIA (200 nM) (n = 7, p > 0.05, Mann-Whitney). Summary data are mean ± SEM. ns, p > 0.05, *p < 0.05, **p < 0.01, ***p < 0.001, ****p < 0.0001. See Table S1.
Manipulating vesicular loading differentially affects DA and GABA release
The vesicular neurotransmitter transporter, VMAT2, is known for its substrate promiscuity, loading dozens of reported substrates, including monoamines, histamine, amphetamines, and GABA (Tritsch et al., 2012; Yelin and Schuldiner, 1995). As the presynaptic distribution of vesicular GABA and the efficiency of VMAT2 loading is not well characterized in SNc neurons, the extent of co-storage and proportion of agonist within vesicles remains unknown. To explore this, we compared the effect of inhibiting vesicular loading or agonist synthesis on the relative amount of DA and GABA in the readily releasable vesicle pool. We reduced DA synthesis with the competitive tyrosine hydroxylase (TH) inhibitor α-methyl tyrosine (AMPT) (250 mg/kg i.p. 2 h before brain slice preparation followed by incubation in 30 μM). As expected, AMPT treatment reduced the average amplitude of D2-IPSCs by half, but increased the average amplitude of GABAA-IPSCs compared with untreated mice (Figures 2A and 2B). This could occur from increased vesicular loading of GABA as DA concentration is reduced, or from increased release of GABA vesicles opposing GABAA receptors.
Figure 2. Blocking agonist synthesis and vesicular loading differentially affects DA and GABA release.
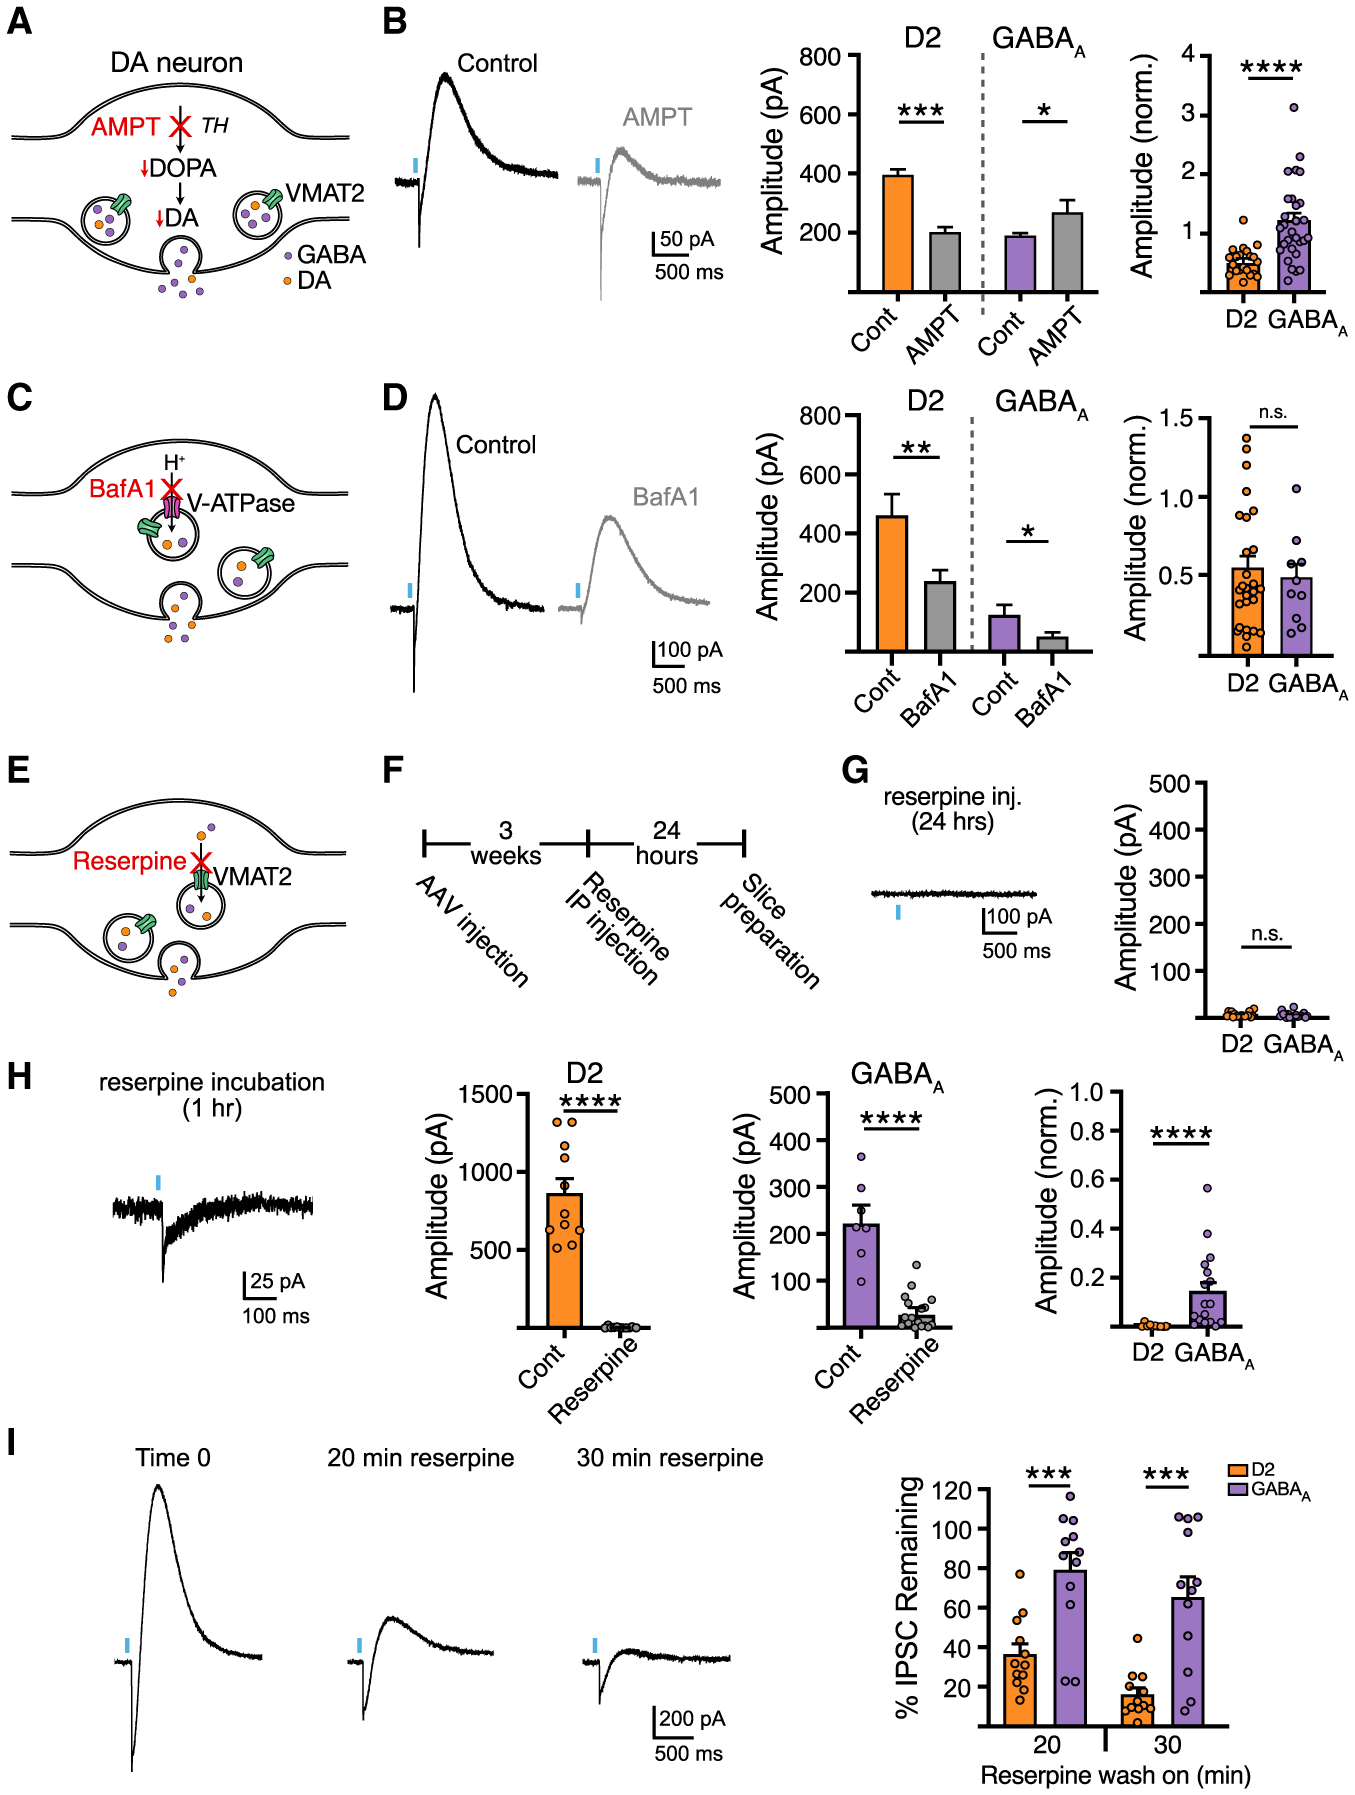
(A) Illustration of AMPT inhibition of DA synthesis.
(B) Representative traces and summary data of D2 and GABAA-IPSC amplitudes from control and AMPT-treated mice (D2, n = 21; GABAA, n = 31; D2, p < 0.001; GABAA, p < 0.05, Mann-Whitney).
(C) Illustration of BafA1 inhibition of the vacuolar ATPase.
(D) Representative traces and summary data following BafA1 bath application (D2, n = 13/27; GABAA, n = 12/9; D2, p < 0.01; GABAA, p < 0.05, Mann-Whitney).
(E) Illustration of reserpine inhibition of the VMAT2.
(F) AAV and reserpine injection timeline.
(G) Summary of D2 and GABAA-IPSC amplitudes in reserpine injected mice (5 mg/kg, i.p., 24 h prior).
(H) Representative traces and summary data following reserpine slice incubation (D2, n = 11/11; GABAA, n = 7/17; D2, p < 0.0001; GABAA, p < 0.0001, Mann-Whitney).
(I) Representative traces and summary data following reserpine bath application, (n = 12, p < 0.001, Wilcoxon). Summary data are mean ± SEM. ns, p > 0.05, *p < 0.05, **p < 0.01, ***p < 0.001, ****p < 0.0001. See Table S1.
As midbrain DA neurons may utilize ALDH1A1 for GABA synthesis (Kim et al., 2015), we next incubated slices in the aldehyde dehydrogenase inhibitor, DEAB (20 μM). Compared with untreated slices from the same animal, DEAB-treated slices showed a reduction in GABAA-IPSCs, whereas D2-IPSCs were unchanged (p > 0.05, Mann-Whitney, data not shown) (Table S1). It is unclear, however, how much this pathway contributes to the synthesis of co-released GABA as recent work suggests that co-released GABA is acquired exclusively through reuptake by mGAT1 in SNc dopamine neurons (Melani and Tritsch, 2022), suggesting that DEAB may have off-target effects or that inhibition of ALDH1A1 may alter other physiological processes.
We next inhibited VMAT2-dependent loading of synaptic vesicles by disrupting voltage and proton gradients driving active transport of DA and GABA with the vacuolar H+ ATPase inhibitor, bafilomycin A1 (BafA1). Pre-incubation of slices with BafA1 (500 nM, 1 h) similarly reduced the amplitude of D2- and GABAA-IPSCs compared with untreated slices obtained from the same animal (Figures 2C and 2D), suggesting that the loading of DA and GABA rely similarly on gradients derived from the vacuolar H+ ATPase. Next, we directly blocked VMAT2 by treating animals with reserpine (5 mg/kg, i.p.) 24 h before experiments (Figures 2E and 2F). As expected, reserpine treatment completely abolished D2-IPSCs and GABAA-IPSCs (Figure 2G) (Tritsch et al., 2012). To test the sensitivity of DA and GABA loading by VMAT2, we incubated slices in a low concentration of reserpine (1 μM) for 1 h before experiments. Interestingly, shorter exposure to reserpine completely abolished D2-IPSCs, while GABAA-IPSCs were still present, albeit with reduced amplitude compared with paired control slices from the same animal (Figure 2H). To further examine if reserpine may have differential effects on transmission, we bath applied reserpine (1 μM) while recording synaptic events. Acute application of reserpine led to greater depression of D2-IPSCs compared with GABAA-IPSCs (Figure 2I). This effect of reserpine was activity dependent, since pausing optogenetic stimulation during drug application prevented the reduction in D2- and GABAA-IPSC amplitudes (p > 0.05, Mann-Whitney) (TableS1), indicating that leakage of agonist from vesicles does not explain the greater reduction in DA release following VMAT2 blockade. The more robust effect of reserpine on D2 responses indicates either that the synaptic vesicle pool released onto D2 receptors is depleted faster than the vesicle pool released onto GABAA receptors, or that during stimulation the efficiency of reloading of DA and GABA in the recycling pool differs. While the extent to which DA and GABA are loaded into overlapping synaptic vesicles remains unknown, these data suggest that the functional vesicle pools that mediate DA and GABA transmission onto D2 and GABAA receptors differ in their relative concentration and depletion rate.
Vesicular release of DA and GABA exhibit different sensitivity to calcium
Vesicular exocytosis exhibits a steep dependence on extracellular Ca2+ and is tightly regulated by presynaptic properties, including the proximity of voltage-gated Ca2+ channels (VGCC) to active zone machinery, Ca2+ buffering capacity, and the Ca2+ sensitivity of release machinery (Borst and Sakmann, 1996; Pan and Ryan, 2012; Sheng et al., 2012). Likewise, vesicular release of DA in the striatum steeply depends on extracellular [Ca2+] (Chen and Rice, 2001; Ford et al., 2010; Silm et al., 2019). To determine whether DA and GABA release differ in Ca2+ sensitivity, the amplitudes of D2- and GABAA-IPSCs were compared in low (1 mM) and high (2.5 mM) concentrations of extracellular Ca2+ within the same D2-MSN. In low Ca2+, GABAA-IPSCs were reduced to a lesser extent than D2-IPSCs (Figure 3A), indicating that DA release has greater dependence on extracellular Ca2+ than GABA co-release.
Although the time course of DA that underlies the activation of D2 receptors in the striatum has yet to be defined, it has been estimated that at SNc somatodendritic sites a high concentration of dopamine (30–100 μM) binds to D2 receptors near the site of release, activating the GIRK conductance within ~50 ms (Beckstead et al., 2004; Condon et al., 2021; Courtney and Ford, 2014; Ford et al., 2009). As D2 receptor Gβγ-mediated signaling in D2-MSNs has relatively low sensitivity for DA (Gong et al., 2021; Marcott et al., 2014, 2018), the activation of D2 receptors that underlies the D2-IPSC in D2-MSNs may similarly result from a local high concentration of DA. While the activation of GIRK channels by Gi/o-coupled GPCRs, such as D2 receptors, has been proposed to involve either a local rearrangement of preformed macromolecular complex of GPCR/G-proteins/GIRK channels (Riven et al., 2006) or a high concentration of locally generated Gβγ subunits that activate nearby GIRK channels (Sungkaworn et al., 2017; Touhara and MacKinnon, 2018), our measurements of D2 receptor activation via GIRK channels still rely on a cascade involving G-protein activation of potassium channels which differs from the more direct intramolecular changes that underlie the activation of the GABAA conductance. To similarly compare Ca2+-induced changes in DA release we examined the effect of low and high extracellular [Ca2+] on DA release with a direct molecular approach using the genetically encoded DA indicator, dLight1.3b (Patriarchi et al., 2018) in which changes in GFP fluorescence is directly coupled to DA binding to a modified D1 receptor. The variant dLight1.3b, which has similar affinity to the sensitivity of D2 receptors in dorsal striatal D2-MSNs (Marcott et al., 2014; Patriarchi et al., 2018), was expressed non-selectively in the striatum following injection of AAV.h-Syn.dLight1.3b (Figure 3B). Using two-photon non-raster scanning photometry (Pressler and Strowbridge, 2019), we continuously sampled fluorescence from a spot in the striatum and evoked DA release by electrical stimulation. Normalized changes of fluorescence (ΔF/F) in response to electrical stimulation were measured in 1 and 2.5 mM extracellular Ca2+ (Figure 3C). Reducing extracellular Ca2+ decreased dLight responses (Figure 3C). Importantly, we found that the reduction of evoked ΔF/F in low Ca2+ was similar to the reduction in D2-IPSC amplitude (Figure 3C). This suggests that, rather than being due to differences in postsynaptic signaling, the differences in Ca2+ sensitivity between GABA and DA transmission is likely due to differences in presynaptic release.
To determine whether the difference in Ca2+ sensitivity is due to the source of Ca2+ arising from different VGCC subtypes, ω-conotoxin GVIA (200 nM) or ω-agatoxin TK (200 nM) were bath applied to block N-type or P/Q-type Ca2+ channels, respectively. D2- and GABAA-IPSCs were similarly reduced in the presence ω-conotoxin GVIA and ω-agatoxin TK, indicating a similar reliance on N-type and P/Q-type VGCCs for vesicle fusion (Figures 3D and 3E). Combined bath application of ω-agatoxin TK and ω-conotoxin GVIA reduced DA and GABA release by over 80% (Figure 3F).
The difference in calcium sensitivity could instead be due to differences in the coupling efficiency of Ca2+ entry to DA or GABA release. We compared the relative Ca2+ coupling distance of DA or GABA release using exogenous membrane-permeable Ca2+ chelators BAPTA-AM and EGTA-AM, which act through fast and slow binding kinetics, respectively, to determine whether sources of Ca2+ are tightly or loosely coupled to transmitter release (Eggermann et al., 2011). In the presence of EGTA-AM (100 μM), D2-IPSCs depressed in amplitude, whereas within the same D2-MSN GABAA-IPSCs were not significantly reduced (Figure 4A). In the presence of BAPTA-AM (100 μM), both D2- and GABAA-IPSCs depressed in amplitude from baseline, but D2-IPSCs depressed to a greater extent than GABAA-IPSCs (Figures 4B and 4C). To confirm this finding, we also examined the effect BAPTA-AM in the presence of low extracellular calcium (1.2 mM) to increase the effect of chelation. While we found a greater effect of BAPTA-AM on the amplitude of D2- and GABAA-IPSCs compared with the effect in normal ACSF, the amplitude of D2-IPSCs were still inhibited to a greater effect than GABAA-IPSCs (Figure 4D). The greater reduction of D2-IPSCs compared with GABAA-IPSCs in EGTA-AM and BAPTA-AM indicates that the coupling between Ca2+ entry and vesicular Ca2+ sensors is relatively looser for DA release than GABA, suggesting that either the distance between VGCC and vesicular Ca2+ sensors is larger for DA release sites, or that differences exist in the calcium buffering capacity or calcium-sensing proteins at release sites for the two transmitters.
Figure 4. Calcium chelators inhibit the release of DA and GABA to different extents.
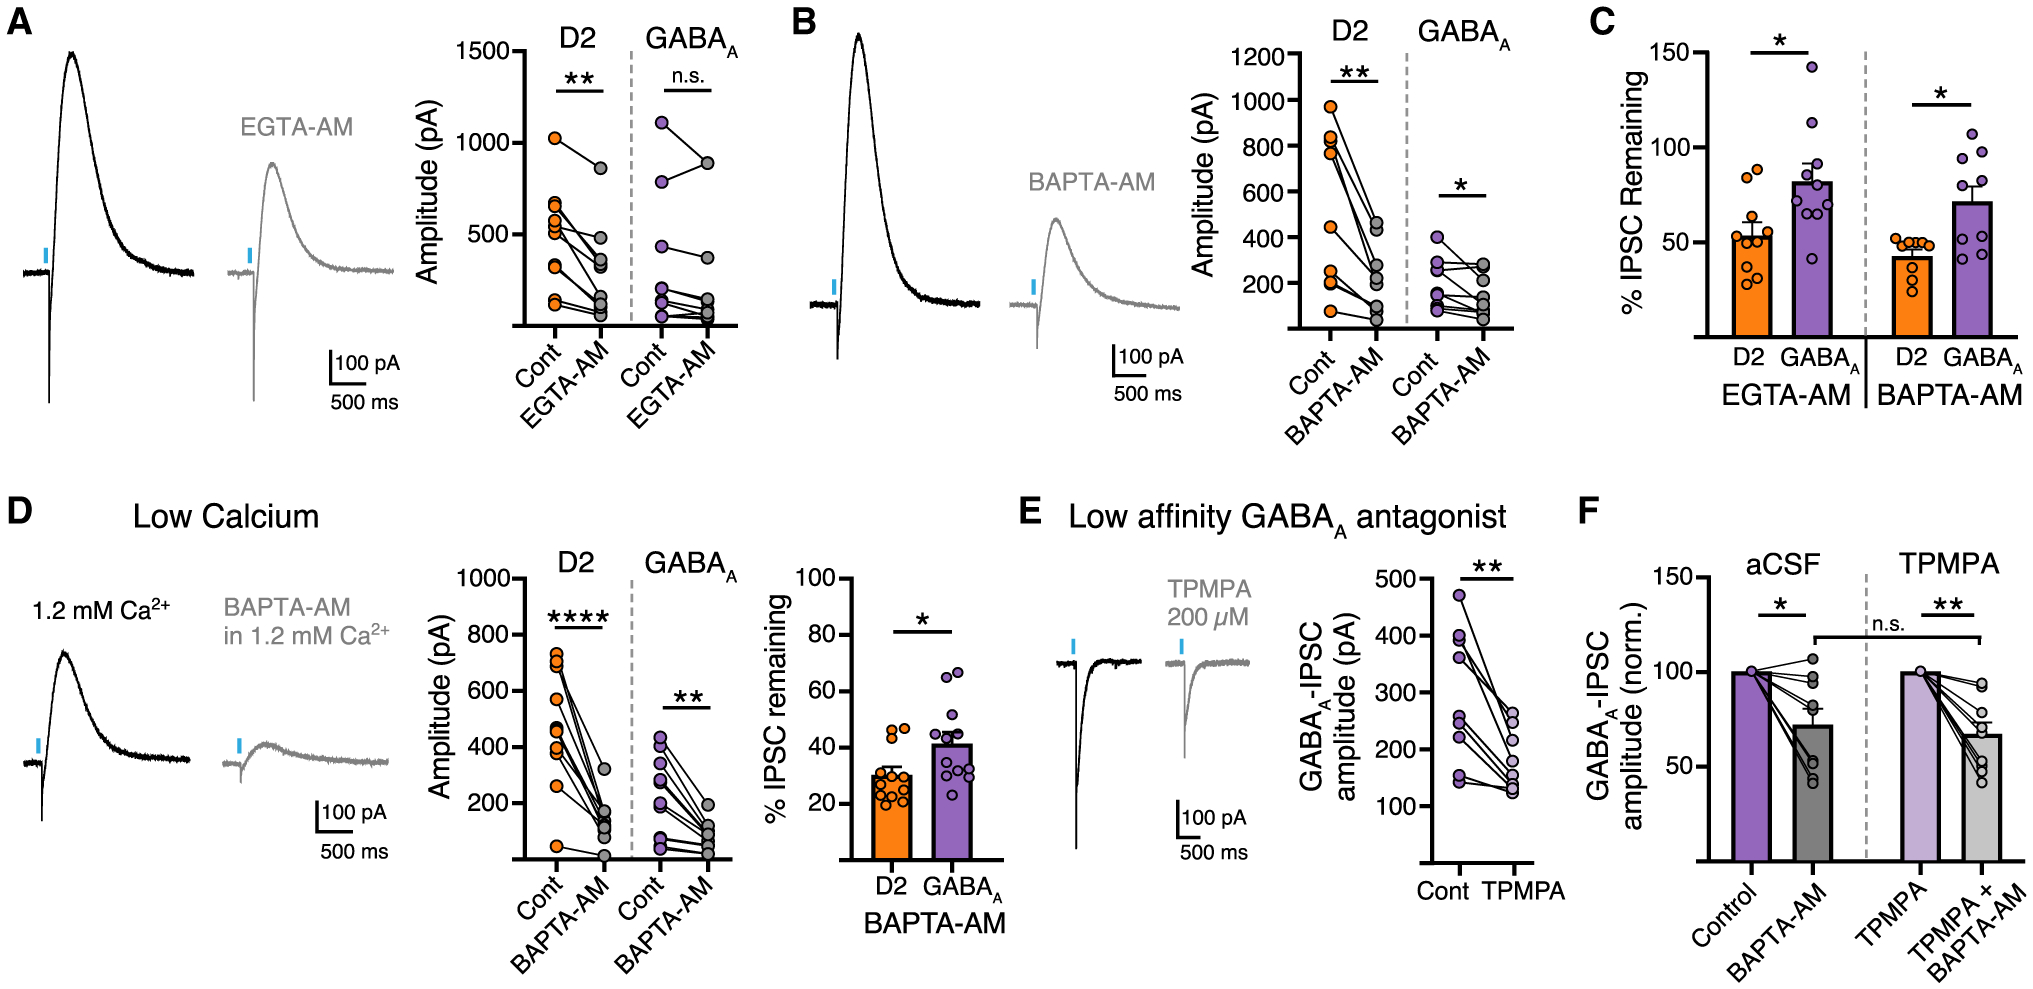
(A) Representative traces and summary data of D2 and GABAA-IPSC amplitudes in EGTA-AM (100 μM) (n = 10, D2, p < 0.01; GABAA, p > 0.05, Mann-Whitney).
(B) Representative trace and summary data in BAPTA-AM (100 μM) (n = 9, D2, p < 0.01; GABAA, p < 0.05, Mann-Whitney).
(C) Summary of percent change in the amplitude of D2-IPSCs and GABAA-IPSCs in EGTA-AM and BAPTA-AM (n = 9/10, p < 0.05, Wilcoxon).
(D) Representative trace and summary data in 1.2 mM Ca2+ and BAPTA-AM (100 μM) (n = 12, D2, p < 0.0001, Mann-Whitney; GABAA, p < 0.01, Mann-Whitney; D2:GABAA, p < 0.05, Wilcoxon).
(E) Representative trace and summary data of GABAA-IPSCs in TPMPA (200 μM) (n = 9, p < 0.01, Wilcoxon).
(F) Summary of percent change in the amplitude of GABAA-IPSCs in BAPTA-AM and TPMPA + BAPTA-AM (n = 9/10, p > 0.05, Wilcoxon). Summary data are mean ± SEM. ns, p > 0.05, *p < 0.05, **p < 0.01, ***p < 0.001, ****p < 0.0001. See Table S1.
The slow kinetics of GABAA-IPSCs evoked from SNc terminals suggests that activation of GABAA receptors may result from GABA being released from multiple terminals and pooling in the extracellular space. If this is the case, saturation of GABAA receptors may occur which could limit changes in GABAA receptor activation accurately reflecting alterations in release. To examine this, we next measured GABAA-IPSCs in the presence of a low-affinity GABAA receptor antagonist, TPMPA, to limit the effects of spillover (Markwardt et al., 2009). TPMPA (200 μM) reduced the amplitude of GABAA-IPSCs by 40% (Figure 4E). To confirm that the apparent insensitivity of GABAA currents to BAPTA-AM was not due to saturation of GABAA receptors, we repeated these experiments in the presence of TPMPA to better linearize GABAA receptor responses. BAPTA-AM, however, evoked a similar level of inhibition in the presence of the low-affinity antagonist (TPMPA; 200 μM) as in control conditions (Figure 4F). This suggests that saturation of GABAA receptors likely does not account for apparent reduced effects of BAPTA-AM on GABA release. Thus, despite both being similarly loaded by VMAT2, differences in the sensitivity to Ca2+ suggests that DA and GABA co-transmission may result from release at different sites.
The release probability differs between co-transmitted DA and GABA
Striatal dopamine has a high probability of release (Pr) and strongly depresses during high-frequency stimulation trains due to depletion of releasable vesicles (Liu et al., 2018; Marcott et al., 2014; Silm et al., 2019). However, as release probability of co-released GABA has not been examined, we next directly compared the response of DA and GABA transmission to paired stimulations. DA terminals were optogenetically stimulated with single and paired pulses of blue light (470 nm, 1 ms duration, 100 ms inter-stimulus interval) and the paired-pulse ratio (PPR) (P2/P1) calculated for D2 or GABAA-IPSCs in MSNs. To avoid the overlapping D2 and GABAA currents at short inter-stimulus intervals, D2-IPSCs were measured in the presence of picrotoxin and GABAA-IPSCs were measured in the presence of sulpiride. Due to the slow kinetics of these IPSCs, the magnitude of P2 was calculated by subtracting the single-pulse IPSC from the paired-pulse IPSC (Figure 5A). Surprisingly, optically evoked D2- and GABAA-IPSCs exhibited different PPRs, indicating different release probabilities (Figure 5B). A similar difference in the PPRs of D2- and GABAA-IPSCs was also found using low light power (minimal optical stimulation) (p < 0.01, Mann-Whitney, data not shown). Non-selective GABA release evoked by electrical stimulation (including MSN axon collaterals and GABAergic interneurons) resulted in a higher PPR, indicating that this difference in optically evoked PPR is not due to intrinsic differences in postsynaptic GABAA receptor responses (Figure 5B). While the release of DA inhibits subsequent release via the activation of presynaptic D2 autoreceptors, autoreceptor inhibition in slices peaks after 500 ms and has little effect on paired-pulse stimulations within 200 ms (Condon et al., 2019; Phillips et al., 2002), suggesting that, under these conditions, the PPR difference between GABA and DA release is due to differences in release probability rather than autoinhibition. The PPR of D2- and GABAA-IPSCs were not different when currents were recorded simultaneously or separately in picrotoxin or sulpiride, respectively (Figure 5C). To control for potential shunting via distal K+ conductances when measuring PPRs, we also recorded GABAA-IPSCs using two different cesium-based internal solutions to improve space clamp (CsCl, Vh = −60 mV; and CsMeS, Vh = 0 mV), and found that the PPRs were similar using either cesium-based or potassium chloride-based internal solutions (Figure 5C). The PPR of GABAA-IPSCs were also similar in GIRK-expressing and GIRK-negative MSNs (Figure 5D). In addition, we also found no correlation between the PPR of either D2-mediated GIRK currents or GABAA-IPSCs and the amplitude of the initial IPSC (Figure 5E), suggesting that PPR measurements are not more affected by shunting or space clamp issues when currents are large.
Figure 5. Release probability differs between co-transmitted DA and GABA.
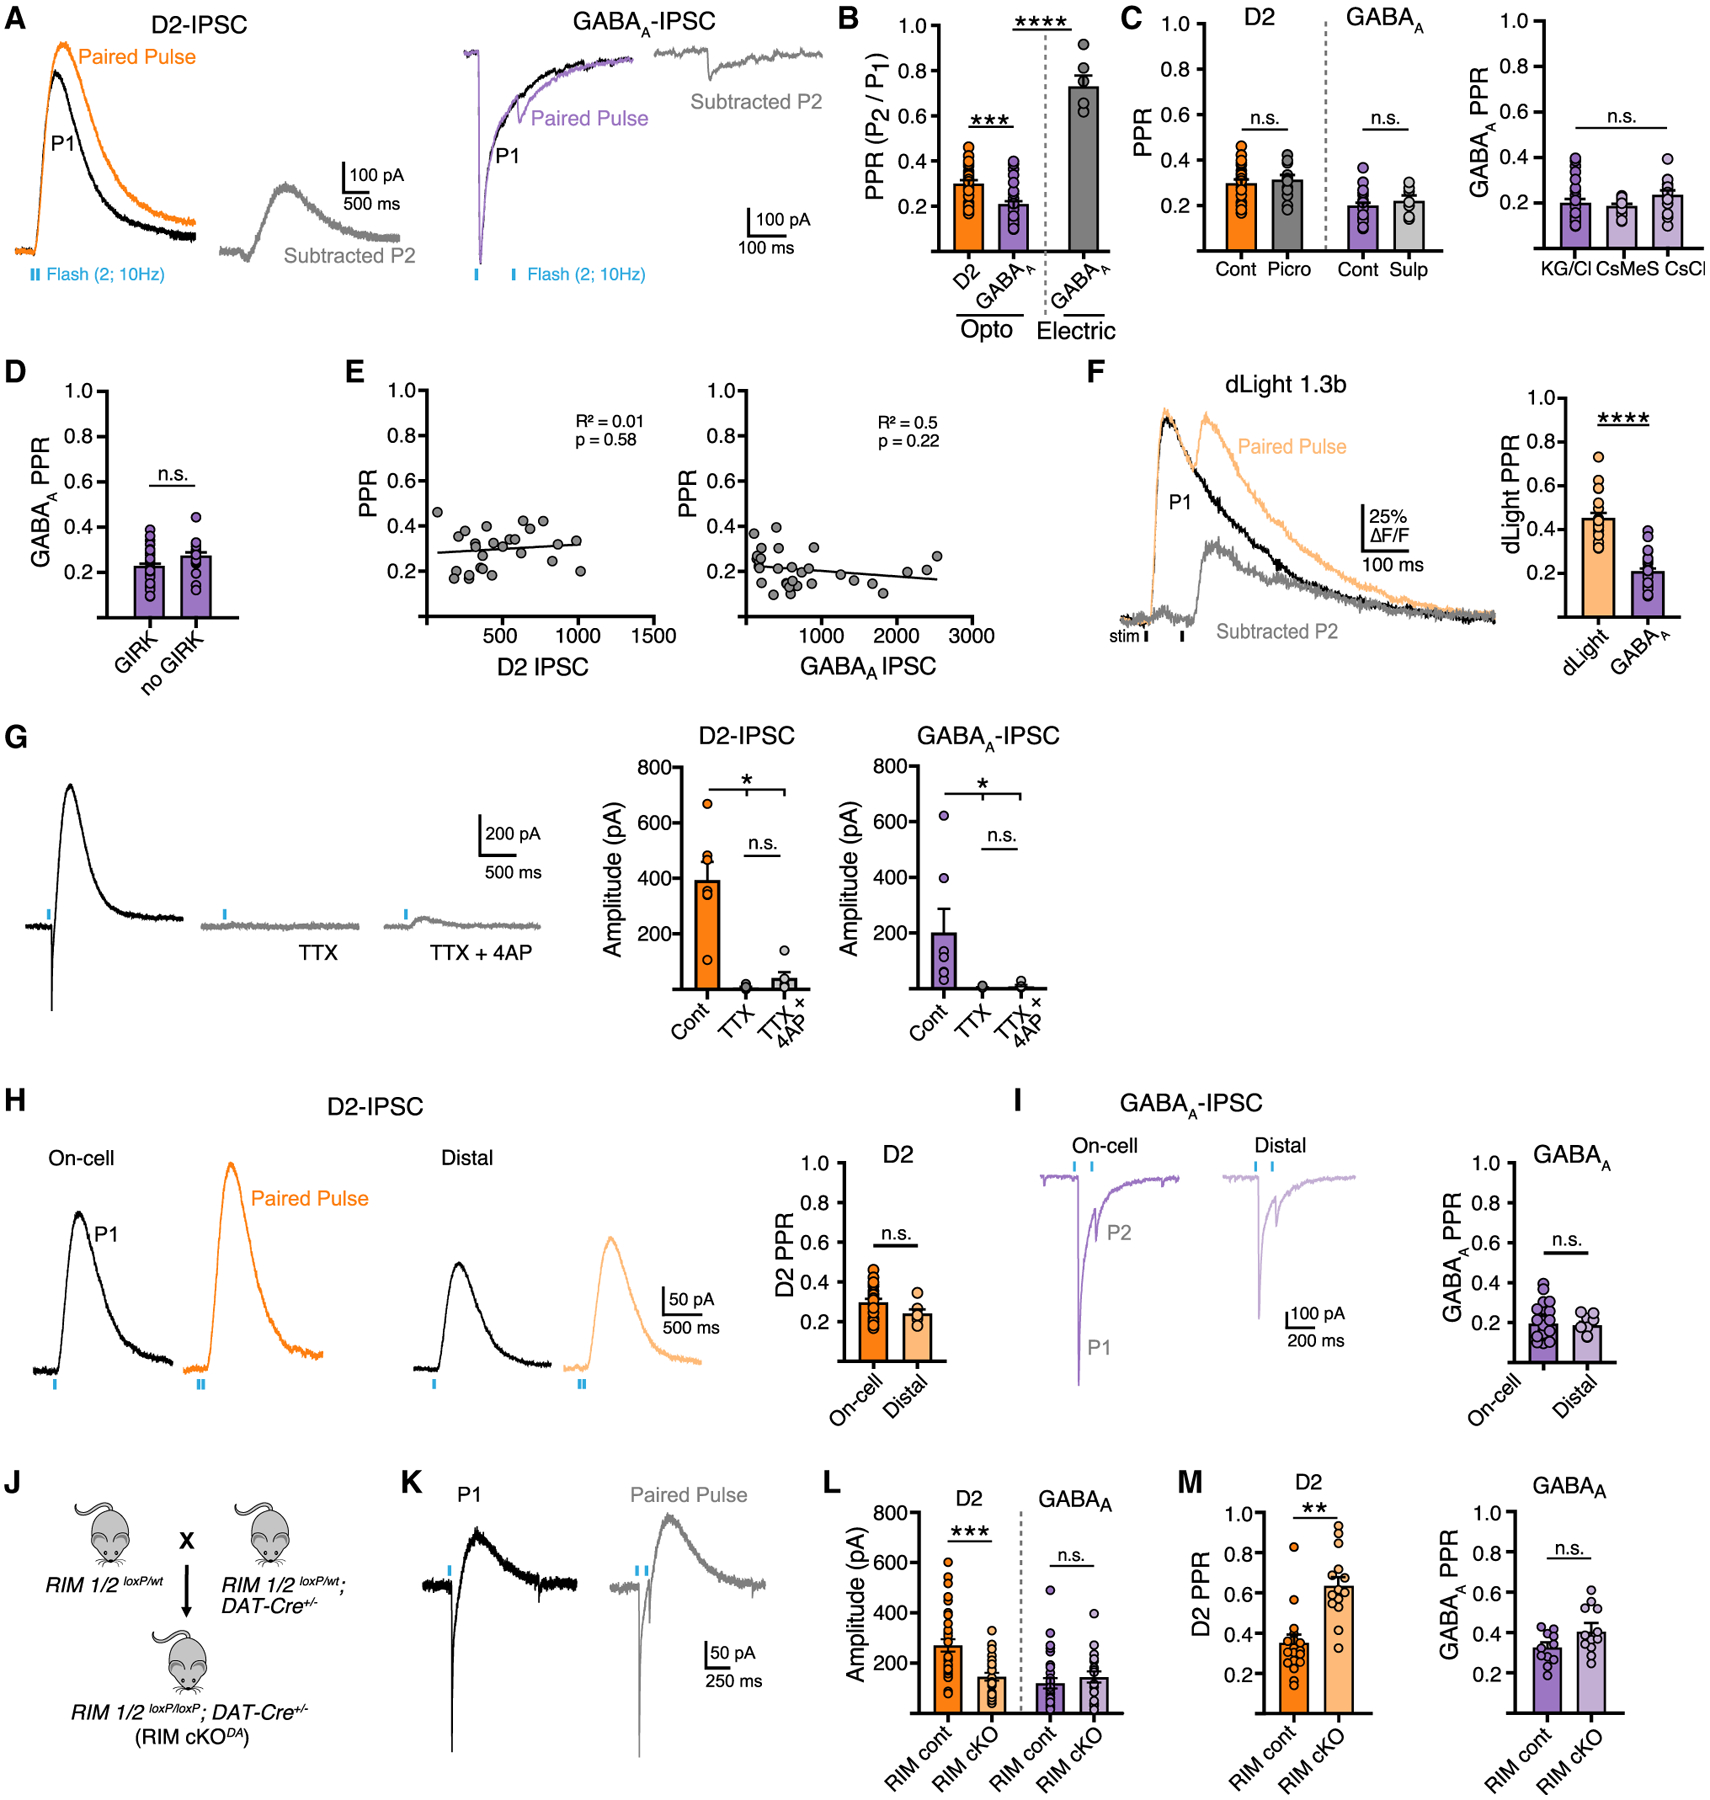
(A) Representative traces showing paired optogenetic stimulation at 100 ms ISI. The amplitude component of the second stimulus was measured by digitally subtracting the IPSC of a single optogenetic pulse from a paired-pulse stimulation to generate a subtracted second pulse amplitude (P2).
(B) Quantification of paired-pulse ratio (PPR) of optogenetically evoked D2 and GABAA-IPSCs and electrically evoked GABAA-IPSCs (n = 26/30/6, D2:GABAA, p < 0.001, Mann-Whitney; opto versus electrical, p < 0.001, Mann-Whitney).
(C) Summary of PPR in control conditions and in presence of indicated agonists (picrotoxin, sulpiride) and summary of GABAA PPR measured with KGCl, CsCl, or CsMeS internal recording solution (Cont/Picro, n = 14/7; KGCl/CsCl/CsMeS, n = 30/15/13, p > 0.05, Mann-Whitney).
(D) Summary of GABAA PPR in MSNs expressing or not expressing GIRK2 (n = 31/16, p > 0.05, Mann-Whitney).
(E) Scatter plot showing no correlation between amplitude and PPR of D2- or GABAA-IPSCs (n = 26/31, p > 0.05, Pearson correlation).
(F) Photometry traces of dLight1.3b fluorescence with single and paired-pulse stimulation and digitally subtracted P2 component. Summary data of PPR measured by dLight compared with GABAA-IPSCs (n = 20/32, p < 0.0001, Mann-Whitney).
(G) Representative traces and summary data of distal optogenetic stimulation (>200 μm from the recorded MSN soma) with application of TTX (500 nM) and 4-AP (100 μM).
(H) Single, paired-pulse, and subtracted P2 of D2-IPSCs optogenetically stimulated at the recorded MSN soma (on-cell) or >200 μm away (distal) (n = 26/7, p > 0.05, Mann-Whitney).
(I) Single, paired-pulse, and subtracted P2 of GABAA-IPSCs optogenetically stimulated at the recorded MSN soma (on-cell) or >200 μm away (distal) (n = 36/9, p > 0.05, Mann-Whitney).
(J) Generation of RIM cKODA mice (RIM1/2flx/flx; DAT-IRES-Cre).
(K) Representative traces of paired-pulse stimulation in RIM cKODA mice.
(L) Summary of D2- and GABAA-IPSC amplitudes in control and RIM cKODA mice (D2, n = 32/25, p < 0.001, Mann-Whitney; GABAA, n = 25/19, p > 0.05, Mann-Whitney).
(M) Summary data of PPR in control and RIM cKODA mice (D2, n = 21/15, p < 0.0001, Mann-Whitney; GABAA, n = 11/12, p > 0.05, Mann-Whitney). Summary data are mean ± SEM. ns, p > 0.05, *p < 0.05, **p < 0.01, ***p < 0.001, ****p < 0.0001. See Table S1.
To independently measure the release probability of DA while avoiding potential caveats of intracellular GPCR signaling, the PPR of DA release was measured by expressing dLight1.3b in the striatum. Using two-photon microscopy, two successive electrical stimuli were given (0.7 ms, 100 ms ISI) and the ΔF/F of dLight measured at hotspots of DA release. Similar to above, the PPR of DA release as measured by dLight was again greater than the PPR of GABAA-IPSCs, thus confirming that GABA co-release from DA terminals has a higher Pr than that of DA (Figure 5F).
To evoke solely action potential propagated release, we used stimulation with a narrowed spot of blue light centered >200 μm away from the soma of the recorded MSN. This limited direct terminal ChR2-mediated release as TTX abolished both D2- and GABAA-IPSCs and, unlike on-cell stimulation (Figure 1), was not rescued by the subsequent application of 4-AP (Figure 5G). Distal stimulation evoked PPRs of D2-IPSCs and GABAA-IPSCs that were similar to those evoked by stimulating on-cell (Figures 5H and 5I), indicating that the PPR measure is consistent whether release is stimulated proximal or distal to the MSN cell body. Together these data indicate that vesicular release of DA and GABA exhibit different release probabilities at D2 and GABAA synapses.
This difference in release probability might reflect differences in presynaptic active zone proteins mediating DA and GABA exocytosis. It has recently been shown that specialized machinery defines presynaptic dopaminergic secretory sites and the removal of RIM proteins disrupts the organization of these sites, diminishing the high Pr of DA release (Liu et al., 2018). To evaluate whether co-released GABA also relies on RIM proteins, we used mice in which RIM was conditionally knocked out from dopamine neurons (RIM cKODA). These mice were generated by crossing mice with floxed alleles for Rims1 and 2 (Kaeser et al., 2011) to DAT-IRES-Cre mice (Figure 5J). RIM cKODA mice were injected with AAV.DIO.ChR2.eYFP in the SNc and AAV.GIRK2.tdTomato in the striatum and DA terminals were again optogenetically stimulated with similar brief train of stimuli (1 ms duration, 100 ms ISI), while the resulting PPR was measured for D2-and GABAA-IPSCs. Consistent with previous studies (Liu et al., 2018), DA release was reduced (Figure 5L) and the PPR for D2-IPSCs was increased compared with littermate controls, confirming that RIM is needed for maintaining the high probability of striatal DA release (Figure 5M). Surprisingly, the amplitude and PPR of GABAA-IPSCs was unchanged in RIM cKODA animals, indicating that the release probability of co-released GABA from SNc terminals is unaffected by removal of RIM (Figure 5M). Together this suggests that the release machinery controlling DA exocytosis at putative active zone release sites differs from the sites where GABA is released.
Differential presynaptic modulation of DA and GABA release
The results thus far indicate that, although GABA and DA may both be loaded by VMAT2, co-transmission is independently regulated possibly by segregated active zone sites or different properties of release adjacent to postsynaptic GABAA or D2 receptors. As presynaptic GPCRs located near release sites are major modulators of neurotransmitter release, we next examined the functional consequences of independent regulation of GABA and DA release to see if neuromodulators may have differing actions on co-transmission. Activation of presynaptic Gi/o-coupled receptors, including GABAB receptors, κORs, and D2 autoreceptors, have been shown to inhibit evoked DA release (Benoit-Marand et al., 2001; Pitman et al., 2014; Schoffelmeer et al., 1997). It remains unknown, however, whether the co-transmission of GABA from DA terminals is similarly regulated by neuromodulators. To compare modulation by presynaptic D2 autoreceptors, we bath applied quinpirole (1 μM) to activate D2 autoreceptors and compared the reduction of DA and GABA release. As quinpirole activates postsynaptic D2 receptors, which occludes measuring changes in DA release via D2-IPSCs, changes in DA release were instead measured using fast-scan cyclic voltammetry (FSCV) (Figures 6A–6C). Quinpirole (1 μM) inhibited both evoked DA release and GABAA-IPSCs yet had greater effect on the release of DA (Figures 6B–6E). Thus, D2 autoreceptors more strongly modulate the release of DA than GABA.
Figure 6. Presynaptic D2 autoreceptors have a greater effect on the inhibition of DA release than GABA co-release.
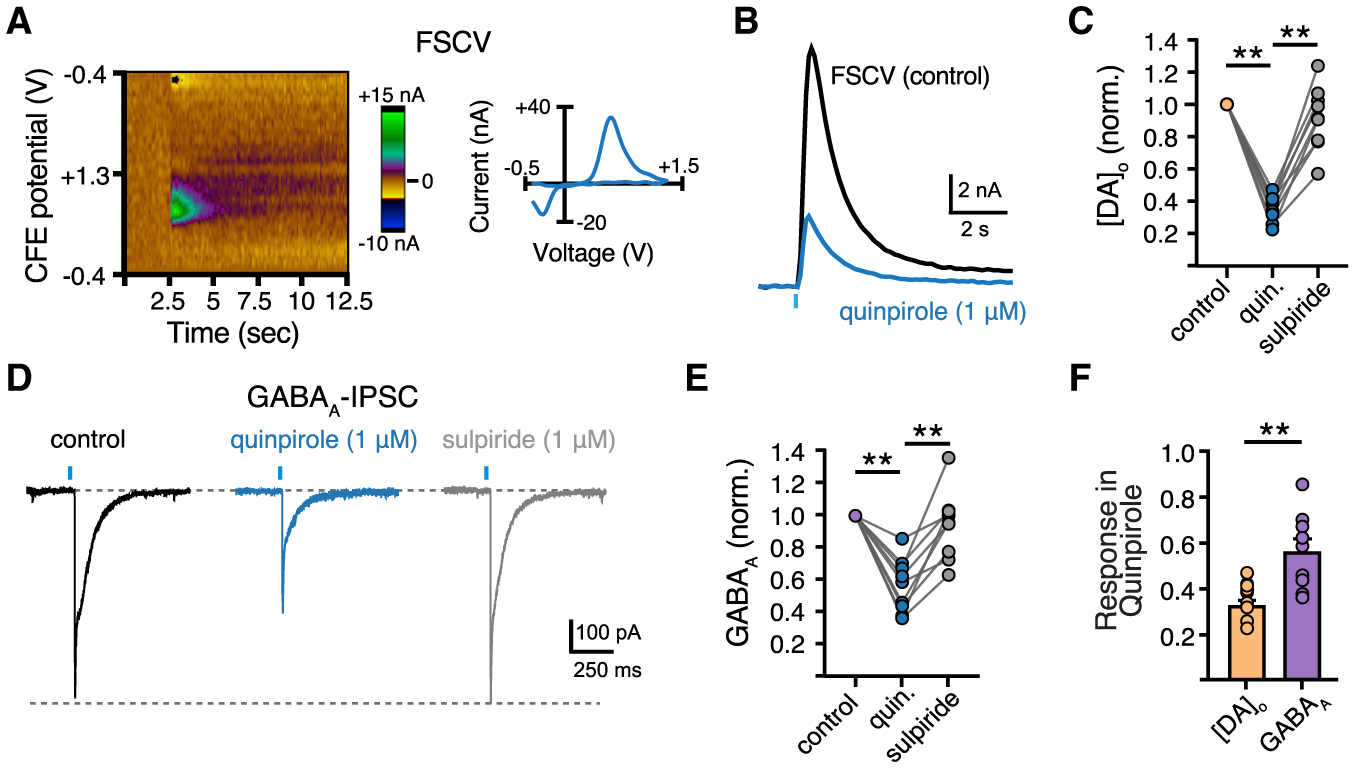
(A) Color plot representation of stimulated dopamine release and cyclic voltammogram.
(B) Representative FSCV traces measuring the [DA]o from a striatal brain slice in response to a single optogenetic stimulation in control and quinpirole (1 μM).
(C) Summary data of [DA]o in quinpirole (1 μM) and sulpiride (1 μM) normalized to control [DA]o (n = 9, p < 0.01, Mann-Whitney).
(D) Representative traces of GABAA-IPSC in control, quinpirole, and sulpiride.
(E) Summary of GABAA-IPSC amplitudes in quinpirole and sulpiride normalized to baseline amplitude of the same cell (n = 9, p < 0.01, Mann-Whitney).
(F) Summary data of quinpirole-induced reduction of D2- and GABAA-IPSC amplitudes (n = 9, p < 0.01, Mann-Whitney). Summary data are mean ± SEM. ns, p > 0.05, *p < 0.05, **p < 0.01, ***p < 0.001, ****p < 0.0001. See Table S1.
To determine whether DA and GABA co-release is also differentially modulated by other presynaptic metabotropic receptors, we next recorded the inhibition of D2- and GABAA-IPSCs by presynaptic GABAB receptor activation. Bath application of the GABAB receptor agonist, baclofen (10 μM), produced a greater decrease of D2-IPSC amplitude than GABAA-IPSC amplitude (Figure 7A), which was reversed by the GABAB receptor antagonist, CGP55845 (1 μM). Thus, like D2 autoreceptors, the activation of presynaptic GABAB receptors more strongly inhibits DA release than GABA release. Similar results were found by activating κORs as application of the κOR agonist, U-69593 (1 μM), also produced a greater reduction in D2-IPSC amplitude than GABAA-IPSC amplitude (Figure 7B). Inhibition was reversed by the opioid receptor antagonist, naloxone (1 μM). Neither baclofen nor U-69593 evoked direct outward postsynaptic currents in GIRK2+ D2-MSNs. Likewise, neither agonist altered D2 receptor-mediated currents evoked by application of exogenous DA via iontophoresis (Figures 7C–7E). This postsynaptic control indicates that activation of GABAB receptors and κORs on D2-MSNs do not contribute to the effect of U-69593 or baclofen on inhibition of D2-IPSCs. Together, these experiments reveal that presynaptic D2 autoreceptors, GABAB receptors, and κORs differentially modulate striatal DA and GABA co-release from SNc terminals.
Figure 7. Differential presynaptic modulation of DA and GABA release by GABAB and κ-opioid receptors.
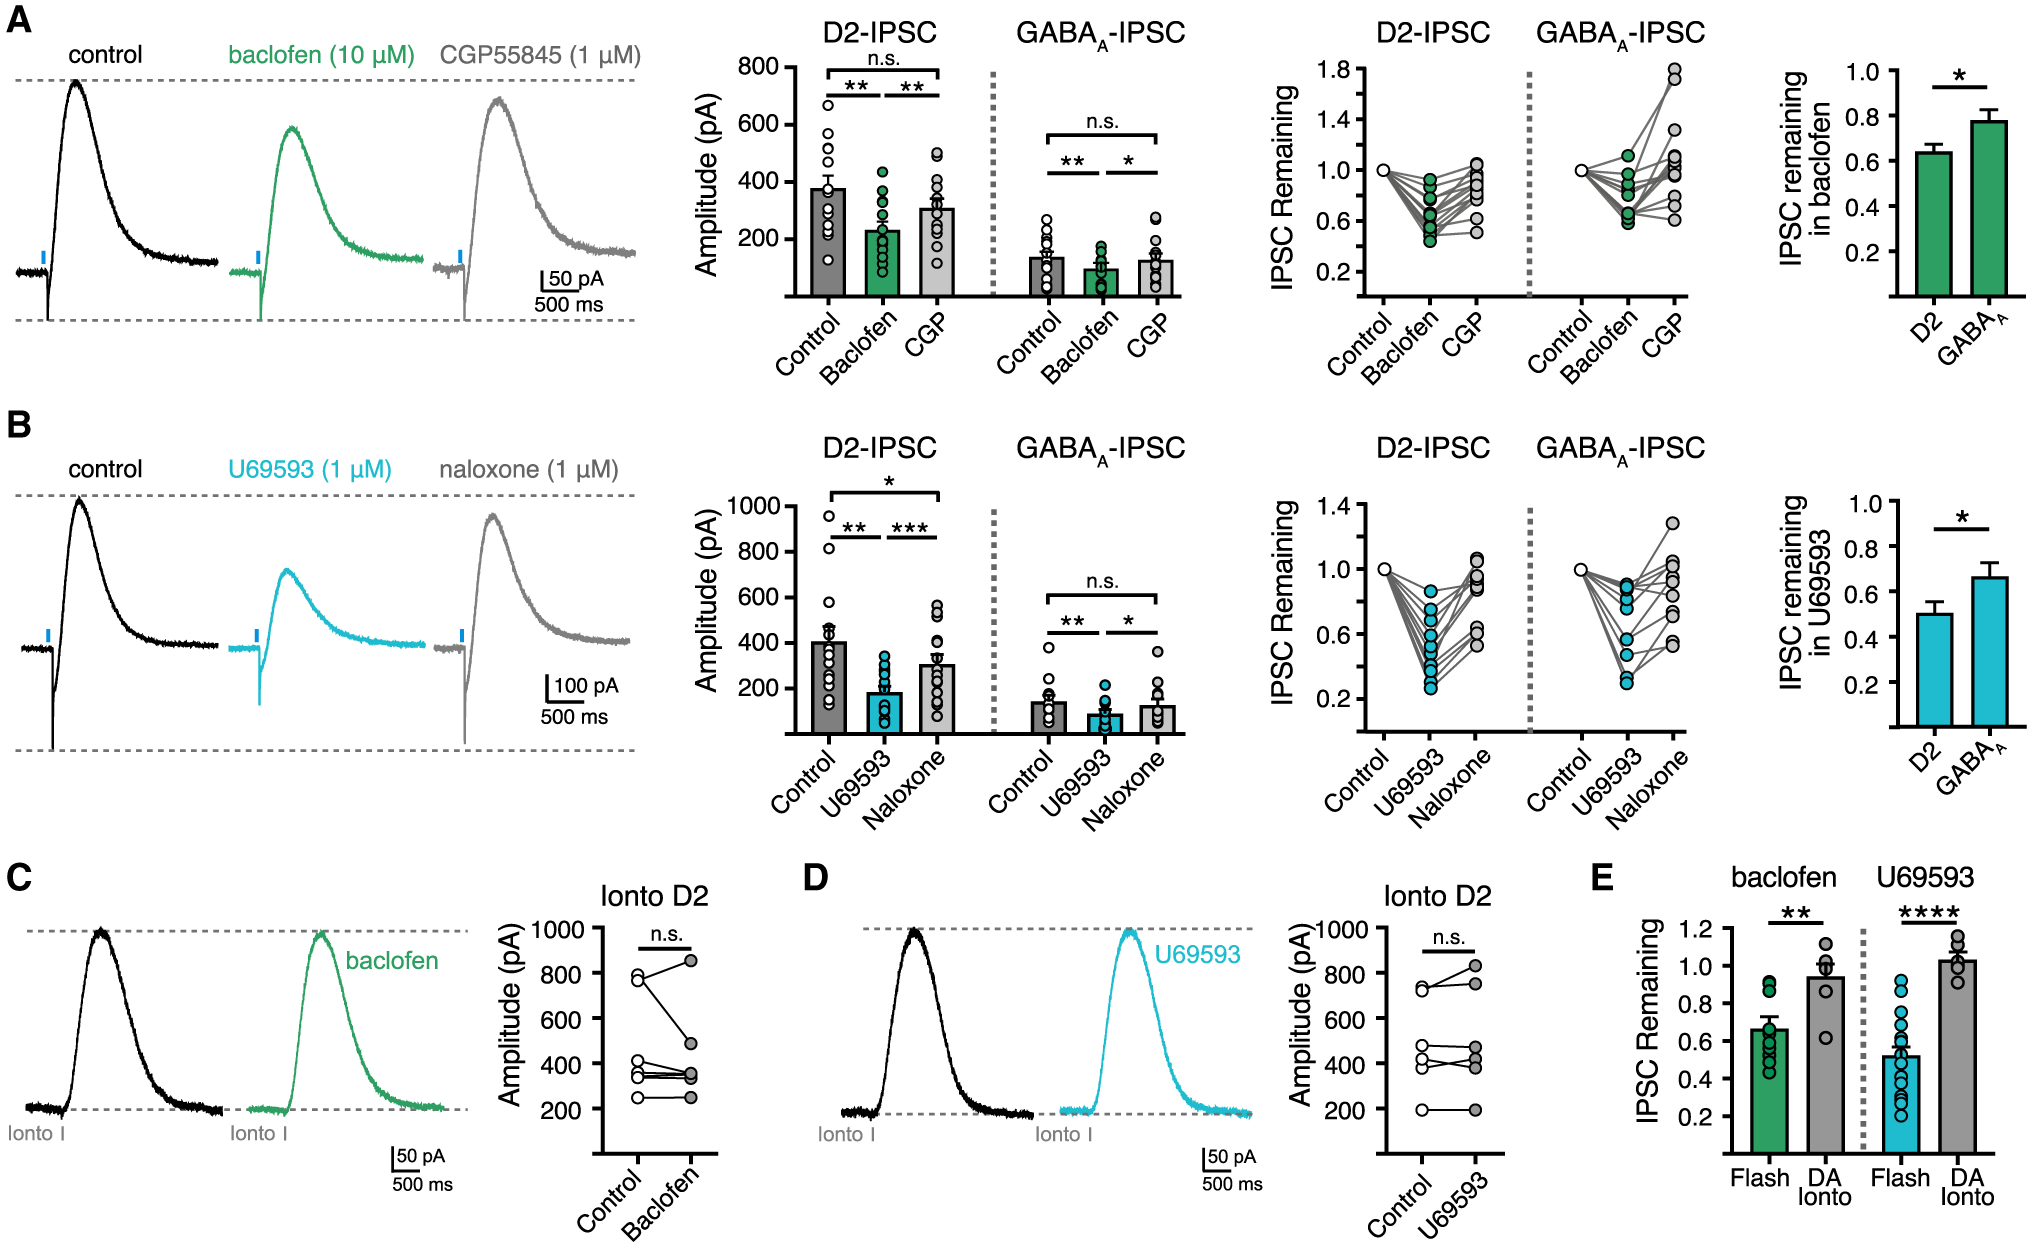
(A) Representative traces and summary data of D2 and GABAA-IPSCs in baclofen (10 μM) and CGP55845 (1 μM) (n = 14, p < 0.05, Mann-Whitney).
(B) Representative traces and summary data of D2 and GABAA-IPSCs in U69593 (1 μM) and naloxone (1 μM) (n = 11, p < 0.05, Mann-Whitney).
(C) Representative traces and summary data of D2-IPSCs evoked by iontophoretic application of DA in baclofen (10 μM) (n = 7, p > 0.05, Mann-Whitney).
(D) Representative traces and summary data of D2-IPSCs evoked by iontophoretic application of DA in U69593 (1 μM) (n = 6, p > 0.05, Mann-Whitney).
(E) Summary data of optogenetic and iontophoretic evoked D2-IPSCs normalized to control in the presence of baclofen or U69593 (baclofen, n = 14/7, p < 0.01, Mann-Whitney; U69593, n = 11/6, p < 0.0001, Mann-Whitney). Summary data are mean ± SEM. ns, p > 0.05, *p < 0.05, **p < 0.01, ***p < 0.001, ****p < 0.0001. See Table S1.
DISCUSSION
Throughout the nervous system, many cell types exhibit co-transmission of multiple neurotransmitters. Depending on the system and whether transmitters are packaged in the same or different vesicles, release can occur with similar or different properties (Adrover et al., 2014; Gras et al., 2008; Jonas et al., 1998; Ren et al., 2011; Sengupta et al., 2017; Silm et al., 2019; Takács et al., 2018). Dopamine neurons co-release multiple transmitters, including glutamate and GABA. DA and glutamate are packaged by separate transporters (VMAT2 and VGLUT2, respectively) and while these two transporters are present together on some vesicles, they are mostly expressed on separate vesicles and sort DA and glutamate into discrete vesicle populations (Fortin et al., 2019; Hnasko et al., 2010; Silm et al., 2019; Zhang et al., 2015). Here, we report that co-transmission can be independently regulated even for transmitters that are loaded by the same vesicular transporter. Despite VMAT2 packaging both DA and GABA into synaptic vesicles we found multiple instances where co-transmission was independently regulated, including different sensitivity to extracellular calcium concentration, cytosolic calcium chelation, release probabilities, and presynaptic modulation. Together these results suggest that DA and GABA co-transmission is differentially regulated through functionally separate vesicle populations or spatial segregation of discrete release sites targeting D2 or GABAA receptors.
Recent studies suggest that a high proportion of midbrain DA neurons are able to co-transmit GABA acquired through reuptake (Melani and Tritsch, 2022; Tritsch et al., 2014). As mGAT1 expression is found in nearly 90% of VMAT2+ midbrain cells (Tritsch et al., 2014) and is sufficient to supply co-released GABA, GABA co-release is likely a feature of most SNc DA neurons. However, it is unknown whether all DA neurons contribute to GABA signaling or whether it is restricted to subpopulations like glutamate co-transmission from DA neurons (Hnasko and Edwards, 2012; Zhang et al., 2015; Silm et al., 2019). It will be interesting to examine in the future how ubiquitous GABA co-release is among DA subpopulations. In addition, as the degree of uptake influences the amount of GABA co-released, cell-specific expression levels of mGATs may confer regional specificity to dopaminergic axonal arbors to control GABA co-transmission across the striatum. While DA and GABA are both packaged into vesicles by VMAT2, it is unknown whether they are loaded into the same vesicles, or somehow loaded separately into DA- or GABA-containing vesicles. Future studies will be necessary to examine the extent of DA and GABA co-storage within vesicle populations.
VMAT2, or a molecular complex requiring VMAT2, has been identified as the vesicular transporter necessary for GABA co-release (Tritsch et al., 2012). Studies on VMAT2 substrate affinity and inhibitor specificity have found different apparent affinities for various substrates and psychostimulants, including DA, 5-HT, histamine, MDMA, and MPP+ (Erickson et al., 1996; Gasnier et al., 1994; Peter et al., 1994); however, no studies have yet examined the affinity of VMAT2 for GABA. We found that while disrupting the proton gradient required for the VMAT2 transport cycle similarly reduced co-transmission, directly blocking VMAT2 itself with reserpine had a greater effect on release of DA than GABA. Given that GABA is structurally dissimilar to other VMAT2 substrates, as it lacks an aromatic ring and is a zwitterion at physiological pH, its affinity for VMAT2 and loading efficiency likely differs from dopamine. This, combined with the possibility that GABA or a co-factor facilitating GABA vesicular loading may be less sensitive to blockade of the substrate-binding site, may account for the reduced effect of reserpine on GABA release compared with DA. This difference could also be explained by differences in the recycling pool size and differing rates of depletion if DA and GABA occupy separate vesicle populations. While the quantal size of dopamine has been estimated previously (Jaffe et al., 1998; Pothos et al., 1998), the concentration of GABA within each co-released vesicle has yet to be determined. Catecholamine uptake into synaptic vesicles depends on the cytoplasmic concentration of the transmitters (Disbrow and Ruth, 1981), thus reducing the synthesis of DA resulted in an increase in GABA synaptic events, suggesting that DA and GABA may be at least partially packaged into overlapping vesicle populations by VMAT2. As dopamine synthesis enzymes (TH and AADC) and the plasmalemmal dopamine transporter (DAT) have been found to directly interact with secretory vesicles and VMAT2 (Cartier et al., 2010; Chen et al., 2003; Egana et al., 2009; Tsudzuki and Tsujita, 2004), some vesicles may be preferentially enriched with dopamine which could also allow for increased GABA loading when DA synthesis is impaired. This raises the possibility that VMAT2 may differentially load DA and GABA at separate locations and with unequal efficiencies due to site-specific interactions with synthetic enzymes or proximity to DAT or mGAT1 transporters.
The Ca2+ sensitivity and probability of neurotransmitter release depend on fusion machinery’s identity and proximity to VGCC, Ca2+ buffering capacity, and specific Ca2+ sensors mediating vesicle fusion. Our observation that DA exhibits greater sensitivity to extracellular [Ca2+] than GABA could reflect differences in any of these components of exocytosis. We ruled out differences in VGCCs as DA and GABA release depend similarly on N- and P/Q-type VGCCs. The exogenous Ca2+ chelators EGTA-AM and BAPTA-AM have comparable affinities but different binding rates, with BAPTA-AM binding 40x faster than EGTA-AM. The increased sensitivity of DA release to EGTA-AM and BAPTA-AM compared with GABA release suggests that the presynaptic arrangement of Ca2+ entry differs between active zones such that presynaptic Ca2+ channels are more loosely coupled to release machinery mediating DA release than GABA release. While synaptotagmin-1 has been identified as the calcium sensor for DA release (Banerjee et al., 2020), the calcium sensor mediating GABA co-transmission is unknown and warrants future investigation. In the striatum, pooling of co-released GABA shapes GABAA-IPSC decay kinetics (Tritsch et al., 2014), and while pooling could potentially account for some observed differences in DA and GABA release it did not alter the difference in D2- and GABAA-IPSCs in BAPTA-AM.
DA secretion is fast and exhibits a high Pr, necessitating an active zone scaffold that tethers DA-containing vesicles and mediates rapid release upon Ca2+ influx. In line with previous studies examining DA Pr measured by voltammetry and D2-IPSCs (Cragg, 2003; Liu et al., 2018), our measure of DA PPR confirms a high probability of vesicular DA release. Surprisingly, we found that co-released GABA exhibits a different and even higher Pr than DA. In addition to the greater calcium sensitivity of DA release, molecular differences at the presynaptic terminal likely also underlie the difference in Pr. At fast synapses RIM is essential for vesicle docking and priming, and controls release probability and the readily releasable pool by recruiting Munc13 to active zones (Andrews-Zwilling et al., 2006; Betz et al., 2001; Camacho et al., 2017; Deng et al., 2011; Imig et al., 2014; Kaeser et al., 2011). Recent work has identified RIM as a molecular scaffold for action potential-triggered release of DA (Liu et al., 2018). Comparing the Pr of DA and GABA in RIM cKODA mice revealed DA Pr to be decreased yet GABA Pr was unaffected, indicating that RIM maintains the release probability of DA but not GABA. This could be explained by distinct DA and GABA secretory sites where RIM is present and required at DA release sites and absent at GABA release sites. In addition, DA and GABA could occupy separate vesicle populations and the exocytosis of GABA vesicles may not require RIM for docking or scaffolding. Future work will be required to investigate these possibilities and determine the sorting mechanisms that allows for independent regulation of DA and GABA release sites.
Segregation of DA and GABA release may be regulated by target-derived signals, such that interactions with the postsynaptic compartment may drive specializations in presynaptic release mechanisms. Segregation of DA and glutamate within dopaminergic axonal terminals has been found to be induced by contact with ventral striatal neurons (Fortin et al., 2019), which may underlie the differences in release and recycling properties of DA and glutamate (Silm et al., 2019). Neurexins have recently been identified as key trans-synaptic regulators of DA transmission that also influence GABA co-transmission (Ducrot et al., 2021). Several cytoskeletal proteins associate with D2 receptors, including actin binding proteins and spinophilin to control surface expression of receptors, maintain their density, and regulate receptor signaling (Li et al., 2000; Smith et al., 1999). Likewise, GABAA receptor expression and localization is determined by specific scaffolding proteins, including gephyrin and neuroligin-2 (Poulopoulos et al., 2009; Varoqueaux et al., 2004). While GABAA receptor distribution has been determined at the ultrastructural level in MSNs, it remains unknown which receptor clusters potentially respond to co-released GABA. In the striatum, electron microscopy of immuno-labeled DA receptors has found D2 receptors to localize at both synaptic and extrasynaptic sites (Descarries et al., 1996; Sesack et al., 1994; Uchigashima et al., 2016; Yung et al., 1995). Furthermore, DA terminals form neurochemically mismatched contacts composed of dopaminergic presynaptic and GABAergic postsynaptic structures containing gephyrin, neuroligin-2, and GABAA receptors (Uchigashima et al., 2016). Thus, it is possible that dopamine neurons form discrete inputs to D2 and GABAA receptors on MSNs. Postsynaptic clustering of D2 and GABAA receptors and their associated scaffolding and trans-synaptic proteins may thus drive divergent properties of co-transmission and allow for DA and GABA signals to be differently regulated at segregated release sites opposing D2 or GABAA receptors. Further work will be necessary to examine the synaptic organization of DA and GABAA receptors relative to secretory sites to determine the potential role they may play in encoding DA and GABA release.
Activation of presynaptic GPCRs exerts neuromodulatory actions on synaptic transmission to adjust synaptic strength, regulate neuronal activity, and modify circuit output to shape behaviors. In the context of dopaminergic co-transmission, each neuromodulatory receptor we examined exerted a stronger inhibitory influence on DA release than GABA release, which may be due to differential expression of receptors or signaling efficacy at DA and GABA release sites. As GPCR signaling pathways regulate neurotransmission through multiple mechanisms and can be spatially restricted to local intracellular domains, particular second messenger actions or specific presynaptic compartments may also underlie differences in neuromodulation at DA and GABA release sites. Together, this supports the idea that specificity at active zones facilitating DA or GABA release arises from the identity of SNARE proteins and the organization of channels and receptors modulating vesicular exocytosis.
Together, these findings identify synaptic mechanisms by which DA and co-released GABA are independently regulated. The temporal dynamics of DA and GABA signaling differ by activating metabotropic and ionotropic postsynaptic receptors, respectively, thus driving postsynaptic effects over different timescales. In addition, the organization and independent modulation of DA and GABA release adds to the diversity in signaling by endowing dopamine neurons with dynamic and flexible control to shape striatal circuits and behavioral output.
Limitations of the study
Rather than directly measuring DA and GABA exocytosis, we instead detect the release of DA and GABA from measurements of postsynaptic receptor activation; thus, we are measuring DA and GABA transmission and inferring release properties from this. This could be confounded by the amount of spillover activating D2 and GABAA receptors. In addition, we are comparing the activation of metabotropic D2 receptors with ionotropic GABAA receptors that have different activation rates and possibly different ratiometric scaling of currents. While subtle differences in detection may exist, it is clear that the functional signaling properties of DA and GABA are different. Measuring the quantal release of DA and GABA from single release sites or single vesicles in future studies would elucidate the outstanding question of whether DA and GABA are packaged into separate or the same vesicles and the proportion of transmitter within vesicles.
STAR★METHODS
RESOURCE AVAILABILITY
Lead contact
Further information and requests for resources and reagents should be direct to and will be fulfilled by the lead contact, Christopher Ford (christopher.ford@cuanschutz.edu).
Materials availability
The study did not generate new unique reagents.
Data and code availability
All data reported in this paper will be shared by the lead contact upon request.
This paper does not report original code.
Any additional information required to reanalyze the data reported in this paper is available from the lead contact upon request.
EXPERIMENTAL MODEL AND SUBJECT DETAILS
Experimental models
All procedures were approved by and performed in accordance with guidelines of the Institutional Animal Care and Use Committee (IACUC) at University of Colorado School of Medicine. Animals were group-housed in a temperature- and humidity-controlled environment on a 12 h light-dark cycle, with water and food available ad libitum, and experiments were conducted during the light phase. Both male and female 6–8 week-old DAT-IRES-Cre heterozygote mice (IMSR_JAX: 006660, Slc6a3IRES-Cre) were used in experiments. Ai32 mice (IMSR_JAX: 012569, RCL-ChR2(H134R)/EYFP) were crossed with DAT-IRES-Cre mice to express ChR2 in dopamine cells. Mice lacking RIM 1 and RIM 2 proteins in dopamine cells (RIM cKODA) were generated by crossing RIM1 (RRID:IMSR_JAX: 015832, Rims1tm3Sud/J) and RIM2 (RRID:IMSR_JAX: 015833, Rims2tm1.1Sud/J) double floxed mice with DAT-IRES-Cre mice (Kaeser et al., 2011). RIM cKODA breeder pairs were provided by Pascal Kaeser.
METHOD DETAILS
Stereotaxic injection
For stereotaxic viral injections, postnatal day 21–28 male and female DAT-IRES-Cre heterozygote mice or RIM cKODA mice were anesthetized with isoflurane and mounted in a stereotaxic frame (Kopf Instruments). Using a Nanoject iii (Drummond Scientific), mice were injected with 400 nL AAV5.EF1a.DIO.hChR2 (H134R)-EYFP.WPRE.hGH (ChR2) into a single hemisphere of the SNc and 400 nL AAV9.hSyn.tdTomato.T2A.mGIRK2–1-A22A.WPRE.bGH (GIRK2) into the dorsal striatum of the same hemisphere. The following coordinates were used relative to bregma: SNc: (AP −2.3, ML +1, DV −4.7), striatum: (AP +1.2, ML +1.6, DV −3.2). For experiments requiring dLight, 400 nL of AAV9-Syn-dLight1.3b was injected into the striatum.
Slice preparation
Mice were anesthetized with isoflurane and transcardially perfused with ice-cold sucrose cutting solution containing (in mM): 75 NaCl, 2.5 KCl, 6 MgCl2, 0.1 CaCl2, 1.2 NaH2PO4, 25 NaHCO3, 2.5 D-glucose, 50 sucrose. Coronal striatal slices (240 μm) were cut in the same ice-cold sucrose cutting solution, bubbled with 95% O2 and 5% CO2. Slices were incubated for at least 45 min at 32°C in aCSF containing (in mM): 126 NaCl, 2.5 KCl, 1.2 MgCl2, 2.5 CaCl2, 1.2 NaH2PO4, 21.4 NaHCO3, 11.1 D-glucose and 10 μM MK-801, bubbled with 95% O2 and 5% CO2. Slices were then transferred to the recording chamber and continually perfused with aCSF warmed to 33 ± 2°C at a rate of 2 mL/min. Neurons were visualized using a BX51WI microscope (Olympus) with an infrared LED (Thorlabs).
Electrophysiology
All recordings were performed using an Axopatch 200B amplifier (Molecular Devices). Patch pipettes (1–2 MΩ) were made using a pipette puller (Narishige, PC-10). For experiments measuring D2-IPSCs or both D2- and GABAA-IPSCs simultaneously, pipettes for whole-cell recordings from MSNs contained (in mM): 67.5 D-gluconic acid (K), 67.5 KCl, 10 HEPES (K), 0.1 CaCl2, 2 MgCl2, 10 BAPTA, 0.1 mg/mL GTP, 1 mg/mL ATP, and 1.5 mg/mL phosphocreatine (pH 7.3, 280 mOsm). All MSNs were recorded in the central or lateral regions of the dorsal striatum. For experiments measuring GABAA-IPSCs only, pipettes for whole-cell recordings from MSNs contained (in mM): 135 CsCl, 10 HEPES (K), 0.1 CaCl2, 2 MgCl2, 0.1 EGTA, 0.1 mg/mL GTP, 1 mg/mL ATP, and 1.5 mg/mL phosphocreatine (pH 7.3, 280 mOsm), or CsMeS as noted: 135 CsMeS, 10 HEPES (K), 0.1 CaCl2, 2 MgCl2, 0.1 EGTA, 5.4 TEA, 0.1 mg/mL GTP, 1 mg/mL ATP, and 1.5 mg/mL phosphocreatine, 5 QX-314 (pH 7.3, 280 mOsm). Unless otherwise noted, aCSF contained DNQX (10 μM), CGP 55845 (300 nM), scopolamine (300 nM), dihydro-β-erythroidine (10 μM), and SCH 23390 (1 μM). Experiments testing GABAB receptor modulation did not include CGP 55845. Recordings were acquired with Axograph X (Axograph Scientific) at 10 kHz and filtered to 2 kHz. For whole-cell voltage-clamp MSN recordings, cells were held at a voltage of −60 mV, except for GABAA-IPSCs recorded in CsMeS which were held at 0 mV. No series resistance compensation was used and a cell was discarded if its series resistance exceeded 15 MΩ. To activate ChR-expressing dopamine axons, 470 nm blue light (1 ms duration) was used to produce wide-field illumination. All recordings from GIRK2+ MSNs were centered in DStr regions showing robust tdTomato reporter fluorescence, which limits the variability of D2-receptor mediated GIRK outward currents between cells and among animals (Gong et al., 2021). Where indicated, electrical stimulation was used to dopamine or GABA release using a monopolar glass stimulating electrode filled with aCSF positioned ~200 μm away from the recorded cell (0.7 ms, 20–40 μA). Dopamine was applied by iontophoresis (1 M, 160 nA ejection, 12–50 ms) with iontophoretic pipettes made using a horizontal puller (Sutter Instrument) placed ~10 μm away from the soma of the recorded cell. Leakage of dopamine was prevented with a retention current of 6–10 nA. Drugs were applied by bath perfusion. EGTA-AM, BAPTA-AM, ω-Conotoxin GVIA, and ω-Agatoxin TK (30 mL each) were bath perfused and recirculated using a Masterflex C/L pump and collection chamber bubbled with humidified carbogen. Recirculated drug solution was replaced every three cells. In low extracellular calcium experiments, to account for variability between cells, each cell was recorded in 1 mM and 2.5 mM extracellular Ca2+ concentrations after at least 5 min of bath application. Half of cells were recorded first in low Ca2+ with high Ca2+ bath applied, and half in high Ca2+ with low Ca2+ applied in order to counterbalance any potential run-down.
dLight dopamine imaging
2-photon imaging was performed using a 2-photon laser scanning microscopy system, custom-built on a BX51WI microscope (Olympus). A Ti:Sapphire laser (Chameleon Ultra I; Coherent) was tuned to emit pulsed excitation at 920 nm, and scanned using a pair of X-Y galvanometer mirrors (6215, Cambridge Technology). Emitted fluorescence was collected through a water-immersion objective (60X, Olympus), a dichroic mirror (T700LPXXR, Chroma) and filters (ET680sp and ET525/50 m-2P, Chroma), and was detected using a GaAsP photomultiplier tube (PMT, H10770PA-40, Hamamatsu). A current preamplifier (SR570, Stanford Research Systems) was used to convert the output to voltage, which was then digitized by a data acquisition card (PCI-6110, National Instruments). For dopamine imaging experiments, fluorescence changes of the dopamine sensor, dLight1.3b were measured using 2-photon non-raster scanning photometry using custom software (Toronado; https://github.com/StrowbridgeLab/Toronado-LaserScanning) as previously described (Pressler and Strowbridge, 2019). The laser was repeatedly scanned across small circular path (150 nm diameter) at a selected region of interest, and fluorescence was continuously collected from that spot. The PMT signal was converted by the same preamplifier (SR570, Stanford Research Systems; sensitivity 100 nA/V), but further filtered to 500 Hz with the gain increased two-fold (FLA-01, Cygnus Technologies). Then the signal was acquired using a data acquisition device (ITC-18, HEKA Instruments) and recorded using Axograph X (Axograph Scientific).
For calcium experiments, the dLight fluorescence signal was recorded in 2.5 mM calcium following a single electrical stimulation (1 ms, 30 μA) and again 10 min after bath application of 1 mM calcium. For PPR experiments, dLight fluorescence signal was measured during a paired electrical stimulation with 100 ms inter stimulus interval to evoke dopamine release.
FSCV
Carbon fiber electrodes (34–700, Goodfellow) were encased with a glass pipette (7 μm diameter and 50–100 μm length) and the tip of the carbon fiber was soaked in activated carbon-purified isopropanol for 20–30 min before using. The fiber tip was placed in the Striatum 30–70 μm below the surface of the slice. While holding the carbon fiber at −0.4 V, triangular waveforms (−0.4 to 1.3 V versus Ag/AgCl at 400 V/s) were applied to the fiber at 10 Hz. The peak concentration of dopamine was determined from the peak oxidation potential. DhβE (1 μM) was included in the recording solution for FSCV experiments.
Chemicals
Picrotoxin and MK-801 were from Abcam. CGP55845, DNQX, Dihydro-β-erythroidine hydrobromide, SCH 23390 hydrochloride, and sulpiride were obtained from Tocris Bioscience. BAPTA was obtained from Invitrogen. ω-Conotoxin GVIA and ω-Agatoxin TK were from Alomone Labs. All the other chemicals (α-methyl-DL-tyrosine, DEAB, TTX, 4-Aminopyridine, EGTA-AM, BAPTA-AM, scopolamine hydrobromide) were from Sigma-Aldrich.
QUANTIFICATION AND STATISTICAL ANALYSIS
Statistics
All data are shown as mean ± SEM. Statistical analyses were performed in Prism 8 (GraphPad). Statistical tests used for comparisons were non-Mann-Whitney U test, Student’s paired t test, Wilcoxon signed-rank test, and two-way ANOVA, as appropriate. The statistical significance was defined as p ≥ 0.05 (ns), p < 0.05 (*), p < 0.01 (**), p < 0.001 (***) and p < 0.0001 (****).
Supplementary Material
KEY RESOURCES TABLE
| REAGENT or RESOURCE | SOURCE | IDENTIFIER |
|---|---|---|
| Bacterial and virus strains | ||
| AAV5.EF1a.DIO.hChR2 (H134R)-EYFP | pAAV-EF1a-double floxed-hChR2(H134R)-EYFP-WPRE-HGHpA was a gift from Karl Deisseroth | Addgene plasmid: 20298 |
| AAV9.hSyn.tdTomato.T2A.mGIRK2–1 | Marcott et al., 2014 | Penn Vector Core: V3992 |
| AAV9-Syn-dLight1.3b | pAAV-syn-dLight1.3b was a gift from Lin Tian | Addgene plasmid: 135762 |
| Chemicals, peptides, and recombinant proteins | ||
| Picrotoxin | Abcam | Cat# 120315 |
| ω-Conotoxin GVIA | Alomone Labs | Cat# C-300 |
| ω-Agatoxin TK | Alomone Labs | Cat# STA-530 |
| BAPTA | Invitrogen | Cat# B1204 |
| MK-801 maleate | Abcam | Cat# 0924 |
| Scopolamine | Tocris | Cat# 1414 |
| SCH23390 | Tocris | Cat# 0925 |
| CGP55845 | Tocris | Cat#1248 |
| DHβE | Tocris | Cat# 2349 |
| DNQX | Tocris | Cat# 0189 |
| NMDA | Tocris | Cat# 2333 |
| Sulpiride | Tocris | Cat# 0895 |
| Quinpirole | Tocris | Cat# 1061 |
| Naloxone hydrochloride | Tocris | Cat# 0599 |
| Baclofen | Tocris | Cat# 0417 |
| TTX | Sigma-Aldrich | Cat# T8024 |
| 4-Aminopyridine | Sigma-Aldrich | Cat# A78403 |
| BAPTA-AM | Sigma-Aldrich | Cat# 196419 |
| EGTA-AM | Sigma-Aldrich | Cat# 324628 |
| α-methyl-DL-tyrosine | Sigma-Aldrich | Cat# 120693 |
| DEAB | Sigma-Aldrich | Cat# D86256 |
| scopolamine hydrobromide | Sigma-Aldrich | Cat# 1610001 |
| Experimental models: Organisms/strains | ||
| Mouse/DAT-IRES-Cre | Jackson Laboratory | JAX:006660 |
| Mouse/Ai32 | Jackson Laboratory | JAX: 012569 |
| Mouse/RIMcKO DA | Gift from Pascal Kaeser | JAX: 015832, JAX: 015833 |
| Software and algorithms | ||
| Axograph X | Axograph Scientific | RRID: SCR_014284; https://axograph.com |
| Lab Chart | ADInstruments | RRID: SCR_017551; https://www.adinstruments.com |
| Graphpad Prism 7 | GraphPad Software | RRID: SCR_002798; https://www.graphpad.com |
Highlights.
Co-transmission of dopamine and GABA is independently regulated
Dopamine and GABA release exhibit different probabilities and calcium sensitivity
RIM is not necessary for the high release probability of co-transmitted GABA
Presynaptic opioid, GABAB, and D2 receptors differently modulate DA and GABA release
ACKNOWLEDGMENTS
This work was funded by NIH grants R01-DA35821 (to C.P.F.), R01-NS95809 (to C.P.F.), R21-MH123085 (to C.P.F.), and F30 DA048543 (to S.M.Z.). We thank Pascal Kaeser for kindly providing RIM cKODA mice. We thank Michael Grybko for assisting with FSCV experiments.
Footnotes
DECLARATION OF INTERESTS
The authors declare no competing interests.
SUPPLEMENTAL INFORMATION
Supplemental information can be found online at https://doi.org/10.1016/j.celrep.2022.110823.
REFERENCES
- Adrover MF, Shin JH, and Alvarez VA (2014). Glutamate and dopamine transmission from midbrain dopamine neurons share similar release properties but are differentially affected by cocaine. J. Neurosci 34, 3183–3192. 10.1523/jneurosci.4958-13.2014. [DOI] [PMC free article] [PubMed] [Google Scholar]
- Andrews-Zwilling YS, Kawabe H, Reim K, Varoqueaux F, and Brose N (2006). Binding to Rab3A-interacting molecule RIM regulates the presynaptic recruitment of Munc13–1 and ubMunc13–2. J. Biol. Chem 281, 19720–19731. 10.1074/jbc.m601421200. [DOI] [PubMed] [Google Scholar]
- Banerjee A, Lee J, Nemcova P, Liu C, and Kaeser PS (2020). Synaptotagmin-1 is the Ca2+ sensor for fast striatal dopamine release. ELife 9, e58359. 10.7554/elife.58359. [DOI] [PMC free article] [PubMed] [Google Scholar]
- Beckstead MJ, Grandy DK, Wickman K, and Williams JT (2004). Vesicular dopamine release elicits an inhibitory postsynaptic current in midbrain dopamine neurons. Neuron 42, 939–946. 10.1016/j.neuron.2004.05.019. [DOI] [PubMed] [Google Scholar]
- Benoit-Marand M, Borrelli E, and Gonon F (2001). Inhibition of dopamine release via presynaptic D2 receptors: time course and functional characteristics in vivo. J. Neurosci 21, 9134–9141. 10.1523/jneurosci.21-23-09134.2001. [DOI] [PMC free article] [PubMed] [Google Scholar]
- Betz A, Thakur P, Junge HJ, Ashery U, Rhee J-S, Scheuss V, Rosenmund C, Rettig J, and Brose N (2001). Functional interaction of the active zone proteins Munc13–1 and RIM1 in synaptic vesicle priming. Neuron 30, 183–196. 10.1016/s0896-6273(01)00272-0. [DOI] [PubMed] [Google Scholar]
- Borst JGG, and Sakmann B (1996). Calcium influx and transmitter release in a fast CNS synapse. Nature 383, 431–434. 10.1038/383431a0. [DOI] [PubMed] [Google Scholar]
- Camacho M, Basu J, Trimbuch T, Chang S, Pulido-Lozano C, Chang S-S, Duluvova I, Abo-Rady M, Rizo J, and Rosenmund C (2017). Heterodimerization of Munc13 C2A domain with RIM regulates synaptic vesicle docking and priming. Nat. Commun 8, 15293. 10.1038/ncomms15293. [DOI] [PMC free article] [PubMed] [Google Scholar]
- Cartier EA, Parra LA, Baust TB, Quiroz M, Salazar G, Faundez V, Egaña L, and Torres GE (2010). A biochemical and functional protein complex involving dopamine synthesis and transport into synaptic vesicles. J. Biol. Chem 285, 1957–1966. 10.1074/jbc.m109.054510. [DOI] [PMC free article] [PubMed] [Google Scholar]
- Chen BT, and Rice ME (2001). Novel Ca2+ dependence and time course of somatodendritic dopamine release: substantia nigra versus striatum. J. Neurosci 21, 7841–7847. 10.1523/jneurosci.21-19-07841.2001. [DOI] [PMC free article] [PubMed] [Google Scholar]
- Chen R, Wei J, Fowler SC, and Wu J-Y (2003). Demonstration of functional coupling between dopamine synthesis and its packaging into synaptic vesicles. J. Biomed. Sci 10, 774–781. 10.1007/bf02256330. [DOI] [PubMed] [Google Scholar]
- Chuhma N, Mingote S, Moore H, and Rayport S (2014). Dopamine neurons control striatal cholinergic neurons via regionally heterogeneous dopamine and glutamate signaling. Neuron 81, 901–912. 10.1016/j.neuron.2013.12.027. [DOI] [PMC free article] [PubMed] [Google Scholar]
- Condon AF, Robinson BG, Asad N, Dore TM, Tian L, and Williams JT (2021). The residence of synaptically released dopamine on D2 autoreceptors. Cell Rep. 36, 109465. 10.1016/j.celrep.2021.109465. [DOI] [PMC free article] [PubMed] [Google Scholar]
- Condon MD, Platt NJ, Zhang Y-F, Roberts BM, Clements MA, Vietti-Michelina S, Tseu M-Y, Brimblecombe KR, Threlfell S, Mann EO, and Cragg SJ (2019). Plasticity in striatal dopamine release is governed by release-independent depression and the dopamine transporter. Nat. Commun 10, 4263. 10.1038/s41467-019-12264-9. [DOI] [PMC free article] [PubMed] [Google Scholar]
- Courtney NA, and Ford CP (2014). The timing of dopamine- and noradrenaline-mediated transmission reflects underlying differences in the extent of spillover and pooling. J. Neurosci 34, 7645–7656. 10.1523/jneurosci.0166-14.2014. [DOI] [PMC free article] [PubMed] [Google Scholar]
- Cragg SJ (2003). Variable dopamine release probability and short-term plasticity between functional domains of the primate striatum. J. Neurosci 23, 4378–4385. 10.1523/jneurosci.23-10-04378.2003. [DOI] [PMC free article] [PubMed] [Google Scholar]
- Deng L, Kaeser PS, Xu W, and Südhof TC (2011). RIM proteins activate vesicle priming by reversing autoinhibitory homodimerization of Munc13. Neuron 69, 317–331. 10.1016/j.neuron.2011.01.005. [DOI] [PMC free article] [PubMed] [Google Scholar]
- Descarries L, Watkins KC, Garcia S, Bosler O, and Doucet G (1996). Dual character, asynaptic and synaptic, of the dopamine innervation in adult rat neostriatum: a quantitative autoradiographic and immunocytochemical analysis. J. Comp. Neurol 375, 167–186. . [DOI] [PubMed] [Google Scholar]
- Disbrow JK, and Ruth JA (1981). Greatly extended viability of rat brain storage vesicles in an intracellular medium based upon a non-permeant polyanion. Life Sci. 29, 1989–1996. 10.1016/0024-3205(81)90608-1. [DOI] [PubMed] [Google Scholar]
- Ducrot C, Carvalho GD, Delignat-Lavaud B, Delmas CVL, Giguère N, Mukherjee S, Burke-Nanni S, Bourque M-J, Parent M, Chen LY, et al. (2021). Neurexins regulate GABA co-release by dopamine neurons. Preprint at bioRxiv. 10.1101/2021.10.17.464666. [DOI] [Google Scholar]
- Egana LA, Cuevas RA, Baust TB, Parra LA, Leak RK, Hochendoner S, Pena K, Quiroz M, Hong WC, Dorostkar MM, et al. (2009). Physical and functional interaction between the dopamine transporter and the synaptic vesicle protein synaptogyrin-3. J. Neurosci 29, 4592–4604. 10.1523/jneurosci.4559-08.2009. [DOI] [PMC free article] [PubMed] [Google Scholar]
- Eggermann E, Bucurenciu I, Goswami SP, and Jonas P (2011). Nanodo-main coupling between Ca2+ channels and sensors of exocytosis at fast mammalian synapses. Nat. Rev. Neurosci 13, 7–21. 10.1038/nrn3125. [DOI] [PMC free article] [PubMed] [Google Scholar]
- Erickson JD, Schafer MK, Bonner TI, Eiden LE, and Weihe E (1996). Distinct pharmacological properties and distribution in neurons and endocrine cells of two isoforms of the human vesicular monoamine transporter. Proc. Natl. Acad. Sci. U S A 93, 5166–5171. 10.1073/pnas.93.10.5166. [DOI] [PMC free article] [PubMed] [Google Scholar]
- Ford CP, Phillips PEM, and Williams JT (2009). The time course of dopamine transmission in the ventral tegmental area. J. Neurosci 29, 13344–13352. 10.1523/jneurosci.3546-09.2009. [DOI] [PMC free article] [PubMed] [Google Scholar]
- Ford CP, Gantz SC, Phillips PEM, and Williams JT (2010). Control of extracellular dopamine at dendrite and axon terminals. J. Neurosci 30, 6975–6983. 10.1523/jneurosci.1020-10.2010. [DOI] [PMC free article] [PubMed] [Google Scholar]
- Fortin GM, Ducrot C, Giguère N, Kouwenhoven WM, Bourque M-J, Pacelli C, Varaschin RK, Brill M, Singh S, Wiseman PW, and Trudeau LE (2019). Segregation of dopamine and glutamate release sites in dopamine neuron axons: regulation by striatal target cells. FASEB J. 33, 400–417. 10.1096/fj.201800713rr. [DOI] [PubMed] [Google Scholar]
- Gasnier B, Krejci E, Botton D, Massoulié J, and Henry JP (1994). Expression of a bovine vesicular monoamine transporter in COS cells. FEBS Lett. 342, 225–229. 10.1016/0014-5793(94)80506-7. [DOI] [PubMed] [Google Scholar]
- Gong S, Fayette N, Heinsbroek JA, and Ford CP (2021). Cocaine shifts dopamine D2 receptor sensitivity to gate conditioned behaviors. Neuron 109, 3421–3435.e5. 10.1016/j.neuron.2021.08.012. [DOI] [PMC free article] [PubMed] [Google Scholar]
- Gras C, Amilhon B, Lepicard ÈM, Poirel O, Vinatier J, Herbin M, Dumas S, Tzavara ET, Wade MR, Nomikos GG, et al. (2008). The vesicular glutamate transporter VGLUT3 synergizes striatal acetylcholine tone. Nat. Neurosci 11, 292–300. 10.1038/nn2052. [DOI] [PubMed] [Google Scholar]
- Hnasko TS, and Edwards RH (2012). Neurotransmitter corelease: mechanism and physiological role. Annu. Rev. Physiol 74, 225–243. 10.1146/annurev-physiol-020911-153315. [DOI] [PMC free article] [PubMed] [Google Scholar]
- Hnasko TS, Chuhma N, Zhang H, Goh GY, Sulzer D, Palmiter RD, Rayport S, and Edwards RH (2010). Vesicular glutamate transport promotes dopamine storage and glutamate corelease in vivo. Neuron 65, 643–656. 10.1016/j.neuron.2010.02.012. [DOI] [PMC free article] [PubMed] [Google Scholar]
- Imig C, Min S-W, Krinner S, Arancillo M, Rosenmund C, Südhof TC, Rhee J, Brose N, and Cooper BH (2014). The morphological and molecular nature of synaptic vesicle priming at presynaptic active zones. Neuron 84, 882. 10.1016/j.neuron.2014.11.003. [DOI] [PubMed] [Google Scholar]
- Jaffe EH, Marty A, Schulte A, and Chow RH (1998). Extrasynaptic vesicular transmitter release from the somata of substantia nigra neurons in rat midbrain slices. J. Neurosci 18, 3548–3553. 10.1523/jneuro-sci.18-10-03548.1998. [DOI] [PMC free article] [PubMed] [Google Scholar]
- Jonas P, Bischofberger J, and Sandkühler J (1998). Corelease of two fast neurotransmitters at a central synapse. Science 281, 419–424. 10.1126/science.281.5375.419. [DOI] [PubMed] [Google Scholar]
- Joyce MP, and Rayport S (2000). Mesoaccumbens dopamine neuron synapses reconstructed in vitro are glutamatergic. Neuroscience 99, 445–456. 10.1016/s0306-4522(00)00219-0. [DOI] [PubMed] [Google Scholar]
- Kaeser PS, Deng L, Wang Y, Dulubova I, Liu X, Rizo J, and Südhof TC (2011). RIM proteins tether Ca2+ channels to presynaptic active zones via a direct PDZ-domain interaction. Cell 144, 282–295. 10.1016/j.cell.2010.12.029. [DOI] [PMC free article] [PubMed] [Google Scholar]
- Kim J-I, Ganesan S, Luo SX, Wu Y-W, Park E, Huang EJ, Chen L, and Ding JB (2015). Aldehyde dehydrogenase 1a1 mediates a GABA synthesis pathway in midbrain dopaminergic neurons. Science 350, 102–106. 10.1126/science.aac4690. [DOI] [PMC free article] [PubMed] [Google Scholar]
- Li M, Bermak JC, Wang ZW, and Zhou QY (2000). Modulation of dopamine D(2) receptor signaling by actin-binding protein (ABP-280). Mol. Pharmacol 57, 446–452. 10.1124/mol.57.3.446. [DOI] [PubMed] [Google Scholar]
- Liu C, Kershberg L, Wang J, Schneeberger S, and Kaeser PS (2018). Dopamine secretion is mediated by sparse active zone-like release sites. Cell 172, 706–718.e15. 10.1016/j.cell.2018.01.008. [DOI] [PMC free article] [PubMed] [Google Scholar]
- Marcott PF, Mamaligas AA, and Ford CP (2014). Phasic dopamine release drives rapid activation of striatal D2-receptors. Neuron 84, 164–176. 10.1016/j.neuron.2014.08.058. [DOI] [PMC free article] [PubMed] [Google Scholar]
- Marcott PF, Gong S, Donthamsetti P, Grinnell SG, Nelson MN, New-man AH, Birnbaumer L, Martemyanov KA, Javitch JA, and Ford CP (2018). Regional heterogeneity of D2-receptor signaling in the dorsal striatum and nucleus accumbens. Neuron 98, 575–587.e4. 10.1016/j.neuron.2018.03.038. [DOI] [PMC free article] [PubMed] [Google Scholar]
- Markwardt SJ, Wadiche JI, and Overstreet-Wadiche LS (2009). Input-specific GABAergic signaling to newborn neurons in adult dentate gyrus. J. Neurosci 29, 15063–15072. 10.1523/jneurosci.2727-09.2009. [DOI] [PMC free article] [PubMed] [Google Scholar]
- Matsuda W, Furuta T, Nakamura KC, Hioki H, Fujiyama F, Arai R, and Kaneko T (2009). Single nigrostriatal dopaminergic neurons form widely spread and highly dense axonal arborizations in the neostriatum. J. Neurosci 29, 444–453. 10.1523/jneurosci.4029-08.2009. [DOI] [PMC free article] [PubMed] [Google Scholar]
- Melani R, and Tritsch NX (2022). Inhibitory co-transmission from midbrain dopamine neurons relies on presynaptic GABA uptake. Cell Reports 39,110716. [DOI] [PMC free article] [PubMed] [Google Scholar]
- Pan P-Y, and Ryan TA (2012). Calbindin controls release probability in ventral tegmental area dopamine neurons. Nat. Neurosci 15, 813–815. 10.1038/nn.3099. [DOI] [PMC free article] [PubMed] [Google Scholar]
- Patriarchi T, Cho JR, Merten K, Howe MW, Marley A, Xiong W-H, Folk RW, Broussard GJ, Liang R, Jang MJ, et al. (2018). Ultrafast neuronal imaging of dopamine dynamics with designed genetically encoded sensors. Science 360, eaat4422. 10.1126/science.aat4422. [DOI] [PMC free article] [PubMed] [Google Scholar]
- Peter D, Jimenez J, Liu Y, Kim J, and Edwards RH (1994). The chromaffin granule and synaptic vesicle amine transporters differ in substrate recognition and sensitivity to inhibitors. J. Biol. Chem 269, 7231–7237. 10.1016/s0021-9258(17)37272-1. [DOI] [PubMed] [Google Scholar]
- Phillips PEM, Hancock PJ, and Stamford JA (2002). Time window of autoreceptor-mediated inhibition of limbic and striatal dopamine release. Synapse 44, 15–22. 10.1002/syn.10049. [DOI] [PubMed] [Google Scholar]
- Pitman KA, Puil E, and Borgland SL (2014). GABA(B) modulation of dopamine release in the nucleus accumbens core. Eur. J. Neurosci 40, 3472–3480. 10.1111/ejn.12733. [DOI] [PubMed] [Google Scholar]
- Pothos EN, Davila V, and Sulzer D (1998). Presynaptic recording of quanta from midbrain dopamine neurons and modulation of the quantal size. J. Neurosci 18, 4106–4118. 10.1523/jneurosci.18-11-04106. 1998. [DOI] [PMC free article] [PubMed] [Google Scholar]
- Poulin J-F, Zou J, Drouin-Ouellet J, Kim K-YA, Cicchetti F, and Awatramani RB (2014). Defining midbrain dopaminergic neuron diversity by single-cell gene expression profiling. Cell Rep. 9, 930–943. 10.1016/j.celrep.2014.10.008. [DOI] [PMC free article] [PubMed] [Google Scholar]
- Poulopoulos A, Aramuni G, Meyer G, Soykan T, Hoon M, Papadopoulos T, Zhang M, Paarmann I, Fuchs C, Harvey K, et al. (2009). Neuroligin 2 drives postsynaptic assembly at perisomatic inhibitory synapses through gephyrin and collybistin. Neuron 63, 628–642. 10.1016/j.neuron.2009.08.023. [DOI] [PubMed] [Google Scholar]
- Pressler RT, and Strowbridge BW (2019). Functional specialization of inter-neuron dendrites: identification of action potential initiation zone in axonless olfactory bulb granule cells. J. Neurosci 39, 9674–9688. 10.1523/jneurosci.1763-19.2019. [DOI] [PMC free article] [PubMed] [Google Scholar]
- Ren J, Qin C, Hu F, Tan J, Qiu L, Zhao S, Feng G, and Luo M (2011). Habenula “cholinergic” neurons co-release glutamate and acetylcholine and activate postsynaptic neurons via distinct transmission modes. Neuron 69, 445–452. 10.1016/j.neuron.2010.12.038. [DOI] [PubMed] [Google Scholar]
- Riven I, Iwanir S, and Reuveny E (2006). GIRK channel activation involves a local rearrangement of a preformed G protein channel complex. Neuron 51, 561–573. 10.1016/j.neuron.2006.08.017. [DOI] [PubMed] [Google Scholar]
- Schoffelmeer ANM, Hogenboom F, and Mulder AH (1997). κ1- and κ2-opioid receptors mediating presynaptic inhibition of dopamine and acetylcholine release in rat neostriatum. Br. J. Pharmacol 122, 520–524. 10.1038/sj.bjp.0701394. [DOI] [PMC free article] [PubMed] [Google Scholar]
- Sengupta A, Bocchio M, Bannerman DM, Sharp T, and Capogna M (2017). Control of amygdala circuits by 5-HT neurons via 5-HT and glutamate cotransmission. J. Neurosci 37, 1785–1796. 10.1523/jneurosci.2238-16.2016. [DOI] [PMC free article] [PubMed] [Google Scholar]
- Sesack SR, Aoki C, and Pickel VM (1994). Ultrastructural localization of D2 receptor-like immunoreactivity in midbrain dopamine neurons and their striatal targets. J. Neurosci 14, 88–106. 10.1523/jneurosci.14-01-00088.1994. [DOI] [PMC free article] [PubMed] [Google Scholar]
- Sheng J, He L, Zheng H, Xue L, Luo F, Shin W, Sun T, Kuner T, Yue DT, and Wu L-G (2012). Calcium-channel number critically influences synaptic strength and plasticity at the active zone. Nat. Neurosci 15, 998–1006. 10.1038/nn.3129. [DOI] [PMC free article] [PubMed] [Google Scholar]
- Silm K, Yang J, Marcott PF, Asensio CS, Eriksen J, Guthrie DA, New-man AH, Ford CP, and Edwards RH (2019). Synaptic vesicle recycling pathway determines neurotransmitter content and release properties. Neuron 102, 786–800.e5. 10.1016/j.neuron.2019.03.031. [DOI] [PMC free article] [PubMed] [Google Scholar]
- Smith FD, Oxford GS, and Milgram SL (1999). Association of the D2 dopamine receptor third cytoplasmic loop with spinophilin, a protein phosphatase-1-interacting protein. J. Biol. Chem 274, 19894–19900. 10.1074/jbc.274.28.19894. [DOI] [PubMed] [Google Scholar]
- Sulzer D, Joyce MP, Lin L, Geldwert D, Haber SN, Hattori T, and Ray-port S (1998). Dopamine neurons make glutamatergic synapses in vitro. J. Neurosci 18, 4588–4602. 10.1523/jneurosci.18-12-04588.1998. [DOI] [PMC free article] [PubMed] [Google Scholar]
- Sungkaworn T, Jobin M-L, Burnecki K, Weron A, Lohse MJ, and Calebiro D (2017). Single-molecule imaging reveals receptor–G protein interactions at cell surface hot spots. Nature 550, 543–547. [DOI] [PubMed] [Google Scholar]
- Takács VT, Cserép C, Schlingloff D, Pósfai B, Szoőnyi A, Sos KE, Környei Z, Dénes Á, Gulyás AI, Freund TF, and Nyiri G (2018). Co-transmission of acetylcholine and GABA regulates hippocampal states. Nat. Commun 9, 2848. 10.1038/s41467-018-05136-1. [DOI] [PMC free article] [PubMed] [Google Scholar]
- Touhara KK, and MacKinnon R (2018). Molecular basis of signaling specificity between GIRK channels and GPCRs. ELife 7. 10.7554/elife.42908. [DOI] [PMC free article] [PubMed] [Google Scholar]
- Tritsch NX, Ding JB, and Sabatini BL (2012). Dopaminergic neurons inhibit striatal output through non-canonical release of GABA. Nature 490, 262–266. 10.1038/nature11466. [DOI] [PMC free article] [PubMed] [Google Scholar]
- Tritsch NX, Oh W-J, Gu C, and Sabatini BL (2014). Midbrain dopamine neurons sustain inhibitory transmission using plasma membrane uptake of GABA, not synthesis. Elife 3, e01936. 10.7554/elife.01936. [DOI] [PMC free article] [PubMed] [Google Scholar]
- Tsudzuki T, and Tsujita M (2004). Isoosmotic isolation of rat brain synaptic vesicles, some of which contain tyrosine hydroxylase. J. Biochem 136, 239–243. 10.1093/jb/mvh113. [DOI] [PubMed] [Google Scholar]
- Uchigashima M, Ohtsuka T, Kobayashi K, and Watanabe M (2016). Dopamine synapse is a neuroligin-2–mediated contact between dopaminergic presynaptic and GABAergic postsynaptic structures. Proc. Natl. Acad. Sci. U S A 113, 4206–4211. 10.1073/pnas.1514074113. [DOI] [PMC free article] [PubMed] [Google Scholar]
- Varoqueaux F, Jamain S, and Brose N (2004). Neuroligin 2 is exclusively localized to inhibitory synapses. Eur. J. Cell Biol 83, 449–456. 10.1078/0171-9335-00410. [DOI] [PubMed] [Google Scholar]
- Yelin R, and Schuldiner S (1995). The pharmacological profile of the vesicular monoamine transporter resembles that of multidrug transporters. FEBS Lett. 377, 201–207. 10.1016/0014-5793(95)01346-6. [DOI] [PubMed] [Google Scholar]
- Yung KK, Bolam JP, Smith AD, Hersch SM, Ciliax BJ, and Levey AI (1995). Immunocytochemical localization of D1 and D2 dopamine receptors in the basal ganglia of the rat: light and electron microscopy. Neuroscience 65, 709–730. 10.1016/0306-4522(94)00536-e. [DOI] [PubMed] [Google Scholar]
- Zhang S, Qi J, Li X, Wang H-L, Britt JP, Hoffman AF, Bonci A, Lupica CR, and Morales M (2015). Dopaminergic and glutamatergic microdomains in a subset of rodent mesoaccumbens axons. Nat. Neurosci 18, 386–392. 10.1038/nn.3945. [DOI] [PMC free article] [PubMed] [Google Scholar]
Associated Data
This section collects any data citations, data availability statements, or supplementary materials included in this article.
Supplementary Materials
Data Availability Statement
All data reported in this paper will be shared by the lead contact upon request.
This paper does not report original code.
Any additional information required to reanalyze the data reported in this paper is available from the lead contact upon request.