

Abstract
Falls pose a tremendous risk to those over 65 and most falls occur during locomotion. Older adults commonly walk slower, which many believe helps improve walking stability. While increased gait variability predicts future fall risk, increased variability is also caused by walking slower. Thus, we need to better understand how differences in age and walking speed independently affect dynamic stability during walking. We investigated if older adults improved their dynamic stability by walking slower, and how leg strength and flexibility (passive ROM) affected this relationship. Eighteen active healthy older and 17 healthy younger adults walked on a treadmill for 5 minutes each at each of 5 speeds (80-120% of preferred). Local divergence exponents and maximum Floquet multipliers (FM) were calculated to quantify each subject’s inherent local dynamic stability. The older subjects walked with the same preferred walking speeds as the younger subjects (p = 0.860). However, these older adults still exhibited greater local divergence exponents (p<0.0001) and higher maximum FM (p<0.007) than the young adults at all walking speeds. These older adults remained more locally unstable (p<0.04) even after adjusting for declines in both strength and ROM. In both age groups, local divergence exponents decreased at slower speeds and increased at faster speeds (p<0.0001). Maximum FM showed similar changes with speed (p<0.02). Both younger and older adults exhibited decreased instability by walking slower, in spite of increased variability. These increases in dynamic instability might be more sensitive indicators of future fall risk than changes in gait variability.
Keywords: Falls, Aging, Gait, Stability, Speed
1. Introduction
The injuries associated with falls are the primary cause of accidental deaths in those over 65 (Sterling et al., 2001) and most of these falls occur during locomotion (Berg et al., 1997; Niino et al., 2000). Slower speeds are common among older adults and more pronounced in those with locomotor impairments (Alexander, 1996). Slow gait speeds predicted prospective fall risk in some studies (Bergland et al., 2003). In others, increased gait variability, but not slow speed, predicted future risk of falls (Maki, 1997; Hausdorff et al., 2001). However, variability does not quantify stability in terms of sensitivity to perturbations (Dingwell and Cusumano, 2000). What is needed is a better understanding of how differences in both age and walking speed affect dynamic stability.
Older people may walk slower because of physical constraints, like decreased strength (DeVita and Hortobagyi, 2000) and/or flexibility (Kerrigan et al., 2001), that prevent them from walking faster. Decreased leg strength in the elderly correlated with poorer functional walking performance related to balance control (Moxley Scarborough et al., 1999) and increased relative muscular demand during obstacle crossing (Hahn et al., 2005). Decreased leg muscle strength also discriminated elderly who fell after a perturbation from those who did not (Pijnappels et al., 2008). Conversely, while strength training increased walking speed in older adults (Chandler et al., 1998; Holviala et al., 2006), this did not reduce their fall risk (Chandler et al., 1998). In fact, faster walking speeds may instead increase fall risk in older adults (Berg et al., 1997; Pavol et al., 1999; van den Bogert et al., 2002). Conversely, walking slower may be a pro-active strategy to improve walking stability (Shkuratova et al., 2004). Patients with diabetic neuropathy who did not exhibit significant strength or flexibility declines, walked slower and exhibited slightly decreased local dynamic instability (Dingwell et al., 2000), despite increased gait variability (Dingwell and Cavanagh, 2001). When walking speed was directly manipulated in young adults, slower speeds similarly lead to decreased local dynamic instability, despite increased variability (Dingwell and Marin, 2006; England and Granata, 2007). Thus, a better understanding of how age-related declines in strength and flexibility interact with changes in walking speed to affect walking stability is also needed.
Surprisingly, while slower speeds and increased gait variability are both commonly reported in older populations, no study to date has directly examined how changes in walking speed affect variability and/or dynamic stability in older adults. We recently demonstrated that very healthy active elderly who walk at the same preferred speeds as younger adults still exhibit greater variability (Kang and Dingwell, 2008). This was only partly explained by their decreased strength and flexibility.
The purpose of this study was therefore to determine if the older adults tested in (Kang and Dingwell, 2008) also improved their dynamic stability by walking slower. We hypothesized that these older adults would exhibit greater local dynamic instability than young adults, even at the same walking speeds. We also hypothesized that these older adults would exhibit decreased instability at slower speeds and greater instability at faster speeds, as do young adults (Dingwell and Marin, 2006; England and Granata, 2007). Finally, we hypothesized that differences in local dynamic stability between young and older adults would be explained by changes in leg strength and range of motion (Kang and Dingwell, 2008).
2. Methods
Eighteen healthy older adults (age 65-85) and 18 height-, weight-, and gender-matched young adults (age 18-28), participated after signing an institutionally approved informed consent form (Table 1) (Kang and Dingwell, 2008). Subjects were screened to exclude anyone who reported any history of recent lower extremity injuries or disabilities, any visible gait asymmetries, or were taking any medications that might influence their ability to walk.
Table 1.
Subject Characteristics
| Young adults | Older Adults | p-value | |
|---|---|---|---|
| Gender (M/F) | 12/5* | 12/6 | 0.80** |
| Age (years) | 23.3 ± 2.6 | 72.1 ± 6.0 | <0.0001 |
| Height (m) | 1.73 ± 0.094 | 1.70 ± 0.104 | 0.36 |
| Body Mass (kg) | 71.1 ± 9.86 | 73.2 ± 12.3 | 0.58 |
| Body Mass Index (BMI) | 23.5 ± 1.7 | 25.4 ± 3.2 | 0.07 |
|
| |||
| Preferred Walking Speed (m/s) | 1.30 ± 0.10 | 1.29 ± 0.15 | 0.86 |
| PWS Range (m/s) | 1.16 – 1.56 | 0.93 – 1.52 | |
| Composite Strength score | 3.07 ± 3.71 | −4.29 ± 2.35 | <0.0001 |
| Composite ROM score | 1.89 ±1.81 | −2.03 ± 2.78 | <0.0001 |
Reflects the number after the data for one young subject were discarded due to technical problems
χ2 test
Bilateral hip, knee, and ankle passive ranges of motion were measured using a goniometer. Bilateral isometric strength (joint torque) of the hip flexors, extensors, knee flexors, extensors, dorsiflexors and plantarflexors were measured using a hand-held dynamometer (Lafayette Instrument Company, Lafayette IN) (Smidt, 1994). Composite “Strength” and range of motion (“ROM”) scores were defined for each subject using Principal Components Analysis (Dingwell and Cavanagh, 2001; Daffertshofer et al., 2004). Each score was defined as the 1st principal component of each set of individual measures. This yielded the linear combination of those measures that explained the most variance in the data (Kang and Dingwell, 2008).
Subjects walked on a level treadmill (Desmo S model, Woodway USA, Waukesha WI) while wearing a safety harness (Protecta International, Houston TX) that allowed natural arm swing. Subjects wore their own comfortable walking shoes. Each subject’s preferred walking speed (PWS) was determined using an established protocol (Dingwell and Marin, 2006). This also allowed subjects to acclimate to the treadmill and warm-up. Subjects then completed two 5-minute walking trials at each of 5 speeds, from 0.8×PWS to 1.2×PWS. The order of presentation was pseudo-randomized to avoid consecutive fast trials to minimize fatigue. Subjects rested at least 2 minutes between trials. Subjects were instructed to look straight ahead and avoid extraneous movements. All data from one young subject, and 1 trial from one older subject were discarded due to technical problems. A second older subject could not complete one of the 1.2×PWS trials, so this trial was also discarded.
Trunk kinematics were tracked using a Vicon 612 motion analysis system (Oxford Metrics, London UK) with six markers placed on the left and right acromia, C7 and T10 spinal processes, and the spines of each scapulae. Trunk motions were studied because maintaining dynamic stability of the upper body is a primary objective of human locomotion (Prince et al., 1994). Markers were also placed on both feet to track heel-strike events. The variability of these subjects walking kinematics was reported previously (Kang and Dingwell, 2008).
Marker kinematics were low-pass filtered with a cutoff of 10 Hz using a zero-lag Butterworth filter. Linear trunk motions were defined using a virtual center marker, defined as the average location of the six torso markers (Kang and Dingwell, 2006). This minimized the effects of measurement noise and non-rigid behavior (subtle bending, raising the shoulders, twisting, etc.) of the trunk. 3D trunk rotations were defined using the Cardan Y-x’-z’’ (tilt-obliquity-rotation) convention relative to the laboratory reference frame (Goldstein et al., 2001). Velocities and accelerations were calculated using the standard 3-point difference formula to reduce non-stationarities in the displacement data (Dingwell and Marin, 2006). All state variables were then low-pass filtered with a cutoff of 10 Hz using a zero-lag Butterworth filter. These variables formed a 12-dimensional state space (e.g., Figs. 1A and 1B):
| (1) |
Figure 1.

Schematic Representation of State-space Construction. (A) The original time series of raw data define the states (q1, q2, …) of the system. (B) These states are combined to form the system’s trajectory in state space (only a 3-dimensional state space is shown here used for illustrative purposes). (C) Expanded view of a typical local region. A small perturbation moves the system at S(t) to its closest neighbor S(t*). Local divergence is computed by measuring the Euclidean distances between the subsequent points, denoted dj(i). The local dynamic stability of the system is defined by how quickly, on average, the two trajectories diverge away from each other. Rates of divergence, λ*S and λ*L, were calculated from the slopes of the mean log divergence curve (Eq. 2). (D) Poincaré sections are defined to be orthogonal to the mean (i.e., limit) cycle. The system state, Sk, at stride k evolves to Sk+1 one stride later. Floquet multipliers quantify, on average, whether the distances between these states and the system fixed point, S*, grow or decay after one cycle (Eq. 5).
The dynamic coupling between limb segments (Zajac and Gordon, 1989) ensures that while leg movements were not measured directly, these motions influenced the measured trunk segment motions and were thus captured by our analyses. Likewise, human standing and walking can be well described by as few as five state variables (Dingwell and Cusumano, 2000) and/or muscle synergies (Ivanenko et al., 2007; Torres-Oviedo and Ting, 2007). Thus, this 12-dimensional S(t) adequately described walking dynamics (Kang and Dingwell, 2006).
Humans naturally experience many small perturbations during normal walking. These include both external (e.g., environmental and/or sensory) perturbations and internal perturbations created by neuromuscular noise (Faisal et al., 2008). These perturbations manifest themselves as the natural variations exhibited during walking. The trunk’s responses to these small inherent perturbations were quantified in two ways (Dingwell et al., 2007). First, Local dynamic stability (Fig. 1C) of walking was quantified (Dingwell and Cusumano, 2000). Euclidean distances between neighboring trajectories in state space were computed as a function of time (Fig. 1C) and averaged over many original pairs of initially nearest neighbors (Rosenstein et al., 1993). Local divergence exponents, , were estimated from the slopes of linear fits to these curves:
| (2) |
Where was the Euclidean distance between the jth pair of initially nearest neighbors after i discrete time steps (i.e. iΔt seconds) and denotes the average over all values of j (Rosenstein et al., 1993). Positive exponents indicate local instability, with larger exponents indicating greater instability.
Since the intrinsic time scales (i.e., average stride times) were different for each subject, the time axes of these curves were re-scaled by multiplying by the average stride frequency for each subject. Short-term exponents, , were calculated from the slopes of linear fits to the divergence curves between 0 and 1 stride. Long-term exponents, , were calculated as the slopes between 4 and 10 strides (Fig. 1C) (Dingwell et al., 2000; Dingwell and Marin, 2006).
Second, Orbital stability was quantified by calculating maximum Floquet Multipliers (FM) using established techniques (Hurmuzlu et al., 1996; Donelan et al., 2004). First, we defined a Poincaré section (Fig. 1D) at each percent of the gait cycle (0% to 100%), where 0% defined left heel strike. The system state (Eq. 1), Sk, for each stride, k, at that Poincaré section evolved to the state at the following stride, Sk+1, according to the Poincaré map:
| (3) |
We defined the limit cycle trajectory as the average trajectory across all strides within a trial. This produced a single fixed point in each Poincaré section:
| (4) |
We then computed the effects of small perturbations away from these fixed points, using a linearized approximation of Eq. (3):
| (5) |
For had 12 eigenvalues. Conversely, the Poincaré section occupied an sub-space of S. However, since and were both constrained to lie in the Poincaré section (Fig. 1D), the last (i.e., 12th) eigenvalue of had a value of ~0 and was spurious. Therefore, the first 11 eigenvalues of defined the Floquet Multipliers that quantified how much small perturbations in the Poincaré section grew or diminished by the next cycle. If the FM all have magnitude < 1, perturbations on average shrink by the next stride, and the system remains stable. We computed the magnitudes of the maximum FM for Poincaré sections at 0%, 25%, 50%, and 75% of the gait cycle (Dingwell and Kang, 2007; Dingwell et al., 2007).
The two local divergence exponents, and , and four maximum FM were compared between age groups and speeds using a general linear model analysis of variance (ANOVA) using SPSS 14 (SPSS, Chicago IL). Differences in ability to maintain dynamic stability could be due to differences in strength and/or flexibility. Therefore, these analyses were repeated as analyses of covariance (ANCOVA), including the composite Strength and ROM scores as covariates.
3. Results
The older adults did exhibit lower composite strength and ROM scores than the young adults (p < 0.0001; Table 1). However, the preferred walking speeds (PWS) of the older adults tested in this study were no different than those of the young adults (p = 0.86; Table 1). These older adults did walk with shorter stride times and slightly shorter step lengths than the young adults (Figure 2), even at the same walking speeds.
Figure 2.
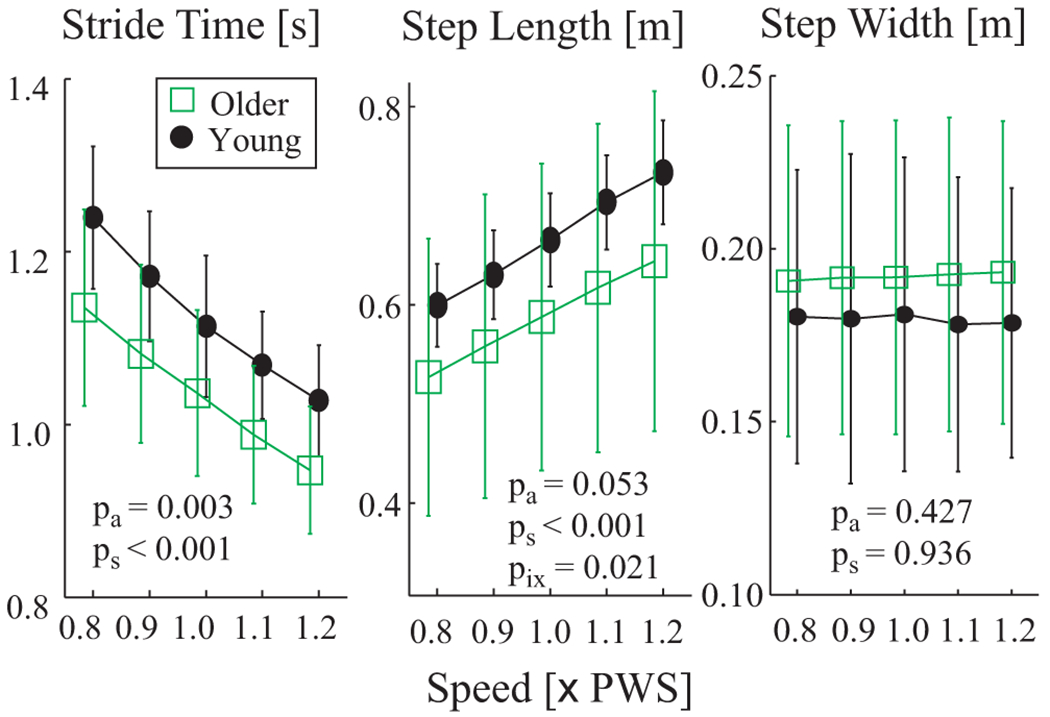
Spatio-temporal gait metrics vs. walking speed. 1.0×PWS is preferred walking speed. Error bars denote between-subject standard deviations within each group. Note that symbols for Older and Young groups have been offset slightly for clarity. ANOVA results for differences between age groups (pa), walking speeds (ps) and group × speed interactions (pix) are shown. Older adults exhibited shorter stride times at all 5 walking speeds. They also exhibited slightly shorter step lengths, but the differences did not quite reach statistical significance.
Both younger and older adults exhibited positive local divergence (Fig. 3A), consistent with local instability, similar to previous results (Dingwell and Marin, 2006; Kang and Dingwell, 2006; England and Granata, 2007). We note that for “chaotic” systems, these curves should be straight over a reasonably long time scale, where the slope of that straight line approximates the maximum finite-time Lyapunov exponent for the system (Rosenstein et al., 1993). The curves we obtained were clearly not linear. Therefore, human walking is most likely not “chaotic” (Kantz and Schreiber, 2004), even though it is locally unstable (Dingwell and Kang, 2007).
Figure 3.

(A) Sample local divergence curves for the 1.0×PWS walking speed for each age group. Solid lines are group averages. Dashed lines indicate ±1 between-subject standard deviation bands. The slopes of these curves define local dynamic stability (Fig. 1C). (B) Local divergence exponents (λ*) vs. Speed and Age. Error bars denote standard deviations within each group. Note that symbols for Older and Young groups have been offset slightly for clarity. Older adults exhibited greater short-term (λ*S; p < 10−13), but not long-term (λ*L; p = 0.192) local instability. Both groups exhibited decreased local dynamic instability at slower speeds and increased instability at faster speeds (p < 0.001).
Divergence curves for older adults showed slightly greater magnitudes. However, it is the rates of divergence, or slopes, that determine local stability. Short-term divergence exponents, , were larger in older adults (p < 10−13; Fig. 3B). Thus, the older adults were more locally unstable than the younger subjects. For both groups, increased with speed (p < 0.001), but this effect was more pronounced in the older adults (interaction p = 0.007). Long-term divergence exponents, did not differ between age groups (p = 0.192), but did increase with speed (p < 0.001; Fig. 3B). Slower walking speeds led to improved local dynamic stability in both the younger and older subjects.
Short-term divergence exponents, , were correlated with both Strength and ROM scores (Fig. 4), indicating that lower Strength and ROM were both associated with increased instability. However, the differences between age groups for remained significant even after Strength (p < 10−8), ROM (p < 10−9), or both composite scores (p < 10−6) were included as covariates (Table 2). Thus, differences in strength and range of motion did not explain all of the differences in local dynamic stability between younger and older subjects.
Figure 4.
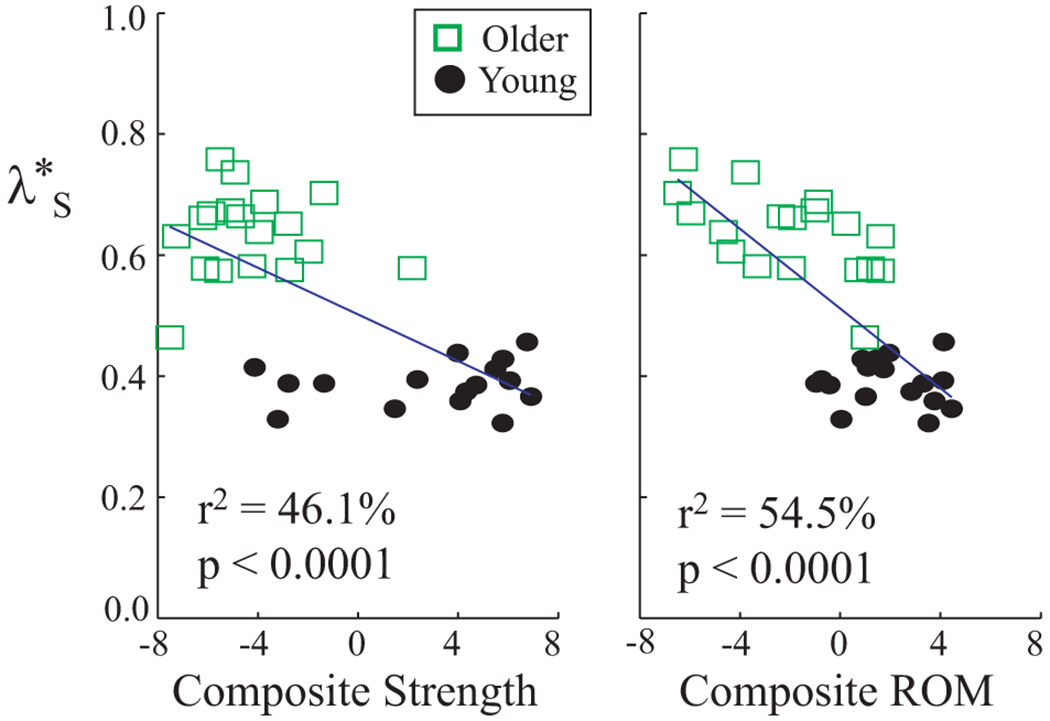
Short-term local divergence exponents (λ*S) vs. composite strength and range of motion (ROM) scores. Each symbol represents that average value for one subject, averaged across speeds. Composite strength and ROM scores were both correlated with λ*S. These correlations explain some, but not all, of the age-related differences in λ*S (Table 2).
Table 2.
Summary of ANOVA and ANCOVA Comparison Results
| Effect | λ*S | λ*L | 0% | 25% | 50% | 75% |
|---|---|---|---|---|---|---|
| Age | <0.0001 | 0.192 | 0.0052 | 0.0013 | 0.0066 | 0.0024 |
| Speed | <0.0001 | <0.0001 | 0.344 | 0.0172 | 0.0137 | <0.0001 |
| Age × Speed | 0.0068 | 0.577 | 0.428 | 0.217 | 0.3569 | 0.525 |
|
| ||||||
| Age adj. by strength | <0.0001 | N/A* | 0.0100 | 0.0110 | 0.0310 | 0.0035 |
| Age adj. by ROM | <0.0001 | N/A* | 0.0112 | 0.0196 | 0.0920 | 0.0114 |
| Age adj by both | <0.0001 | N/A* | 0.0107 | 0.0330 | 0.1101 | 0.0068 |
Main-effect for age was not significant, therefore not applicable
The magnitudes of the maximum Floquet multipliers (FM) varied little across the gait cycle (Fig. 5A). Older adults exhibited higher maximum FM values at all four Poincaré sections tested (p < 0.007; Fig. 5B). Maximum FM were slightly larger at higher speeds at the 75% Poincaré section (p < 0.001), where maximum FM at 0.8× and 0.9×PWS speeds were less than at 1.1× and 1.2×PWS (p < 0.003, pairwise comparisons). However, this effect was small at the 25% and 50% Poincaré sections (p < 0.02), and not significant at the 0% Poincaré section (p < 0.4).
Figure 5.
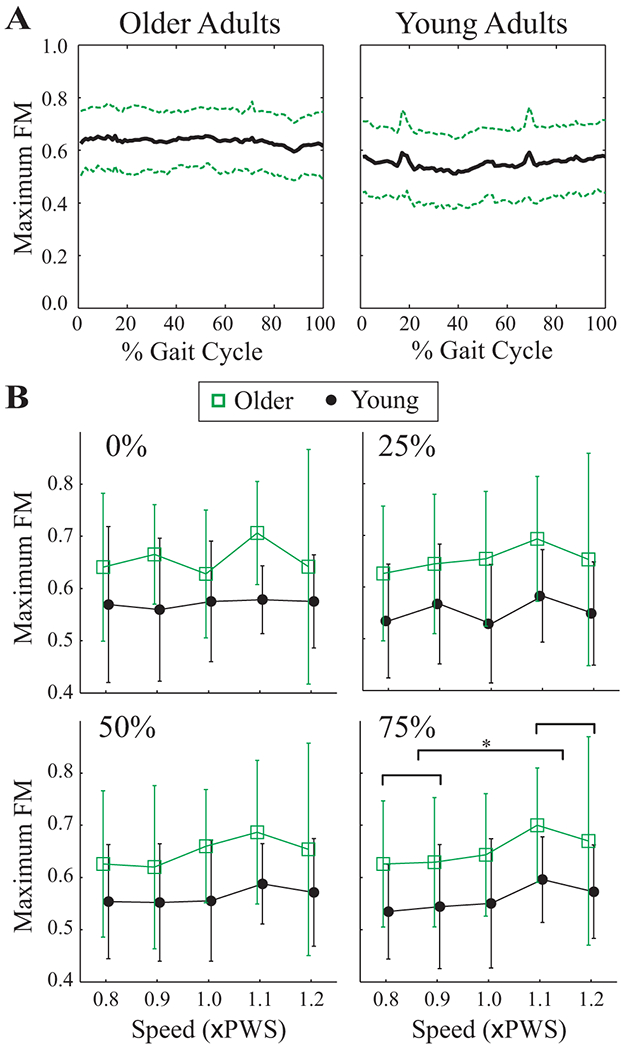
A) Maximum Floquet multipliers (FM) across the entire gait cycle for the 1.0×PWS walking speed for each age group. Solid lines are group averages. Dashed lines indicate ±1 between-subject standard deviation bands. Maximum FM were consistent across the gait cycle. A few trials displayed a spike at ~20% or ~70% of the gait cycle, but this was not consistent between subjects or groups. Similar results were obtained at the other walking speeds. B) Maximum FM values vs. Speed for both age groups for the Poincaré sections at 0%, 25%, 50% and 75% of the gait cycle. Error bars denote ±1 between-subject standard deviation within each group. Note that symbols for Older and Young groups have been offset slightly for clarity. Older adults (squares) displayed higher Maximum FM. The horizontal bracket at the 75% Poincaré section denotes significant Tukey’s LSD post-hoc comparisons at p < 0.005. Maximum FM at the 0.8× and 0.9×PWS speeds were significantly different from those at both the 1.1× and 1.2×PWS speeds.
Similar to , maximum FM were also correlated to Strength and ROM scores (Fig. 6), where decreased strength and ROM were associated with greater instability. And likewise, the differences between age groups for these maximum FM remained significant (p < 0.02) even after Strength, ROM, or both were included as covariates (Table 2). Thus, differences in strength and range of motion also could not explain all of the differences in orbital dynamic stability between younger and older subjects.
Figure 6.
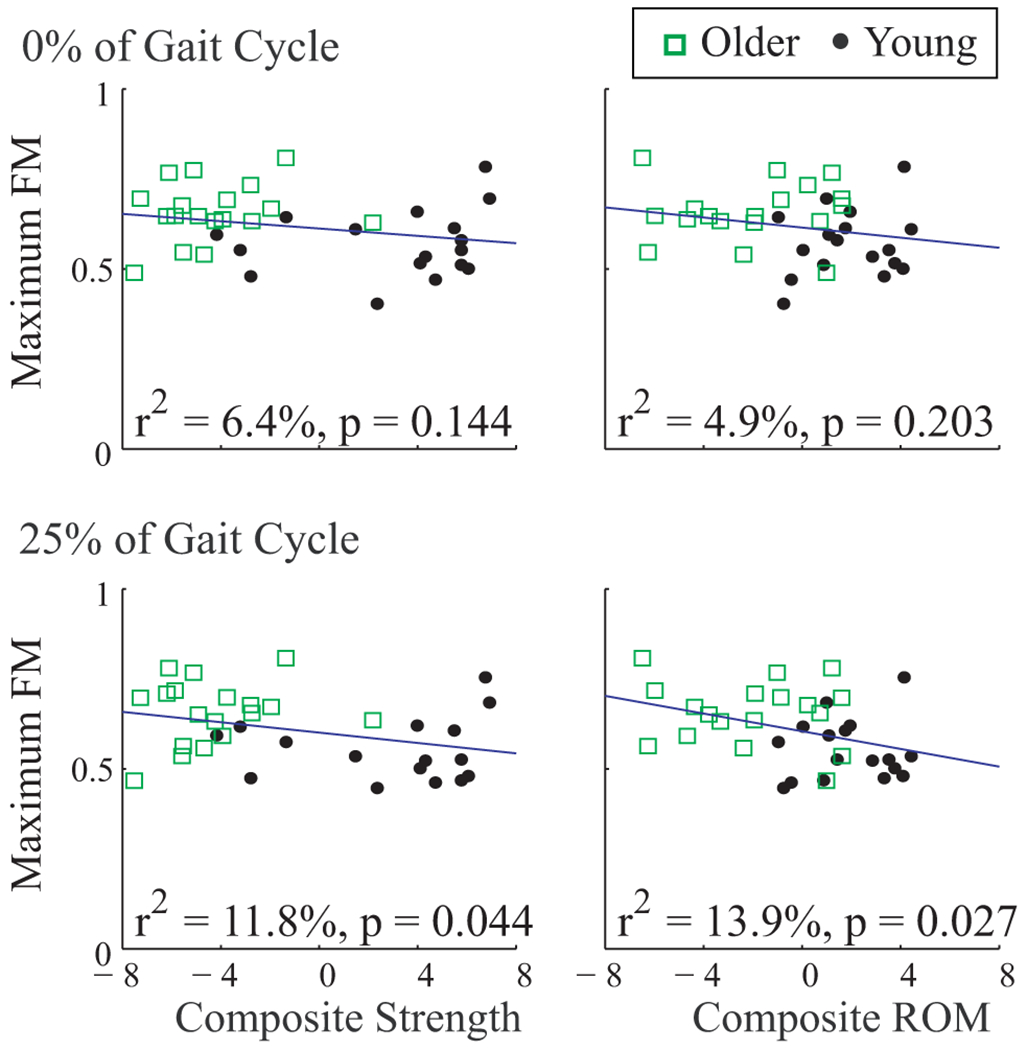
Maximum Floquet multipliers (FM) vs. composite strength and range of motion (ROM) scores. Each symbol represents that average value for one subject, averaged across speeds. Correlations are shown for Maximum FM computed at Poincaré sections at 0% and 25% of the gait cycle. Results from 50% and 75% were similar. Composite strength and ROM scores were only slightly correlated with Maximum FM. These correlations explained little of the age-related differences in Maximum FM (Table 2).
4. Discussion
Young adults can improve their dynamic stability by walking slower. However, while most older adults typically walk slower, they still fall more. Therefore, older adults may not improve their stability by walking slower, or other age-related factors may outweigh the benefits of walking slower. We addressed the first of these issues by directly comparing dynamic stability across multiple walking speeds in both healthy young and older adults. We addressed the second issue in part by determining if age-related declines in lower extremity strength and/or flexibility could explain age-related differences found in walking stability.
The older adults tested in this study had preferred walking speeds that were no different than those of the young adults (p = 0.86) and thus exhibited no obvious decrements in functional capacity related to walking (Alexander, 1996). Nevertheless, these older adults still exhibited higher (Fig. 3) and maximum FM (Fig. 5) than the young adults at all walking speeds. Thus, older adults were more sensitive to small intrinsic perturbations (i.e., more locally unstable) than young adults, independent of walking speed. These age-related differences in dynamic stability were not explained by including Strength or ROM as covariates (Figs. 4 & 6). This suggests that other age-related physiological changes, like increased neuromotor noise (Dean et al., 2007; Faisal et al., 2008), may be equally important as changes in strength and/or flexibility.
All subjects in this study walked under the same environmental conditions. Thus, any between-subject differences in stochastic inputs arose from differences in (internal) neuromotor noise and not (external) environmental noise. Indeed, these same older adults also exhibited greater movement variability than the young adults (Kang and Dingwell, 2008). Conversely, however, diabetic neuropathic patients exhibited less local instability (Dingwell et al., 2000), in spite of also exhibiting greater variability (Dingwell and Cavanagh, 2001). We also recently determined how dynamic stability varied in a deterministic walking model where we could explicitly control the amplitude of the stochastic inputs. Increasing the noise inputs to this model had mixed effects on the local divergence curves and almost no effects on the maximum FM (Su and Dingwell, 2007). This suggests that age-related increases in neuromotor noise may also not entirely explain the increased maximum FM found in our older adults (Fig. 5B).
Both younger and older adults exhibited lower exponents at slower speeds and larger exponents at faster speeds (Fig. 3B). Both groups also both exhibited slightly smaller maximum FM values at slower speeds and slightly larger values at faster speeds (Fig. 5B). This was in spite of the fact that these same subjects simultaneously exhibited greater kinematic variability at both faster and slower walking speeds (Kang and Dingwell, 2008). Orbital stability was less affected by changes in walking speed than local stability, similar to previous findings (Dingwell and Kang, 2007). Thus, all subjects demonstrated less sensitivity to small intrinsic perturbations when walking slower and greater sensitivity to these perturbations when they walked faster. This extends previous findings (Dingwell and Marin, 2006; England and Granata, 2007) by demonstrating that healthy older adults can also reduced their local dynamic instability by walking slower, in spite of increasing their variability (Kang and Dingwell, 2008).
Some studies suggested that physical limitations like muscle weakness (DeVita and Hortobagyi, 2000) and/or loss of flexibility (Kerrigan et al., 2001) cause older adults to walk slower. Others suggested older adults choose to walk slower to feel safer (Maki, 1997). While the older adults tested here were significantly weaker and less flexible than the younger adults (Table 1), they did not walk any slower as a result. Thus, our results support the second view, as these older adults also exhibited decreased local and orbital instability at slower walking speeds. Our older adults exhibited isometric leg strengths similar to other community-dwelling populations (Melzer et al., 2004), except for stronger knee flexors (75.1±23.2 vs. 48.9±6.7 Nm). Greater strength declines than those observed here were associated with slower walking speed (Chandler et al., 1998). Therefore, our older subjects may have not yet lost enough strength to force them to walk slower. Reduced stability, strength and ROM seem to occur in healthy older adults before slower gait, which is a major clinical predictor of decreased motor function. More work is needed to determine if these changes in stability and ROM also predict future gait disorders.
When walking at the same speeds, some elderly adopt wider step widths to improve their lateral stability, at the expense of slightly increased energetic cost (Dean et al., 2007). Our older adults walked with step widths (Fig. 2) and step width variability (Kang and Dingwell, 2008) very similar to young adults. Thus, it appears these older adults did not yet need to adopt this compensation either. Nevertheless, these elderly still exhibited significantly increased local (Fig. 3B) and orbital (Fig. 5B) instability. This suggests that these measures might be more sensitive indicators of locomotor impairment and potential future risk of falls than changes in step width and/or step width variability.
The exponents and maximum FM both quantify “local” stability: i.e., how systems respond to very small perturbations (i.e., “local” in state space). However, these two algorithms quantify this response differently (Dingwell and Kang, 2007; Dingwell et al., 2007). First, the maximum FM are local in space only because differences in stride time are ignored. Conversely, and are local in both space and time. Also, Floquet theory assumes an underlying limit cycle (in this case, the mean trajectory). All “perturbations” are taken relative to this limit cycle. Conversely, the analyses assume no such limit cycle. Initial “perturbations” to each trajectory are taken as the nearest neighbor to that trajectory. The positive demonstrate that, on average, each trajectory diverged away from its own nearest neighbor. However, since the maximum FM all had magnitude < 1, all trajectories, on average, still converged towards the mean trajectory (Su and Dingwell, 2007).
This study only quantified responses to local (i.e., very small) perturbations. These results may or may not extend to global stability, where responses to large perturbations, like tripping (e.g., (Pijnappels et al., 2008) or slipping, would be assessed. We do not yet know how much inherent local instability humans can tolerate while remaining globally stable (Dingwell and Kang, 2007; Su and Dingwell, 2007). One important line of future research will be to determine where the boundaries lie between movements that remain globally stable and those that lead to global instability (i.e., falling).
Our subjects walked on a motorized treadmill, which may not properly reflect overground walking in older adults (Wass et al., 2005). Treadmills can artificially reduce the natural variability and local instability of walking by constraining walking speed (Dingwell et al., 2001). However, there were only minimal differences in orbital stability between treadmill and overground walking in young adults (Dingwell and Kang, 2007). Here we tested all subjects under the same experimental conditions and relative to their own walking speeds, which were not different between the two groups. Therefore, repeating this study overground may yield slightly different values for each dependent measure. However, the observed differences between age groups and speeds are expected to remain.
In summary, even healthy active older adults who walk at the same preferred speeds as young adults still exhibit significantly increased local and orbital dynamic instability, independent of walking speed. Both younger and older adults can decrease their local and orbital instability by walking slower, in spite of increased variability. Finally, decrements in strength and flexibility alone do not account for the increased instability observed in healthy older adults.
Acknowledgements
Funded by Whitaker Foundation Grant RG-02-0354 to JBD, and American Society of Biomechanics Grant-in-Aid and University of Texas A.D. Hutchinson Fellowship to HGK. Financial support also provided to HGK through NIA T32AG023480. The authors thank Ann Newstead PT, Cooper Philips, and Philip Hwang for their assistance.
Footnotes
Conflict of Interest Statement
The authors declare that there is no conflict of interest associated with this work.
References
- Alexander NB, 1996. Gait disorders in older adults. Journal of the American Geriatrics Society 44 (4), 434–451. [DOI] [PubMed] [Google Scholar]
- Berg WP, Alessio HM, Mills EM, Tong C, 1997. Circumstances and consequences of falls in independent community-dwelling older adults. Age and Ageing 26 (4), 261–268. [DOI] [PubMed] [Google Scholar]
- Bergland A, Jarnlo GB, Laake K, 2003. Predictors of falls in the elderly by location. Aging Clinical and Experimental Research 15 (1), 43–50. [DOI] [PubMed] [Google Scholar]
- Chandler JM, Duncan PW, Kochersberger G, Studenski S, 1998. Is lower extremity strength gain associated with improvement in physical performance and disability in frail, community-dwelling elders? Archives of Physical Medicine and Rehabilitation 79 (1), 24–30. [DOI] [PubMed] [Google Scholar]
- Daffertshofer A, Lamoth CJC, Meijer OG, Beek PJ, 2004. PCA in studying coordination and variability: A tutorial. Clinical Biomechanics 19 (4), 415–428. [DOI] [PubMed] [Google Scholar]
- Dean JC, Alexander NB, Kuo AD, 2007. The effect of lateral stabilization on walking in young and old adults. IEEE Transactions on Biomedical Engineering 54 (11), 1919–1926. [DOI] [PubMed] [Google Scholar]
- DeVita P, Hortobagyi T, 2000. Age causes a redistribution of joint torques and powers during gait. Journal of Applied Physiology 88 (5), 1804–1811. [DOI] [PubMed] [Google Scholar]
- Dingwell JB, Cavanagh PR, 2001. Increased variability of continuous overground walking in neuropathic patients is only indirectly related to sensory loss. Gait & Posture 14 (1), 1–10. [DOI] [PubMed] [Google Scholar]
- Dingwell JB, Cusumano JP, 2000. Nonlinear time series analysis of normal and pathological human walking. Chaos: An Interdisciplinary Journal of Nonlinear Science 10 (4), 848–863. [DOI] [PubMed] [Google Scholar]
- Dingwell JB, Cusumano JP, Sternad D, Cavanagh PR, 2000. Slower speeds in neuropathic patients lead to improved local dynamic stability of continuous overground walking. Journal of Biomechanics 33 (10), 1269–1277. [DOI] [PubMed] [Google Scholar]
- Dingwell JB, Cusumano JP, Sternad D, Cavanagh PR, 2001. Local dynamic stability versus kinematic variability of continuous overground and treadmill walking. ASME Journal of Biomechanical Engineering 123 (1), 27–32. [DOI] [PubMed] [Google Scholar]
- Dingwell JB, Kang HG, 2007. Differences between local and orbital dynamic stability during human walking. Journal of Biomechanical Engineering 129 (4), 586–593. [DOI] [PubMed] [Google Scholar]
- Dingwell JB, Kang HG, Marin LC, 2007. The effects of sensory loss and walking speed on the orbital dynamic stability of human walking. Journal of Biomechanics 40 (8), 1723–1730. [DOI] [PubMed] [Google Scholar]
- Dingwell JB, Marin LC, 2006. Kinematic variability and local dynamic stability of upper body motions when walking at different speeds. Journal of Biomechanics 39 (3), 444–452. [DOI] [PubMed] [Google Scholar]
- Donelan JM, Shipman DW, Kram R, Kuo AD, 2004. Mechanical and metabolic requirements for active lateral stabilization in human walking. Journal of Biomechanics 37 (6), 827–835. [DOI] [PubMed] [Google Scholar]
- England SA, Granata KP, 2007. The influence of gait speed on local dynamic stability of walking. Gait & Posture 25 (2), 172–178. [DOI] [PMC free article] [PubMed] [Google Scholar]
- Faisal AA, Selen LPJ, Wolpert DM, 2008. Noise in the nervous system. Nature Reviews Neuroscience 9 (4), 292–303. [DOI] [PMC free article] [PubMed] [Google Scholar]
- Goldstein H, Poole CP, Safko JL, 2001. Classical Mechanics. Addison Wesley, San Francisco, CA. [Google Scholar]
- Hahn ME, Lee H-J, Chou L-S, 2005. Increased muscular challenge in older adults during obstructed gait. Gait & Posture 22 (4), 356–361. [DOI] [PubMed] [Google Scholar]
- Hausdorff JM, Rios DA, Edelberg HK, 2001. Gait variability and fall risk in community-living older adults: A 1-year prospective study. Archives of Physical Medicine and Rehabilitation 82 (8), 1050–1056. [DOI] [PubMed] [Google Scholar]
- Holviala JHS, Sallinen JM, Kraemer WJ, Alen MJ, Häkkinen KKT, 2006. Effects of strength training on muscle strength characteristics, functional capabilities, and balance in middle-aged and older women. Journal of Strength & Conditioning Research 20 (2), 336–344. [DOI] [PubMed] [Google Scholar]
- Hurmuzlu Y, Basdogan C, Stoianovici D, 1996. Kinematics and dynamic stability of the locomotion of post-polio patients. ASME Journal of Biomechanical Engineering 118 (3), 405–411. [DOI] [PubMed] [Google Scholar]
- Ivanenko YP, Cappellini G, Dominici N, Poppele RE, Lacquaniti F, 2007. Modular control of limb movements during human locomotion. The Journal of Neuroscience 27 (41), 11149–11161. [DOI] [PMC free article] [PubMed] [Google Scholar]
- Kang HG, Dingwell JB, 2006. A direct comparison of local dynamic stability during standing and walking. Experimental Brain Research 172 (1), 35–48. [DOI] [PubMed] [Google Scholar]
- Kang HG, Dingwell JB, 2008. Separating the effects of age and speed on gait variability during treadmill walking. Gait & Posture 27 (4), 572–577. [DOI] [PubMed] [Google Scholar]
- Kantz H, Schreiber S, 2004. Nonlinear Time Series Analysis, 2nd ed. Cambridge University Press, Cambridge, UK. [Google Scholar]
- Kerrigan DC, Lee LW, Collins JJ, Riley PO, Lipsitz LA, 2001. Reduced hip extension during walking: Healthy elderly and fallers versus young adults. Archives of Physical Medicine and Rehabilitation 82 (1), 26–30. [DOI] [PubMed] [Google Scholar]
- Maki BE, 1997. Gait changes in older adults: Predictors of falls or indicators of fear? Journal of the American Geriatric Society 45 (3), 313–320. [DOI] [PubMed] [Google Scholar]
- Melzer I, Benjuya N, Kaplanski J, 2004. Postural stability in the elderly: A comparison between fallers and non-fallers. Age and Ageing 33 (6), 602–607. [DOI] [PubMed] [Google Scholar]
- Moxley Scarborough D, Krebs DE, Harris BA, 1999. Quadriceps muscle strength and dynamic stability in elderly persons. Gait & Posture 10 (1), 10–20. [DOI] [PubMed] [Google Scholar]
- Niino N, Tsuzuku S, Ando F, Shimokata H, 2000. Frequencies and circumstances of falls in the national institute for longevity sciences, longitudinal study of aging (NILS-LSA). Journal of Epidemiology 10 (1 Suppl.), S90–S94. [DOI] [PubMed] [Google Scholar]
- Pavol MJ, Owings TM, Foley KT, Grabiner MD, 1999. Gait characteristics as risk factors for falling from trips induced in older adults. Journals of Gerontology, Series A. Biological Sciences and Medical Sciences 54A (11), M583–M590. [DOI] [PubMed] [Google Scholar]
- Pijnappels M, van der Burg J, Reeves ND, van Dieën JH, 2008. Identification of elderly fallers by muscle strength measures. European Journal of Applied Physiology 102 (5), 585–592. [DOI] [PMC free article] [PubMed] [Google Scholar]
- Prince F, Winter DA, Stergiou P, Walt SE, 1994. Anticipatory control of upper body balance during human locomotion. Gait & Posture 2, 19–25. [Google Scholar]
- Rosenstein MT, Collins JJ, DeLuca CJ, 1993. A practical method for calculating largest lyapunov exponents from small data sets. Physica D: Nonlinear Phenomena 65, 117–134. [Google Scholar]
- Shkuratova N, Morris ME, Huxham F, 2004. Effects of age on balance control during walking. Archives of Physical Medicine and Rehabilitation 85 (4), 582–588. [DOI] [PubMed] [Google Scholar]
- Smidt GL, 1994. Muscle strength testing: A system based on mechanics. Spark Instruments & Academics, Inc., Coralville, IA. [Google Scholar]
- Sterling DA, O’Connor JA, Bonadies J, 2001. Geriatric falls: Injury severity is high and disproportionate to mechanism. Journal of Trauma 50 (1), 116–119. [DOI] [PubMed] [Google Scholar]
- Su JL, Dingwell JB, 2007. Dynamic stability of passive dynamic walking on an irregular surface. ASME Journal of Biomechanical Engineering 129 (6), 802–810. [DOI] [PubMed] [Google Scholar]
- Torres-Oviedo G, Ting LH, 2007. Muscle synergies characterizing human postural responses. Journal of Neurophysiology 98 (4), 2144–2156. [DOI] [PubMed] [Google Scholar]
- van den Bogert AJ, Pavol MJ, Grabiner MD, 2002. Response time is more important than walking speed for the ability of older adults to avoid a fall after a trip. Journal of Biomechanics 35 (2), 199–205. [DOI] [PubMed] [Google Scholar]
- Wass E, Taylor NF, Matsas A, 2005. Familiarization to treadmill walking in unimpaired older people. Gait & Posture 21 (1), 72–79. [DOI] [PubMed] [Google Scholar]
- Zajac FE, Gordon ME, 1989. Determining muscle’s force and action in multi-articular movement. Exercise and Sports Sciences Reviews 17, 187–230. [PubMed] [Google Scholar]