
Fig. 5.
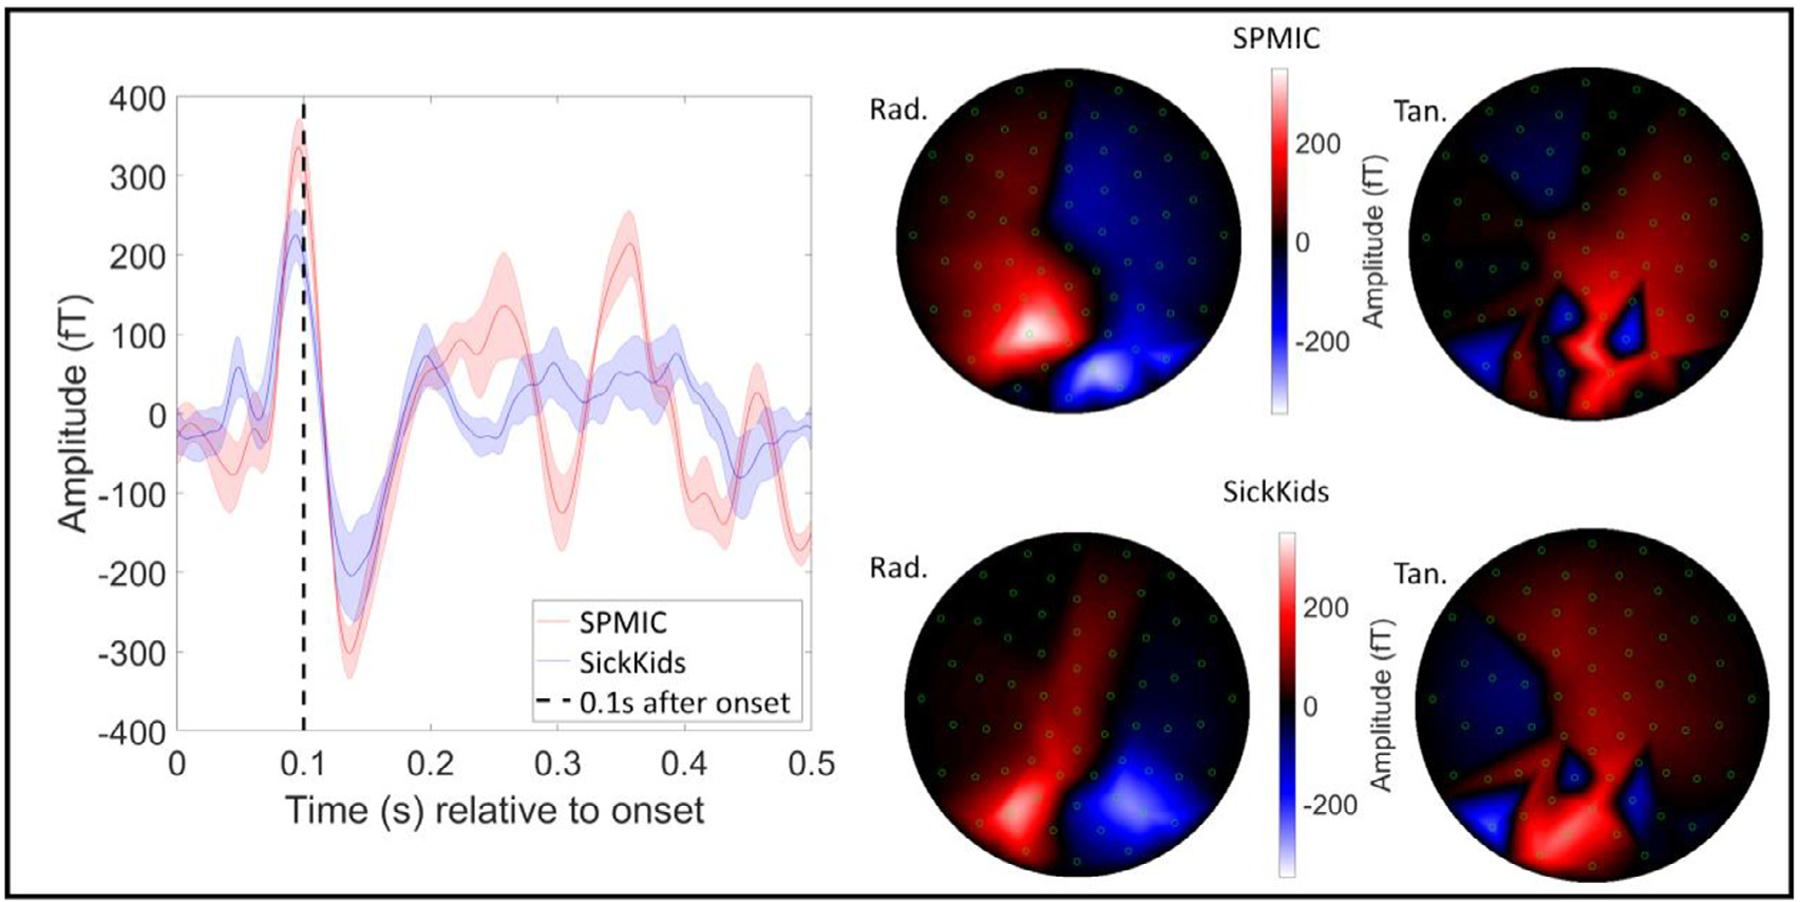
Face processing results (sensor-level). The trial-averaged response in the best sensor for all 5 runs at each site averaged over runs, with the standard deviation across runs shown by the shaded error bars. The dashed line shows 0.1 s after stimulus onset. The best sensor was determined by the range of the trial-averaged signal for each sensor in the 0.075 s < t < 0.175 s window. The field maps on the right show the field distribution at the peak of the average evoked response at 0.1 s (Z-axis (radial) measurements on the left, Y-axis (tangential) on the right).