. 2022 May 16;11:e75526. doi: 10.7554/eLife.75526

Figure 6. Consequences of stoichiometric compensation.

(A) Graphical representation for the calculation of stoichiometric deviation score for each sample (n=30 referring top 30 correlations). (B) Survival analysis results within each tissue. Survival analysis was done once with overall survival and once with disease-free survival. (C) Correlations between the stoichiometric deviation scores and protein abundance/mRNA expression of all proteins, and proteasome complex - ubiquitin binding proteins. Wilcoxon test was used to test differences between groups. BRCA, breast cancer; OV, ovarian cancer; COREAD, colorectal adenocarcinoma cancer.

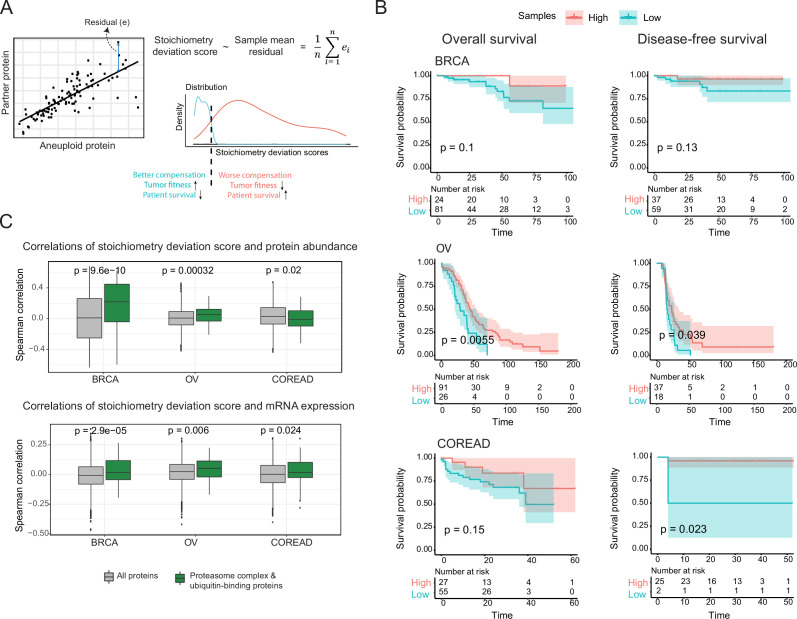
Figure 6.

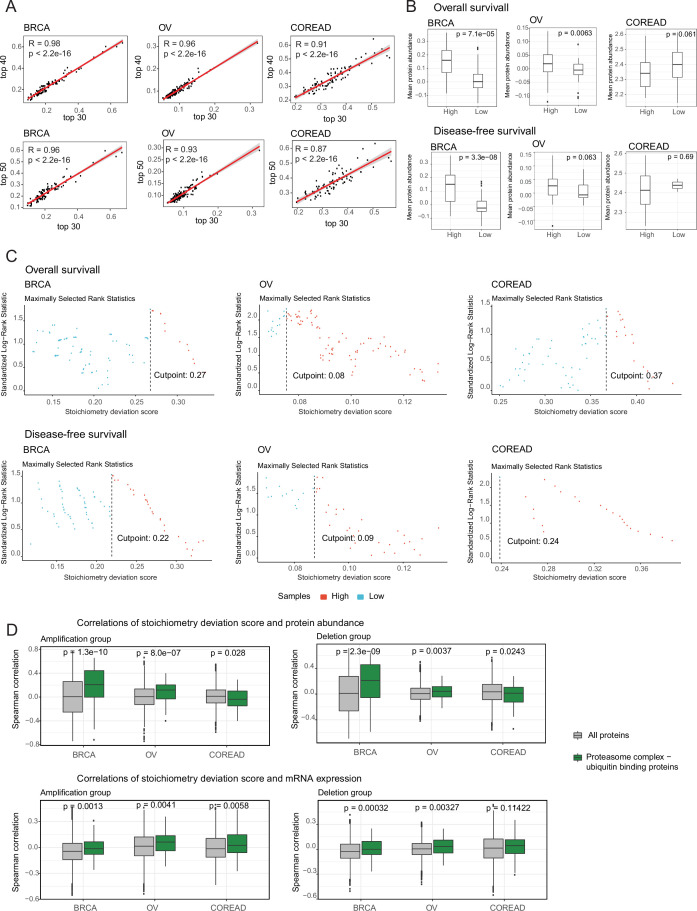
Figure 6—figure supplement 1. Association between the deviation from complex stoichiometry and survival probability.

Figure 6—figure supplement 1.

(A) Correlations between the mean stoichiometric deviation scores across samples when different number of highly correlated protein pairs were considered. (B) Mean abundances of proteasome complex and ubiquitin-binding proteins in high and low samples. Samples were grouped once based on overall survival, and once based on disease-free survival. (C) Cutpoints to group samples as high and low based on stoichiometry deviation scores. (D) Correlations between the stoichiometric deviation scores and protein abundance/mRNA expression of all proteins, and proteasome complex - ubiquitin binding proteins when samples were separated as amplification and deletion groups. Wilcoxon test was used to test differences between groups. BRCA, breast cancer; OV, ovarian cancer; COREAD, colorectal adenocarcinoma cancer.