Figure 2.
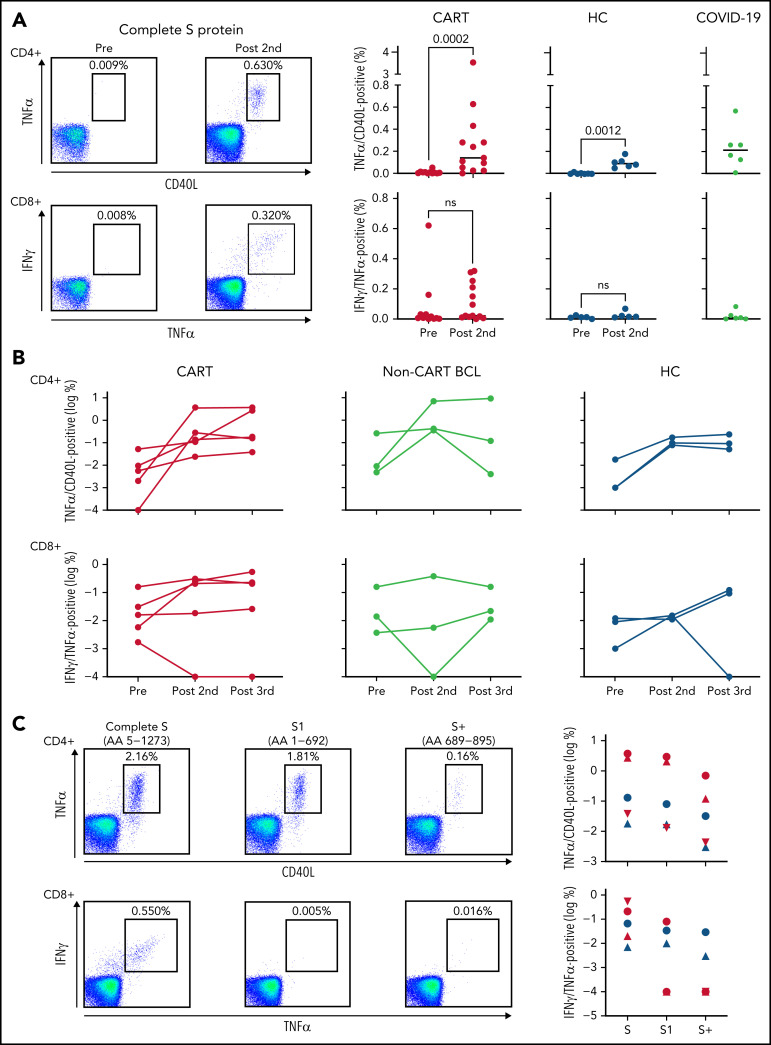
Vaccine-induced SARS-CoV-2–specific T cells in patients with B-cell lymphoma after CD19 CART treatment. (A) T cells specific for the S protein of the SARS-CoV-2 were identified ex vivo after short-term stimulation of total peripheral blood mononuclear cells, by using libraries of overlapping peptides covering the complete sequence of the protein. Intracellular staining of cytokines followed by flow cytometry served as a read-out assay. SARS-CoV-2–specific CD4+ T cells (top left) were defined as tumor necrosis factor-α (TNFα/CD40L (CD154) double-positive CD3+CD4+ T cells, and SARS-CoV-2–specific CD8+ T cells (bottom left) were defined as interferon-γ/TNFα–double-positive CD3+CD8+ T cells. The dot plots on the left show examples of a CART-treated patient (2123-042) without any antiviral T cells before vaccination and easily detectable CD4+ and CD8+ anti-S protein T cells after the second dose of the vaccine. Background levels were typically <0.01% of all CD4+ or CD8+ T cells. Scatterplots indicate levels of SARS-CoV-2–specific CD4+ (top right) and CD8+ T cells (bottom right) before vaccination (11 CART-treated patients; 7 HCs) and after the second dose (13 CART-treated patients; 7 HCs). Gray plots on the right indicate T-cell levels in 6 patients with active COVID-19. Horizontal lines indicate median levels. Differences between groups were analyzed for statistical significance by Mann-Whitney U test. (B) For 5 CART-treated patients (red), 3 patients with B-cell lymphoma (BCL) without prior CART treatment (yellow), and 3 HCs (blue), samples were available at all 3 time points and anti-S CD4+ (top) and CD8+ T cells (bottom) were measured before vaccination, after the second dose, and after the third dose. (C) The number of vaccine-induced CD4+ and CD8+ T cells specific for the complete sequence of the S fusion protein was compared with the number of T cells from the same individual, recognizing the N-terminal S1 protein or the N-terminal part (AA 689-895) of the S2 protein (S+). Dot plots on the left show exemplary data for 2 CART-treated patients with CD4+ (patient 2123-108) and CD8+ (patient 2123-034) T cells, respectively, specific for the SARS-CoV-2 S protein. Symbols on the right show the same type of data for 3 CART-treated patients (red) and 2 HCs (blue).

