Abstract
The respiratory activity of marine bacteria is an important indication of the ecological functioning of these organisms in marine ecosystems. The redox dye 5-cyano-2,3-ditolyl tetrazolium chloride (CTC) is reduced intracellularly in respiring cells to an insoluble, fluorescent precipitate. This product is detectable and quantifiable by flow cytometry in individual cells. We describe here an evaluation of flow cytometry for measuring CTC activity in natural assemblages of marine bacteria growing in dilution cultures. We found that more CTC-positive cells are detected by flow cytometry than by visual epifluorescence microscopy. Samples can be stored refrigerated or frozen in liquid nitrogen for at least 4 weeks without a significant loss of total cells, CTC-positive cells, or CTC fluorescence. Cytometry still may not detect all active cells, however, since the dimmest fluorescing cells are not clearly separated from background noise. Reduction of CTC is very fast in most active cells, and the number of active cells reaches 80% of the maximum number within 2 to 10 min. The proportion of active cells is correlated with the growth rate, while the amount of fluorescence per cell varies inversely with the growth rate. The CTC reduction kinetics in assemblages bubbled with nitrogen and in assemblages bubbled with air to vary the oxygen availability were the same, suggesting that CTC can effectively compete with oxygen for reducing power. A nonbubbled control, however, contained more CTC-positive cells, and the amount of fluorescence per cell was greater. Activity may have been reduced by bubble-induced turbulence. Addition of an artificial reducing agent, sodium dithionite, after CTC incubation and fixation resulted in a greater number of positive cells but did not “activate” a majority of the cells. This indicated that some of the negative cells actually transported CTC across their cell membranes but did not reduce it to a detectable level. Automated analysis by flow cytometry allows workers to study single-cell variability in marine bacterioplankton activity and changes in activity on a small temporal or spatial scale.
Natural bacteria account for a huge portion of the living biomass on earth. In the oceans 80% of the particulate organic carbon is in the form of bacterial cells (5). While our abilities to calculate the abundance and biomass of bacteria have improved to the point of making global estimates possible, the methods used to measure the activity of natural bacteria have lagged behind. The primary method which is used is to estimate bacterial growth rates from measurements of bulk uptake of tritium-labeled thymidine or leucine in multimilliliter samples (13, 18). Bacteria in the ocean play an essential role in transforming dissolved organic matter into biomass that is then available to higher trophic levels in the microbial food web. The proportion that is available depends on the bacterial growth efficiency, a poorly characterized parameter, while the remainder is respired. From highly productive coastal and upwelling regions to extremely oligotrophic waters, the range of bacterial concentrations is paradoxically narrow (105 to 106 cells per ml). Similarly, biomass levels are relatively constant across large trophic gradients in the ocean (29). The activity of bacteria, however, appears to be more variable, even in oligotrophic waters (3).
The importance of bacterial respiration rate measurements in understanding the role of bacteria in carbon cycling has been clearly stated (8, 15). The measured bacterial growth efficiencies are quite variable and range from less than 10% to more than 90%. Pomeroy et al. (23) observed a variety of kinetic responses to oxygen use in microbial communities in 24-h bottle incubation experiments. The oxygen uptake rates increased, decreased, or remained constant (i.e., linear) during the 24-h experiments.
One method that is being used increasingly to measure the single-cell activity of natural bacteria is a method involving the intracellular fluorescent probe 5-cyano-2,3-ditolyl tetrazolium chloride (CTC) (24, 30). This method results in the production of a fluorescent CTC-formazan product of reduction (CTF) that can be quantified at low concentrations in individual cells (9, 24) and is thought to indicate that cell electron transport system activity or respiration is occurring. The CTC method remains controversial, however, in part due to misinterpretation and a genuine lack of information concerning what its results actually indicate. The relatively low proportion of cells that are CTC active contrasts with the higher proportions of active cells measured by other methods, such as microradiographic analysis of the uptake of radioactive tracer-labeled low-molecular-weight substrates (17). The discrepancy has contributed to confusion about what is actually measured by intracellular CTC reduction. General acceptance of the method depends on understanding how it works and what its results mean. This is one purpose of the work described here, in which we used mixed natural bacterial assemblages in dilution cultures.
The majority of studies in which CTC and natural samples have been used have relied on visual epifluorescence microscopy to determine whether individual cells are active or inactive (10, 11, 14, 24, 30). These studies yielded interesting and important results. However, there are several potential limitations to this approach. Detection of CTC-positive cells is limited by the sensitivity of the human eye. CTF fluorescence has been observed to fade, so that sample slides cannot be stored for very long. The proportion of detectable CTC-active cells increases over time, which leads to long incubation times (6 to 10 h) (11, 14). There are several potential advantages of using automated flow cytometry to measure CTF fluorescence. First, flow cytometry eliminates the tedium and operator fatigue during visual microscopy that limit the sample throughput rate. Second, fluorescence of individual cells can be quantified by flow cytometry. Respiration as measured by CO2 evolution has been shown to be better correlated with integrated cell fluorescence values than with the proportion of CTC-positive cells for mixed bacterial assemblages in bioreactors (9). Third, the exposure of cells to excitation illumination is very brief during flow cytometry, which minimizes photobleaching. And fourth, the sensitivity of photomultiplier tubes to red fluorescence exceeds the sensitivity of the human eye, so faintly CTC-positive cells that are undercounted by visual methods should be detectable. Flow cytometry allows large numbers of samples to be routinely analyzed without time-consuming, tedious microscopic analyses. Since more cells can be analyzed per sample, the precision of the counting is improved (22). The advantages of flow cytometry are especially clear for samples containing low proportions of positive cells, since this method eliminates the tedium of searching large numbers of empty microscope fields. The greater sensitivity for detection of CTF allows the use of shorter incubation times (10).
Several investigators have described using flow cytometry for measuring CTC activity. Kaprelyants and Kell (16) used flow cytometric analysis of CTC activity for a pure culture of Micrococcus luteus. More recently, del Giorgio et al. (10) used flow cytometry to measure the numbers of CTC-positive cells in samples from a variety of lakes. The second major goal of our study was to evaluate the use and advantages of flow cytometry for measuring not only the numbers of CTC-positive cells but also the fluorescence of individual bacterial cells in coastal marine samples. We used fresh dilution cultures of marine bacterioplankton to modify the growth rates of bacteria obtained from natural assemblages and to ascertain the CTC response. Our results show that flow cytometry is useful for performing automated analyses of CTC activity in marine bacteria. This method can be used with small sample volumes and short incubation times, and sample analysis takes less than 1 min. These advantages should result in experimental designs that can address new questions concerning the respiratory activity of marine bacteria at small spatial and temporal scales of variability.
MATERIALS AND METHODS
Cell cultures.
Dilution cultures of marine bacteria were prepared from water that was freshly collected from the Bigelow Laboratory dock in West Boothbay Harbor, Maine, near high tide. A grazer-free inoculum was prepared by gently filtering a subsample through a 0.6- or 0.8-μm-pore-size polycarbonate filter. This inoculum was then added to water from the same sample that had been filtered through a 0.2-μm-pore-size polycarbonate filter at dilutions ranging from 1/10 to 1/100. Preparations were incubated at the in situ temperature in 250-ml polycarbonate culture flasks. In some experiments, cultures were enriched with 0.01% yeast extract or with glucose (1 mg liter−1), NH4Cl (25 mg liter−1), and NaH2PO4 (10 mg liter−1).
CTC incubation mixtures.
CTC was dissolved in deionized water to prepare 25 or 50 mM stock solution, and the solution was slowly stirred overnight at room temperature. Fresh working stock solutions were prepared for each set of experiments, stored at 4°C, and used within several days. In a typical experiment, CTC was added to a culture or natural sample at a final concentration of 5 mM (24). The incubation times ranged from 5 to 40 min, and incubation was ended by fixation with a 1/10 dilution of 10% paraformaldehyde (final concentration, 1%). In time course experiments subsamples were fixed at certain times. Control preparations were fixed prior to CTC incubation in each experiment; these fixed controls never contained significant numbers of CTC-positive cells or CTF particles.
Microscopy.
Samples were stained with DAPI (4′,6-diamidino-2-phenylindole) (final concentration, 7 μg/ml) in filter towers for at least 4 min and then filtered onto 0.2-μm-pore-size polycarbonate filters. The filters were then mounted on slides under oil by using standard epifluorescence methods. The slides were stored in the dark at 4°C until they were examined. The slides were examined with a Zeiss Axioskop microscope outfitted for epifluorescence illumination with either a ×63 objective or a ×100 objective by using blue light excitation in order to determine the number of CTC-positive cells. Then the filter set was changed to a UV excitation filter set to determine total cell counts.
Flow cytometry.
A Becton Dickinson FACScan flow cytometer equipped with a 15-mW, 488-nm, air-cooled argon ion laser was used in this study. All sample and data analyses were done with Becton Dickinson CellQuest software. Liquid samples were either analyzed immediately or frozen in small volumes (1 ml) in liquid nitrogen after 1 h of fixation with 1% (final concentration) paraformaldehyde. Simultaneous measurements of forward light scatter (relative size), 90-degree light scatter, and CTF fluorescence emission (wavelength, >630 nm) were used to detect and enumerate CTC-positive cells. CTC-positive bacteria were detected based on red signals above a baseline threshold by separating instrument noise and true red emitted light.
Total bacterial numbers were determined by using the double-stranded DNA stain PicoGreen (Molecular Probes, Inc.). Preserved samples were stained with PicoGreen at a final concentration of 1:100 of the stock solution (33). Green fluorescence emission (wavelengths, 515 to 525 nm) from PicoGreen-stained bacteria was simultaneously measured by forward light scatter and 90-degree light scatter. The photodiode detector (for forward light scatter) and the photomultiplier detector (for 90-degree light scattering, PicoGreen, and CTF) were used in log mode and provided 4 decades of log, and the signal peak integrals were measured. The volume of a sample analyzed with the FACScan flow cytometer was determined gravimetrically by using a model A-160 electronic balance (Denver Instruments Co.). Each sample was weighed before and after analysis, and the difference in milligrams was considered to be equal to the volume of the sample analyzed in microliters. All samples were examined at either a low flow rate (∼20 μl/min) or a high flow rate (∼50 μl/min) so that the total particle counts did not exceed 1,500 counts per s. In dense cultures, samples were diluted with filtered (pore size, 0.2 μm) seawater in order to maintain the counts below the threshold value.
CTC sample storage.
To determine whether CTC-positive bacteria could be stored for a long time and then used for analysis, we performed an experiment in which samples were stored for up to 28 days either in liquid nitrogen or at 4°C. A dilution culture (3/100 dilution) was enriched with yeast extract and incubated for 24 h. Then CTC was added, and the culture was incubated for 20 min and fixed. Eighteen 0.5-ml aliquots of the preserved sample were placed in cryovials for liquid N2 storage, and the remaining sample was kept at 4°C in the dark. Triplicate samples subjected to both treatments were analyzed by flow cytometry periodically for 28 days. We determined CTC-positive bacterial counts and total bacterial counts (with PicoGreen), as well as the mean cell CTF fluorescence.
Fluorescence spectra.
A yeast extract-enriched culture in dense stationary phase was incubated with CTC for 40 min and then fixed with 1% paraformaldehyde. The fluorescence spectra of CTC-positive cells were determined with a dual-monochrometer scanning fluorescence spectrophotometer (Baird Atomic model SF1). Spectra of the following preparations were determined with 1-cm-pathlength cuvettes: (i) a fixed culture sample without CTC, (ii) a killed control with CTC, and (iii) normal CTC-treated cells.
SDT-positive control.
We developed a positive control technique to test the hypothesis that a CTC-negative cell cannot transport CTC into the cell. Following standard incubation with CTC, subsamples were dispensed into filter towers over 0.2-μm-pore-size filters, and the dissolved CTC was removed from the samples by filtering and rinsing them twice with deionized water. Replicate samples were fixed with 1% paraformaldehyde prior to rinsing. After rinsing, sodium dithionite (SDT), a reducing agent, was added at concentrations ranging from 5 to 500 mM and was allowed to react in the filter tower for 10 or 20 min. Unfixed (“live”) preparations were fixed after incubation with SDT. Incubation times were arranged so that fixation of the standard CTC-containing samples and fixation of the “fixed” SDT-containing preparations occurred at the same time that CTC was removed from the live SDT-containing preparations by rinsing. This ensured that all of the preparations were incubated with CTC for the same time. The samples were then stained with DAPI and filtered, and slides were prepared for microscopy as described above and examined within several hours.
Blue light exposure.
In order to measure any decay of CTF fluorescence due to photobleaching during microscope counting, we used a cooled charge-coupled device camera (Photometrics Ltd.) with 14 bits of grey level resolution (16,384 grey levels) and a spatial resolution of 67 nm pixel−1. A fresh field of view containing CTC-positive cells was brought into focus as rapidly as possible under standard blue light illumination. Then a sequence of images was taken for 3 min at 10-s intervals. The initial image was segmented (34) and used as a mask for the subsequent images. In this way the CTF fluorescence intensity (average of the pixels) of each cell was determined over the time sequence.
Oxygen-bubbling effect.
We performed an experiment to evaluate the ability of CTC to compete with oxygen for electrons from the electron transport system. A bacterioplankton dilution culture (1/30 dilution) was incubated for approximately 20 h, and then a portion of the culture was enriched with yeast extract (0.01%). After 4 h, the enriched and unenriched preparations were each divided and placed into three small tissue culture flasks. One flask was bubbled with N2 gas, one flask was bubbled with air, and one flask received no bubbling (static treatment). After about 15 min of bubbling, CTC was added to each flask. Samples were fixed with 1% paraformaldehyde at time intervals ranging from 30 s to 480 min.
RESULTS
Spectrum of CTF fluorescence.
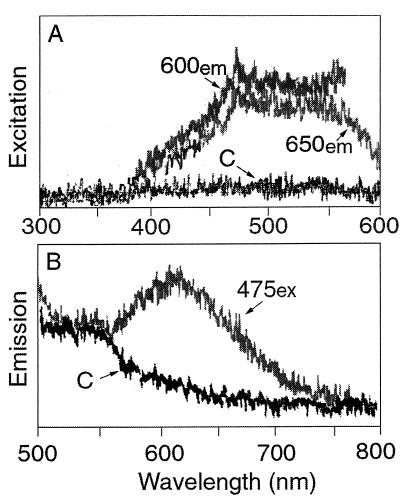
The excitation spectrum of CTF was relatively broad, from about 450 to 585 nm, and had a maximum near 480 nm (Fig. 1A). This finding agrees with microscope observations which indicated that both blue excitation and green excitation yield CTF fluorescence. Peak CTF fluorescence emission occurred at about 610 nm, and fluorescence was significantly greater than the control fluorescence at wavelengths between about 585 and 670 nm (Fig. 1B).
FIG. 1.
Fluorescence excitation (ex) and emission (em) spectra of CTC-positive bacteria. For the excitation spectra (A) emission was measured at 600 and 650 nm. For the emission spectrum (B) excitation was measured at 475 nm. The control spectra (spectra C) are spectra obtained for a bacterial culture to which CTC was added after the cells were killed with formalin; these spectra were the same as the spectra obtained for formalin-fixed bacteria alone.
Loss of CTF fluorescence during microscopy.
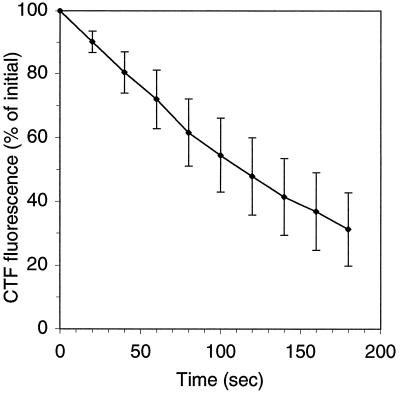
Microscope enumeration of a sample containing a low number of CTC-positive cells could take up to 2 h before a significant number of cells were counted. We observed that our counts per microscope field declined exponentially over time (decay rate, −0.58 h−1; r2 = 0.64). The possible causes of this included dissolution of the CTF and photobleaching from light exposure. Replicate slides that had been stored frozen exhibited similar cell losses during counting, although there were fewer positive cells to begin with after thawing. Cells rapidly lost CTF fluorescence during continuous exposure to blue excitation light (Fig. 2). The loss was exponential, and the decay rates varied from 11 to 47 h−1 (mean, 25 h−1; n = 73 cells). The decay rate was not related to the initial cell fluorescence intensity.
FIG. 2.
Loss of CTF fluorescence by individual cells in a microscope field when they were continuously exposed to blue excitation illumination from an Hg lamp. The mean fluorescence data for 73 cells are shown. The error bars indicate one standard deviation. The initial fluorescence values varied more than 10-fold (range, 900 to 11,000 RFU).
Storage of CTC samples.
Total cells, CTC-positive cells, and CTF fluorescence were preserved equally well whether preparations were stored as liquids in the refrigerator or frozen in liquid nitrogen for 28 days (Table 1). The mean cell fluorescence increased slightly during the first day of storage under both conditions. The number of active cells increased slightly during the first day in the refrigerator but not during the first day in liquid nitrogen.
TABLE 1.
Concentrations of total bacterial cells and CTC-positive bacterial cells and mean CTC fluorescence (emission at >630 nm) for samples stored at 4°C or in liquid nitrogen
| Day | Refrigerator storage (4°C)
|
Liquid N2 storage
|
||||
|---|---|---|---|---|---|---|
| Cell concn (107 cells ml−1)
|
Mean CTC fluores-cence (RFU) | Cell concn (107 cells ml−1)
|
Mean CTC fluores-cence (RFU) | |||
| Total bacteriaa | CTC-positive bacteria | Total bacteriaa | CTC-positive bacteria | |||
| 0 | 2.65 (0.16)b | 2.23 (0.11) | 8.26 (0.62) | 2.45 (0.07) | 2.08 (0.21) | 8.13 (0.36) |
| 1 | 2.73 (0.15) | 2.36 (0.08) | 9.76 (0.12) | 2.80 (0.17) | 2.08 (0.17) | 9.73 (0.10) |
| 4 | 2.83 (0.06) | 2.37 (0.14) | 9.80 (0.04) | 2.98 (0.10) | 2.41 (0.11) | 9.49 (0.07) |
| 7 | 2.39 (0.38) | 2.40 (0.14) | 9.26 (0.07) | 2.10 (0.36) | 2.45 (0.30) | 9.19 (0.07) |
| 14 | 2.30 (0.18) | 2.34 (0.12) | 9.14 (0.07) | 2.63 (0.11) | 2.43 (0.15) | 9.44 (0.04) |
| 28 | 2.63 (0.10) | 2.23 (0.28) | 10.07 (0.10) | 2.50 (0.15) | 2.37 (0.15) | 9.77 (0.10) |
The initial concentration before CTC was added was 3.62 × 10⁷ ± 0.13 × 10⁷ cells ml−1 (n = 3).
Mean (standard deviation) based on three samples.
Detection of cells by flow cytometry.
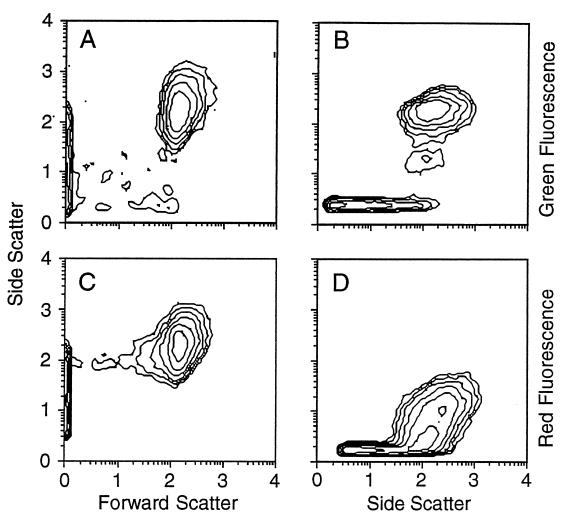
A typical set of cell cytograms from flow cytometric analyses of a sample is shown in Fig. 3. Total bacteria (Fig. 3A and B) were detected by triggering on the green fluorescence of the nucleic acid stain PicoGreen. Only cells that fell within the clear population regions in both cytograms were counted. Outside the instrument noise region, this meant that more than 99% of the events were counted as cells. In the CTC analysis (Fig. 3C and D) the instrument was triggered by red CTF fluorescence, and again positive cells had to fall in both regions. In the CTC cytogram (Fig. 3D), the CTC signal was not clearly separated from the background. A diagonal line (data not shown) was used to define the bottom edge of the positive region, which may have included some background noise or may have excluded some weakly fluorescing cells.
FIG. 3.
Flow cytometric detection of total bacteria stained with PicoGreen (A and B) and CTC-positive cells (C and D). Only cells within the side scatter-versus-forward scatter region (A and C) and the side scatter-versus-fluorescence region (B and D) were counted.
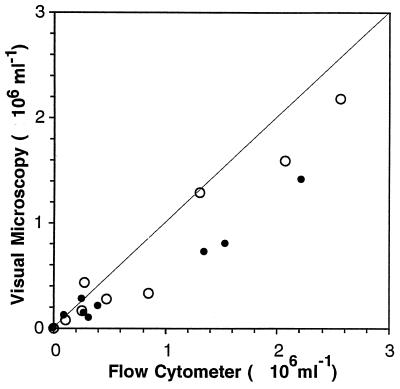
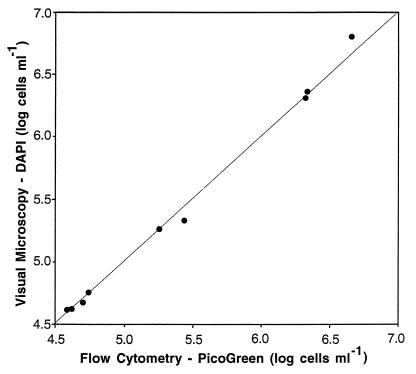
When enumeration by visual microscopy and enumeration by flow cytometry were compared directly, fewer CTC-positive cells were detected visually than by flow cytometry (Fig. 4). For the 18 samples compared, the visual counts averaged 70% (range, 15 to 160%) of the flow cytometric counts. In only two of the samples were the visual counts significantly higher than the cytometric counts. In contrast, the visual counts of total bacteria (preparations stained with DAPI) were highly correlated (r2 = 0.999) with the total counts obtained by flow cytometry (preparations stained with PicoGreen) (Fig. 5).
FIG. 4.
Comparison of counts of CTC-positive cells determined by visual microscopy and flow cytometry. Samples were obtained from a dilution culture daily for 5 days and were incubated with CTC for 5 min (●) and 40 min (○). The proportion of CTC-active cells ranged from 2 to 50% in this experiment.
FIG. 5.
Comparison of total cell counts determined by visual microscopy and by flow cytometry. Cells were incubated with CTC and then stained with PicoGreen for flow cytometry and with DAPI for visual microscopy. The coefficients of variation for the visual counts (two replicate slides) ranged from 1 to 33% (mean, 13%), and coefficients of variation for flow cytometry (three replicates) ranged from 2 to 8% (mean, 3.9%).
Positive control experiments with SDT.
Addition of SDT to cells incubated with CTC generally increased the proportion of CTC-positive cells (Table 2). In fact, in all of the experiments except experiment 5, an SDT concentration of 5 mM or higher increased the proportion of CTC-positive cells. Increasing the time of exposure to SDT from 10 to 20 min did not increase the number of CTC-active cells. In addition, it did not matter whether the cells were fixed before or after the SDT treatment, although high SDT concentrations distorted the shapes of live cells and made the DAPI images difficult to count. Concentrations of SDT greater than 500 mM in one experiment (data not shown) did not increase the number of CTC-positive cells. SDT had the smallest effect on the unenriched preparations (experiment 2), in which the percentage of CTC-active cells was low (6%) when the standard method was used.
TABLE 2.
Percentages of CTC-active cells after different treatments with the reducing agent SDT
| SDT concn (mM) | % of CTC-active cells
|
||||||
|---|---|---|---|---|---|---|---|
| Preserved cellsa
|
Live cellsb
|
||||||
| Expt 2 (unenriched) | Expt 3 (enriched) | Expt 4 (enriched) | Expt 5 (unenriched) | Expt 2 (unenriched) | Expt 3 (enriched) | Expt 4 (enriched) | |
| 0 (control)c | 6 | 12 | 12 | 10 | 6 | 12 | 12 |
| 5 | 6 | 20 | 29 | 6 | 43 | 7 | |
| 50 | 7 | 24 | 21 | 8 | 9 | 15 | 19 |
| 100 | 22 | 15 | 24 | ||||
| 300 | 14 | ||||||
| 500 | 32 | 14 | 41 | ||||
Cells were fixed with 1% paraformaldehyde after the CTC treatment and before rinsing and the SDT treatment.
Cells were fixed after the CTC and SDT treatments.
Data obtained when the regular CTC technique was used.
Short-term CTF kinetics experiment.
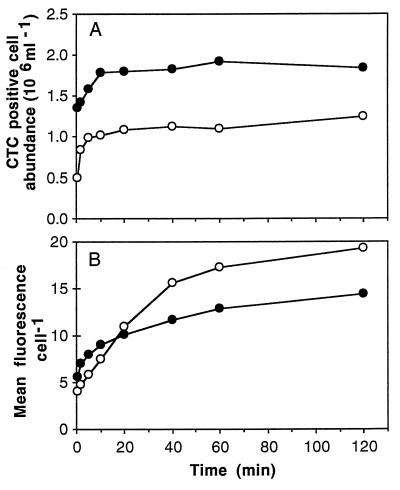
CTC reduction in many cells occurred very rapidly (Fig. 6). In this experiment the first sample was fixed 30 s after addition of CTC, and the concentration of CTC-positive cells increased from zero to 5 × 10⁵ cells ml−1 in the unenriched, static preparation and from zero to more than 106 cells ml−1 in the enriched, static preparation. These concentrations represented 35 and 54% of the total bacteria in these preparations, respectively. In these growing dilution cultures the numbers of active bacteria reached maxima after about 40 min for the unenriched preparation and after 10 min for the enriched preparation. At these time points, about 85% of the bacteria were CTC positive in the unenriched preparation, and 70% of the enriched bacteria were CTC positive. In neither preparation was there a significant change in the total cell number for the first 60 min. After this, there was a decline in the total number of cells, especially at 480 min (data not shown).
FIG. 6.
Flow cytometry results from time course experiments in which we examined CTC reduction in a dilution culture of marine bacterioplankton (○) and in the same culture enriched with yeast extract (●). (A) Abundance of CTC-positive cells. (B) Mean levels of red fluorescence per cell for active cells. Note that CTC reduction was detectable within 30 s (the first sample) in both experiments.
The mean level of CTF fluorescence per cell (Fig. 6B) continued to increase in both preparations to a maximum of 19.2 relative fluorescence units (RFU) after 120 min for the unenriched preparation and was still increasing between 2 and 8 h, the last two sample times, for the enriched preparation. The level of fluorescence per cell in the unenriched preparation started out lower than the level of fluorescence per cell in the enriched preparation but reached a maximum value that was 28% higher than the maximum value observed with the enriched preparation (15.0 RFU).
Oxygen bubbling effect.
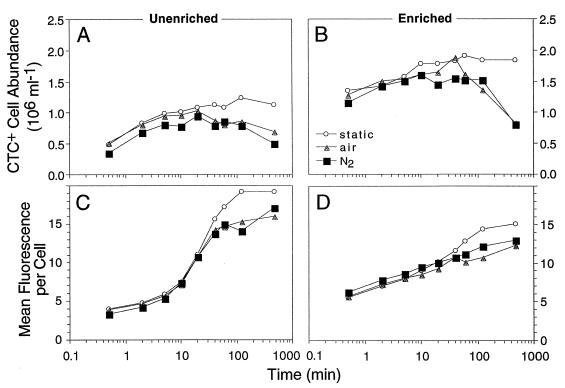
In preparations subjected to three treatments (bubbled with N2, bubbled with air, and static) the initial increases in the number of CTC-active cells were comparable, but after about 20 min the numbers of active cells in the two bubbled preparations declined, while the number of active cells in the static preparation continued to increase (Fig. 7A and B). Only at one point (40 min) during the air-bubbled enriched treatment did a preparation reach a level comparable to the levels observed under static conditions. Similarly, the amount of CTF fluorescence per cell in the bubbled and static preparations increased in parallel until about 40 min; then the cell fluorescence under static conditions continued to increase, while the cell fluorescence of the bubbled preparation increased more slowly or leveled off. This pattern was observed for both the enriched and unenriched preparations.
FIG. 7.
CTC reduction in cultures bubbled with nitrogen gas or air or not bubbled. (A and B) Changes in the abundance of CTC-positive cells. (C and D) Mean levels of cell fluorescence. Panels A and C show the results obtained with an unenriched bacterioplankton culture, and panels B and D show the results obtained with the same culture enriched with 0.01% yeast extract 4 h prior to the experiment. Note the logarithmic abscissa for the samples taken between 30 s and 480 min after CTC was added.
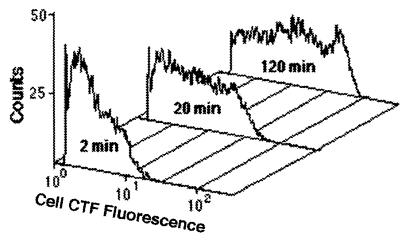
The distribution of cell activity changed dramatically over the time course of CTC exposure (Fig. 8). Not only did the mean activity increase, but the maximum activity increased as well. A clear difference from the baseline value was not observed, even after 120 min. The cell population at 120 min exhibited a wide range of activity level per cell.
FIG. 8.
Representative activity histograms for three samples obtained from the unenriched, static preparation in the bubble experiment. While the mean and maximum CTF fluorescence values per cell clearly increased with time of exposure to CTC, the positive population never separated from the baseline, suggesting that there was a continuum of activity which extended to below the detection levels.
Dilution culture growth curve.
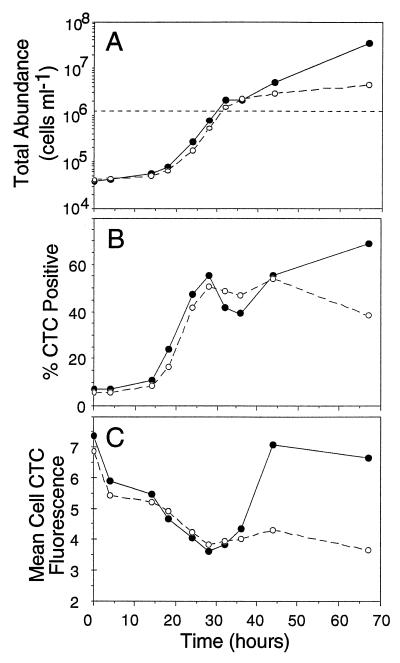
In a typical dilution culture, bacterial abundance follows a pattern analogous to a logistic growth curve; there are lag, exponential, and stationary phases, and ultimately levels higher than the original in situ concentration are reached (1, 28). In our experiment (Fig. 9A) enrichment shortened the lag time by only about 2 h and did not affect the exponential growth rate, but it resulted in a higher standing stock concentration of bacteria after 42 h compared to the unenriched preparation. The number of CTC-positive cells began to increase prior to growth of the total population, indicating that CTC-positive cells were the most active cells. Between 14 and 18 h, the CTC-positive portion of the cells began to increase, and the percentage of positive cells increased from less than 10% to 16 and 24% for the unenriched and enriched preparations, respectively. The initial concentration of CTC-negative cells (data not shown) was higher, and the number of CTC-negative cells began to increase between 18 and 24 h, after the CTC-positive cells had begun to grow. The percentage of positive cells peaked in the middle of the exponential phase (28 h), when the growth rate was maximal (Fig. 9B). The mean CTF fluorescence per cell declined sharply for both preparations during the lag phase, especially in the first 4 h, when cell abundance showed virtually no change. Fluorescence continued to decline until it reached a minimum at 28 h, which coincided with the time when the growth rates were maximal (Fig. 9A) and the percentages of positive cells were maximal (Fig. 9B). The amount of fluorescence per cell then increased during the stationary phase in the enriched preparation, to near the original level. The amount of cell fluorescence remained low, however, in the unenriched preparation.
FIG. 9.
Growth and CTC activity graphs for dilution cultures of marine bacterioplankton that were either enriched with glucose, NH4, and PO4 (●) or not enriched (○), showing changes in the total cell abundance (A), the proportion of CTC-active bacteria (B), and the mean level of CTC fluorescence per cell (C). The dashed line in panel A indicates the in situ cell concentration (1.2 × 10⁶ cells ml−1). The data in panels A and B are means based on triplicate samples, and the coefficients of variation between replicates did not exceed 9% (mean coefficient of variation, 3.7%). The data in panel C are means based on triplicates samples, and each replicate value is the mean value for between 200 and 20,000 cells (the mean coefficient of variation for the triplicate samples was 2.9%, and the maximum coefficient of variation was 9%).
DISCUSSION
Flow cytometry is a powerful tool for studying CTC activity in natural bacterial populations. Not only can the total number of cells and the number of CTC-positive cells be determined, but the amount of CTF fluorescence per cell can also be measured. The efficacy of flow cytometry for this application has been demonstrated previously for lakes (10), and it was demonstrated in this study for the first time for coastal marine bacteria. The fluorescence excitation and emission spectra of CTF (Fig. 1) are compatible with standard flow cytometer optics. Detection of CTF fluorescence in bacteria by flow cytometry was better than detection by visual microscopy in our study (Fig. 4). This contrasts with the results of del Giorgio et al. (10), who compared more than 50 freshwater lake samples. The difference in the results could be due to the difference in samples (freshwater versus marine) or to the fact that del Giorgio et al. used long CTC incubation periods (6 to 8 h) for microscope counting and 3-h incubation periods for flow cytometry.
Visual microscopy could undercount cells for a variety of reasons. CTF photobleaching is one mechanism that clearly contributes to this phenomenon (Fig. 2). Under the constant illumination of a microscope lamp, the average CTC-positive cell lost 50% of its fluorescence in less than 2 min. Stray excitation light could bleach cells that were not directly in the field of view by scattering and reflection under the coverslip. del Giorgio and Scarborough (11) observed significant fading of CTF fluorescence, which was ameliorated by using a commercially available antifade agent. Another possible factor is dissolution of CTF in the immersion oil. A 2-(4-iodophenyl)-3-(4-nitrophenyl)-5-phenyltetrazolium chloride (INT)-formazan precipitate has been found to leach or dissolve out of cells stored in oil within 20 min (31). This effect could be related to time and temperature and could result in the observed gradual decline in the number of cells per field during analysis. If this were important, then slides stored in the dark would also lose fluorescence. The evidence obtained for this possibility with CTC is mixed. We observed (data not shown) that on slides left at room temperature for 24 h in room light there was no decrease in the amount of CTF fluorescence per cell (as measured with the cooled charge-coupled device camera). Similarly, Rodriguez et al. (24) observed no reduction in the level of fluorescence in immersion oil after several days of storage at room temperature. In contrast, Choi et al. (7) reported that there was a decrease in the number of CTC-positive cells on slides under oil within 1 day. These factors were clearly not relevant to our flow cytometric analysis since cells were not lost and cells did not lose significant fluorescence while they were stored either in a refrigerator or in liquid N2 (Table 1). During analysis, cells were exposed to excitation illumination only very briefly.
On the basis of our CTC cell cytogram (Fig. 3D) and activity histograms (Fig. 8) it appears that flow cytometry may not detect all CTC-positive cells, since there is not a clear separation of positive cells from the baseline. It is possible that some portion of the population reduces a small amount of CTC and then stops respiring due to CTC toxicity (32). If we assume that there is a limit (threshold) below which a flow cytometer cannot detect CTF fluorescence in a cell and if there is a continuum of sensitivities to CTC toxicity, then we could imagine that cells reduce anywhere from a single molecule of CTC to the detectable level and above. This would produce fluorescence histograms like those which we observed, in which there is no clear separation from the baseline. Despite the possible incomplete detection by flow cytometry, the CTC-positive cell counts were significantly higher when cytometry was used than when visual inspection was used (Fig. 4). This indicates that more cells are below the threshold for detection by eye than are below the threshold for detection by flow cytometry. This may explain why such a long CTC incubation time (8 h) is needed before the numbers of active cells in natural lake samples are stable (11). In contrast to the CTC counts, the total counts determined by flow cytometry and visual microscopy were highly correlated (Fig. 5), as observed by other researchers who used the new blue-excited, nucleic acid-specific dyes, such as PicoGreen (20, 21).
Addition of SDT (Table 2) resulted in increases in the numbers of CTC-positive cells, even when the cells were fixed first with paraformaldehyde to stop their electron transport system (ETS) reactions. The cells that became CTC positive either did not reduce CTC or reduced an amount that was not detectable. After treatment with SDT, the CTC in these cells was artificially reduced and became fluorescent. These cells were a small proportion of the total cell population, but they clearly contained CTC. We hypothesized that a high proportion of the CTC-negative cells would be made positive by this treatment, but this was not the case. This could have been due to a lack of transport of CTC into the cells, a lack of reducing activity, or CTC toxicity. It is also possible that the rinsing step removed CTC from the cells. Larger cells may have more intracellular space for CTC and may be the cells that become visible upon reduction simply because they contain more CTC. The ETS-CTC reactions in an active cell are catalytic, and these reactions result in significant production and precipitation of fluorescent product in many cells. The SDT-CTC reaction is not catalyzed by enzymes, although it might be enhanced by the presence of a small amount of crystallized product in the cell. In this case, cells containing a small, undetectable amount of CTF may be made visible by SDT treatment.
CTC reduction occurred very rapidly (Fig. 6), a result similar to the time course results obtained by Zimmermann et al. (35), who used the tetrazolium salt INT with natural lake bacteria. These authors found that the maximum number of active bacteria was observed in the first 2 min of incubation. Similarly, del Giorgio et al. (10) observed very rapid uptake and reduction of CTC in lake bacteria. The rapid reduction of CTC permitted short incubation times, which minimized incubation artifacts and yielded results that were more indicative of the in situ bacterial activity.
Preliminary observations (22a) of bacterial cultures incubated with CTC with and without stirring suggested that CTC might not efficiently compete with oxygen for electrons from the electron transport system. The unstirred (static) culture produced more reduced product than the stirred culture produced. Our experiment in which bubbled nitrogen and air were used was designed to produce the following three levels of oxygen available to the cells: low (nitrogen), intermediate (static), and high (air). Our results were therefore surprising (Fig. 7). The static treatment (intermediate O2 level) yielded more CTC-positive cells and a higher level of fluorescence per cell whether the preparation was enriched or not, especially after 20 min of bubbling. The results obtained with the two bubbled treatments were not consistently different. This led to the possibility that bubbling itself reduced the respiratory activity of the cells and to the possibility that the difference due to bubbling-induced turbulence was greater than any difference due to O2 levels. Previous experience with bacterial cultures could lead to the conclusion that bubbling, mixing, or turbulence should increase cell activity and growth. These cells used in the experiments, however, were natural assemblages recently placed in laboratory containers, and their reactions to turbulence may have been different than the reactions of cells maintained in culture.
It is tempting to interpret the growth of cells in a dilution culture (Fig. 9) as logistic growth. It should be kept in mind, however, that a dilution culture is a complex mixture of an unknown number of bacterial species from nature, not a single pure culture. In our experiment, enrichment had remarkably little effect on the growth curves of the cultures. This may have been due to a high level of labile dissolved organic carbon in the ambient water at the time of sampling. The proportion of CTC-positive cells was positively correlated with growth rate in the dilution culture experiment (Fig. 9). The number of CTC-positive bacteria began to increase before the size of the total population increased and peaked when the growth rate was maximal (28 h). In both the enriched preparation and the unenriched preparation, there was a second increase in the percentage of active cells. This could have been due to a second, slower growing species that became dominant in the mixed culture. In the enriched preparation, the total abundance and the percentage of CTC-positive cells continued to increase until the end of the experiment at 68 h. Since the proportion of positive cells increased from less than 10% to approximately 50% over the course of the experiment and the total population size increased almost 2 orders of magnitude, the numbers of CTC-negative cells increased as well (data not shown). There are at least two possible explanations for this. First, there could have been a subpopulation of cells that simply did not reduce CTC yet were active and growing. This possibility cannot be ruled out by the data that are available. Sherr et al. (25), however, examined a large number of marine bacterial strains and reviewed the previously published data, and they did not find a single species that did not reduce CTC. The second possible explanation is that the actively growing cells produced progeny, some portion of which became dormant or inactive. This may be an effective survival strategy for cells living in an environment containing low levels of easily assimilated dissolved organic matter but having sporadic, unpredictable sources of dissolved organic carbon.
The decrease in cell fluorescence as the growth rate increased (Fig. 9C) was not expected. It is interesting that the amount of fluorescence per cell declined rapidly during the first 4 h of incubation, prior to any change in the total or CTC-positive cell abundance. This decline continued until a nadir was reached at the point of most rapid cell growth (28 h). One possible explanation for this is simply that the more rapidly growing cells were smaller and therefore had fewer intracellular sites for CTC reduction. Coastal marine bacteria grown in a similar way, however, are usually larger when they are growing fastest (27). Cell sizes were not measured in this study, so this remains speculative. The sharp initial decline observed is similar to results (data not shown) obtained when simple sample collection and placing samples in Teflon incubation bottles resulted in a rapid decline in cell CTF fluorescence with no change in the number of total or CTC-positive bacteria. This suggests that the data were an artifact of sampling and containment, such as the artifact recently described by Sherr et al. (26). It may be that bacteria in nature are very sensitive to spatial organization at microscales. Results showing that polymer gels are formed in seawater (4) and direct observations of small-scale patchiness of bacteria in nature (19) suggest that the spatial environment of bacteria in the sea may be more physically and chemically structured than previously thought (2).
Despite the fact that all actively respiring cells may not be detectable by the CTC method, this method provides a measurable, quantifiable indicator of active, respiring cells. Choi et al. (6) came to a similar conclusion after they examined CTC-containing preparations supplemented with antibiotics. These authors concluded that CTC activity reveals the most active cells in a mixed natural population. Sherr et al. (26) found that there is a positive correlation between CTC-active bacteria and thymidine and leucine incorporation rates for coastal and offshore marine bacteria. Several recent studies have demonstrated that there is a relationship between CTC reduction by bacteria and other measures of bacterial respiration in mixed or natural populations. Smith (30) showed that CTC activity correlated with respiration of the microbial size fraction in Chesapeake Bay samples. Cook and Garland (9) showed that in aerobic bioreactors respiration, as measured by bulk changes in CO2 levels, correlated with the integrated, single-cell CTF fluorescence of the mixed bacterial assemblages, as quantified by image analysis.
We believe that the CTC method, coupled with automated cytometric measurement, should allow studies to be done at temporal and spatial scales that better correspond to the scales at which bacterial cells live; that is, it should be possible to determine the respiratory status of an individual cell as related to the current or recent environmental conditions. Not only should a mean (or bulk) value be available for bacterial respiration, but it should be possible to examine variation within a mixed population and the distribution of respiration across a cell population. Flow cytometric analysis of single-cell activity under conditions that are very similar to in situ conditions and with short incubation periods can yield important new insights into the structure and functioning of the microbial food web in the ocean.
ACKNOWLEDGMENTS
We thank Ed Thier, Javier Aristegui, Chris Sieracki, and Ted Packard for help with various aspects of this work and interpretation of the results.
This work was supported in part by Maine Sea Grant summer student internship NA76RG0084 to J.N. and by NSF grant OCE-9423535.
REFERENCES
- 1.Ammerman J W, Fuhrman J A, Hagström Å, Azam F. Bacterioplankton growth in seawater. I. Growth kinetics and cellular characteristics in seawater cultures. Mar Ecol Prog Ser. 1984;18:31–39. [Google Scholar]
- 2.Azam F. Microbial control of oceanic carbon flux: the plot thickens. Science. 1998;280:694–696. [Google Scholar]
- 3.Carlson C A, Ducklow H W. Growth of bacterioplankton and consumption of dissolved organic carbon in the Sargasso Sea. Aquat Microb Ecol. 1996;10:69–85. [Google Scholar]
- 4.Chin W-C, Orellana M V, Verdugo P. Spontaneous assembly of marine dissolved organic matter into polymer gels. Nature. 1998;391:568–572. [Google Scholar]
- 5.Cho B C, Azam F. Major role of bacteria in biogeochemical fluxes in the ocean’s interior. Nature. 1988;332:441–443. [Google Scholar]
- 6.Choi, J. W., B. F. Sherr, and E. B. Sherr. Dead or alive? A large fraction of ETS-inactive marine bacterioplankton cells, as assessed by reduction of CTC, can become ETS-active with incubation and substrate addition. Aquat. Microb. Ecol., in press.
- 7.Choi J W, Sherr E B, Sherr B F. Relation between presence-absence of a visible nucleoid and metabolic activity in bacterioplankton cells. Limnol Oceanogr. 1996;41:1161–1168. [Google Scholar]
- 8.Cole J J, Pace M L. Why measure bacterial production? A reply to the comment by Jahnke and Craven. Limnol Oceanogr. 1995;40:441–444. [Google Scholar]
- 9.Cook K L, Garland J L. The relationship between electron transport activity as measured by CTC reduction and CO2 production in mixed microbial communities. Microb Ecol. 1997;34:237–247. doi: 10.1007/s002489900053. [DOI] [PubMed] [Google Scholar]
- 10.del Giorgio P A, Prairie Y T, Bird D F. Coupling between rates of bacterial production and the abundance of metabolically active bacteria in lakes, enumerated using CTC reduction and flow cytometry. Microb Ecol. 1997;34:144–145. doi: 10.1007/s002489900044. [DOI] [PubMed] [Google Scholar]
- 11.del Giorgio P A, Scarborough G. Increase in the proportion of metabolically active bacteria along gradients of enrichment in freshwater and marine plankton: implications for estimates of bacterial growth and production rates. J Plankton Res. 1995;17:1905–1924. [Google Scholar]
- 12.Epstein S S, Rossel J. Methodology of in situ grazing experiments: evaluation of a new vital dye for preparation of fluorescently labeled bacteria. Mar Ecol Prog Ser. 1995;128:143–150. [Google Scholar]
- 13.Fuhrman J, Azam F. Thymidine incorporation as a measure of heterotrophic bacterioplankton production in marine surface waters: evaluation and field results. Mar Biol. 1982;66:109–120. [Google Scholar]
- 14.Gasol J M, del Giorgio P A, Massana R, Duarte C M. Active versus inactive bacteria: size-dependence in a coastal marine plankton community. Mar Ecol Prog Ser. 1995;128:91–97. [Google Scholar]
- 15.Jahnke R A, Craven D B. Quantifying the role of heterotrophic bacteria in the carbon cycle: a need for respiration rate measurements. Limnol Oceanogr. 1995;40:436–441. [Google Scholar]
- 16.Kaprelyants A S, Kell D B. The use of 5-cyano-2,3-ditolyl tetrazolium chloride and flow cytometry for the visualization of respiratory activity in individual cells of Micrococcus luteus. J Microbiol Methods. 1993;17:115–122. [Google Scholar]
- 17.Karner M, Fuhrman J A. Determination of active marine bacterioplankton: a comparison of universal 16S rRNA probes, autoradiography, and nucleoid staining. Appl Environ Microbiol. 1997;63:1208–1213. doi: 10.1128/aem.63.4.1208-1213.1997. [DOI] [PMC free article] [PubMed] [Google Scholar]
- 18.Kirchman D L. Leucine incorporation as a measure of biomass production by heterotrophic bacteria. In: Kemp P F, Sherr B F, Sherr E B, Cole J J, editors. Handbook of methods in aquatic microbial ecology. Boca Raton, Fla: Lewis Publishers; 1993. pp. 509–512. [Google Scholar]
- 19.Krembs C, Juhl A R, Long R A, Azam F. Nanoscale patchiness of bacteria in lake water studied with the spatial information preservation method. Limnol Oceanogr. 1998;43:307–314. [Google Scholar]
- 20.Labaron P, Parthuisot N, Catala P. Comparison of blue nucleic acid dyes for flow cytometric enumeration of bacteria in aquatic systems. Appl Environ Microbiol. 1998;64:1725–1730. doi: 10.1128/aem.64.5.1725-1730.1998. [DOI] [PMC free article] [PubMed] [Google Scholar]
- 21.Marie D, Vaulot D, Partensky F. Application of the novel nucleic acid dyes YOYO-1, YO-PRO-1, and PicoGreen for flow cytometric analysis of marine prokaryotes. Appl Environ Microbiol. 1996;62:1649–1655. doi: 10.1128/aem.62.5.1649-1655.1996. [DOI] [PMC free article] [PubMed] [Google Scholar]
- 22.Monger B C, Landry M. Flow cytometric analysis of marine bacteria with Hoechst 33342. Appl Environ Microbiol. 1993;59:905–911. doi: 10.1128/aem.59.3.905-911.1993. [DOI] [PMC free article] [PubMed] [Google Scholar]
- 22a.Packard, T. Personal communication.
- 23.Pomeroy L R, Sheldon J E, Sheldon W M. Changes in bacterial numbers and leucine assimilation during estimations of microbial respiratory rates in seawater by the precision Winkler method. Appl Environ Microbiol. 1994;60:328–332. doi: 10.1128/aem.60.1.328-332.1994. [DOI] [PMC free article] [PubMed] [Google Scholar]
- 24.Rodriguez G G, Phipps D, Ishiguro K, Ridgway H F. Use of fluorescent redox probe for direct visualization of actively respiring bacteria. Appl Environ Microbiol. 1992;58:1801–1808. doi: 10.1128/aem.58.6.1801-1808.1992. [DOI] [PMC free article] [PubMed] [Google Scholar]
- 25.Sherr, B. F., P. del Giorgio, and E. B. Sherr. Estimating abundance and single-cell characteristics of actively respiring bacteria via the redox dye, CTC. Aquat. Microb. Ecol., in press.
- 26.Sherr, E. B., B. F. Sherr, and C. T. Sigmon. Comparison of metabolic activity of marine bacteria during incubation with activity of in situ bacterioplankton. Submitted for publication.
- 27.Sieracki M E, Johnson P W, Sieburth J M. The detection, enumeration and sizing of aquatic bacteria by image-analyzed epifluorescence microscopy. Appl Environ Microbiol. 1985;49:799–810. doi: 10.1128/aem.49.4.799-810.1985. [DOI] [PMC free article] [PubMed] [Google Scholar]
- 28.Sieracki M E, Sieburth J M. Sunlight-induced growth delay of planktonic marine bacteria in filtered seawater. Mar Ecol Prog Ser. 1986;33:19–27. [Google Scholar]
- 29.Sieracki M E, Viles C L. Distributions and fluorochrome-staining properties of sub-micrometer particles and bacteria in the North Atlantic. Deep Sea Res. 1992;39:1919–1929. [Google Scholar]
- 30.Smith E M. Coherence of microbial respiration rate and cell-specific bacterial activity in a coastal planktonic community. Aquat Microb Ecol. 1998;16:27–35. [Google Scholar]
- 31.Tabor P S, Neihof R A. Improved method for determination of respiring individual microorganisms in natural waters. Appl Environ Microbiol. 1982;43:1249–1255. doi: 10.1128/aem.43.6.1249-1255.1982. [DOI] [PMC free article] [PubMed] [Google Scholar]
- 32.Ullrich S, Karrasch B, Hoppe H-G, Jeskulke K, Mehrens M. Toxic effects on bacterial metabolism of the redox dye 5-cyano-2,3-ditolyl tetrazolium chloride. Appl Environ Microbiol. 1996;62:4587–4593. doi: 10.1128/aem.62.12.4587-4593.1996. [DOI] [PMC free article] [PubMed] [Google Scholar]
- 33.Veldhuis M J W, Cucci T L, Sieracki M E. Cellular DNA content of marine phytoplankton using two new fluorochromes: taxonomic and ecological implications. J Phycol. 1997;33:527–541. [Google Scholar]
- 34.Viles C L, Sieracki M E. Measurement of marine picoplankton cell size by using a cooled, charge-coupled device camera with image-analyzed fluorescence microscopy. Appl Environ Microbiol. 1992;58:584–592. doi: 10.1128/aem.58.2.584-592.1992. [DOI] [PMC free article] [PubMed] [Google Scholar]
- 35.Zimmermann R, Iturriaga R, Becker-Birck J. Simultaneous determination of the total number of aquatic bacteria and the number thereof involved in respiration. Appl Environ Microbiol. 1978;36:926–935. doi: 10.1128/aem.36.6.926-935.1978. [DOI] [PMC free article] [PubMed] [Google Scholar]


