

Abstract
Aims: To develop and validate a nomogram using retinal vasculature features and clinical variables to predict coronary artery disease (CAD) in patients with suspected angina.
Methods: The prediction model consisting of 795 participants was developed in a training set of 508 participants with suspected angina due to CAD, and data were collected from January 2018 to June 2019. The held-out validation was conducted with 287 consecutive patients from July 2019 to November 2019. All patients with suspected CAD received optical coherence tomography angiography (OCTA) examination before undergoing coronary CT angiography. LASSO regression model was used for data reduction and feature selection. Multivariable logistic regression analysis was used to develop the retinal vasculature model for predicting the probability of the presence of CAD.
Results: Three potential OCTA parameters including vessel density of the nasal and temporal perifovea in the superficial capillary plexus and vessel density of the inferior parafovea in the deep capillary plexus were further selected as independent retinal vasculature predictors. Model clinical electrocardiogram (ECG) OCTA (clinical variables+ECG+OCTA) was presented as the individual prediction nomogram, with good discrimination (AUC of 0.942 [95% CI, 0.923–0.961] and 0.897 [95% CI, 0.861–0.933] in the training and held-out validation sets, respectively) and good calibration. Decision curve analysis indicated the clinical applicability of this retinal vasculature nomogram.
Conclusions: The presented retinal vasculature nomogram based on individual probability can accurately identify the presence of CAD, which could improve patient selection and diagnostic yield of aggressive testing before determining a diagnosis.
Keywords: Coronary artery disease, Optical coherence tomography angiography, Retinal vasculature, Nomogram, Diagnosis, Prediction
See editorial vol. 29: 563-564
Introduction
Angina is the most common initial manifestation of coronary artery disease (CAD), and patients with new-onset angina might experience cardiac events in 1–2 years 1) . Therefore, it is critical to early detect and timely manage the suspected angina due to CAD 2) . Great improvements had been made in clinical rapid assessments of suspected CAD 3) , but many patients remained misdiagnosed. In the current context, more and more clinical trials have sought to streamline patient selection in identifying CAD. Several population-derived risk scores focused on the accuracy and comparability of coronary computed tomography angiography (CCTA) examination have thus been developed 4 - 6) . Simple and accurate examinations continue to be needed in patient populations with suspected CAD before settling on a diagnosis.
Retinal vasculature holds sufficient information regarding vascular health 7 - 10) , heart failure 11) , hypertension 12) , and subtypes of stroke 13) . With the assistance of deep learning, recent studies have explored the value of retinal imaging in the prediction of cardiovascular risk factors 14) , as well as the changes of retinal microvasculature affected by hypertension 15) and other chronic diseases 16) . Besides, retinal vasculature was found to be associated with CAD, which could provide additional implications on cardiovascular risks coexisting with microvascular dysfunction in patients 17 , 18) . However, these studies mostly focused on fundus photographs, which contained limited measurable information on retinal vasculature. Optical coherence tomography angiography (OCTA) is an automatic ophthalmic technique used to noninvasively visualize and quantitatively measure the ocular structures. An optimal approach with the implementation of retinal vasculature features, measured by OCTA examination, to explore the availability and clinical usefulness in predicting CAD has yet to be developed.
Aim
Therefore, in this cross-sectional study, we aimed to develop and validate a nomogram on the basis of quantified retinal vasculature features among patients with suspected angina due to CAD. If this model could be clinically used to predict the presence of CAD, it might benefit the medical community in terms of optimizing patient selection. In the meantime, it might also improve the diagnostic yield and cost-effectiveness of CCTA or coronary angiography (CAG) examinations.
Materials and Methods
Study Population
This was a cross-sectional study mainly conducted in the Department of Cardiology, Guangdong Provincial People’s Hospital—a tertiary hospital and key cardiovascular institute in South China. The study was approved by the Research Ethics Committee of the hospital (No. GDREC2019554H(R1)) and was performed according to the Declaration of Helsinki. Patient consent was obtained prior to the study.
The study was designed to collect demographic, clinical, and imaging data for patients with suspected chest pain due to CAD referred by primary-care cardiologists. All the participants underwent CCTA examinations. The confirmation of CAD on CCTA examination referred to the presence of lumen diameter reduction ≥ 50% in at least one major coronary artery. Overall, from January 2018 to June 2019, our training set consecutively included 508 participants: 281 patients with CAD and 227 participants without CAD. Of the 508 participants, 346 were males and 162 females, with a mean age of 59 years. From July 2019 to November 2019, a held-out validation set study was performed using the same inclusion criteria as the training set, resulting in 287 participants: 140 patients with CAD and 147 participants without CAD. Of the 287 participants, 176 were males and 111 females, with a mean age of 59 years. All the included participants received an OCTA examination before the CCTA procedure.
Exclusion criteria included patients with 1) pre-existing hypertensive or diabetic retinopathy (HR or DR, respectively) based on the medical history provided and the clinical examination results of slit-lamp biomicroscopy, indirect ophthalmoscopy, two 45-degree mydriatic colour fundus photographs, and OCTA. 2) uncooperating with ophthalmic examinations; or 3) moderate or high refractive error (≥±3 dioptres). Patients with prior CAD and revascularisation were also excluded.
Clinical Data
A structural interview before OCTA and CCTA examinations was conducted to collect baseline data on the presence of cardiovascular risk factors. The participants’ age, sex, body mass index, and history of hypertension and diabetes mellitus—as well as the baseline cholesterol values—were documented. A resting electrocardiogram (ECG) was performed for all patients on admission, which was recorded as normal or abnormal depending on the manifestation of regional change in ST segment or T wave. The thresholds for laboratory risk factors used in stratified analyses were defined according to the guidelines on the management of dyslipidemia 19) .
Retinal Image Acquisition and Assessment
OCTA (RTVue-XR Avanti; Optovue, Fremont, CA, USA) is a fast (<1 minute per eye) ophthalmic examination with a 840-nm-wavelength spectral-domain OCT that generates 304×304 scans in 2.9 seconds at a speed of 70 kHz 20 , 21) . The device uses a split-spectrum amplitude-decorrelation angiography algorithm 22) .
Specifically, in this study, OCTA data consisted of the vasculature features of the macular and disc area. The vessel density (VD) of the superficial capillary plexus (SCP), deep capillary plexus (DCP), foveal density (FD-300), and radial peripapillary capillary (RPC) was measured. Further, the retinal nerve fiber layer (RNFL) thickness was quantified. Descriptions of the OCTA examination and retinal vasculature features are shown in the Supplemental Material and Supplemental Fig.1 .
Supplemental Fig.1. Example OCT angiograms of vessel density measurement in the non-CAD and CAD participants.
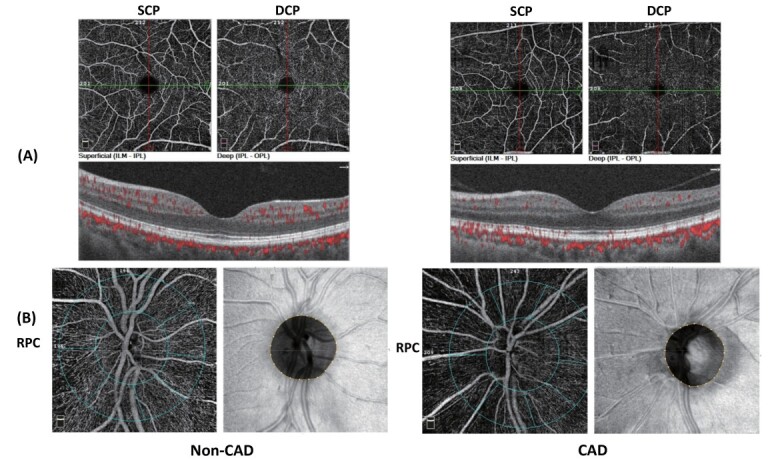
(A) Different layers of the retina demonstrated by OCTA, including the superficial capillary plexus (SCP), deep capillary plexus (DCP) and avascular zones.
(B) Retinal thickness and vessel density in the radial peripapillary capillary (RPC).
CCTA Procedure and Assessment
CCTA image acquisition and processing were performed according to the local protocol. All the participants were scheduled to undergo a ≥ 64-detector row CCTA evaluation. All coronary scans were analyzed by two experienced cardiologists blinded to the adjunctive investigations and retinal assessment results.
Machine Learning
The patients included in our analyses were characterized by ECG assessment and a total of nine readily available demographic clinical variables. A machine learning (ML) algorithm was constructed to differentiate patients with CAD from those without CAD. The ML technique was implemented using the R software (version 3.6.3; http://www.Rproject.org).
In the training data set, the least absolute shrinkage and selection operator (LASSO) method (glmnet) was employed to select the most predictive clinical variables and OCTA parameters according to the strength of the univariable association with outcomes 23) . The “rms” package was used to create models in order to classify patients with suspected CAD. The training set was created using 10-fold cross-validation. Briefly, the data set was randomly and equally divided into 10 folds, followed by the performance of 10 validation experiments. Each fold took turns to be the testing set, and the remaining nine folds were regarded as the training sets. In the end, the overall performance was provided on the basis of the combination of 10 experimental models. The ultimate point of this cross-validation was to obtain a more accurate estimate of model prediction.
Statistical Analysis
The mean±standard deviation was used to present quantitative variables with normal distributions, median (interquartile ranges) to present quantitative variables with abnormal distributions, and percentages to describe categorical variables.
OCTA data and clinical variables were selected by LASSO. The performance of Model OCTA was compared with the performance of Model ECG—the primary screening method for suspected CAD. Besides, to create a better model in predicting CAD, clinical variables selected by LASSO and ECG assessment were added to Model OCTA. This study aimed to provide a clinical quantitative tool for doctors to predict the individual probability of the presence of CAD. A nomogram was, therefore, built on the basis of the results of multivariable logistic regression analysis in the training set. Calibration analyses by the rms package were applied to evaluate the calibration of the nomogram. The nomogram was then applied to all the participants in the held-out validation set, with the total points for each participant calculated.
Decision curve analysis (DCA) by the “rmda” package was conducted in the held-out validation data set to assess the clinical application of the nomogram, where the individual net benefits at different threshold probabilities were calculated.
The classification performances of the models were reported using the area under the curve (AUC) and the associated 95% confidence interval (CI). All statistical tests with p<0.05 were considered significant.
Results
Clinical Characteristics
The flowchart of participant selection is shown in Supplemental Fig.2 , and the characteristics of the two data sets are presented in Table 1 . The presence of CAD was 281 (55.3%) and 140 (48.8%) in the training and held-out validation sets, respectively. The presence of an abnormal resting ECG was 118 (23.2%) and 57 (19.9%) in the training and held-out validation sets, respectively. Although there was a temporal disconnect, most of the clinical variables did not show significant differences between the training and held-out validation sets or within the non-CAD and CAD groups (see Supplemental Table 1 ). The analyses of retinal vasculature features among the study groups are provided in Supplemental Table 2 .
Supplemental Fig.2. Flow chart of participant selection.

Abbreviation: CAD, coronary artery disease; CCTA, coronary CT angiography; GDPH, Guangdong Provincial People’s Hospital.
Table 1. Baseline characteristics of the participants in training and held-out validation sets (n = 795) .
| Training set (n = 508) | p-value | Held-out validation set (n = 287) | p-value | |||
|---|---|---|---|---|---|---|
|
Non-CAD cohort (n = 227) |
CAD cohort (n = 281) |
Non-CAD cohort (n = 147) |
CAD cohort (n = 140) | |||
| Cardiovascular characteristics | ||||||
| Age (years), mean ± SD | 57.3 ± 10.4 | 59.8 ± 9.4 | 0.005* | 59.2 ± 11.3 | 60.1 ± 9.7 | 0.576 |
| Sex, n (%) | <0.001* | <0.001* | ||||
| Male | 121 (53.3) | 225 (80.1) | 65 (44.2) | 111 (79.3) | ||
| Female | 106 (46.7) | 56 (19.9) | 82 (55.8) | 29 (20.7) | ||
| BMI, n (%) | 0.046* | 0.008* | ||||
| <25 kg/m2 | 159 (70.0) | 173 (61.6) | 118 (80.3) | 93 (66.4) | ||
| ≥ 25 kg/m2 | 68 (30.0) | 108 (38.4) | 29 (19.7) | 47 (33.6) | ||
| Hypertension, n (%) | 0.008* | 0.759 | ||||
| Without | 62 (27.3) | 108 (38.4) | 51 (34.7) | 51 (36.4) | ||
| With | 165 (72.7) | 173 (61.6) | 96 (65.3) | 89 (63.6) | ||
| Diabetic mellitus, n (%) | 0.032* | 0.067 | ||||
| Without | 166 (73.1) | 228 (81.1) | 124 (84.4) | 106 (75.7) | ||
| With | 61 (26.9) | 53 (18.9) | 23 (15.6) | 34 (24.3) | ||
| Cholesterol levels | ||||||
| Triglycerides, n (%) | 0.001* | 0.001* | ||||
| ≤ 1.7 mmol/L | 176 (77.5) | 181 (64.4) | 116 (78.9) | 86 (61.4) | ||
| > 1.7 mmol/L | 51 (22.5) | 100 (35.6) | 31 (21.1) | 54 (38.6) | ||
| Total cholesterol, n (%) | <0.001* | 0.102 | ||||
| <4.1 mmol/L | 144 (63.4) | 122 (43.4) | 88 (59.9) | 82 (58.6) | ||
| ≥ 4.1 and ≤ 5.2 mmol/L | 31 (13.7) | 90 (32.0) | 23 (15.6) | 34 (24.3) | ||
| > 5.2 mmol/L | 52 (22.9) | 69 (24.6) | 36 (24.5) | 24 (17.1) | ||
| HDL-C, n (%) | <0.001* | <0.001* | ||||
| ≤ 1.0 mmol/L | 4 (1.8) | 151 (53.7) | 13 (8.8) | 75 (53.6) | ||
| > 1.0 mmol/L | 223 (98.2) | 130 (46.3) | 134 (91.2) | 65 (46.4) | ||
| LDL-C, n (%) | <0.001* | <0.001* | ||||
| <1.8 mmol/L | 5 (2.2) | 26 (9.3) | 3 (2.0) | 17 (12.1) | ||
| ≥ 1.8 and <2.6 mmol/L | 24 (10.6) | 84 (29.8) | 16 (10.9) | 45 (32.2) | ||
| ≥ 2.6 and <3.0 mmol/L | 4 (1.7) | 44 (15.7) | 10 (6.8) | 20 (14.3) | ||
| ≥ 3.0 mmol/L | 194 (85.5) | 127 (45.2) | 118 (80.3) | 58 (41.4) | ||
| ECG, n (%) | <0.001* | <0.001* | ||||
| Normal | 222 (97.8) | 168 (59.8) | 143 (97.3) | 87 (62.1) | ||
| Abnormal | 5 (2.2) | 113 (40.2) | 4 (2.7) | 53 (37.9) | ||
| VD in the SCP | ||||||
| Perifovea-tempo | 46.38 ± 4.44 | 45.73 ± 3.95 | 0.082 | 46.69 ± 4.68 | 44.20 ± 4.33 | <0.001* |
| Perifovea-nasal | 53.86 ± 4.17 | 52.83 ± 3.52 | 0.003* | 53.66 ± 4.23 | 51.95 ± 4.44 | 0.001* |
| VD in the DCP | ||||||
| Parafovea-inferior | 55.07 ± 5.23 | 50.94 ± 5.36 | <0.001* | 54.98 ± 4.87 | 49.39 ± 5.87 | <0.001* |
| Perifovea-superior | 52.93 ± 7.39 | 48.75 ± 6.92 | <0.001* | 52.68 ± 7.17 | 47.50 ± 7.17 | <0.001* |
| Superior-hemi | 52.12 ± 6.22 | 48.35 ± 5.72 | <0.001* | 51.94 ± 6.19 | 47.19 ± 5.56 | <0.001* |
Abbreviations: CAD, coronary artery disease; BMI, body mass index; HDL-C, high-density lipoprotein cholesterol; LDL-C, low-density lipoprotein cholesterol; ECG, electrocardiogram; SCP, superficial capillary plexus; DCP, deep capillary plexus.
Continuous variables are displayed as mean±standard deviation; categorical data are displayed as numbers (percentages).
The thresholds for total cholesterol were 4.1 and 5.2 mmol/L; the triglyceride value that defined hypertriglyceridemia was > 1.7 mmol/L, and the
threshold for HDL-C was 1.0 mmol/L. LDL-C was the primary target for cardiovascular disease prevention in different risk stratifications, with the goals of <1.8 mmol/L for the very high-risk group, <2.6 mmol/L for the high-risk group, and <3.0 mmol/L for the low- to moderate-risk group. *p<0.05 is considered statistically significant.
Supplemental Table 1. Baseline characteristics of participants in the training and held-out validation sets (n = 795) .
| Non-CAD cohort (n = 374) | p-value | CAD cohort (n = 421) | p-value | |||
|---|---|---|---|---|---|---|
| Training set (n = 227) | Held-out validation set (n = 147) | Training set (n = 281) | Held-out validation set (n = 140) | |||
| Cardiovascular characteristics | ||||||
| Age (years), mean±SD | 57.3±10.4 | 59.2±11.3 | 0.105 | 59.8±9.4 | 60.1±9.7 | 0.746 |
| Sex, n (%) | 0.086 | 0.850 | ||||
| Male | 121 (53.3) | 65 (44.2) | 225 (80.1) | 111 (79.3) | ||
| Female | 106 (46.7) | 82 (55.8) | 56 (19.9) | 29 (20.7) | ||
| BMI, n (%) | 0.028* | 0.330 | ||||
| <25 kg/m2 | 159 (70.0) | 118 (80.3) | 173 (61.6) | 93 (66.4) | ||
| ≥ 25 kg/m2 | 68 (30.0) | 29 (19.7) | 108 (38.4) | 47 (33.6) | ||
| Hypertension, n (%) | 0.129 | 0.689 | ||||
| Without | 62 (27.3) | 51 (34.7) | 108 (38.4) | 51 (36.4) | ||
| With | 165 (72.7) | 96 (65.3) | 173 (61.6) | 89 (63.6) | ||
| Diabetic mellitus, n (%) | 0.011* | 0.195 | ||||
| Without | 166 (73.1) | 124 (84.4) | 228 (81.1) | 106 (75.7) | ||
| With | 61 (26.9) | 23 (15.6) | 53 (18.9) | 34 (24.3) | ||
| Cholesterol levels | ||||||
| Triglycerides, n (%) | 0.753 | 0.549 | ||||
| ≤ 1.7 mmol/L | 176 (77.5) | 116 (78.9) | 181 (64.4) | 86 (61.4) | ||
| >1.7 mmol/L | 51 (22.5) | 31 (21.1) | 100 (35.6) | 54 (38.6) | ||
| Total cholesterol, n (%) | 0.770 | 0.013* | ||||
| <4.1 mmol/L | 144 (63.4) | 88 (59.9) | 122 (43.4) | 82 (58.6) | ||
| ≥ 4.1 mmol/L, ≤ 5.2 mmol/L | 31 (13.7) | 23 (15.6) | 90 (32.0) | 34 (24.3) | ||
| >5.2 mmol/L | 52 (22.9) | 36 (24.5) | 69 (24.6) | 24 (17.1) | ||
| HDL-C, n (%) | 0.001* | 0.974 | ||||
| ≤ 1.0 mmol/L | 4 (1.8) | 13 (8.8) | 151 (53.7) | 75 (53.6) | ||
| > 1.0 mmol/L | 223 (98.2) | 134 (91.2) | 130 (46.3) | 65 (46.4) | ||
| LDL-C, n (%) | 0.095 | 0.721 | ||||
| <1.8 mmol/L | 5 (2.2) | 3 (2.0) | 26 (9.3) | 17 (12.1) | ||
| ≥ 1.8 mmol/L, <2.6 mmol/L | 24 (10.6) | 16 (10.9) | 84 (29.8) | 45 (32.2) | ||
| ≥ 2.6 mmol/L, <3.0 mmol/L | 4 (1.7) | 10 (6.8) | 44 (15.7) | 20 (14.3) | ||
| ≥ 3.0 mmol/L | 194 (85.5) | 118 (80.3) | 127 (45.2) | 58 (41.4) | ||
Abbreviations: CAD, coronary artery disease; BMI, body mass index; HDL-C, high-density lipoprotein cholesterol; LDL-C, low-density lipoprotein cholesterol.
Continuous variable displayed as mean±SD; categorical data are displayed as number (percentage).
*p<0.05 is considered statistically significant.
Supplemental Table 2. Retinal vasculature features in the participants (n = 795) .
| Training set (n = 508) | Held-out validation set (n = 287) | ||||||
|---|---|---|---|---|---|---|---|
| Non-CAD cohort (n = 227) | CAD cohort (n = 281) | p-value | Non-CAD cohort (n = 147) | CAD cohort (n = 140) | p-value | ||
| VD of SCP (%), mean±SD | |||||||
| Whole-image | 49.38±4.10 | 48.71±3.39 | 0.046* | 49.61±4.18 | 47.68±3.94 | <0.001* | |
| Superior-hemi | 49.62±4.24 | 48.94±3.36 | 0.042* | 49.89±4.17 | 47.95±4.00 | <0.001* | |
| Inferior-hemi | 49.12±4.12 | 48.48±3.59 | 0.064 | 49.30±4.32 | 47.37±4.08 | <0.001* | |
| Fovea | 17.91±7.37 | 18.26±6.69 | 0.571 | 18.48±7.29 | 17.67±7.36 | 0.350 | |
| Parafovea | 51.70±4.88 | 50.97±3.86 | 0.060 | 51.99±4.99 | 49.74±4.94 | <0.001* | |
| Parafovea-superior-hemi | 51.79±5.18 | 51.23±3.88 | 0.164 | 52.16±5.02 | 50.05±5.06 | <0.001* | |
| Parafovea-inferior-hemi | 51.61±5.00 | 50.71±4.20 | 0.027* | 51.81±5.27 | 49.43±5.11 | <0.001* | |
| Parafovea-tempo | 51.72±4.84 | 51.10±4.15 | 0.122 | 51.70±5.01 | 50.16±4.71 | 0.008* | |
| Parafovea-superior | 52.46±5.88 | 51.91±4.15 | 0.224 | 52.79±5.46 | 50.46±5.77 | <0.001* | |
| Parafovea-nasal | 50.58±5.00 | 50.07±4.47 | 0.218 | 51.21±5.34 | 48.97±5.63 | 0.001* | |
| Parafovea-inferior | 52.04±5.89 | 50.79±4.79 | 0.009* | 52.24±5.67 | 49.39±5.54 | <0.001* | |
| Perifovea | 50.15±4.28 | 49.28±3.57 | 0.012* | 50.29±4.24 | 48.12±4.15 | <0.001* | |
| Perifovea-superior-hemi | 50.34±4.41 | 49.48±3.60 | 0.015* | 50.59±4.24 | 48.37±4.28 | <0.001* | |
| Perifovea-inferior-hemi | 49.97±4.30 | 49.08±3.75 | 0.014* | 49.98±4.44 | 47.87±4.23 | <0.001* | |
| Perifovea-tempo | 46.38±4.44 | 45.73±3.95 | 0.082 | 46.69±4.68 | 44.20±4.33 | <0.001* | |
| Perifovea-superior | 50.49±4.74 | 49.44±3.84 | 0.006* | 50.72±4.46 | 48.49±4.49 | <0.001* | |
| Perifovea-nasal | 53.86±4.17 | 52.83±3.52 | 0.003* | 53.66±4.23 | 51.95±4.44 | 0.001* | |
| Perifovea-inferior | 49.95±4.72 | 49.15±4.13 | 0.044* | 50.16±4.56 | 47.93±4.37 | <0.001* | |
| VD of DCP (%), mean±SD | |||||||
| Whole-image | 51.68±6.15 | 47.89±5.57 | <0.001* | 51.48±6.14 | 46.62±5.33 | <0.001* | |
| Superior-hemi | 52.12±6.22 | 48.35±5.72 | <0.001* | 51.94±6.19 | 47.19±5.56 | <0.001* | |
| Inferior-hemi | 51.22±6.27 | 47.42±5.64 | <0.001* | 51.00±6.32 | 45.99±5.42 | <0.001* | |
| Fovea | 32.80±8.62 | 32.62±7.43 | 0.799 | 33.62±8.19 | 31.84±8.56 | 0.074 | |
| Parafovea | 55.70±4.53 | 52.70±4.32 | <0.001* | 56.11±4.26 | 51.68±4.37 | <0.001* | |
| Parafovea-superior-hemi | 55.76±5.03 | 53.27±4.35 | <0.001* | 56.28±4.39 | 52.42±4.17 | <0.001* | |
| Parafovea-inferior-hemi | 55.64±4.56 | 52.13±4.58 | <0.001* | 55.93±4.32 | 50.93±4.90 | <0.001* | |
| Parafovea-tempo | 56.42±4.71 | 53.64±4.37 | <0.001* | 56.72±4.60 | 52.81±4.09 | <0.001* | |
| Parafovea-superior | 55.21±5.71 | 52.62±4.77 | <0.001* | 55.76±4.87 | 51.46±4.93 | <0.001* | |
| Parafovea-nasal | 56.10±4.48 | 53.59±4.60 | <0.001* | 56.96±4.10 | 53.06±4.65 | <0.001* | |
| Parafovea-inferior | 55.07±5.23 | 50.94±5.36 | <0.001* | 54.98±4.87 | 49.39±5.87 | <0.001* | |
| Perifovea | 53.09±6.76 | 49.13±6.14 | <0.001* | 52.88±6.72 | 47.69±5.92 | <0.001* | |
| Perifovea-superior-hemi | 53.55±6.70 | 49.64±6.25 | <0.001* | 53.44±6.63 | 48.39±6.21 | <0.001* | |
| Perifovea-Inferior-hemi | 52.66±7.06 | 48.61±6.34 | <0.001* | 52.31±7.10 | 47.03±5.99 | <0.001* | |
| Perifovea-tempo | 55.29±6.10 | 51.87±5.42 | <0.001* | 55.32±5.99 | 50.46±5.24 | <0.001* | |
| Perifovea-superior | 52.93±7.39 | 48.75±6.92 | <0.001* | 52.68±7.17 | 47.50±7.17 | <0.001* | |
| Perifovea-nasal | 52.46±7.36 | 48.35±6.75 | <0.001* | 52.15±7.35 | 46.95±6.43 | <0.001* | |
| Perifovea-inferior | 51.73±7.67 | 47.53±7.10 | <0.001* | 51.48±7.76 | 45.97±6.54 | <0.001* | |
| VD of FD-300 (%), mean±SD | |||||||
| FD-300 Area Density | 53.33±5.11 | 53.02±4.54 | 0.476 | 53.27±5.11 | 52.00±5.24 | 0.038* | |
| FD-300 Length Density | 12.30±1.91 | 11.98±1.56 | 0.039* | 12.23±1.98 | 11.49±1.98 | 0.002* | |
| RNFL thickness in the RPC (µm), mean±SD | |||||||
| Peripapillary | 113.70±14.07 | 114.60±13.86 | 0.471 | 115.86±12.74 | 113.70±15.12 | 0.192 | |
| Superior-hemi | 114.09±14.80 | 115.21±16.47 | 0.426 | 116.70±13.76 | 114.66±15.50 | 0.239 | |
| Inferior-hemi | 113.28±15.34 | 113.95±14.21 | 0.609 | 114.95±13.50 | 112.66±16.78 | 0.202 | |
| Tempo | 79.35±11.71 | 76.92±10.38 | 0.014* | 78.70±10.77 | 77.37±10.31 | 0.286 | |
| Superior | 137.0±20.38 | 138.54±22.08 | 0.442 | 140.49±19.43 | 137.61±20.24 | 0.220 | |
| Nasal | 98.20±16.89 | 100.13±17.36 | 0.208 | 100.86±16.64 | 99.64±18.41 | 0.557 | |
| Inferior | 145.12±22.24 | 147.47±20.88 | 0.219 | 148.03±20.15 | 144.96±24.51 | 0.246 | |
| Tempo-superior | 82.74±12.61 | 79.53±11.60 | 0.003* | 82.40±11.87 | 80.07±12.51 | 0.107 | |
| Superior-tempo | 136.66±24.31 | 133.43±23.72 | 0.132 | 140.02±21.20 | 132.56±21.67 | 0.003* | |
| Superior-nasal | 137.43±26.43 | 142.79±28.69 | 0.029* | 140.90±25.12 | 141.79±26.78 | 0.770 | |
| Nasal-superior | 106.34±19.14 | 109.89±21.03 | 0.049* | 109.71±19.45 | 109.27±21.10 | 0.854 | |
| Nasal-inferior | 88.01±17.30 | 87.91±16.72 | 0.948 | 89.79±16.77 | 87.60±18.89 | 0.300 | |
| Inferior-nasal | 141.27±28.20 | 143.95±26.93 | 0.276 | 144.82±26.29 | 141.94±30.28 | 0.390 | |
| Inferior-tempo | 150.02±26.31 | 151.95±23.77 | 0.386 | 152.09±23.32 | 148.78±26.10 | 0.258 | |
| Tempo-inferior | 75.53±13.86 | 73.92±11.97 | 0.161 | 74.57±12.77 | 74.05±10.81 | 0.715 | |
| VD of peripapillary (%), mean±SD | |||||||
| Whole-image | 55.40±3.39 | 55.61±2.89 | 0.460 | 55.94±3.05 | 54.75±3.53 | 0.002* | |
| Whole Image Capillary | 48.72±3.26 | 48.86±2.77 | 0.615 | 49.42±2.91 | 48.15±3.38 | 0.001* | |
| Inside Disc All | 60.46±4.56 | 60.36±3.84 | 0.785 | 60.30±4.36 | 58.76±4.63 | 0.004* | |
| Inside Disc Capillary | 51.04±5.44 | 50.64±4.70 | 0.374 | 50.74±5.43 | 49.29±5.24 | 0.022* | |
| Peripapillary All | 57.47±3.85 | 57.87±3.39 | 0.217 | 58.41±3.32 | 57.22±4.18 | 0.008* | |
| Peripapillary Capillary | 50.86±3.73 | 51.26±3.29 | 0.194 | 52.03±3.32 | 50.72±4.19 | 0.003* | |
| Superior-hemi All | 57.87±4.10 | 58.42±3.53 | 0.103 | 58.93±3.41 | 57.85±4.26 | 0.018* | |
| Inferior-hemi All | 57.05±3.85 | 57.27±3.69 | 0.499 | 57.84±3.48 | 56.53±4.40 | 0.005* | |
| Superior-hemi Capillary | 50.94±4.06 | 51.55±3.54 | 0.074 | 52.33±3.54 | 51.07±4.41 | 0.008* | |
| Inferior-hemi Capillary | 50.76±3.79 | 50.95±3.65 | 0.562 | 51.70±3.44 | 50.31±4.50 | 0.003* | |
| Nasal-superior | 47.20±4.80 | 47.94±4.42 | 0.069 | 48.53±4.34 | 47.73±5.44 | 0.168 | |
| Nasal-inferior | 46.48±4.76 | 46.31±4.62 | 0.698 | 47.31±5.01 | 45.62±5.82 | 0.009* | |
| Inferior-nasal | 49.98±5.49 | 50.67±5.51 | 0.162 | 51.34±4.68 | 49.70±5.32 | 0.006* | |
| Inferior-tempo | 55.69±5.55 | 56.46±5.41 | 0.118 | 56.99±5.30 | 55.98±6.30 | 0.143 | |
| Tempo-inferior | 52.50±4.59 | 52.21±4.74 | 0.475 | 52.88±4.29 | 51.79±5.08 | 0.051 | |
| Tempo-superior | 55.63±4.01 | 55.55±3.69 | 0.828 | 56.61±3.61 | 54.81±4.34 | <0.001* | |
| Superior-tempo | 53.56±5.80 | 54.08±4.93 | 0.272 | 55.39±5.01 | 53.63±5.72 | 0.006* | |
| Superior-nasal | 48.85±5.25 | 49.87±5.09 | 0.026* | 50.38±5.10 | 49.47±5.89 | 0.160 | |
Abbreviations: CAD, coronary artery disease; VD, vessel density; SCP, superficial capillary plexus; DCP, deep capillary plexus; FD, foveal density; RNFL, retinal nerve fiber layer; RPC, radial peripapillary capillary.
*p<0.05 is considered statistically significant.
Feature Selection
A total of 71 retinal vasculature features were reduced to five potential predictors (VD of the nasal and temporal perifovea in the SCP and VD of the inferior parafovea, superior perifovea, and whole-image, superior hemi in the DCP); and a total of nine clinical variables were reduced to four potential predictors (sex, total cholesterol, LDL-C and HDL-C) on the basis of 508 participants in the training set (see Fig.1 and Supplemental Fig.3 ).
Fig.1. Flow chart of feature selection.
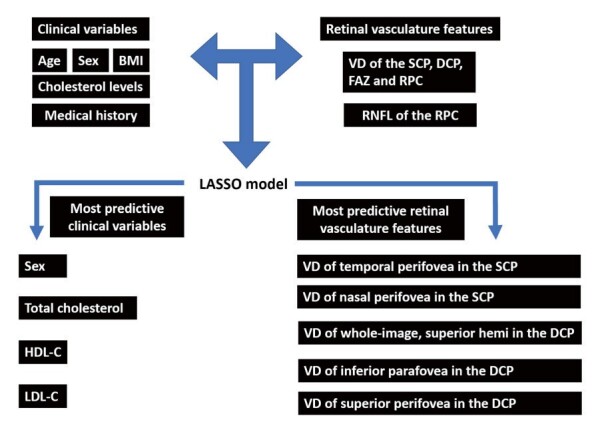
Abbreviation: BMI, body mass index; SCP, superficial capillary plexus; DCP, deep capillary plexus; RPC, radial peripapillary capillary; RNFL, retinal never fiber layer; VD, vessel density; HDL-C, high-density lipoprotein cholesterol; LDL-C, low-density lipoprotein cholesterol.
Supplemental Fig.3. Features selection using the LASSO binary logistic regression model.

(A) Tuning parameter (λ) selection in the LASSO model used 10-fold cross-validation via minimum criteria. The area under the curve (AUC) was plotted versus log(λ). A λ value of 0.0133, with the log (λ) of −4.33 was chosen according to 10-fold cross-validation. (B) A coefficient profile plot was produced against the log (λ) sequence. A vertical line was drawn at the value selected using 10-fold cross-validation.
Development, Apparent Performances, and Clinical Application of An Individual Prediction Model
Multivariable logistic regression analysis began with above four clinical variables, ECG assessment and five OCTA parameters, and then identified four clinical variables (sex, total cholesterol, LDL-C and HDL-C), ECG assessment, and three potential OCTA parameters (VD of the nasal and temporal perifovea in the SCP and VD of the inferior parafovea in the DCP) as independent predictors ( Table 2 ) . The Model clinical ECG OCTA that incorporated the selected independent predictors was presented as the retinal vasculature nomogram ( Fig.2 ) .
Table 2. Risk factors for predicting coronary artery disease in the nomogram.
| Intercept and variables | β | OR (95% CI) | p-value |
|---|---|---|---|
| Intercept | 16.816 | <0.001* | |
| Sex | −0.890 | 0.41 (0.30–0.57) | <0.001* |
| ECG | 1.898 | 6.67 (4.53–9.97) | <0.001* |
| Total cholesterol | 0.953 | 2.59 (2.12–3.20) | <0.001* |
| HDL-C | −4.009 | 0.02 (0.01–0.04) | <0.001* |
| LDL-C | −0.806 | 0.45 (0.37–0.54) | <0.001* |
| Temporal perifovea in the SCP | 0.154 | 1.17 (1.09–1.25) | <0.001* |
| Nasal perifovea in the SCP | −0.124 | 0.88 (0.82–0.95) | <0.001* |
| Inferior parafovea in the DCP | −0.165 | 0.85 (0.82–0.88) | <0.001* |
| C index | |||
| Training set | 0.942 (0.923–0.961) | ||
| Held-out validation set | 0.897 (0.861–0.933) |
Abbreviations: OR, odds ratio; CI, confidence interval; HDL-C, high-density lipoprotein cholesterol; LDL-C, low-density lipoprotein cholesterol; SCP, superficial capillary plexus; DCP, deep capillary plexus.
β is the regression coefficient. Cholesterol values are presented as categorical variables, and the retinal vasculature features are presented as continuous variables.
*p<0.05 is considered statistically significant.
Fig.2.Developed retinal vasculature nomogram.
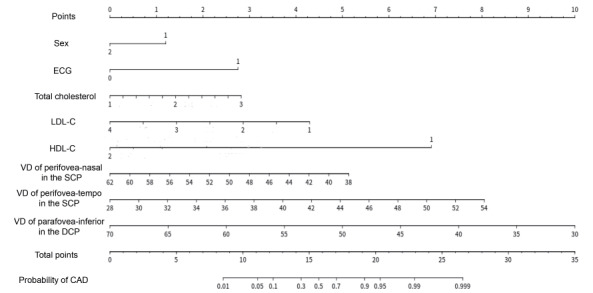
The clinical variables were presented as categorical variables. Number signature definition: Sex: 1=male and 2=female; Total cholesterol: 1=>5.2 mmol/L, 2=≥ 4.1 and ≤ 5.2 mmol/L, and 3=<4.1 mmol/L; LDL-C: 1=<1.8 mmol/L, 2=≥ 1.8 and <2.6 mmol/L, 3=≥ 2.6 and <3.0 mmol/L, and 4=≥ 3.0 mmol/L; HDL-C: 1=≤ 1.0 mmol/L and 2=>1.0 mmol/L.
The results of ECG assessment were presented as categorical variables: 0=normal and 1=abnormal.
The retinal vasculature features were presented as continuous variables.
Abbreviations: ECG, electrocardiogram; LDL-C, low-density lipoprotein cholesterol; HDL-C, high-density lipoprotein cholesterol; VD, vessel density; SCP, superficial capillary plexus; DCP, deep capillary plexus.
The calibration curves for the probability of CAD using this nomogram indicated good agreement between the prediction and observation in both the training and held-out validation sets ( Supplemental Fig.4 ) .
Supplemental Fig.4. Calibration curves of the nomogram in two data sets.

Calibration curves of the retinal vasculature nomogram in the (A) training and (B) held-out validation sets.
For the calibration curve, the Y-axis represents the actual presence of CAD, and the X-axis represents the predicted presence of CAD risk. The solid red line represents the performance of the nomogram, where a closer fit to the diagonal dotted line represents a better prediction.
Abbreviation: CAD, coronary artery disease.
Model ECG exhibited good performance in terms of predicting individuals with CAD, with an AUC of 0.690 (95% CI, 0.660–0.720) and 0.677 (95% CI, 0.634–0.720) in the training and held-out validation sets, respectively. Model OCTA exhibited the better performance than Model ECG in terms of predicting individuals with CAD, with an AUC of 0.758 (95% CI, 0.716–0.799) and 0.730 (95% CI, 0.673–0.788) in the training and held-out validation sets, respectively. With the addition of common clinical variables assessment into Model ECG and Model OCTA, the performance of Model clinical ECG (ECG+clinical variables) to predict CAD was significantly improved, with an AUC of 0.914 (95% CI, 0.891–0.937) and 0.850 (95% CI, 0.805–0.895) in the training and held-out validation sets, respectively; the performance of Model clinical OCTA (OCTA+clinical variables) to predict CAD was significantly improved, with an AUC of 0.910 (95% CI, 0.887–0.934) and 0.862 (95% CI, 0.819–0.905) in the training and held-out validation sets, respectively. The Model clinical ECG OCTA (nomogram) performed best in discriminating CAD from non-CAD participants, with an AUC of 0.942 (95% CI, 0.923–0.961) and 0.897 (95% CI, 0.861–0.933) in the training and held-out validation sets, respectively. The sensitivity and specificity in predicting CAD of these models are shown in Fig.3 .
Fig.3. Discrimination curves of the prediction models in two data sets.
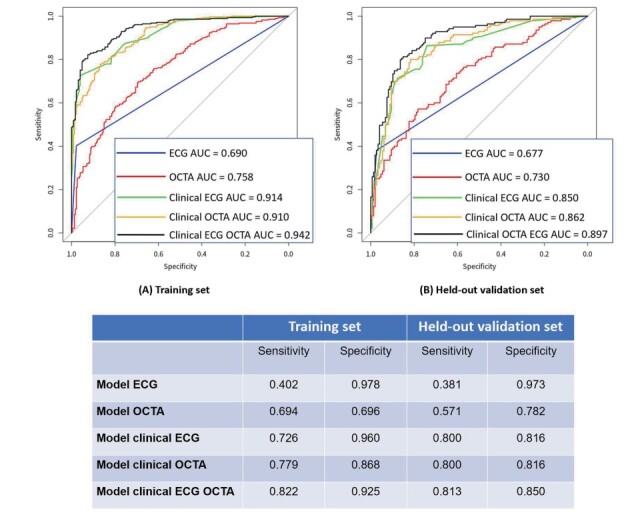
ROC curves for Model ECG, Model OCTA, Model clinical OCTA, Model clinical ECG, and Model clinical ECG OCTA (nomogram) in differentiating patients with CAD from those without CAD in the (A) training and (B) held-out validation sets.
Model clinical OCTA includes four clinical variables (sex, total cholesterol, HDL-C and LDL-C) and five OCTA parameters (VD of the nasal and temporal perifovea in the SCP and VD of the inferior parafovea, superior perifovea, and whole-image, superior hemi in the DCP).
Model clinical ECG includes four clinical variables (sex, total cholesterol, HDL-C and LDL-C) and ECG assessments.
Model clinical ECG OCTA (nomogram) includes four clinical variables (sex, total cholesterol, HDL-C and LDL-C), ECG assessments, and three OCTA parameters (VD of the nasal and temporal perifovea in the SCP and VD of the inferior parafovea in the DCP).
Abbreviations: ROC, receiver perator haracteristic urve; OCTA, optical coherence tomography angiography; ECG, electrocardiogram; CAD, coronary artery disease; VD, vessel density; SCP, superficial capillary plexus; DCP, deep capillary plexus; HDL-C, high-density lipoprotein cholesterol; LDL-C, low-density lipoprotein cholesterol.
The DCA for this retinal vasculature nomogram is presented in Fig.4 . A model is considered clinically useful when it has the highest net benefit across the threshold range, for which an individual is designated at high risk. Our decision curve showed that the threshold probability of a patient or doctor was 0%, which indicated that using this nomogram to predict CAD could add more benefits compared to either receiving or not receiving cardiac examination.
Fig.4. Decision curve analysis for the nomogram.
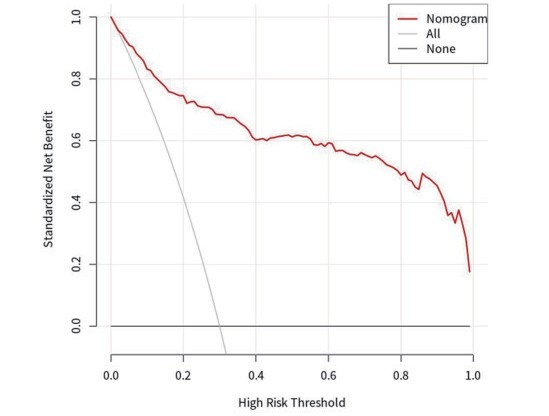
The Y-axis measures the net benefit. The red line represents the retinal vasculature nomogram. The gray line represents the assumption that all patients have CAD. The black line represents the assumption that no patient presents with CAD. The decision curve indicated that using the retinal vasculature nomogram in the current study to predict CAD could add more benefit than the receipt of cardiac examinations (such as CCTA or CAG) or no intervention.
Abbreviations: CAD, coronary artery disease; CCTA, coronary computed tomography angiography; CAG, coronary angiography.
Discussion
In this study, a diagnostic nomogram was developed and validated to identify CAD in patients with suspected angina. This nomogram incorporated retinal vasculature features, ECG assessment, and clinical variables showed the best performance in predicting CAD. A total of 71 candidate OCTA features were decreased to five potential independent predictors by the LASSO method. The implementation of the ML technique in the clinical setting could optimize the process of selecting appropriate candidates and improve the diagnostic yield of aggressive testing before determining a diagnosis. This developed nomogram also provided the individual probability of the presence of CAD in suspected patients. Such an easy-to-use nomogram might contribute to the prediction of CAD.
Overusing imaging modalities to diagnose CAD is a frequent phenomenon because of the fear of undertreatment. There has been an ongoing need to find a validated diagnostic model with optimal performance to direct downstream testing for CAD. In recent years, ML techniques have brought about many breakthroughs in classification tasks and emerged as highly effective methods for making predictions and performing decision-making in a number of disciplines 24) . Typically, ML allows computer algorithms to build a model from test in order to predict future outcomes on the basis of new input data 25) . It has gradually become a popular option and powerful tool across the cardiovascular domain 26 , 27) . With the implementation of ML, this study developed a nomogram using OCTA parameters and clinical risk factors to predict the individual probability of the presence of CAD.
The retinal vasculature features used in the prediction models showed considerable discrimination. With the assistance of deep learning, retinal images have recently been assessed for corresponding changes under the condition of hypertension 15) , hyperglycemia, and dyslipidemia 16) . Retinal imaging was also considered a potential biomarker in the assessment of cardiovascular diseases. A study has used fundus photographs via deep learning to predict cardiovascular risk factors, such as age, sex, systolic blood pressure, and major adverse cardiac events 14) . Another study has also explored the value of retinal images in predicting atherosclerosis 28) . Specifically, retinal vasculature features hold valuable and sufficient information to detect the development and progression of CAD 8) , which began with prior discoveries where patients with CAD were found to present with narrowing retinal arterioles 29 , 30) and decreased retinal VD 31 , 32) . As previously documented, the narrowing retinal arterioles were associated with a greater likelihood of obstructive stenosis (≥ 50%) in at least one major coronary artery 33) . A hypothesis has been put forth that an independent association between retinal arteriolar narrowing and incident CAD was the microvascular process 34) . The decreased retinal VD could be associated with the narrowing retinal arterioles, which might result from microvascular damage—such as the process of aging and hypertension—and from intimal thickening, medial hyperplasia, hyalinization, and sclerosis 34) . Besides, the decreased retinal VD could also result from endothelial dysfunction coexisted in CAD patients. Endothelial dysfunction is a systemic condition and has been detected in the coronary epicardial as well as in peripheral arteries 35) , in which peripheral endothelial function was found to be associated with coronary artery endothelial function 36) . The utility of retinal vasculature could significantly improve the estimate of the probability of CAD. OCTA is a noninvasive and measurable technique with multiple pieces of information on quantified retinal vasculature, which might provide more detailed messages in the assessment and prediction of cardiovascular diseases.
The discrimination performance of Model OCTA was better than Model ECG—a common and primary screening method in identifying patients with suspected angina due to CAD. The resting ECG was characterized by low sensitivity in detecting CAD before undergoing subsequent aggressive cardiac examinations and so was exercise ECG 37) . A recent study has reported the limited incremental value of ECG in assessing CAD, and therefore more effective methods of risk stratification were requested 38) . Our presented retinal vasculature nomogram shows the potential to reduce the need for further stress testing, improve the diagnostic yield, and increase feasibility for the diagnosis of CAD.
The presented nomogram was characterized by several strengths: First, the nomogram revealed a considerable ability to reach comparable discrimination performances, which indicated the potential of retinal vasculature in the assessment for suspected CAD patient. Second, ML algorithms are more adaptive than traditional statistical in managing complex medical data 39) . ML algorithms split input space into different cells based on every feature, which allows the algorithms to learn non-linear relation of data 40) . On the contrary, traditional statistical analysis assume the linear separability of the input space of data and thus attempts to find a hyperplane to cut the input space into two half-spaces, which makes it unable to deliver such approximation for complex data analysis 40) . In our study, both clinical data and ophthalmic data are easily obtained. Besides, LASSO method is commonly used and good at selecting the most predictive variables according to the strength of the univariable association with outcomes 23) . Third, it could reduce radiation exposure and associated cardiac examination costs. Both CCTA and CAG are regarded as primce methods for accurately diagnosing CAD. However, most patients found with minimal or without CAD were generally not suitable for such aggressive procedures. The SCOT-HEART trial revealed that only 25% of suspected patients undergoing CCTA examination were diagnosed with obstructive CAD 41) . Data from the National Cardiovascular Data Registry also indicated a low diagnostic yield of invasive CAG with 37.6% patients having obstructive CAD, regardless of the precatheterization rate of 83.9% in noninvasive testing 42) . Other concerns about CCTA or CAG examinations have also been raised in terms of their radiation exposure and potential poor image quality in patients with obesity, arrhythmia, or coronary calcification 43 , 44) . Hence, there is a need for clinically based models that can predict CAD and direct downstream aggressive testing. In recent years, emphasis has been placed on risk stratification and pretest probability methods in diagnosing CAD. For example, a study has compared the pretest probability of CAD between the Diamond and Forrester (DF) score and two CAD consortium scores recommended by the European Society of Cardiology. Their results showed the AUC of 0.713 versus 0.752 and 0.791 for the DF versus the other two CAD consortium models, respectively 6) . Another comparable study that applied coronary artery calcium scoring has showed great improvements in discrimination using the ML (with AUC increasing from 0.773 to 0.881) and CAD consortium models (with AUC increasing from 0.734 to 0.866) 45) . Alternatively, a nomogram consisting of easily measured retinal vasculature features, clinical variables and ECG assessment was developed and validated in the current study.
The clinical application of this nomogram is the most important argument based on the interpretation of an individual benefit with additional examination or care. In the current study, the DCA was plotted, which could offer novel insights into clinical outcomes on the basis of threshold probabilities. The results of the DCA revealed significant benefits of using the presented nomogram to predict the presence of CAD. The study suggests that this retinal vasculature nomogram could be a follow-up tool and gatekeeper to identify low-risk individuals before moving to further diagnostic testing. However, it is yet to determine whether a simple model that applied retinal vasculature features, ECG assessment, and clinical variables is preferable for use in the domain of assessment for CAD. Support from prospective randomized trials is needed to evaluate the effectiveness of such an approach.
We acknowledge several limitations in the current study: First, because of technique limitations, not all retinal vascular parameters—such as choroidal VD and thickness—could be collected in the study. Second, only a small sample of participants were included; and selection bias might exist in the participants recruitment. Further, data analysis from multicenter research would be better for this study; however, being a large cardiac center in South China, most patients with CAD are usually transferred here. Further extensive and prospective studies are needed to enhance and validate the clinical utility of this model.
Conclusions
A nomogram combining retinal vasculature features, ECG assessment, and clinical variables was developed and validated to predict CAD. OCTA is a noninvasive and novel ophthalmic examination, which could be suggested as a screening and follow-up tool for patients with suspected angina due to CAD prior to aggressive diagnostic testing. This nomogram suits the need for preventive therapy and improves patient selection and diagnostic yield of aggressive testing before determining the diagnosis.
Acknowledgements
The authors have no acknowledgements.
Disclosures
The authors declare that there is no conflict of interest.
Funding Sources
This work was supported by Science and Technology Program of Guangzhou, China (202002020049) (Xiaohong Yang); Project of Investigation on Health Status of Employees in Financial Industry in Guangzhou (Z012014075) (Xiaohong Yang); The National Natural Science Foundation of China (81870663) (Honghua Yu); The Talent Introduction Fund of Guangdong Provincial People’s Hospital (KJ012019087, Y012018145) (Honghua Yu); Medical Scientific Research Foundation of Guangdong Province of China (C2019044) (Manqing Huang).
Authors’ Contributions
Z.PT, Q. J, and L. ZX contributed equally to this work. Y. XH had full access to all the data in the study and take responsibility for the integrity of the data and the accuracy of the data analysis. Conception and design: Z. PT, Q. J, L. ZX, Y. HH, L. ZY, and Y. XH. Acquisition, analysis, or interpretation of data: All authors. Drafting of the manuscript: Z. PT, Q. J, and L. ZX. Critical revision of manuscript for important intellectual analysis: All authors. Statistical analysis: Z. PT, C. SR, and Y. XH. Final approval of the version to be published: Z. PT, Q. J, L. ZX, Y. HH, L. ZY, and Y. XH. All authors revised the article critically for important intellectual content. All authors have read and approved the final manuscript.
Supplemental Methods
Description of OCTA Examination and Images Assessment
Participants had their pupil dilated and received an optical coherence tomography angiography (OCTA) examination performed by trained ophthalmologists. A 6×6 mm2 macular high-definition (HD) scan mode and a 4.5×4.5 mm2 disc HD were collected within one minute for each participant in the study. Both eyes of the participants were examined by OCTA, but only the data from one eye were used for analyses—for participants born in even-numbered years, it was the right eye, and for those born in odd-numbered years, it was the left eye. Only images with a quality index ≥ 6/10 were retained.
Description of Retinal Vasculature Features
SCP refers to a slab extending from the internal limiting membrane (ILM) to 10 µm above the inner plexiform layer (IPL), while the DCP slab extends from 10 µm above the IPL to 10 µm below the outer plexiform layer (OPL). FD-300 is a parameter demonstrating the capillary density from ILM to OPL in a 300-µm-wide region around the foveal avascular zone (FAZ). Parafovea refers to the area inside the 1–3 mm concentric ring center of the fovea, while the perifovea refers to the actual 3–5 mm concentric ring center. RPC is a slab extending from the ILM to the RNFL that fits a circle (2 mm in diameter) centered on the optic disc. The peripapillary region is defined as a 1–2 mm round annulus around the optic disc. The peripapillary VD and RNFL thickness were quantified in the RPC segment. All VD and thickness of RNFL were automatically measured by the OCTA software.
References
- 1).Gandhi MM, Lampe FC, Wood DA. Incidence, clinical characteristics, and short-term prognosis of angina pectoris. Br Heart J, 1995; 73: 193-198 [DOI] [PMC free article] [PubMed] [Google Scholar]
- 2).Kravitz RL, Laouri M, Kahan JP, Guzy P, Sherman T, Hilborne L, Brook RH. Validity of criteria used for detecting underuse of coronary revascularization. JAMA, 1995; 274: 632-638 [PubMed] [Google Scholar]
- 3).Sekhri N, Feder GS, Junghans C, Hemingway H, Timmis AD. How effective are rapid access chest pain clinics? Prognosis of incident angina and non-cardiac chest pain in 8762 consecutive patients. Heart, 2007; 93: 458-463 [DOI] [PMC free article] [PubMed] [Google Scholar]
- 4).Douglas PS, Hoffmann U, Patel MR, Mark DB, Al-Khalidi HR, Cavanaugh B, Cole J, Dolor RJ, Fordyce CB, Huang M, Khan MA, Kosinski AS, Krucoff MW, Malhotra V, Picard MH, Udelson JE, Velazquez EJ, Yow E, Cooper LS, Lee KL. Outcomes of anatomical versus functional testing for coronary artery disease. N. Engl. J. Med., 2015; 372: 1291-1300 [DOI] [PMC free article] [PubMed] [Google Scholar]
- 5).Genders TS, Steyerberg EW, Alkadhi H, Leschka S, Desbiolles L, Nieman K, Galema TW, Meijboom WB, Mollet NR, de Feyter PJ, Cademartiri F, Maffei E, Dewey M, Zimmermann E, Laule M, Pugliese F, Barbagallo R, Sinitsyn V, Bogaert J, Goetschalckx K, Schoepf UJ, Rowe GW, Schuijf JD, Bax JJ, de Graaf FR, Knuuti J, Kajander S, van Mieghem CA, Meijs MF, Cramer MJ, Gopalan D, Feuchtner G, Friedrich G, Krestin GP, Hunink MG. A clinical prediction rule for the diagnosis of coronary artery disease: validation, updating, and extension. Eur. Heart J., 2011; 32: 1316-1330 [DOI] [PubMed] [Google Scholar]
- 6).Bittencourt MS, Hulten E, Polonsky TS, Hoffman U, Nasir K, Abbara S, Di Carli M, Blankstein R. European Society of Cardiology-Recommended Coronary Artery Disease Consortium Pretest Probability Scores More Accurately Predict Obstructive Coronary Disease and Cardiovascular Events Than the Diamond and Forrester Score: The Partners Registry. Circulation, 2016; 134: 201-211 [DOI] [PubMed] [Google Scholar]
- 7).Bhargava M, Ikram MK, Wong TY. How does hypertension affect your eyes? J Hum Hypertens, 2012; 26: 71-83 [DOI] [PubMed] [Google Scholar]
- 8).Flammer J, Konieczka K, Bruno RM, Virdis A, Flammer AJ, Taddei S. The eye and the heart. Eur. Heart J., 2013; 34: 1270-1278 [DOI] [PMC free article] [PubMed] [Google Scholar]
- 9).Grassi G, Buzzi S, Dell’Oro R, Mineo C, Dimitriadis K, Seravalle G, Lonati L, Cuspidi C. Structural alterations of the retinal microcirculation in the “prehypertensive” high- normal blood pressure state. Curr. Pharm. Des., 2013; 19: 2375-2381 [DOI] [PubMed] [Google Scholar]
- 10).Wong TY. Is retinal photography useful in the measurement of stroke risk? Lancet Neurol, 2004; 3: 179-183 [DOI] [PubMed] [Google Scholar]
- 11).Nägele MP, Barthelmes J, Ludovici V, Cantatore S, von Eckardstein A, Enseleit F, Lüscher TF, Ruschitzka F, Sudano I, Flammer AJ. Retinal microvascular dysfunction in heart failure. Eur. Heart J., 2018; 39: 47-56 [DOI] [PubMed] [Google Scholar]
- 12).Cheung CY, Ikram MK, Sabanayagam C, Wong TY. Retinal microvasculature as a model to study the manifestations of hypertension. Hypertension, 2012; 60: 1094-1103 [DOI] [PubMed] [Google Scholar]
- 13).Doubal FN, MacGillivray TJ, Hokke PE, Dhillon B, Dennis MS, Wardlaw JM. Differences in retinal vessels support a distinct vasculopathy causing lacunar stroke. Neurology, 2009; 72: 1773-1778 [DOI] [PMC free article] [PubMed] [Google Scholar]
- 14).Poplin R, Varadarajan AV, Blumer K, Liu Y, McConnell MV, Corrado GS, Peng L, Webster DR. Prediction of cardiovascular risk factors from retinal fundus photographs via deep learning. Nat Biomed Eng, 2018; 2: 158-164 [DOI] [PubMed] [Google Scholar]
- 15).Dai G, He W, Xu L, Pazo EE, Lin T, Liu S, Zhang C. Exploring the effect of hypertension on retinal microvasculature using deep learning on East Asian population. PLoS ONE, 2020; 15: e0230111 [DOI] [PMC free article] [PubMed] [Google Scholar]
- 16).Zhang L, Yuan M, An Z, Zhao X, Wu H, Li H, Wang Y, Sun B, Li H, Ding S, Zeng X, Chao L, Li P, Wu W. Prediction of hypertension, hyperglycemia and dyslipidemia from retinal fundus photographs via deep learning: A cross-sectional study of chronic diseases in central China. PLoS ONE, 2020; 15: e0233166 [DOI] [PMC free article] [PubMed] [Google Scholar]
- 17).Taqueti VR, Di Carli MF. Coronary Microvascular Disease Pathogenic Mechanisms and Therapeutic Options: JACC State-of-the-Art Review. J. Am. Coll. Cardiol., 2018; 72: 2625-2641 [DOI] [PMC free article] [PubMed] [Google Scholar]
- 18).Gupta A, Taqueti VR, van de Hoef TP, Bajaj NS, Bravo PE, Murthy VL, Osborne MT, Seidelmann SB, Vita T, Bibbo CF, Harrington M, Hainer J, Rimoldi O, Dorbala S, Bhatt DL, Blankstein R, Camici PG, Di Carli MF. Integrated Noninvasive Physiological Assessment of Coronary Circulatory Function and Impact on Cardiovascular Mortality in Patients With Stable Coronary Artery Disease. Circulation, 2017; 136: 2325-2336 [DOI] [PMC free article] [PubMed] [Google Scholar]
- 19).Catapano AL, Graham I, De Backer G, Wiklund O, Chapman MJ, Drexel H, Hoes AW, Jennings CS, Landmesser U, Pedersen TR, Reiner Ž, Riccardi G, Taskinen MR, Tokgozoglu L, Verschuren WMM, Vlachopoulos C, Wood DA, Zamorano JL, Cooney MT. 2016 ESC/EAS Guidelines for the Management of Dyslipidaemias. Eur. Heart J., 2016; 37: 2999-3058 [Google Scholar]
- 20).Spaide RF, Klancnik JM, Cooney MJ. Retinal vascular layers imaged by fluorescein angiography and optical coherence tomography angiography. JAMA Ophthalmol, 2015; 133: 45-50 [DOI] [PubMed] [Google Scholar]
- 21).Agemy SA, Scripsema NK, Shah CM, Chui T, Garcia PM, Lee JG, Gentile RC, Hsiao YS, Zhou Q, Ko T, Rosen RB. Retinal Vascular Perfusion Density Mapping Using Optical Coherence Tomography Angiography in Normals and Diabetic Retinopathy Patients. Retina, 2015; 35: 2353-2363 [DOI] [PubMed] [Google Scholar]
- 22).Motaghiannezam R, Fraser S. Logarithmic intensity and speckle-based motion contrast methods for human retinal vasculature visualization using swept source optical coherence tomography. Biomed Opt Express, 2012; 3: 503-521 [DOI] [PMC free article] [PubMed] [Google Scholar]
- 23).Ambler G, Seaman S, Omar RZ. An evaluation of penalised survival methods for developing prognostic models with rare events. Stat Med, 2012; 31: 1150-1161 [DOI] [PubMed] [Google Scholar]
- 24).Deo RC. Machine Learning in Medicine. Circulation, 2015; 132: 1920-1930 [DOI] [PMC free article] [PubMed] [Google Scholar]
- 25).Waljee AK, Higgins PD. Machine learning in medicine: a primer for physicians. Am. J. Gastroenterol., 2010; 105: 1224-1226 [DOI] [PubMed] [Google Scholar]
- 26).Motwani M, Dey D, Berman DS, Germano G, Achenbach S, Al-Mallah MH, Andreini D, Budoff MJ, Cademartiri F, Callister TQ, Chang HJ, Chinnaiyan K, Chow BJ, Cury RC, Delago A, Gomez M, Gransar H, Hadamitzky M, Hausleiter J, Hindoyan N, Feuchtner G, Kaufmann PA, Kim YJ, Leipsic J, Lin FY, Maffei E, Marques H, Pontone G, Raff G, Rubinshtein R, Shaw LJ, Stehli J, Villines TC, Dunning A, Min JK, Slomka PJ. Machine learning for prediction of all-cause mortality in patients with suspected coronary artery disease: a 5-year multicentre prospective registry analysis. Eur. Heart J., 2017; 38: 500-507 [DOI] [PMC free article] [PubMed] [Google Scholar]
- 27).van Rosendael AR, Maliakal G, Kolli KK, Beecy A, Al’Aref SJ, Dwivedi A, Singh G, Panday M, Kumar A, Ma X, Achenbach S, Al-Mallah MH, Andreini D, Bax JJ, Berman DS, Budoff MJ, Cademartiri F, Callister TQ, Chang HJ, Chinnaiyan K, Chow BJW, Cury RC, DeLago A, Feuchtner G, Hadamitzky M, Hausleiter J, Kaufmann PA, Kim YJ, Leipsic JA, Maffei E, Marques H, Pontone G, Raff GL, Rubinshtein R, Shaw LJ, Villines TC, Gransar H, Lu Y, Jones EC, Peña JM, Lin FY, Min JK. Maximization of the usage of coronary CTA derived plaque information using a machine learning based algorithm to improve risk stratification; insights from the CONFIRM registry. J Cardiovasc Comput Tomogr, 2018; 12: 204-209 [DOI] [PubMed] [Google Scholar]
- 28).Chang J, Ko A, Park SM, Choi S, Kim K, Kim SM, Yun JM, Kang U, Shin IH, Shin JY, Ko T, Lee J, Oh BL, Park KH. Association of Cardiovascular Mortality and Deep Learning-Funduscopic Atherosclerosis Score derived from Retinal Fundus Images. Am. J. Ophthalmol., 2020 [DOI] [PubMed] [Google Scholar]
- 29).Seidelmann SB, Claggett B, Bravo PE, Gupta A, Farhad H, Klein BE, Klein R, Di Carli M, Solomon SD. Retinal Vessel Calibers in Predicting Long-Term Cardiovascular Outcomes: The Atherosclerosis Risk in Communities Study. Circulation., 2016; 134: 1328-1338 [DOI] [PMC free article] [PubMed] [Google Scholar]
- 30).Gopinath B, Chiha J, Plant AJ, Thiagalingam A, Burlutsky G, Kovoor P, Liew G, Mitchell P. Associations between retinal microvascular structure and the severity and extent of coronary artery disease. Atherosclerosis., 2014; 236(1): 25-30 [DOI] [PubMed] [Google Scholar]
- 31).Arnould L, Guenancia C, Azemar A, Alan G, Pitois S, Bichat F, Zeller M, Gabrielle PH, Bron AM, Creuzot-Garcher C, Cottin Y. The EYE-MI Pilot Study: A Prospective Acute Coronary Syndrome Cohort Evaluated With Retinal Optical Coherence Tomography Angiography. Invest Ophthalmol Vis Sci., 2018; 59(10): 4299-4306 [DOI] [PubMed] [Google Scholar]
- 32).Wang J, Jiang J, Zhang Y, Qian YW, Zhang JF, Wang ZL. Retinal and choroidal vascular changes in coronary heart disease: an optical coherence tomography angiography study. Biomed Opt Express., 2019; 10(4): 1532-1544 [DOI] [PMC free article] [PubMed] [Google Scholar]
- 33).Tabatabaee A, Asharin MR, Dehghan MH, Pourbehi MR, Nasiri-Ahmadabadi M, Assadi M. Retinal vessel abnormalities predict coronary artery diseases. Perfusion, 2013; 28: 232-237 [DOI] [PubMed] [Google Scholar]
- 34).Wong TY, Klein R, Sharrett AR, Duncan BB, Couper DJ, Tielsch JM, Klein BE, Hubbard LD. Retinal arteriolar narrowing and risk of coronary heart disease in men and women. The Atherosclerosis Risk in Communities Study. JAMA, 2002; 287: 1153-1159 [DOI] [PubMed] [Google Scholar]
- 35).Anderson TJ, Gerhard MD, Meredith IT, Charbonneau F, Delagrange D, Creager MA, Selwyn AP, Ganz P. Systemic nature of endothelial dysfunction in atherosclerosis. Am. J. Cardiol., 1995; 75: 71B-74B [DOI] [PubMed] [Google Scholar]
- 36).Anderson TJ, Uehata A, Gerhard MD, Meredith IT, Knab S, Delagrange D, Lieberman EH, Ganz P, Creager MA, Yeung AC. Close relation of endothelial function in the human coronary and peripheral circulations. J. Am. Coll. Cardiol., 1995; 26: 1235-1241 [DOI] [PubMed] [Google Scholar]
- 37).Singh T, Bing R, Dweck MR, van Beek EJR, Mills NL, Williams MC, Villines TC, Newby DE, Adamson PD. Exercise Electrocardiography and Computed Tomography Coronary Angiography for Patients With Suspected Stable Angina Pectoris: A Post Hoc Analysis of the Randomized SCOT-HEART Trial. JAMA Cardiol, 2020 [DOI] [PMC free article] [PubMed] [Google Scholar]
- 38).Sekhri N, Feder GS, Junghans C, Eldridge S, Umaipalan A, Madhu R, Hemingway H, Timmis AD. Incremental prognostic value of the exercise electrocardiogram in the initial assessment of patients with suspected angina: cohort study. BMJ, 2008; 337: a2240 [DOI] [PMC free article] [PubMed] [Google Scholar]
- 39).Lapuschkin S, Wäldchen S, Binder A, Montavon G, Samek W, Müller KR. Unmasking Clever Hans predictors and assessing what machines really learn. Nat Commun, 2019; 10: 1096 [DOI] [PMC free article] [PubMed] [Google Scholar]
- 40).LeCun Y, Bengio Y, Hinton G. Deep learning. Nature, 2015; 521: 436-444 [DOI] [PubMed] [Google Scholar]
- 41).SCOT-HEART investigators. CT coronary angiography in patients with suspected angina due to coronary heart disease (SCOT-HEART): an open-label, parallel-group, multicentre trial. Lancet, 2015; 385: 2383-2391 [DOI] [PubMed] [Google Scholar]
- 42).Patel MR, Peterson ED, Dai D, Brennan JM, Redberg RF, Anderson HV, Brindis RG, Douglas PS. Low diagnostic yield of elective coronary angiography. N. Engl. J. Med., 2010; 362: 886-895 [DOI] [PMC free article] [PubMed] [Google Scholar]
- 43).Miller JM, Rochitte CE, Dewey M, Arbab-Zadeh A, Niinuma H, Gottlieb I, Paul N, Clouse ME, Shapiro EP, Hoe J, Lardo AC, Bush DE, de Roos A, Cox C, Brinker J, Lima JA. Diagnostic performance of coronary angiography by 64-row CT. N. Engl. J. Med., 2008; 359: 2324-2336 [DOI] [PubMed] [Google Scholar]
- 44).Mowatt G, Cummins E, Waugh N, Walker S, Cook J, Jia X, Hillis GS, Fraser C. Systematic review of the clinical effectiveness and cost-effectiveness of 64-slice or higher computed tomography angiography as an alternative to invasive coronary angiography in the investigation of coronary artery disease. Health Technol Assess, 2008; 12: iii-iv, ix-143 [DOI] [PubMed] [Google Scholar]
- 45).Al’Aref SJ, Maliakal G, Singh G, van Rosendael AR, Ma X, Xu Z, Alawamlh OAH, Lee B, Pandey M, Achenbach S, Al-Mallah MH, Andreini D, Bax JJ, Berman DS, Budoff MJ, Cademartiri F, Callister TQ, Chang HJ, Chinnaiyan K, Chow BJW, Cury RC, DeLago A, Feuchtner G, Hadamitzky M, Hausleiter J, Kaufmann PA, Kim YJ, Leipsic JA, Maffei E, Marques H, Gonçalves PA, Pontone G, Raff GL, Rubinshtein R, Villines TC, Gransar H, Lu Y, Jones EC, Peña JM, Lin FY, Min JK, Shaw LJ. Machine learning of clinical variables and coronary artery calcium scoring for the prediction of obstructive coronary artery disease on coronary computed tomography angiography: analysis from the CONFIRM registry. Eur. Heart J., 2020; 41: 359-367 [DOI] [PMC free article] [PubMed] [Google Scholar]