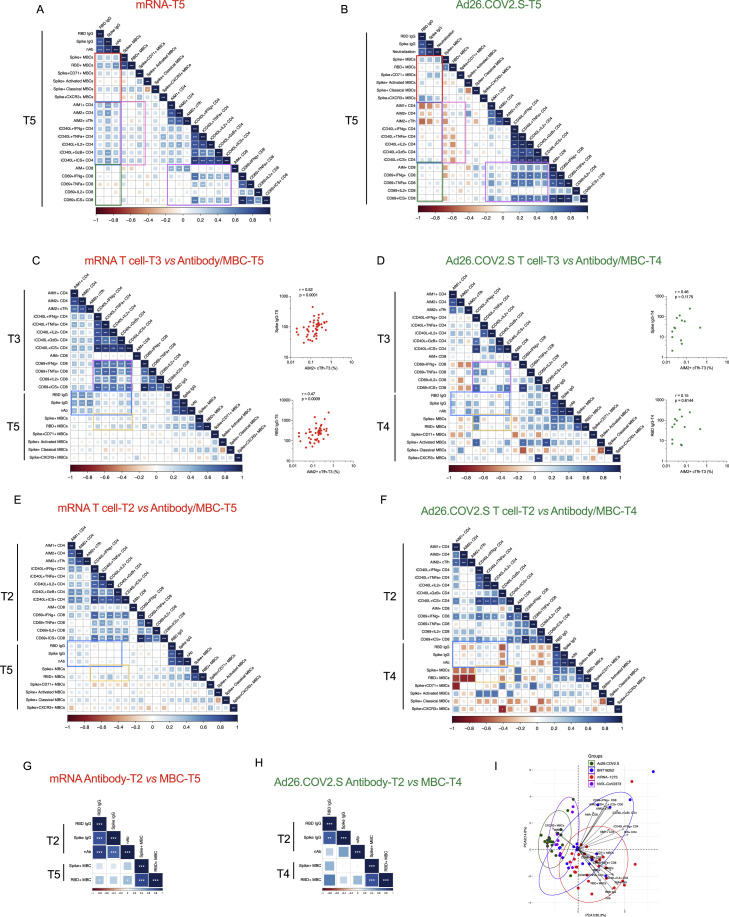
Figure S7.
Vaccine-specific correlation analyses. Related to Figure 7
(A-B) Correlation matrix of T5 (6-month) samples, plotted as mRNA (mRNA-1273 and BNT162b2) and Ad26.COV2.S COVID-19 vaccines. The red rectangle indicated the association between antibody and memory B cells; the blue rectangle indicated the association between antibody and CD4+ T cell; the green rectangle indicated the association between antibody and CD8+ T cell; the pink rectangle indicated the association between CD4 T cells and memory B cell; the purple rectangle indicated the association between CD4 T cells and CD8 T cells. Spearman rank-order correlation values (r) are shown from red (−1.0) to blue (1.0); r values are indicated by color and square size. p values are indicated by white asterisks as ∗p < 0.05, ∗∗p < 0.01, ∗∗∗p < 0.001.
(C-F) Correlation matrix of CD4+ and CD8+ T cell data from the early time point T3 (C-D) or T2 (E-F) with memory B cell and antibody data from the late timepoint. The blue rectangle indicates the association between CD4+ T cell and antibody; the orange rectangle indicated the association between CD4 T cells and memory B cell. Spearman rank-order correlation values (r) are shown from red (−1.0) to blue (1.0); r values are indicated by color and square size. p values are indicated by white asterisks as ∗p < 0.05, ∗∗p < 0.01, ∗∗∗p < 0.001. The T4 MBC and antibody data were preferred for Ad26.COV2.S due to fewer T5 paired samples. The association of spike IgG or RBD IgG with AIM2+cTfh were also shown by scatterplot (C-D). Red indicated mRNA, green indicated Ad26.COV2.S. Spearman rank-order correlation values (r) and p values were shown.
(G-H) Correlation matrix of antibody data from the T2 time point with memory B cell data from the late timepoint. Spearman rank-order correlation values (r) are shown from red (−1.0) to blue (1.0); r values are indicated by color and square size. p values are indicated by white asterisks as ∗p < 0.05, ∗∗p < 0.01, ∗∗∗p < 0.001. The T4 MBC data was preferred for Ad26.COV2.S due to fewer T5 paired samples.
(I) Principal component analysis (PCA) representation of mRNA-1273 (n = 28), BNT162b2 (n = 19), Ad26.COV2.S (n = 20), and NVX-Cov-2373 (n = 8) on the basis of all parameters obtained 3.5-month post-vaccination. Only paired subjects were used for the PCA analysis. Arrows indicated the prominent immunological distinguishing features. Ellipse represented the clustering of each vaccine. Red indicated mRANA-1273, blue indicated BNT162b2, and green indicated Ad26.COV2.S. MBCs indicates spike-specific memory B cell, cMBCs indicates spike-specific classical memory B cell, aMBCs indicates spike-specific activated memory B cell, AIM1+ indicates OX40+CD137+, AIM2+ indicates OX40+CD40L+, nAb indicates neutralization antibody.

