

Abstract
Executive function is a cognitive domain that typically declines in non-pathological aging. Two cognitive control networks that are vulnerable to aging—the cingulo-opercular (CON) and fronto-parietal control (FPCN) networks—play a role in various aspects of executive functioning. However, it is unclear how communication within these networks at rest relates to executive function subcomponents in older adults. This study examines the associations between CON and FPCN connectivity and executive function performance in 274 older adults across working memory, inhibition, and set-shifting tasks. Average CON connectivity was associated with better working memory, inhibition, and set-shifting performance, while average FPCN connectivity was associated solely with working memory. CON region of interest analyses revealed significant connections with classical hub regions (i.e., anterior cingulate and anterior insula) for each task, language regions for verbal working memory, right hemisphere dominance for inhibitory control, and widespread network connections for set-shifting. FPCN region of interest analyses revealed largely right hemisphere fronto-parietal connections important for working memory and a few temporal lobe connections for set-shifting. These findings characterize differential brain-behavior relationships between cognitive control networks and executive function in aging. Future research should target these networks for intervention to potentially attenuate executive function decline in older adults.
Keywords: Imaging, Resting-state networks, Cognitive aging, Executive function
Introduction
With a growing proportion of adults ages 65 and older, there is a need to mitigate the future health, societal, and economic impact of age-related cognitive decline. One of the cognitive domains typically vulnerable to age-related decline is executive function [1–3]. Executive function is a loosely defined umbrella term that refers to a set of processes responsible for control and execution of goal-directed behavior. Three core executive functions are commonly delineated in the literature: working memory, inhibition, and cognitive flexibility (i.e., set-shifting) [4–6]. In brief, working memory refers to temporarily holding and manipulating a limited capacity of information. Cognitive inhibition involves suppressing automatic, goal-irrelevant information or impulses. Lastly, set-shifting refers to the ability to shift attention between one task and another. These basic skills work in tandem to promote higher-order abilities like organization, decision-making, and problem-solving [7–9]. Furthermore, these functions are necessary for older adults’ continued successful performance of day-to-day activities like mentally re-organizing a to-do list, ignoring distractions while driving, and alternating between tasks at work or in the home.
Executive function performance in older adults is associated with the integrity of brain structure and function. For example, left dorsolateral prefrontal cortex surface area and blood-oxygen-level-dependent (BOLD) signal independently correlate with working memory performance in older adults [10]. Poorer set-shifting and inhibition performance have been associated with greater white matter hyperintensity load in frontal brain regions (bilateral superior frontal and right medial orbitofrontal; right superior frontal, respectively) [11]. Furthermore, degree of efficient communication between brain regions (i.e., structural and functional connectivity) has predicted both longitudinal changes and cross-sectional differences in older adults’ performance on executive function tasks [12, 13].
Two regional systems that have been identified as particularly important for executive function are the cingulo-opercular (CON) and fronto-parietal control networks (FPCN) [14, 15]. The CON (also referred to as the salience [16] or ventral attention network [17]) and the FPCN are commonly referred to as “cognitive control” networks, a term often used interchangeably with executive function in the literature [4]. Dosenbach and colleagues (2008) proposed a dual-network hypothesis, suggesting that the CON and FPCN are functionally distinct in their cognitive control processes. The CON is involved in detecting salient stimuli, maintaining task rules, and monitoring performance [15, 18–20], while the FPCN is involved in directing attention and adaptively adjusting to feedback on a trial-to-trial basis [16, 18, 21].
Resting-state functional magnetic resonance imaging (rs-fMRI) studies have shown that the functional connectivity of these cognitive control networks at rest (i.e., “task-negative” state) is disrupted in older adults and throughout Alzheimer’s disease progression [22–29]. However, it is unclear how these age-related alterations in network connectivity relate to executive function performance in older adults. Previous findings assessing the relationship between network connectivity and cognition in older adults have varied, potentially due to differences in task selection and network classification [30]. The inherently broad definition of “executive function” has frequently led to inconsistent operationalization (i.e., individual tasks versus creation of composite scores), impacting interpretability of the findings. For example, in older adults, CON connectivity at rest has been related to performance on individual tasks of inhibition [12, 31, 32], set-shifting [12], and a total score on a battery assessing a variety of frontal lobe functions [33]. In contrast, Shaw and colleagues (2015) showed that in older adults, only FPCN connectivity and not CON related to an executive function composite score derived from multiple tasks of fluency, working memory, inhibition, and set-shifting [34]. FPCN connectivity has also been related to performance on a design fluency task [32] and a working memory composite [23]. To our knowledge, no study to date has explored the relationships between both the CON and FPCN and subcomponent processes of executive function in older adults on the exact same tasks. Comprehensive characterization of these networks’ involvement in executive function, a domain vulnerable to aging and critical for daily functioning, would further our understanding of brain-behavior relationships in non-pathological aging and reveal potential targets for intervention (i.e., transcranial direct current stimulation (tDCS).
Consistent with prior literature, in the current study we divided executive function into three subcomponents: working memory, inhibition, and cognitive flexibility/set-shifting [4, 5]. Neuropsychological tests reflected each executive function subcomponent: Digit Span Backwards and Letter Number Sequencing for working memory, Stroop Color-Word trial for inhibition, and Trail Making Test Part B for set-shifting. First, we aimed to investigate the relationship between average within-network connectivity and each executive function measure for both the CON and FPCN. Based on our previous findings demonstrating a relationship between average CON connectivity and performance on a task of inhibition (NIH Toolbox Flanker) and set-shifting (NIH Toolbox Dimensional Change Card Sort) [12, 35], we hypothesized that greater average CON connectivity would be associated with better performance on the corresponding neuropsychological measures: Stroop Color-Word trial and Trail Making Test Part B. Since the dorsolateral prefrontal cortex is a major hub in the FPCN [36] and largely involved in working memory [10, 37], we hypothesized that greater average FPCN connectivity would specifically be associated with better performance on Digit Span Backwards and Letter Number Sequencing. Second, we evaluated the patterns of regional connections within the networks associated with executive function performance via region of interest (ROI-ROI) analyses. Identifying the specific connections and key regions that underlie executive functions in older adults may provide targets for interventions to improve cognition, daily functioning, and quality of life.
Methods
Participants
Data were collected at baseline from participants recruited for the Augmenting Cognitive Training in Older Adults (ACT, R01AG054077) study [38]. Our sample included 274 healthy older adults ranging from 65 to 88 years old (mean age = 71.7 ± 5.1; 177 females; mean education = 16.3 ± 2.4, education range = 12 to 21 years; 87.3% Caucasian; Table 1). The cases were recruited at the University of Florida (n = 175) and at the University of Arizona (n = 99). Inclusion and exclusion criteria for the study were detailed in Woods and colleagues (2018). In brief, participants were between the ages of 65 and 89, had no history of major psychiatric illness, no history of brain or head injury resulting in loss of consciousness greater than 20 min, and no formal diagnosis or evidence of mild cognitive impairment, dementia, or neurological brain disease. The Uniform Data Set (UDS) of the National Alzheimer’s Coordinating Center (NACC) was used to screen for individuals with possible mild cognitive impairment (MCI) or dementia [39]. Possible MCI was defined by 1.5 standard deviations below the mean in any of the following domains: general cognition, memory, visuospatial, executive functioning/working memory, or language. All participants were right-handed and had no contraindications for magnetic resonance imaging (MRI) scanning. Prior to beginning all study procedures, participants signed a consent form approved by the Institutional Review Boards at the University of Florida and at the University of Arizona.
Table 1.
Sample demographics and executive functioning performance
| Demographics (n = 274) | Mean (SD); n; % |
|---|---|
| Age | 71.7 (5.1) |
| Sex (number of females) | 177 |
| Education | 16.3 (2.4) |
| Race (% Caucasian) | 87.3% |
| Ethnicity (% Hispanic or Latino) | 6.6% |
| Executive functioning | Mean (SD) |
| Digit Span Backwards (n = 260) | 8.9 (2.2) |
| Letter Number Sequencing (n = 265) | 19.3 (2.7) |
| Stroop Color-Word (n = 261) | 34.9 (7.9) |
| TMT-B (n = 264) | 81.5 (30.3) |
Executive functioning data presented are raw scores for the samples in primary analyses. TMT-B, Trail Making Test Part B
Measures
Participants completed a battery of cognitive assessments, questionnaires, and an MRI scan. In this study, neuropsychological measures were chosen to reflect three domains of executive functioning: working memory, inhibition, and set-shifting.
Working memory – The Digit Span Backwards subtest of the Wechsler Adult Intelligence Scale— fourth edition (WAIS-IV) was one of the measures administered to assess working memory [40]. In this task, participants hear a sequence of numbers and are asked to repeat the sequence in backwards order, increasing in length with each correct trial (e.g., “1–2-3” = “3–2-1”).
A more challenging measure of working memory, the Letter Number Sequencing subtest of the WAIS-IV was also administered [41, 42]. This task involved hearing a series of numbers and letters and required participants to sequence the numbers first from lowest to highest, then the letters in alphabetical order (e.g., “1-B-7-D” = “1–7-B-D). The outcome variable for both measures was total number of correct trials.
Inhibition – The Stroop Color-Word trial was used to assess inhibition [43]. In this task, color words (e.g., “red,” “green,” “blue”) are printed in an incongruent colored ink (that is, in a color different from the color name). Participants are asked to name the color of ink in which the word is printed, ignoring the actual word. The outcome variable is the number of correct trials read in 45 s.
Set-shifting – The Trail Making Test from the NACC battery consists of two parts [39, 44]. The Trail Making Test Part B (TMT-B) was administered to assess set-shifting. Here, circles containing numbers (1–13) and letters (A–L) are presented in an array on a sheet of paper. Participants are asked to connect dots by alternating number and letter sequencing as fast as they can (i.e., 1-A-2-B). The outcome variable is the amount of time it takes for a participant to complete 13 sequences correctly.
Imaging acquisition
Resting-state functional magnetic resonance imaging (rs-fMRI) data were collected using a 3-Tesla Siemens Magnetom Prisma scanner with a 64-channel head coil at the University of Florida and using a 3-Tesla Siemens Magnetom Skyra scanner with a 32-channel head coil at the University of Arizona. Scanner type was included as a covariate in our statistical analyses to control for potential differences in the quality and acquisition of MRI data. Both study sites followed the same scanning procedures and used identical sequences. Participant head motion was constrained by foam padding, and participants were provided with earplugs to reduce adverse effects of scanner noise. For acquiring resting-state data, participants were asked to rest for 6 min while keeping their eyes open, directed toward a fixation cross, as a blood-oxygen-level-dependent (BOLD) scan was acquired with an echo-planar functional protocol (number of volumes = 120, repetition time [TR] = 3000 ms, echo time [TE] = 30 ms; flip angle = 70°, 3.0 × 3.0 × 3.0 mm3 voxels; 44 slices, field of view (FOV) = 240 × 240 mm). To assist the normalization of the resting-state functional images in the preprocessing stage, high-resolution T1-weighted 3D magnetization prepared rapid acquisition gradient echo (MPRAGE) images were collected (TR = 1800 ms; TE = 2.26 ms; 1.0 × 1.0.1 × 0 mm3 voxels; 176 slices; FOV = 256 × 256 mm; FA = 8°; time = 3 min and 3 s).
Resting-state fMRI preprocessing and analyses
Structural and functional images were preprocessed and analyzed using the MATLAB R2019b based functional connectivity toolbox (“CONN toolbox” version 18b) and SPM 12 [45, 46]. We utilized a preprocessing pipeline which included functional realignment and unwarping, functional centering of the image to (0, 0, 0) coordinates, slice-timing correction, structural centering to (0, 0, 0,) coordinates, structural segmentation and normalization to MNI space, functional normalization to MNI space, and spatial smoothing with a smoothing kernel of 8 mm FWHM. During preprocessing, CONN toolbox implements an anatomical, component-based, noise correction strategy (aCompCor) for spatial and temporal processing to remove physiological noise factors from the data [47]. The implementation of aCompCor combined with the quantification of participant motion and the identification of outlier scans through the Artifact Rejection Toolbox (www.nitrc.org/projects/artifact_detect) allows for better interpretation of functional connectivity results [46–48]. The Artifact Rejection Toolbox (ART) was set to the 97th percentile setting with the mean global-signal deviation threshold set at z = ± 5 and the participant-motion threshold set at 0.9 mm to flag outlier acquisitions. Consistent with previous resting-state literature, we excluded participants with < 4 min of data after scrubbing flagged outlier volumes [49–53]. Applying linear regression of potential confounding effects in BOLD signal and using temporal band-pass filtering (0.008–0.09 Hz), data were denoised to exclude signal frequencies outside of the range of expected BOLD signals (such as low-frequency scanner drift), minimize participant motion, extract white matter and cerebral spinal fluid noise components, and control for within-participant realignment and scrubbing covariates [47, 49, 50].
For the rs-fMRI analyses, we used a publicly available network parcellation of the brain [54] defined by Yeo et al. (2011) that has been commonly used in the resting-state literature [12, 13, 21, 22, 55–57]. Regions within CON and FPCN were specified as ROIs for average network connectivity analyses and ROI-ROI functional connectivity analyses (Fig. 1; Table 2). The connectivity values are Fisher z-transformed bivariate correlations between brain regions’ BOLD time series that quantify associations in activation at rest.
Fig. 1.
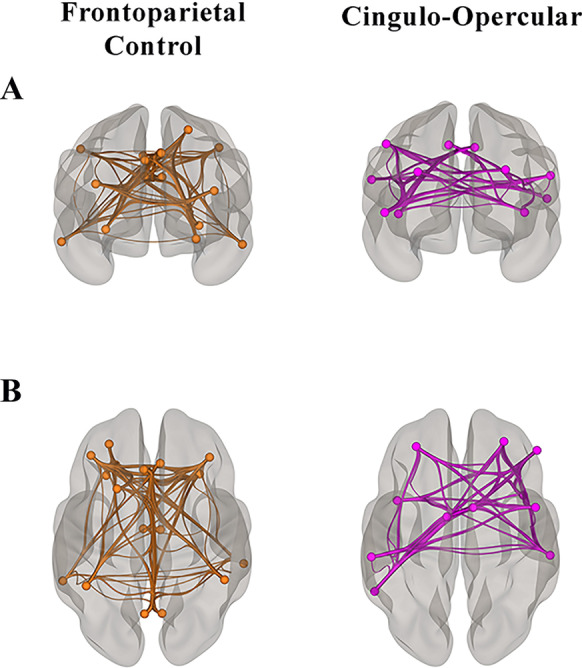
FPCN and CON in older adults. Visualization of the regions of interest in the FPCN and CON [54] in our sample of healthy older adults [12] from A anterior and B superior views
Table 2.
Network regions of interest labels
| Network | Region of interest label |
|---|---|
| CON | |
| L parietal operculum | |
| L temporal occipital | |
| L frontal operculum insula | |
| L lateral prefrontal cortex | |
| L medial/anterior cingulate | |
| R temporal occipital parietal | |
| R precentral | |
| R frontal operculum insula | |
| R ventral prefrontal cortex | |
| R lateral prefrontal cortex | |
| R medial/anterior cingulate | |
| FPCN | |
| L parietal | |
| L temporal | |
| L dorsal prefrontal cortex | |
| L lateral prefrontal cortex | |
| L orbital frontal cortex | |
| L ventral prefrontal cortex | |
| L precuneus | |
| L cingulate | |
| L medial posterior prefrontal cortex | |
| R parietal | |
| R temporal | |
| R ventral prefrontal cortex | |
| R lateral prefrontal cortex | |
| R precuneus | |
| R cingulate | |
| R medial posterior prefrontal cortex |
This table presents the names for each region of interest in the CON and FPCN networks defined by Yeo et al. (2011). The Yeo regions named “medial” correspond with the anterior cingulate, which is included in the table to provide further specification of the region’s location. CON, cingulo-opercular network; FPCN, frontoparietal control network; L, left hemisphere; R, right hemisphere
Average network connectivity and executive functioning
Average within-network connectivity was calculated by computing the mean of the pairwise correlations between the specified Yeo et al. (2011) ROIs that comprise the CON and FPCN. Multiple linear regressions were conducted in SPSS version 25 with the executive function measures as the outcome variables (Digit Span Backwards, Letter Number Sequencing, Stroop Color-Word, and TMT-B) and average connectivity values as the predictor of interest, controlling for age, sex, education, and scanner. For each outcome, the regression model was run twice: one model analyzing average within-CON connectivity and the other examining average within-FPCN connectivity.
Secondary analyses: ROI-ROI connectivity and executive functioning
We used the CONN Toolbox to investigate the associations between regional connectivity strength (ROI-ROI) within the CON and FPCN with executive function performance. We constructed all the aforementioned models including covariates directly within the CONN Toolbox. For each model, regions were restricted to those in the specified network (e.g., significant connections defined only between CON regions and their relationship with Stroop performance). Results were analyzed using a false discovery rate correction (FDR) with a significance level set at p < 0.05 to consider the total number of pairwise correlations run for each model. Only ROI-ROI connections surviving FDR correction were considered.
Results
Sample
Of the 274 participants, we excluded five participants with < 4 min of data after scrubbing and two participants as imaging outliers due to extreme network connectivity values (z-score beyond ± 3). Furthermore, one participant was missing data on TMT-B, two on Letter Number Sequencing, six on Digit Span Backwards, and six on Stroop Color-Word. These cases were dropped from the sample via list-wise deletion. After analyzing the measures’ distributions, three individuals were removed as neuropsychological performance outliers (z-score beyond ± 3; one for Digit Span Backwards and two for TMT-B), resulting in the following sample sizes: Letter Number Sequencing n = 265, TMT-B n = 264, Stroop Color-Word n = 261, and Digit Span Backwards n = 260. The distribution of scores on TMT-B was positively skewed; therefore, we performed a log10 transformation. Demographic and raw neuropsychological performance data are summarized in Table 1.
Average network connectivity and executive functioning
We first examined the relationship between average network connectivity and executive function performance. Multiple linear regressions revealed that greater average connectivity within the CON was associated with better performance across all executive functioning subcomponents (working memory, inhibition, and set-shifting): Digit Span Backwards (R2 = 0.14, β = 0.26, p < 0.001), Letter Number Sequencing (R2 = 0.16, β = 0.23, p < 0.001), Stroop Color-Word (R2 = 0.20, β = 0.24, p < 0.001), and TMT-B (R2 = 0.17, β = − 0.26, p < 0.001; Table 3). Of note, for TMT-B, longer time to complete the task corresponds with worse performance. As such, negative beta values suggest that stronger connectivity is related to faster completion times (i.e., better performance). Additionally, greater average connectivity within the FPCN was significantly associated with better performance on working memory measures: Digit Span Backwards (R2 = 0.12, β = 0.22, p < 0.001) and Letter Number Sequencing (R2 = 0.14, β = 0.18, p = 0.002; Table 3). The association between the FPCN and TMT-B performance was at the traditional cut-off for significance (R2 = 0.13, β = − 0.12, p = 0.05), and the association between the FPCN and Stroop Color-Word was not statistically significant (R2 = 0.16, β = 0.10, p = 0.09). Across both CON and FPCN models, older age was significantly associated with worse performance on Letter Number Sequencing, Stroop Color-Word, and TMT-B but not with Digit Span Backwards. Lastly, more years of education was significantly associated better performance across all measures in both CON and FPCN models. Sex and scanner covariates did not predict performance.
Table 3.
Average network connectivity and executive functioning performance
| Digit Span Backwards | Letter Number Sequencing | Stroop Color-Word | TMT-B | |
|---|---|---|---|---|
| CON Model | ||||
| R-squared | 0.14*** | 0.16*** | 0.20*** | 0.17*** |
| Average CON | 0.26*** | 0.23*** | 0.24*** | − 0.26*** |
| Age | − 0.07 | − 0.17** | − 0.24*** | 0.24*** |
| Education | 0.24*** | 0.24*** | 0.19*** | − 0.13* |
| Sex | 0.02 | 0.00 | 0.11 | − 0.06 |
| Scanner | − 0.05 | − 0.05 | 0.09 | − 0.03 |
| FPCN Model | ||||
| R-squared | 0.12*** | 0.14*** | 0.16*** | 0.13*** |
| Average FPCN | 0.22*** | 0.18** | 0.10 | − 0.12 |
| Age | − 0.10 | − 0.20*** | − 0.29*** | 0.28*** |
| Education | .23*** | 0.23*** | 0.19*** | − 0.12* |
| Sex | 0.01 | − 0.01 | 0.10 | − 0.06 |
| Scanner | 0.03 | − 0.3 | 0.11 | − 0.05 |
The values in the table corresponding with each predictor are standardized Beta coefficients. The metric for Trail Making Test part B (TMT-B) is time in seconds it takes to complete the task (log transformed due to skewness). Longer time equates to worse performance. Average CON, average connectivity values within the cingulo-opercular network; Average FPCN, average connectivity values within the frontoparietal control network
*** p ≤ .001; ** p < .01; * p < .05
ROI-ROI connectivity and executive function
We next analyzed patterns of regional connectivity within the networks associated with executive function performance, controlling for age, sex, education, and scanner. Statistical information regarding the significant network connections is provided in Tables 4 and 5 and Figs. 2 and 3. In brief, for CON, there were significant relationships between 15 connections and Digit Span Backwards, 10 connections and Letter Number Sequencing, 16 connections and Stroop Color-Word, and 21 connections and TMT-B performance. For FPCN, there were significant relationships between 10 connections and Digit Span Backwards, 3 connections and Letter Number Sequencing, 2 connections and TMT-B performance, and no connections survived FDR correction for Stroop Color-Word. Table 6 provides the number of nodes each significant region is connected to that related to executive functioning performance.
Table 4.
Working memory ROI-ROI connectivity analyses
| Beta | T(x) value | P (FDR) | |
|---|---|---|---|
| Digit Span Backwards | |||
| CON Seed Regions | T(254) | ||
| L medial/anterior cingulate – R ventral prefrontal cortex | 0.04 | 3.96 | .001 |
| L medial/anterior cingulate – R frontal operculum insula | 0.02 | 2.66 | .042 |
| R frontal operculum insula – L lateral prefrontal cortex | 0.03 | 4.12 | < .001 |
| R frontal operculum insula – R temporal occipital parietal | 0.02 | 2.85 | .024 |
| R frontal operculum insula – R medial/anterior cingulate | 0.02 | 2.50 | .032 |
| L parietal operculum – R temporal occipital parietal | 0.04 | 3.06 | .019 |
| L parietal operculum – L lateral prefrontal cortex | 0.02 | 2.79 | .019 |
| L parietal operculum – R medial/anterior cingulate | 0.02 | 2.77 | .019 |
| L parietal operculum – R ventral prefrontal cortex | 0.02 | 2.56 | .027 |
| R temporal occipital parietal – R medial/anterior cingulate | 0.02 | 2.82 | .017 |
| R temporal occipital parietal – L lateral prefrontal cortex | 0.02 | 2.53 | .029 |
| R temporal occipital parietal – L medial/anterior cingulate | 0.02 | 2.43 | .032 |
| R temporal occipital parietal – R ventral prefrontal cortex | 0.02 | 2.24 | .043 |
| R medial/anterior cingulate – R ventral prefrontal cortex | 0.03 | 3.95 | .001 |
| L lateral prefrontal cortex – L frontal operculum insula | 0.02 | 3.37 | .004 |
| FPCN Seed Regions | T(254) | ||
| R parietal – R medial posterior prefrontal cortex | 0.03 | 3.55 | .007 |
| R parietal – R lateral prefrontal cortex | 0.03 | 3.32 | .008 |
| R parietal – L precuneus | 0.02 | 2.62 | .043 |
| R parietal – L cingulate | 0.02 | 2.53 | .043 |
| R parietal – L medial posterior prefrontal cortex | 0.02 | 2.46 | .043 |
| R lateral prefrontal cortex – L parietal | 0.02 | 2.82 | .039 |
| R lateral prefrontal cortex – L precuneus | 0.02 | 2.67 | .039 |
| R lateral prefrontal cortex – R medial posterior prefrontal cortex | 0.02 | 2.51 | .039 |
| R lateral prefrontal cortex – R ventral prefrontal cortex | 0.02 | 2.50 | .039 |
| L lateral prefrontal cortex – L parietal | 0.03 | 3.59 | .006 |
| Letter Number Sequencing | |||
| CON Seed Regions | T(259) | ||
| R medial/anterior cingulate – R frontal operculum insula | 0.03 | 3.38 | .008 |
| R medial/anterior cingulate – R temporal occipital parietal | 0.02 | 3.08 | .012 |
| R medial/anterior cingulate – L parietal operculum | 0.02 | 2.78 | .017 |
| R medial/anterior cingulate – L temporal occipital | 0.02 | 2.72 | .017 |
| R medial/anterior cingulate – R ventral prefrontal cortex | 0.01 | 2.53 | .022 |
| R medial/anterior cingulate – R lateral prefrontal cortex | 0.02 | 2.50 | .022 |
| R temporal occipital parietal – R frontal operculum insula | 0.02 | 3.57 | .004 |
| R frontal operculum insula – L medial/anterior cingulate | 0.02 | 2.99 | .010 |
| R frontal operculum insula – L parietal operculum | 0.02 | 2.39 | .043 |
| L medial/anterior cingulate – L temporal occipital | 0.02 | 2.95 | .018 |
| FPCN Seed Regions | T(259) | – | |
| R medial posterior prefrontal cortex – R ventral prefrontal cortex | 0.02 | 2.98 | .047 |
| R lateral prefrontal cortex – R parietal | 0.02 | 3.08 | .034 |
| R precuneus – R ventral prefrontal cortex | 0.01 | 2.97 | .048 |
Only significant ROI-ROI pairs related to executive functioning performance are depicted in this table. The beta values are unstandardized and represent the slope of the regression line between executive functioning scores and connectivity values (Fisher’s z-transformed correlations). FDR, false discovery rate set a p < .05
Table 5.
Inhibition and set-shifting ROI-ROI connectivity analyses
| Beta | T(x) value | P (FDR) | |
|---|---|---|---|
| Stroop Color-Word | |||
| CON Seed Regions | T(255) | ||
| R ventral prefrontal cortex – R lateral prefrontal cortex | 0.01 | 4.87 | < .001 |
| R ventral prefrontal cortex – L lateral prefrontal cortex | 0.01 | 4.32 | < .001 |
| R ventral prefrontal cortex – R medial/anterior cingulate | 0.01 | 3.49 | .002 |
| R ventral prefrontal cortex – L temporal occipital | 0.01 | 2.71 | .016 |
| R ventral prefrontal cortex – L medial/anterior cingulate | 0.01 | 2.63 | .018 |
| R medial/anterior cingulate – R frontal operculum insula | 0.01 | 3.27 | .006 |
| R medial/anterior cingulate – R temporal occipital parietal | 0.01 | 3.10 | .007 |
| R medial/anterior cingulate – R lateral prefrontal cortex | 0.01 | 2.53 | .030 |
| R medial/anterior cingulate – L parietal operculum | < 0.01 | 2.30 | .044 |
| R frontal operculum insula – R temporal occipital parietal | 0.01 | 3.04 | .013 |
| R frontal operculum insula – R precentral | 0.01 | 2.54 | .033 |
| R frontal operculum insula – L medial/anterior cingulate | 0.01 | 2.46 | .033 |
| R frontal operculum insula – L lateral prefrontal cortex | 0.01 | 2.35 | .033 |
| R frontal operculum insula – R lateral prefrontal cortex | 0.01 | 2.34 | .033 |
| R frontal operculum insula – L parietal operculum | 0.01 | 2.28 | .033 |
| R frontal operculum insula – L temporal occipital | < 0.01 | 2.15 | .041 |
| No Significant FPCN Seed Regions | |||
| Trail Making Test B | |||
| CON Seed Regions | T(260) | ||
| L frontal operculum insula – R temporal occipital parietal | − 0.39 | − 3.68 | .003 |
| L frontal operculum insula – L medial/anterior cingulate | − 0.33 | − 3.01 | .008 |
| L frontal operculum insula – R precentral | − 0.28 | − 3.01 | .008 |
| L frontal operculum insula – L lateral prefrontal cortex | − 0.31 | − 2.98 | .008 |
| L frontal operculum insula – L parietal operculum | − 0.31 | − 2.83 | .009 |
| L frontal operculum insula – R ventral prefrontal cortex | − 0.22 | − 2.71 | .011 |
| L frontal operculum insula – R medial/anterior cingulate | − 0.32 | − 2.68 | .011 |
| L frontal operculum insula – R frontal operculum insula | − 0.25 | − 2.32 | .026 |
| R temporal occipital parietal – R frontal operculum insula | − 0.44 | − 3.86 | .001 |
| R temporal occipital parietal – R ventral prefrontal cortex | − 0.31 | − 2.92 | .013 |
| R temporal occipital parietal – R medial/anterior cingulate | − 0.30 | − 2.61 | .024 |
| R temporal occipital parietal – L parietal operculum | − 0.47 | − 2.36 | .038 |
| L parietal operculum – R ventral prefrontal cortex | − 0.36 | − 3.64 | .003 |
| L parietal operculum – R frontal operculum insula | − 0.32 | − 2.86 | .017 |
| R frontal operculum insula – R medial/anterior cingulate | − 0.36 | − 2.71 | .024 |
| R frontal operculum insula – R precentral | − 0.27 | − 2.51 | .032 |
| R frontal operculum insula – L medial/anterior cingulate | − 0.28 | − 2.24 | .043 |
| L medial/anterior cingulate – R ventral prefrontal cortex | − 0.37 | − 2.70 | .037 |
| R ventral prefrontal cortex – R medial/anterior cingulate | − 0.33 | − 3.46 | .003 |
| R ventral prefrontal cortex – L lateral prefrontal cortex | − 0.22 | − 2.46 | .021 |
| R ventral prefrontal cortex – R lateral prefrontal cortex | − 0.24 | − 2.45 | .021 |
| FPCN Seed Regions | T(260) | ||
| L dorsal prefrontal cortex – L temporal | − 0.31 | − 3.07 | .036 |
| L temporal – R temporal | − 0.30 | − 2.76 | .045 |
Only significant ROI-ROI pairs related to executive functioning performance are depicted in this table. The beta values are unstandardized and represent the slope of the regression line between executive functioning scores and connectivity values (Fisher’s z-transformed correlations). FDR, false discovery rate set a p < .05
Fig. 2.

ROI-ROI analyses for working memory measures. Significant ROI-ROI connections related to working memory performance controlling for age, sex, education, and scanner. Each panel provides an overall network map in the top left corner and a connectome ring that depicts the significant connections related to performance on each measure. The color bar represents the range of the T-statistic for each model. Warmer colors indicate positive relationships while cooler colors indicate negative relationships with task performance. An analysis level FDR correction of p < 0.05 was used. Abbreviations: R, right hemisphere; L, left hemisphere; FPCN, frontoparietal control network; CON, cingulo-opercular network; PFC, prefrontal cortex; MedPost, medial posterior; FrOperIns, frontal operculum insula; TempOccPar, temporal occipital parietal
Fig. 3.

ROI-ROI analyses for inhibition and set-shifting measures. Significant ROI-ROI connections related to set-shifting and inhibition performance controlling for age, sex, education, and scanner. Each panel provides an overall network map in the top left corner and a connectome ring that depicts the significant connections related to performance on each measure. The color bar represents the range of the T-statistic for each model. Warmer colors indicate positive relationships while cooler colors indicate negative relationships with task performance. The metric for Trail Making Test B is time in seconds it takes to complete the task. Longer time equates to worse performance; therefore, negative correlations (blue) indicate stronger connectivity is related to better performance. An analysis level FDR correction of p < 0.05 was used. Abbreviations: R, right hemisphere; L, left hemisphere; FPCN, frontoparietal control network; CON, cingulo-opercular network; PFC, prefrontal cortex; ParOper, parietal operculum; FrOperIns, frontal operculum insula; TempOccPar, temporal occipital parietal
Table 6.
Number of connections per region
| Network | Region of interest | Digit Span Backwards | Letter Number Sequencing | Stroop Color-Word | Trail Making Test Part B |
|---|---|---|---|---|---|
| CON | |||||
| L parietal operculum | 4 | 2 | 2 | 4 | |
| L temporal occipital | 0 | 2 | 2 | 0 | |
| L frontal operculum insula | 1 | 0 | 0 | 8 | |
| L lateral prefrontal cortex | 4 | 0 | 2 | 2 | |
| L medial/anterior cingulate | 3 | 2 | 2 | 3 | |
| R temporal occipital parietal | 6 | 2 | 2 | 5 | |
| R precentral | 0 | 0 | 1 | 2 | |
| R frontal operculum insula | 4 | 4 | 8 | 6 | |
| R ventral prefrontal cortex | 4 | 1 | 5 | 7 | |
| R lateral prefrontal cortex | 0 | 1 | 3 | 1 | |
| R medial/anterior cingulate | 4 | 6 | 5 | 4 | |
| FPCN | |||||
| L parietal | 2 | 0 | 0 | 0 | |
| L temporal | 0 | 0 | 0 | 2 | |
| L dorsal prefrontal cortex | 0 | 0 | 0 | 1 | |
| L lateral prefrontal cortex | 1 | 0 | 0 | 0 | |
| L precuneus | 2 | 0 | 0 | 0 | |
| L cingulate | 1 | 0 | 0 | 0 | |
| L medial posterior prefrontal cortex | 1 | 0 | 0 | 0 | |
| R parietal | 5 | 1 | 0 | 0 | |
| R temporal | 0 | 0 | 0 | 1 | |
| R ventral prefrontal cortex | 1 | 2 | 0 | 0 | |
| R lateral prefrontal cortex | 5 | 1 | 0 | 0 | |
| R precuneus | 0 | 1 | 0 | 0 | |
| R medial posterior prefrontal cortex | 2 | 1 | 0 | 0 |
This table presents the number of nodes a region was connected to that significantly related to task performance. Regions that were not a part of significant pairs for any of four tasks were excluded from the table. CON, cingulo-opercular network; FPCN, frontoparietal control network; L, left hemisphere; R, right hemisphere
Discussion
Executive function declines seen in non-pathological aging are associated with age-related changes in brain structure and function [10–13]. Using a brain network approach in a large sample of older adults, the current study identified patterns of resting-state functional connectivity within two cognitive control networks important for working memory, inhibition, and set-shifting performance. These findings (1) provide insight into differential brain-behavior relationships with cognitive control networks vulnerable to aging, (2) characterize patterns in non-pathological aging that can be used to compare with neurodegenerative disease progression, and (3) reveal potential target networks for intervention to potentially improve executive functioning performance in older adults.
CON connectivity and executive function
The CON is a cognitive control network important for the detection of salient information and involved in the stable maintenance of a strategy throughout the duration of a task [15, 16, 18, 58]. The anterior insula (AI) and the anterior cingulate cortex (ACC, which corresponds to the Yeo “medial” regions) are two major hub regions in the CON. It is thought that the AI first identifies salient events from internal and external stimuli and then signals other large-scale networks to act upon the event (i.e., activating the FPCN and deactivating the default mode network) [58–61]. These “transient control signals” generated by the AI are then sustained by the ACC throughout the duration of a response. In cognitively intact older adults, studies have shown that age-related alterations to ACC functioning (i.e., hypometabolism and reduced activation) are related to poorer executive function performance [62–64]. Given the broad involvement of the CON in cognitive control and its vulnerability to aging processes, it is not surprising that in the present study, the integrity of this network at rest in older adults was important for executive functioning across all three domains: working memory, inhibition, and set-shifting. Previous studies have identified associations between specific regions within the CON and executive function performance [65–69]. However, these findings expand upon the literature by revealing that overall network connectivity and several, specific ROI-ROI connections within the CON are important for executive function within a large sample of healthy older adults.
CON and working memory
In this study, the CON ROI-to-ROI analyses revealed several overlapping connections, particularly with medial/cingulate regions, that were associated with both Digit Span Backwards and Letter Number Sequencing performance (i.e., right medial/anterior cingulate to right frontal operculum insula, right temporal occipital parietal, left parietal operculum, and right ventral prefrontal cortex; left medial/anterior cingulate to right frontal operculum insula). The ACC’s involvement in working memory has been observed in both task-based [70–72] and resting-state imaging studies [69, 73]. Specifically, in models of working memory, the ACC has been referred to as the “attention controller” that evaluates the need for greater allocation of resources based on task demand [71, 74–76]. Otsuka and colleagues (2006) [64] showed that compared to younger adults, older adults also show reduced ACC activation during a verbal working memory task likely related to age-related deterioration of the cognitive control process. Our findings support this notion and suggest that an increased medial/anterior cingulate connection within the CON at rest is important for performing challenging working memory tasks in an aging population.
Notably, in our sample of older adults, Digit Span Backwards performance was also associated with several fronto-parietal connections with greater involvement of left hemisphere language regions (i.e., left parietal operculum and left frontal operculum insula). The left inferior parietal lobe and the left frontal operculum (containing Broca’s area) are both components of the phonological loop for working memory, critical for storing and rehearsing verbal information, respectively [77–79]. A functional MRI study in younger adults revealed that the Broca’s area is additionally recruited for Digit Span Backwards compared to Digit Span Forward, potentially reflecting the task’s greater demand on phonological processing [80]. A few studies have also demonstrated structural relationships between these language regions and verbal working memory performance [69, 81]. To our knowledge, we are the first to identify an association between the resting-state functional connectivity of these language regions within the CON and a verbal working memory task in older adults.
CON and inhibition
The ACC and anterior insula are also important regions for detecting and resolving “response conflict” (i.e., implementing cognitive inhibition). Response conflict occurs when there is a simultaneous neural activation for competing, incompatible responses [67, 68]. Several task-based imaging studies have identified ACC and AI activation during inhibition tasks like the Stroop, Go/No-Go, and Flanker [65, 65, 82]. In a resting-state functional connectivity analysis, Ducheck and colleagues (2014) identified a relationship between average CON connectivity and Stroop errors in a sample of older adults [31]. Similarly, in our previous study with older adults [12], we demonstrated that greater average CON connectivity was related to better performance on the NIH Toolbox Flanker task. In the present study, we were able to replicate these relationships with average CON connectivity and cognitive inhibition and expand upon the findings by analyzing the patterns of regional connectivity underlying this association.
The ROI-ROI analyses revealed significant connections within the CON important for Stroop Color-Word performance including 8 connections to the right frontal operculum insula, 7 connections to medial/anterior cingulate regions (5 right hemisphere, 2 left hemisphere), 5 connections to the right ventral prefrontal cortex, and 5 connections to the lateral prefrontal cortex (3 right hemisphere, 2 left hemisphere). In addition to the ACC and AI, neuroimaging studies have also identified the importance of frontal regions for inhibition including the inferior frontal gyrus (IFG), middle frontal gyrus (MFG), and precentral gyrus [83–86]. Notably, our findings demonstrate extensive involvement of the right frontal operculum insula (partially analogous to right IFG) with the absence of connections to the left frontal operculum insula. This pattern is consistent with the right hemispheric dominance of inhibitory control seen in the literature [87–92]; however, our findings add to the literature by demonstrating this right hemispheric pattern in the resting-state modality for inhibitory control in an aging population.
CON and set-shifting
The current findings are also in support of previous research demonstrating that communication within the CON is important for set-shifting. Previous work from our group demonstrated higher average CON connectivity is associated with better performance in the NIH Toolbox Dimensional Change Card Sort task [12]. Task-based TMT-B imaging studies in healthy adults show involvement of CON regions during task performance, such as left inferior frontal gyrus, left angular gyrus, and left superior temporal gyrus [93, 94]. Talwar and colleagues were also able to show age-related activation in CON areas including the right insula, superior temporal gyri, and medial prefrontal cortices when performing TMT-B [93]. In relation to ROI-ROI findings, the left frontal operculum insula is widely connected to bilateral regions within the CON with 8 connections. Previous lesion studies in stroke patients have also identified the importance of the left insula in set-shifting tasks [95, 96]). Moreover, our functional results expand upon structural findings that indicate thinner cortex in temporal/sylvian fissure regions and insula is associated with poorer TMT-B performance in aging adults [97], possibly due to the language component of this task [94, 98]. When considering our other CON findings of ACC involvement in working memory and inhibition, the strong insular component in set-shifting may suggest that overall CON connectivity is important in executive function in aging, but hubs within CON may be playing differential roles given the specific task.
Other connections associated with TMT-B performance include right superior/posterior temporal regions (5 connections), right ventral prefrontal cortex (7 connections), right insula (6 connections), and left parietal operculum (4 connections). In a younger population, left frontal and temporal areas are typically more involved than right hemisphere regions in TMT-B task performance [94]. However, in our sample, bilateral and widespread connections appear important, which is in line with theories of aging suggesting reduced lateral asymmetry and dedifferentiation in aging [99, 100]. These findings also expand upon previous task-based research and show that higher connectivity of these regions at rest is also important for better performance in an aged population [93].
FPCN connectivity and executive function
The FPCN is a cognitive control network important for goal-directed attention and adapting to feedback [16, 18, 21, 34]. The dorsolateral prefrontal cortex (dLPFC) is a hub brain region in the FPCN; thus, working memory processes have been shown to uniquely relate to FPCN connectivity [101, 102]. Connectivity within the FPCN and the anticorrelation between the FPCN and other networks reduces with older age [23, 103]. Findings from this study expand upon the role of the FPCN by demonstrating that in cognitively healthy older adults, overall within-network FPCN connectivity relates to better performance on working memory tasks. Additionally, ROI-ROI analyses revealed specific connections important for working memory and identified two FPCN connections related to set-shifting performance.
FPCN and working memory
ROI-ROI analyses within the FPCN revealed that multiple frontal-parietal connections, predominantly within the right hemisphere, related to better Digit Span Backwards performance. ROI-ROI connections with the greatest magnitude of association were the right medial posterior and bilateral lateral prefrontal cortices with parietal seed regions. The pattern of frontal-parietal connections was even more apparent in Letter Number Sequencing performance, as one of the strongest ROI-ROI connections related to task performance was a right lateral prefrontal cortex to the right parietal seed. Parietal involvement in working memory tasks is well studied and is related to spatial and mental manipulation of both auditory and verbal stimuli as well as capacity limitations [104–107]. However, the frontal-parietal connection in working memory performance may interact with age. Nyberg and colleagues found that high-performing young adults had more activation in parietal areas as a function of working memory load, whereas high-performing older adults had more activation in frontal areas [108]. Edin and colleagues (2009) suggest that the frontal-parietal connection is important in aging when the dLPFC is recruited to “boost” working memory capacity in the parietal cortex, and thus needed for high-level working memory performance [109]. In aging, the ability to relocate neural resources from posterior to frontal areas in response to increased cognitive demands appears important in maintaining task performance [108, 109]. Although other connections were certainly important in Digit Span Backwards (i.e., right parietal to left precuneus and cingulate cortex, right lateral prefrontal cortex to left precuneus and right medial posterior prefrontal cortex) and Letter Number Sequencing performance (i.e., right ventral prefrontal cortex to right medial poster prefrontal cortex and right precuneus), the substantial frontal-parietal involvement in our sample supports the notion that recruitment of the prefrontal cortex is important to “boost” or support parietal involvement in working memory in aging.
Within the FPCN, fronto-parietal connections appear to favor the right hemisphere, particularly in Letter Number Sequencing. Prior research assessing the volumetric and functional connectivity correlates of working memory shows a preference for right hemisphere areas involved in the phonological loop, which is likely recruited when performing verbal working memory tasks such as Digit Span Backwards and Letter Number Sequencing [69]. Previous research also suggests that older adults recruit right frontal areas more than younger adults when performing mental manipulation tasks [110, 111]. This functional shift is also supported by structural connectivity findings in aging, showing reduced left hemisphere white matter pathways emerging from the prefrontal cortex when compared to the right hemisphere [112]. Future research should explore the interaction of the integrity of white matter pathways with the fronto-parietal connection and working memory performance in an aging cohort.
FPCN and set-shifting
While the association between average FPCN connectivity and set-shifting performance was at the traditional cut-off for statistical significance, ROI-ROI analyses revealed two connections within the FPCN important for task performance, higher connectivity of the left temporal region with left dorsal prefrontal cortex and with right temporal regions associated with faster TMT-B performance. Temporal lobe connectivity is not traditionally associated with set-shifting tasks in aging but rather the dorsolateral and medial prefrontal cortices [94, 113, 114]. In fact, prior research has shown that compared to younger adults, older adults recruit prefrontal cortices more when completing set-shifting tasks, similar to changes observed in working memory [115]. However, structural studies show the integrity of the white matter connections between prefrontal cortices and temporal regions (along the superior longitudinal fasciculus) is important in set-shifting in healthy aging, as is cortical thickness in temporal regions [97, 116]. The recruitment of temporal regions in set-shifting tasks may be due to the memory demand of recalling numbers and letters, as a frontal to medial temporal functional connection is apparent during executive function performance in aging [93, 117]. Furthermore, Oosterman and colleagues found that in an aging population, medial temporal lobe atrophy was the best predictor of Trail Making Test B performance, which suggests that the hippocampus may play a role in executive functions as we age [117]. Despite our temporal regions of interest being lateral rather than medial, our findings do support the notion of broad temporal or hippocampal association areas and prefrontal-temporal involvement in set-shifting performance in an aging population.
Another important finding was stronger bilateral temporal connection related to better TMT-B performance. To our knowledge, our study is the first to show a bilateral temporal lobe connection in set-shifting performance in an aging population. Typically, the left temporal lobe is recruited more in TMT-B, possibly due to a language component of the task when reciting the alphabet [94, 98]. However, Perry and colleagues (2009) found that the integrity of the corpus callosum strongly mediates TMT-B performance [116]. It is possible that older adults who have higher integrity of the corpus callosum are better able to recruit right-sided temporal areas to help in task performance. Further research is needed to better understand the bilateral temporal role in set-shifting in aging.
CON vs. FPCN: inhibition and set-shifting
Our findings demonstrate that at rest, the functional integrity of the CON plays a more prominent role for inhibition and set-shifting performance compared to the FPCN in older adults. In task-based imaging studies, the dLPFC individually and in conjunction with the ACC has been related to performance in both domains [68, 94, 113, 114, 118–121]. Kondo and colleagues (2004) demonstrated that closer cooperation between the ACC and dLPFC is strongly related to attention shifting during a working memory task [121]. During conflict monitoring, signals from the ACC lead to the recruitment of additional support from the dLPFC on subsequent performance [68, 120]. These findings are consistent with the network model that suggests the CON is responsible for modulating large-scale network activity (e.g., increasing FPCN activity) via signals from the ACC and the insular cortex [58–61]. Our findings suggest that perhaps at rest, the integrity of communication within the CON as its own unique network but also as a mechanism for recruiting other networks is more important for inhibition and set-shifting performance in older adults than the communication at rest between FPCN regions typically recruited for the execution of those tasks. However, future research would be needed to explore the dynamics between resting-state network integrity and network activation during executive functioning tasks in older adults to potentiate these claims.
Limitations and future directions
While the present study provides novel insight regarding cognitive control network connectivity and executive function in non-pathological aging, the results should be interpreted in the context of the following limitations. First, our sample consists largely of highly educated, White Non-Hispanic individuals, which greatly limits the generalizability of these findings to Black, Asian American and Pacific Islander, Indigenous, and Hispanic or Latinx populations. Consistent with the overall trends in the USA, over time, the aging population has become increasingly more racially and ethnically diverse. According to the current population estimates [122], the fastest-growing racial or ethnic group in the USA is individuals who are two or more races followed by Asian then Hispanic populations. It is imperative that as a field, we continue to address and dismantle the established research participation barriers that disproportionately burden individuals from minoritized populations to prioritize more inclusive aging research [123].
Furthermore, this study was a cross-sectional design and only included older adults that did not show evidence of mild cognitive impairment or dementia defined by UDS performance [38, 39]. Future work should analyze these relationships longitudinally to explore how they might predict cognitive trajectories or alter in response to disease progression (e.g., Alzheimer’s disease). Additionally, there are several methods for analyzing executive function and resting-state network connectivity. In the present study, we chose traditional neuropsychological measures that correspond to the subdomains of executive function commonly delineated in the literature [4, 5]. We also conducted ROI-ROI analyses to constrain our analyses to connectivity patterns within well-defined resting-state networks that are vulnerable to aging [22–24, 54]. Others should attempt to replicate these patterns using a variety of executive functioning measures and connectivity analyses (e.g., voxel-wise approaches, graph theory, independent component analysis). Furthermore, future research should expand upon these findings by investigating how age-related disruptions in connectivity between the CON and FPCN relate to deficits in cognitive performance in older adults. Finally, there are promising studies that demonstrate the ability to increase resting-state connectivity synchrony between fronto-parietal regions via transcranial direct current stimulation [124, 125]. Future work should explore modulating network connectivity as an intervention to potentially improve cognitive functioning and stave off decline in older adults.
Conclusion
This is the first study to investigate resting-state network connectivity within the CON and the FPCN underlying each domain of executive function in a sample of healthy older adults. Older adults with greater average CON connectivity performed better on working memory, inhibition, and set-shifting tasks. Regional analyses further characterized connectivity patterns by revealing consistent involvement of CON hub regions (e.g., ACC/medial regions and AI/frontal operculum insula) across tasks, language regions for Digit Span Backwards, right hemisphere dominance for inhibition, and insular and widespread bilateral involvement for set-shifting. In contrast, older adults with greater average FPCN connectivity only performed better on working memory tasks. Regional analyses revealed right hemisphere fronto-parietal involvement for working memory and also temporal connections for set-shifting. Collectively, these results provide a greater understanding of the relationships between cognitive control network connectivity and executive function in older adults. Furthermore, these findings may inform and lead to more focused interventions targeting altered brain networks in the context of non-pathological aging.
Author contribution
HH and AW contributed to the conception and design of this specific study. HH extracted the data, performed the statistical analyses, and wrote the first draft of the manuscript. CH wrote various sections of the discussion. EP, GH, SW, SD, GA, MM, RC, and AW were involved in project administration. All authors contributed to manuscript revision, read, and approved the submitted version.
Funding
This work was supported by the National Institute on Aging [NIA R01AG054077, NIA K01AG050707, NIA P30AG072980, T32AG020499], the State of Arizona and Arizona Department of Health Services (ADHS), the University of Florida Center for Cognitive Aging and Memory Clinical Translational Research, the McKnight Brain Research Foundation, and National Heart, Lung, and Blood Institute [T32HL134621].
Data availability
Data are managed under the data sharing agreement established with NIA and the parent R01 clinical trial Data Safety and Monitoring Board in the context of an ongoing Phase III clinical trial (ACT study, R01AG054077). All trial data will be made publicly available 2 years after completion of the parent clinical trial, per NIA and DSMB agreement. Requests for baseline data can be submitted to the ACT Publication and Presentation (P&P) Committee and will require submission of a data use, authorship, and analytic plan for review by the P&P committee (ajwoods@phhp.ufl.edu).
Declarations
Conflict of interest
The authors declare no competing interests.
Footnotes
Publisher's Note
Springer Nature remains neutral with regard to jurisdictional claims in published maps and institutional affiliations.
References
- 1.Salthouse TA. Selective review of cognitive aging. J Int Neuropsychol Soc. 2010;16:754–760. doi: 10.1017/S1355617710000706. [DOI] [PMC free article] [PubMed] [Google Scholar]
- 2.Salthouse TA. Trajectories of normal cognitive aging. Psychol Aging. 2019;34:17–24. doi: 10.1037/pag0000288. [DOI] [PMC free article] [PubMed] [Google Scholar]
- 3.Murman DL. The impact of age on cognition. Semin Hear. 2015;36:111–121. doi: 10.1055/s-0035-1555115. [DOI] [PMC free article] [PubMed] [Google Scholar]
- 4.Diamond A. Executive functions. Annu Rev Psychol. 2013;64:135–168. doi: 10.1146/annurev-psych-113011-143750. [DOI] [PMC free article] [PubMed] [Google Scholar]
- 5.Miyake A, Friedman NP, Emerson MJ, et al. The unity and diversity of executive functions and their contributions to complex “frontal lobe” tasks: a latent variable analysis. Cogn Psychol. 2000;41:49–100. doi: 10.1006/cogp.1999.0734. [DOI] [PubMed] [Google Scholar]
- 6.Lehto JE, Juujärvi P, Kooistra L, et al. Dimensions of executive functioning: evidence from children. Br J Dev Psychol. 2003;21:59–80. doi: 10.1348/026151003321164627. [DOI] [Google Scholar]
- 7.Collins A, Koechlin E. Reasoning, learning, and creativity: frontal lobe function and human decision-making. PLoS Biol. 2012;10:e1001293. 10.1371/journal.pbio.1001293. [DOI] [PMC free article] [PubMed]
- 8.Zelazo PD, Carter A, Reznick JS, et al. Early development of executive function: a problem-solving framework. Rev Gen Psychol. 1997;1:198–226. doi: 10.1037/1089-2680.1.2.198. [DOI] [Google Scholar]
- 9.Harada CN, Natelson Love MC, Triebel KL. Normal cognitive aging. Clin Geriatr Med. 2013;29:737–52. [DOI] [PMC free article] [PubMed]
- 10.Evangelista ND, O’Shea A, Kraft JN, et al. Independent contributions of dorsolateral prefrontal structure and function to working memory in healthy older adults. Cereb Cortex. 2021;31:1732–1743. doi: 10.1093/cercor/bhaa322. [DOI] [PMC free article] [PubMed] [Google Scholar]
- 11.Boutzoukas EM, O’Shea A, Albizu A, et al. Frontal white matter hyperintensities and executive functioning performance in older adults. Front Aging Neurosci. 2021;0:338. doi: 10.3389/fnagi.2021.672535. [DOI] [PMC free article] [PubMed] [Google Scholar]
- 12.Hausman HK, O’Shea A, Kraft JN, et al. The role of resting-state network functional connectivity in cognitive aging. Front Aging Neurosci. 2020;12:177. doi: 10.3389/fnagi.2020.00177. [DOI] [PMC free article] [PubMed] [Google Scholar]
- 13.Fjell AM, Sneve MH, Grydeland H, et al. The disconnected brain and executive function decline in aging. Cereb Cortex. 2017;27:2303–2317. doi: 10.1093/cercor/bhw082. [DOI] [PubMed] [Google Scholar]
- 14.Cole MW, Schneider W. The cognitive control network: integrated cortical regions with dissociable functions. Neuroimage. 2007;37:343–360. doi: 10.1016/j.neuroimage.2007.03.071. [DOI] [PubMed] [Google Scholar]
- 15.Dosenbach NUF, Fair DA, Cohen AL, et al. A dual-networks architecture of top-down control. Trends Cogn Sci. 2008;12:99–105. doi: 10.1016/j.tics.2008.01.001. [DOI] [PMC free article] [PubMed] [Google Scholar]
- 16.Seeley WW, Menon V, Schatzberg AF, et al. Dissociable intrinsic connectivity networks for salience processing and executive control. J Neurosci. 2007;27:2349–2356. doi: 10.1523/JNEUROSCI.5587-06.2007. [DOI] [PMC free article] [PubMed] [Google Scholar]
- 17.Fox MD, Corbetta M, Snyder A, et al. Spontaneous neuronal activity distinguishes human dorsal and ventral attention systems. Proc Natl Acad Sci. 2006;103:10046–10051. doi: 10.1073/pnas.0604187103. [DOI] [PMC free article] [PubMed] [Google Scholar]
- 18.Dosenbach NUF, Fair DA, Miezin FM, et al. Distinct brain networks for adaptive and stable task control in humans. Proc Natl Acad Sci. 2007;104:11073–11078. doi: 10.1073/pnas.0704320104. [DOI] [PMC free article] [PubMed] [Google Scholar]
- 19.Han SW, Eaton HP, Marois R. Functional fractionation of the cingulo-opercular network: alerting insula and updating cingulate. Cereb Cortex. 2018;29:2624–2638. doi: 10.1093/cercor/bhy130. [DOI] [PMC free article] [PubMed] [Google Scholar]
- 20.Sestieri C, Corbetta M, Spadone S, et al. Domain-general signals in the cingulo-opercular network for visuospatial attention and episodic memory. J Cogn Neurosci. 2014;26:551–568. doi: 10.1162/jocn_a_00504. [DOI] [PMC free article] [PubMed] [Google Scholar]
- 21.Dixon ML, La VAD, Mills C, et al. Heterogeneity within the frontoparietal control network and its relationship to the default and dorsal attention networks. Proc Natl Acad Sci. 2018;115:E1598–E1607. doi: 10.1073/pnas.1715766115. [DOI] [PMC free article] [PubMed] [Google Scholar]
- 22.Betzel RF, Byrge L, He Y, et al. Changes in structural and functional connectivity among resting-state networks across the human lifespan. Neuroimage. 2014;102:345–357. doi: 10.1016/j.neuroimage.2014.07.067. [DOI] [PubMed] [Google Scholar]
- 23.Geerligs L, Renken RJ, Saliasi E, et al. A brain-wide study of age-related changes in functional connectivity. Cereb Cortex. 2015;25:1987–1999. doi: 10.1093/cercor/bhu012. [DOI] [PubMed] [Google Scholar]
- 24.Siman-Tov T, Bosak N, Sprecher E, et al. Early age-related functional connectivity decline in high-order cognitive networks. Front Aging Neurosci. 2017;8:330. doi: 10.3389/fnagi.2016.00330. [DOI] [PMC free article] [PubMed] [Google Scholar]
- 25.Wang K, Liang M, Wang L, et al. Altered functional connectivity in early Alzheimer’s disease: a resting-state fMRI study. Hum Brain Mapp. 2007;28:967–978. doi: 10.1002/hbm.20324. [DOI] [PMC free article] [PubMed] [Google Scholar]
- 26.Agosta F, Pievani M, Geroldi C, et al. Resting state fMRI in Alzheimer’s disease: beyond the default mode network. Neurobiol Aging. 2012;33:1564–1578. doi: 10.1016/j.neurobiolaging.2011.06.007. [DOI] [PubMed] [Google Scholar]
- 27.He X, Qin W, Liu Y, et al. Abnormal salience network in normal aging and in amnestic mild cognitive impairment and Alzheimer’s disease. Hum Brain Mapp. 2014;35:3446–3464. doi: 10.1002/hbm.22414. [DOI] [PMC free article] [PubMed] [Google Scholar]
- 28.Elman JA, Madison CM, Baker SL, et al. Effects of beta-amyloid on resting state functional connectivity within and between networks reflect known patterns of regional vulnerability. Cereb Cortex. 2016;26:695–707. doi: 10.1093/cercor/bhu259. [DOI] [PMC free article] [PubMed] [Google Scholar]
- 29.Buckley RF, Schultz AP, Hedden T, et al. Functional network integrity presages cognitive decline in preclinical Alzheimer disease. Neurology. 2017;89:29–37. doi: 10.1212/WNL.0000000000004059. [DOI] [PMC free article] [PubMed] [Google Scholar]
- 30.Ferreira LK, Busatto GF. Resting-state functional connectivity in normal brain aging. Neurosci Biobehav Rev. 2013;37:384–400. doi: 10.1016/j.neubiorev.2013.01.017. [DOI] [PubMed] [Google Scholar]
- 31.Duchek JM, Balota DA, Thomas JB, et al. Relationship between stroop performance and resting state functional connectivity in cognitively normal older adults. Neuropsychology. 2013;27:516–528. doi: 10.1037/a0033402. [DOI] [PMC free article] [PubMed] [Google Scholar]
- 32.Zhao J, Manza P, Wiers C, et al. Age-related decreases in interhemispheric resting-state functional connectivity and their relationship with executive function. Front Aging Neurosci. 2020;12:20. doi: 10.3389/fnagi.2020.00020. [DOI] [PMC free article] [PubMed] [Google Scholar]
- 33.Onoda K, Ishihara M, Yamaguchi S. Decreased functional connectivity by aging is associated with cognitive decline. J Cogn Neurosci. 2012;24:2186–2198. doi: 10.1162/jocn_a_00269. [DOI] [PubMed] [Google Scholar]
- 34.Shaw EE, Schultz AP, Sperling RA, et al. Functional connectivity in multiple cortical networks is ssociated with performance across cognitive domains in older adults. Brain Connect. 2015;5:505–516. doi: 10.1089/brain.2014.0327. [DOI] [PMC free article] [PubMed] [Google Scholar]
- 35.Weintraub S, Dikmen SS, Heaton RK, et al. Cognition assessment using the NIH Toolbox. Neurology. 2013;80:S54–64. doi: 10.1212/WNL.0b013e3182872ded. [DOI] [PMC free article] [PubMed] [Google Scholar]
- 36.Vincent JL, Kahn I, Snyder AZ, et al. Evidence for a frontoparietal control system revealed by intrinsic functional connectivity. J Neurophysiol. 2008;100:3328–3342. doi: 10.1152/jn.90355.2008. [DOI] [PMC free article] [PubMed] [Google Scholar]
- 37.Barbey AK. Network neuroscience theory of human intelligence. Trends Cogn Sci. 2018;22:8–20. doi: 10.1016/j.tics.2017.10.001. [DOI] [PubMed] [Google Scholar]
- 38.Woods AJ, Cohen R, Marsiske M, et al. Augmenting cognitive training in older adults (The ACT Study): design and methods of a phase III tDCS and cognitive training trial. Contemp Clin Trials. 2018;65:19–32. doi: 10.1016/j.cct.2017.11.017. [DOI] [PMC free article] [PubMed] [Google Scholar]
- 39.Weintraub S, Salmon D, Mercaldo N, et al. The Alzheimer’s disease centers’ uniform data set (UDS): the neuropsychologic test battery. Alzheimer Dis Assoc Disord. 2009;23:91–101. doi: 10.1097/WAD.0b013e318191c7dd. [DOI] [PMC free article] [PubMed] [Google Scholar]
- 40.Wechsler D. Manual for the Wechsler Memory Scale-Revised. San Antonio, TX: Psychological Corporation; 1987. [Google Scholar]
- 41.Crowe SF. Does the Letter Number Sequencing task measure anything more than digit span? Assessment. 2000;7:113–117. doi: 10.1177/107319110000700202. [DOI] [PubMed] [Google Scholar]
- 42.Wechsler D. WAIS-IV administration and scoring manual. San Antonio, TX: Psychological Corporation; 2008. [Google Scholar]
- 43.Stroop JR. Studies of interference in serial verbal reactions. J Exp Psychol. 1935;18:643–662. doi: 10.1037/h0054651. [DOI] [Google Scholar]
- 44.Reitan, R.M. and Wolfson, D. (1993) The Halstead-Reitan Neuropsychological Test Battery theory and clinical interpretation. 2nd Edition, Neuropsychology Press, Tucson. - References - Scientific Research Publishing. (n.d.). Retrieved May 21, 2021, from https://www.scirp.org/(S(i43dyn45teexjx455qlt3d2q))/reference/ReferencesPapers.aspx?ReferenceID=1560926
- 45.Penny W, Friston K, Ashburner J et al. Statistical parametric mapping: the analysis of functional brain images., Amsterdam; Boston: Elsevier/Academic Press. 2007.
- 46.Whitfield-Gabrieli S, Nieto-Castanon A. Conn : a functional connectivity toolbox for correlated and anticorrelated brain networks. Brain Connect. 2012;2:125–141. doi: 10.1089/brain.2012.0073. [DOI] [PubMed] [Google Scholar]
- 47.Behzadi Y, Restom K, Liau J, et al. A component based noise correction method (CompCor) for BOLD and perfusion based fMRI. Neuroimage. 2007;37:90–101. doi: 10.1016/j.neuroimage.2007.04.042. [DOI] [PMC free article] [PubMed] [Google Scholar]
- 48.Shirer WR, Jiang H, Price CM, et al. Optimization of rs-fMRI pre-processing for enhanced signal-noise separation, test-retest reliability, and group discrimination. Neuroimage. 2015;117:67–79. doi: 10.1016/j.neuroimage.2015.05.015. [DOI] [PubMed] [Google Scholar]
- 49.Power JD, Barnes KA, Snyder AZ, et al. Spurious but systematic correlations in functional connectivity MRI networks arise from subject motion. Neuroimage. 2012;59:2142–2154. doi: 10.1016/j.neuroimage.2011.10.018. [DOI] [PMC free article] [PubMed] [Google Scholar]
- 50.Friston KJ, Williams S, Howard R, et al. Movement-related effects in fMRI time-series. Magn Reson Med. 1996;35:346–355. doi: 10.1002/mrm.1910350312. [DOI] [PubMed] [Google Scholar]
- 51.Van Dijk KRA, Hedden T, Venkataraman A, et al. Intrinsic functional connectivity as a tool for human connectomics: theory, properties, and optimization. J Neurophysiol. 2010;103:297–321. doi: 10.1152/jn.00783.2009. [DOI] [PMC free article] [PubMed] [Google Scholar]
- 52.Satterthwaite TD, Elliott MA, Gerraty RT, et al. An improved framework for confound regression and filtering for control of motion artifact in the preprocessing of resting-state functional connectivity data. Neuroimage. 2013;64:240–256. doi: 10.1016/j.neuroimage.2012.08.052. [DOI] [PMC free article] [PubMed] [Google Scholar]
- 53.Parkes L, Fulcher B, Yücel M, et al. An evaluation of the efficacy, reliability, and sensitivity of motion correction strategies for resting-state functional MRI. Neuroimage. 2018;171:415–436. doi: 10.1016/j.neuroimage.2017.12.073. [DOI] [PubMed] [Google Scholar]
- 54.Yeo BTT, Krienen FM, Sepulcre J, et al. The organization of the human cerebral cortex estimated by intrinsic functional connectivity. J Neurophysiol. 2011;106:1125–1165. doi: 10.1152/jn.00338.2011. [DOI] [PMC free article] [PubMed] [Google Scholar]
- 55.Dubois J, Galdi P, Paul LK et al. A distributed brain network predicts general intelligence from resting-state human neuroimaging data. Philos Trans R Soc Lond B Biol Sci. 2018;373:20170284. 10.1098/rstb.2017.0284. [DOI] [PMC free article] [PubMed]
- 56.Khasawinah S, Chuang Y-F, Caffo B, et al. The association between functional connectivity and cognition in older adults. J Syst Integr Neurosci. 2017;3:1–10. doi: 10.15761/JSIN.1000164. [DOI] [Google Scholar]
- 57.Ruiz-Rizzo AL, Sorg C, Napiórkowski N, et al. Decreased cingulo-opercular network functional connectivity mediates the impact of aging on visual processing speed. Neurobiol Aging. 2019;73:50–60. doi: 10.1016/j.neurobiolaging.2018.09.014. [DOI] [PubMed] [Google Scholar]
- 58.Menon V, Uddin LQ. Saliency, switching, attention and control: a network model of insula function. Brain Struct Funct. 2010;214:655. doi: 10.1007/s00429-010-0262-0. [DOI] [PMC free article] [PubMed] [Google Scholar]
- 59.Sridharan D, Levitin DJ, Menon V. A critical role for the right fronto-insular cortex in switching between central-executive and default-mode networks. Proc Natl Acad Sci. 2008;105:12569–12574. doi: 10.1073/pnas.0800005105. [DOI] [PMC free article] [PubMed] [Google Scholar]
- 60.Fox MD, Snyder AZ, Vincent JL, et al. The human brain is intrinsically organized into dynamic, anticorrelated functional networks. Proc Natl Acad Sci. 2005;102:9673–9678. doi: 10.1073/pnas.0504136102. [DOI] [PMC free article] [PubMed] [Google Scholar]
- 61.Greicius MD, Krasnow B, Reiss AL et al. Functional connectivity in the resting brain: a network analysis of the default mode hypothesis. Proc Natl Acad Sci. 2003;100:253-258. 10.1073/pnas.0135058100 [DOI] [PMC free article] [PubMed]
- 62.Pardo JV, Lee JT, Sheikh SA, et al. Where the brain grows old: decline in anterior cingulate and medial prefrontal function with normal aging. Neuroimage. 2007;35:1231. doi: 10.1016/j.neuroimage.2006.12.044. [DOI] [PMC free article] [PubMed] [Google Scholar]
- 63.Pardo JV, Nyabwari SM, Lee JT, et al. Aging-related hypometabolism in the anterior cingulate cortex of cognitively intact, amyloid-negative seniors at rest mediates the relationship between age and executive function but not memory. Cereb Cortex Commun. 2020;1:1–9. doi: 10.1093/texcom/tgaa020. [DOI] [PMC free article] [PubMed] [Google Scholar]
- 64.Otsuka Y, Osaka N, Morishita M, et al. Decreased activation of anterior cingulate cortex in the working memory of the elderly. NeuroReport. 2006;17:1479–1482. doi: 10.1097/01.wnr.0000236852.63092.9f. [DOI] [PubMed] [Google Scholar]
- 65.Nee DE, Wager TD, Jonides J. Interference resolution: insights from a meta-analysis of neuroimaging tasks. Cogn Affect Behav Neurosci 2007 71 2007;7:1–17. [DOI] [PubMed]
- 66.Kurth F, Zilles K, Fox PT et al. A link between the systems: functional differentiation and integration within the human insula revealed by meta-analysis. Brain Struct Funct 2010;214:519-34. 10.1007/S00429-010-0255-Z. [DOI] [PMC free article] [PubMed]
- 67.Braver T, Barch D, Gray J, et al. Anterior cingulate cortex and response conflict: effects of frequency, inhibition and errors. Cereb Cortex. 2001;11:825–836. doi: 10.1093/cercor/11.9.825. [DOI] [PubMed] [Google Scholar]
- 68.Botvinick MM, Carter CS, Braver TS, et al. Conflict monitoring and cognitive control. Psychol Rev. 2001;108:624–652. doi: 10.1037/0033-295X.108.3.624. [DOI] [PubMed] [Google Scholar]
- 69.Li R, Qin W, Zhang Y, et al. The neuronal correlates of igits backward are revealed by voxel-based morphometry and resting-state functional connectivity analyses. PLoS One. 2012;7:e31877. doi: 10.1371/journal.pone.0031877. [DOI] [PMC free article] [PubMed] [Google Scholar]
- 70.Kondo H, Morishita M, Osaka N, et al. Functional roles of the cingulo-frontal network in performance on working memory. Neuroimage. 2004;21:2–14. doi: 10.1016/j.neuroimage.2003.09.046. [DOI] [PubMed] [Google Scholar]
- 71.Osaka M, Osaka N, Kondo H, et al. The neural basis of individual differences in working memory capacity: an fMRI study. Neuroimage. 2003;18:789–797. doi: 10.1016/S1053-8119(02)00032-0. [DOI] [PubMed] [Google Scholar]
- 72.Bunge SA, Ochsner KN, Desmond JE, et al. Prefrontal regions involved in keeping information in and out of mind. Brain. 2001;124:2074–2086. doi: 10.1093/brain/124.10.2074. [DOI] [PubMed] [Google Scholar]
- 73.Yang Z, Jutagir DR, Koyama MS, et al. Intrinsic brain indices of verbal working memory capacity in children and adolescents. Dev Cogn Neurosci. 2015;15:67–82. doi: 10.1016/j.dcn.2015.07.007. [DOI] [PMC free article] [PubMed] [Google Scholar]
- 74.Chai WJ, Hamid AIA, Abdullah JM. Working memory from the psychological and neurosciences perspectives: a review. Front Psychol 2018;9:401 10.3389/FPSYG.2018.00401. [DOI] [PMC free article] [PubMed]
- 75.Xu J, Calhoun VD, Pearlson GD et al. Opposite modulation of brain functional networks implicated at low vs. high demand of attention and working memory. PLoS One 2014;9:e87078. 10.1371/JOURNAL.PONE.0087078. [DOI] [PMC free article] [PubMed]
- 76.Osaka N, Osaka M, Kondo H, et al. The neural basis of executive function in working memory: an fMRI study based on individual differences. Neuroimage. 2004;21:623–631. doi: 10.1016/j.neuroimage.2003.09.069. [DOI] [PubMed] [Google Scholar]
- 77.Buchsbaum BR, D’Esposito M. The search for the phonological store: from loop to convolution. J Cogn Neurosci. 2008;20:762–778. doi: 10.1162/jocn.2008.20501. [DOI] [PubMed] [Google Scholar]
- 78.Paulesu E, Frith CD, Frackowiak RSJ. The neural correlates of the verbal component of working memory. Nat 1993 3626418 1993;362:342–5. [DOI] [PubMed]
- 79.Chein JM, Fiez JA. Dissociation of verbal working memory system components using a delayed serial recall task. Cereb Cortex. 2001;11:1003–1014. doi: 10.1093/cercor/11.11.1003. [DOI] [PubMed] [Google Scholar]
- 80.Gerton BK, Brown TT, Meyer-Lindenberg A, et al. Shared and distinct neurophysiological components of the digits forward and backward tasks as revealed by functional neuroimaging. Neuropsychologia. 2004;42:1781–1787. doi: 10.1016/j.neuropsychologia.2004.04.023. [DOI] [PubMed] [Google Scholar]
- 81.Amici S, Brambati S, Wilkins D, et al. Anatomical correlates of sentence comprehension and verbal working memory in neurodegenerative disease. J Neurosci. 2007;27:6282–6290. doi: 10.1523/JNEUROSCI.1331-07.2007. [DOI] [PMC free article] [PubMed] [Google Scholar]
- 82.Menon V, Adleman NE, White CD, et al. Error-related brain activation during a Go/NoGo response inhibition task. Hum Brain Mapp. 2001;12:131. doi: 10.1002/1097-0193(200103)12:3<131::AID-HBM1010>3.0.CO;2-C. [DOI] [PMC free article] [PubMed] [Google Scholar]
- 83.Leung H-C, Skudlarski P, Gatenby JC, et al. An event-related functional MRI study of the Stroop color word interference task. Cereb Cortex. 2000;10:552–560. doi: 10.1093/cercor/10.6.552. [DOI] [PubMed] [Google Scholar]
- 84.Hampshire A, Chamberlain SR, Monti MM, et al. The role of the right inferior frontal gyrus: inhibition and attentional control. Neuroimage. 2010;50:1313. doi: 10.1016/j.neuroimage.2009.12.109. [DOI] [PMC free article] [PubMed] [Google Scholar]
- 85.Swick D, Ashley V, Turken AU. Left inferior frontal gyrus is critical for response inhibition. BMC Neurosci. 2008;9:102. doi: 10.1186/1471-2202-9-102. [DOI] [PMC free article] [PubMed] [Google Scholar]
- 86.Padmala S, Pessoa L. Interactions between cognition and motivation during response inhibition. Neuropsychologia. 2010;48:558. doi: 10.1016/j.neuropsychologia.2009.10.017. [DOI] [PMC free article] [PubMed] [Google Scholar]
- 87.Garavan H, Ross TJ, Stein EA. Right hemispheric dominance of inhibitory control: an event-related functional MRI study. Proc Natl Acad Sci U S A. 1999;96:8301. doi: 10.1073/pnas.96.14.8301. [DOI] [PMC free article] [PubMed] [Google Scholar]
- 88.Aron AR, Fletcher PC, Bullmore ET et al. Stop-signal inhibition disrupted by damage to right inferior frontal gyrus in humans. Nat Neurosci 2003 62 2003;6:115–6. [DOI] [PubMed]
- 89.Chambers CD, Bellgrove MA, Stokes MG, et al. Executive “brake failure” following deactivation of human frontal lobe. J Cogn Neurosci. 2006;18:444–455. doi: 10.1162/089892906775990606. [DOI] [PubMed] [Google Scholar]
- 90.Huang Y, Su L, Ma Q. The Stroop effect: an activation likelihood estimation meta-analysis in healthy young adults. Neurosci Lett. 2020;716:134683. doi: 10.1016/j.neulet.2019.134683. [DOI] [PubMed] [Google Scholar]
- 91.Coxon JP, Van IA, Wenderoth N, et al. Aging and inhibitory control of action: cortico-subthalamic connection strength predicts stopping performance. 2012;32:8401–8412. doi: 10.1523/JNEUROSCI.6360-11.2012. [DOI] [PMC free article] [PubMed] [Google Scholar]
- 92.Kawai N, Nakata R, Kubo-Kawai N. Older adults exhibit greater brain activity than young adults in a selective inhibition task by bipedal and bimanual responses: An fNIRS study. Neuroreport 2020;31:1048–53. [DOI] [PubMed]
- 93.Talwar N, Churchill NW, Hird MA, et al. Functional magnetic resonance imaging of the trail-making test in older adults. PLoS One. 2020;15:e0232469. doi: 10.1371/journal.pone.0232469. [DOI] [PMC free article] [PubMed] [Google Scholar]
- 94.Zakzanis KK, Mraz R, Graham SJ. An fMRI study of the Trail Making Test. Neuropsychologia. 2005;43:1878–1886. doi: 10.1016/j.neuropsychologia.2005.03.013. [DOI] [PubMed] [Google Scholar]
- 95.Varjacic A, Mantini D, Demeyere N, et al. Neural signatures of Trail Making Test performance: evidence from lesion-mapping and neuroimaging studies. Neuropsychologia. 2018;115:78–87. doi: 10.1016/j.neuropsychologia.2018.03.031. [DOI] [PMC free article] [PubMed] [Google Scholar]
- 96.Varjačić A, Mantini D, Levenstein J, et al. The role of left insula in executive set-switching: lesion evidence from an acute stroke cohort. Cortex. 2018;107:92. doi: 10.1016/j.cortex.2017.11.009. [DOI] [PMC free article] [PubMed] [Google Scholar]
- 97.MacPherson SE, Cox SR, Dickie DA, et al. Processing speed and the relationship between Trail Making Test-B performance, cortical thinning and white matter microstructure in older adults. Cortex. 2017;95:92. doi: 10.1016/j.cortex.2017.07.021. [DOI] [PMC free article] [PubMed] [Google Scholar]
- 98.Hagen K, Ehlis A, Haeussinger F, et al. Activation during the Trail Making Test measured with functional near-infrared spectroscopy in healthy elderly subjects. Neuroimage. 2014;85(Pt 1):583–591. doi: 10.1016/j.neuroimage.2013.09.014. [DOI] [PubMed] [Google Scholar]
- 99.Dolcos F, Rice HJ, Cabeza R. Hemispheric asymmetry and aging: right hemisphere decline or asymmetry reduction. Neurosci Biobehav Rev. 2002;26:819-25. [DOI] [PubMed]
- 100.Reuter-Lorenz PA, Cappell KA. Neurocognitive aging and the compensation hypothesis. Cur Dir in Psych Sci. 2008;17:177-82.
- 101.Kim H. Neural activity during working memory encoding, maintenance, and retrieval: a network-based model and meta-analysis. Hum Brain Mapp. 2019;40:4912–4933. doi: 10.1002/hbm.24747. [DOI] [PMC free article] [PubMed] [Google Scholar]
- 102.Harding IH, Yücel M, Harrison BJ, et al. Effective connectivity within the frontoparietal control network differentiates cognitive control and working memory. Neuroimage. 2015;106:144–153. doi: 10.1016/j.neuroimage.2014.11.039. [DOI] [PubMed] [Google Scholar]
- 103.Grady C, Sarraf S, Saverino C, et al. Age differences in the functional interactions among the default, frontoparietal control, and dorsal attention networks. Neurobiol Aging. 2016;41:159–172. doi: 10.1016/j.neurobiolaging.2016.02.020. [DOI] [PubMed] [Google Scholar]
- 104.Koenigs M, Barbey AK, Postle BR, et al. Superior parietal cortex is critical for the manipulation of information in working memory. J Neurosci. 2009;29:14980–14986. doi: 10.1523/JNEUROSCI.3706-09.2009. [DOI] [PMC free article] [PubMed] [Google Scholar]
- 105.Postle B, Ferrarelli F, Hamidi M, et al. Repetitive transcranial magnetic stimulation dissociates working memory manipulation from retention functions in the prefrontal, but not posterior parietal, cortex. J Cogn Neurosci. 2006;18:1712–1722. doi: 10.1162/jocn.2006.18.10.1712. [DOI] [PubMed] [Google Scholar]
- 106.Geva S, Truneh T, Seghier ML et al. Lesions that do or do not impair digit span: a study of 816 stroke survivors. Brain Commun 2021;3:fcab031. [DOI] [PMC free article] [PubMed]
- 107.Todd JJ, Marois R. Capacity limit of visual short-term memory in human posterior parietal cortex. Nature. 2004;428:751–754. doi: 10.1038/nature02466. [DOI] [PubMed] [Google Scholar]
- 108.Nyberg L, Dahlin E, Stigsdotter Neely A, et al. Neural correlates of variable working memory load across adult age and skill: dissociative patterns within the fronto-parietal network. Scand J Psychol. 2009;50:41–46. doi: 10.1111/j.1467-9450.2008.00678.x. [DOI] [PubMed] [Google Scholar]
- 109.Edin F, Klingberg T, Johansson P, et al. Mechanism for top-down control of working memory capacity. Proc Natl Acad Sci. 2009;106:6802–6807. doi: 10.1073/pnas.0901894106. [DOI] [PMC free article] [PubMed] [Google Scholar]
- 110.Emery L, Heaven TJ, Paxton JL et al. Age-related changes in neural activity during performance matched working memory manipulation. Neuroimage 2008;42:1577-86. 10.1016/J.NEUROIMAGE.2008.06.021. [DOI] [PMC free article] [PubMed]
- 111.Sun X, Zhang X, Chen X, et al. Age-dependent brain activation during forward and backward digit recall revealed by fMRI. Neuroimage. 2005;26:36–47. doi: 10.1016/j.neuroimage.2005.01.022. [DOI] [PubMed] [Google Scholar]
- 112.Li Z, Moore AB, Tyner C, et al. Asymmetric connectivity reduction and its relationship to “HAROLD” in aging brain. Brain Res. 2009;1295:149–158. doi: 10.1016/j.brainres.2009.08.004. [DOI] [PMC free article] [PubMed] [Google Scholar]
- 113.Moll J, de Oliveira-Souza R, Moll FT, et al. The cerebral correlates of set-shifting: an fMRI study of the trail making test. Arq Neuropsiquiatr. 2002;60:900–905. doi: 10.1590/S0004-282X2002000600002. [DOI] [PubMed] [Google Scholar]
- 114.Pa J, Possin K, Wilson S, et al. Gray matter correlates of set-shifting among neurodegenerative disease, mild cognitive impairment, and healthy older adults. J Int Neuropsychol Soc. 2010;16:640–650. doi: 10.1017/S1355617710000408. [DOI] [PMC free article] [PubMed] [Google Scholar]
- 115.Müller LD, Guhn A, Zeller JBM, et al. Neural correlates of a standardized version of the trail making test in young and elderly adults: a functional near-infrared spectroscopy study. Neuropsychologia. 2014;56:271–279. doi: 10.1016/j.neuropsychologia.2014.01.019. [DOI] [PubMed] [Google Scholar]
- 116.Perry ME, McDonald CR, Hagler DJ, et al. White matter tracts associated with set-shifting in healthy aging. Neuropsychologia. 2009;47:2835–2842. doi: 10.1016/j.neuropsychologia.2009.06.008. [DOI] [PMC free article] [PubMed] [Google Scholar]
- 117.Oosterman JM, Vogels RLC, van Harten B, et al. Assessing mental flexibility: neuroanatomical and neuropsychological correlates of the Trail Making Test in elderly people. Clin Neuropsychol. 2010;24:203–219. doi: 10.1080/13854040903482848. [DOI] [PubMed] [Google Scholar]
- 118.Oldrati V, Patricelli J, Colombo B, et al. The role of dorsolateral prefrontal cortex in inhibition mechanism: a study on cognitive reflection test and similar tasks through neuromodulation. Neuropsychologia. 2016;91:499–508. doi: 10.1016/j.neuropsychologia.2016.09.010. [DOI] [PubMed] [Google Scholar]
- 119.Vanderhasselt M, DE Raedt R, Baeken C. Dorsolateral prefrontal cortex and Stroop performance: tackling the lateralization. Psychon Bull Rev. 2009;16:609–612. doi: 10.3758/PBR.16.3.609. [DOI] [PubMed] [Google Scholar]
- 120.Cohen JD, Botvinick M, Carter CS. Anterior cingulate and prefrontal cortex: who’s in control? Nat Neurosci 2000 35 2000;3:421–3. [DOI] [PubMed]
- 121.Kondo H, Osaka N, Osaka M. Cooperation of the anterior cingulate cortex and dorsolateral prefrontal cortex for attention shifting. Neuroimage. 2004;23:670–679. doi: 10.1016/j.neuroimage.2004.06.014. [DOI] [PubMed] [Google Scholar]
- 122.Vespa J, Medina L, Armstrong DM. Demographic turning points for the United States: population projections for 2020 to 2060 population estimates and projections. Current Population Reports. U.S. Census Bureau, Washington, DC, 2020;P25-1144.
- 123.Gilmore-Bykovskyi A, Croff R, Glover CM et al. Traversing the aging research and health equity divide: toward intersectional frameworks of research justice and participation. Gerontologist. 2021;gnab107. 10.1093/GERONT/GNAB107 [DOI] [PMC free article] [PubMed]
- 124.Mondino M, Ghumman S, Gane C et al. Effects of transcranial stimulation with direct and alternating current on resting-state functional connectivity: an exploratory study simultaneously combining stimulation and multiband functional magnetic resonance imaging. Front Hum Neurosci 2020;13:474. 10.3389/fnhum.2019.00474. [DOI] [PMC free article] [PubMed]
- 125.Peña-Gómez C, Sala-Lonch R, Junqué C, et al. Modulation of large-scale brain networks by transcranial direct current stimulation evidenced by resting-state functional MRI. Brain Stimul. 2012;5:252–263. doi: 10.1016/j.brs.2011.08.006. [DOI] [PMC free article] [PubMed] [Google Scholar]
Associated Data
This section collects any data citations, data availability statements, or supplementary materials included in this article.
Data Availability Statement
Data are managed under the data sharing agreement established with NIA and the parent R01 clinical trial Data Safety and Monitoring Board in the context of an ongoing Phase III clinical trial (ACT study, R01AG054077). All trial data will be made publicly available 2 years after completion of the parent clinical trial, per NIA and DSMB agreement. Requests for baseline data can be submitted to the ACT Publication and Presentation (P&P) Committee and will require submission of a data use, authorship, and analytic plan for review by the P&P committee (ajwoods@phhp.ufl.edu).