

Abstract
Cutaneous melanoma can be lethal even if detected at an early stage. Epigenetic profiling may facilitate the identification of aggressive primary melanomas with unfavorable outcomes. We performed clustering of whole-genome methylation data to identify subclasses that were then assessed for survival, clinical features, methylation patterns and biological pathways. Among 89 cutaneous primary invasive melanomas, we identified three methylation subclasses exhibiting low-methylation (LM), intermediate-methylation (IM), or hypermethylation of CpG islands, known as the CpG island methylator phenotype (CIMP). CIMP melanomas occurred as early as T-stage 1b; and, compared with LM melanomas, were associated with age at diagnosis ≥65 years, lentigo maligna melanoma histologic subtype, presence of ulceration, higher AJCC stage and T-stage, and lower tumor infiltrating lymphocyte (TIL) grade (all p<0.05). Patients with CIMP melanomas had worse melanoma-specific survival (HR=11.84; CI=4.65–30.20) than those with LM melanomas, adjusted for age, sex, AJCC stage, and TIL grade. Genes hypermethylated in CIMP compared with LM melanomas included PTEN, VDR, PD-L1, TET2 and gene sets related to development/differentiation, the extracellular matrix and immunity. CIMP melanomas exhibited hypermethylation of genes important in melanoma progression and tumor immunity; and, although present in some early melanomas, CIMP was associated with worse survival independent of known prognostic factors.
INTRODUCTION
Cutaneous melanoma is the most lethal form of skin cancer, and its incidence continues to rise (AmericanCancerSociety, 2020; Linos et al., 2009). American Joint Committee on Cancer (AJCC) staging of primary melanoma patients to estimate the risk of recurrence and death is based on the primary melanoma characteristics of Breslow thickness and ulceration, along with whether disease has metastasized to lymph nodes or visceral sites (Gershenwald et al., 2017). The presence and pattern of tumor infiltrating lymphocytes (TILs) in the melanoma, measured as TIL grade, also provides prognostic information (Thomas et al., 2013). Clinical outcomes can differ within a specific AJCC stage (Gershenwald et al., 2017), indicating that there exist biologically-distinct melanoma subtypes that vary in their aggressiveness, metastatic potential and ability to evade the immune system (Davar and Kirkwood, 2016; Gerami et al., 2015; Hodi et al., 2010; Thomas et al., 2013). New biomarkers are urgently needed to further stratify melanoma patient risk.
At the molecular and cellular levels, melanoma is a complex disease influenced by genetic and epigenetic alterations in both the tumor and its microenvironment that includes immune cells and surrounding epithelial or stromal cells. Recent studies have described multiple cutaneous melanoma subtypes defined by gene mutations (Devitt et al., 2011; Thomas et al., 2015), mRNA or miRNA expression patterns (Cirenajwis et al., 2015; Jonsson et al., 2010; Lauss et al., 2016; Lauss et al., 2015b; Nsengimana et al., 2015; Segura et al., 2010), copy number alterations (TCGA, 2015), and immune cell infiltrates (Nsengimana et al., 2018; Pozniak et al., 2019) that are often associated with different patient outcomes or differential responses to targeted and immune therapies.
Disruption of the methylation landscape is also a widespread feature in the development and progression of cutaneous melanomas, with epigenetic regulation of key melanoma pathways linked to metastatic progression and survival (Guo et al., 2015; Lauss et al., 2015a; Micevic et al., 2017; Tiffen et al., 2016). Epigenetic mechanisms, including DNA methylation at CpG dinucleotides, may regulate gene expression without altering the DNA sequence (Plass, 2002). Clustering of whole-genome methylation array data has revealed multiple methylation subtypes exhibiting survival differences; however, the numbers of subtypes identified vary by study and most reports examined late stage primary melanomas or metastases (Lauss et al., 2015a; Lauss et al., 2015b; Sigalotti et al., 2012; Tanemura et al., 2009; TCGA, 2015), with only one including earlier primary melanomas (Wouters et al., 2017). Among the methylation subtypes described in melanoma is an aggressive subgroup exhibiting worse outcomes and hypermethylation of CpG islands, called the ‘CpG island methylator phenotype’ (CIMP) (Lauss et al., 2015b; Tanemura et al., 2009). The CIMP phenomenon has also been observed in other tumor types, but its prognostic significance varies (Abe et al., 2005; Fang et al., 2011; Juo et al., 2014; Noushmehr et al., 2010). In melanoma, questions remain whether CIMP represents a biological subtype, and if this phenotype is evident in early melanomas or is related to tumor progression. Here, we sought to identify and characterize the CpG island hypermethylated melanoma subtype among a series of primary invasive melanomas that included early-stage tumors, with the goal of better understanding its histologic characteristics, clinical behavior, epigenetic alterations and underlying biology.
RESULTS AND DISCUSSION
Patient characteristics
Illumina 450K methylation array profiling was performed on 89 formalin-fixed paraffin-embedded (FFPE) primary invasive melanomas, with 48.3% of patients being ≥65 years of age, 64.0% male and 88.8% white of European ancestry (Supplementary Table S1). Melanomas were distributed across AJCC tumor stages and histologic subtypes, with median Breslow thickness of 1.60 mm (range 0.37–17.00 mm) and 39.8% with ulceration.
Primary melanoma methylation subclasses
Using consensus clustering and unsupervised hierarchical clustering with the top 1% most variant CpG probes, we identified three primary melanoma clusters shown in the heatmap of Figure 1a; the low-methylation (LM), intermediate-methylation (IM), and hypermethylated CIMP subclasses comprised 37%, 47% and 16% of melanomas, respectively. The LM subclass exhibited a methylation profile most similar to that of benign nevi (Figure 1b). Principal components analysis (PCA) confirmed separation of the three melanoma subclasses (Figure 1c). Additional metrics supporting the identification of three subclasses are provided in Supplementary Figures S1a–c. Restricting clustering to the top 5% of probes in CpG islands also produced similar methylation subclasses including the CIMP subclass (Supplementary Figures S1d–f). The three melanoma subclasses varied in their levels of methylation, denoted by the beta (β) value, in key functional motifs such as CpG islands. Specifically, the hypermethylated subclass exhibited a pattern of heavy methylation concentrated in CpG islands and shore regions compared with the other subclasses (Figure 1d); we, therefore, refer to this as the CpG island methylator phenotype (CIMP) subclass.
Figure 1. DNA methylation-based primary melanoma subclasses and their characteristics.
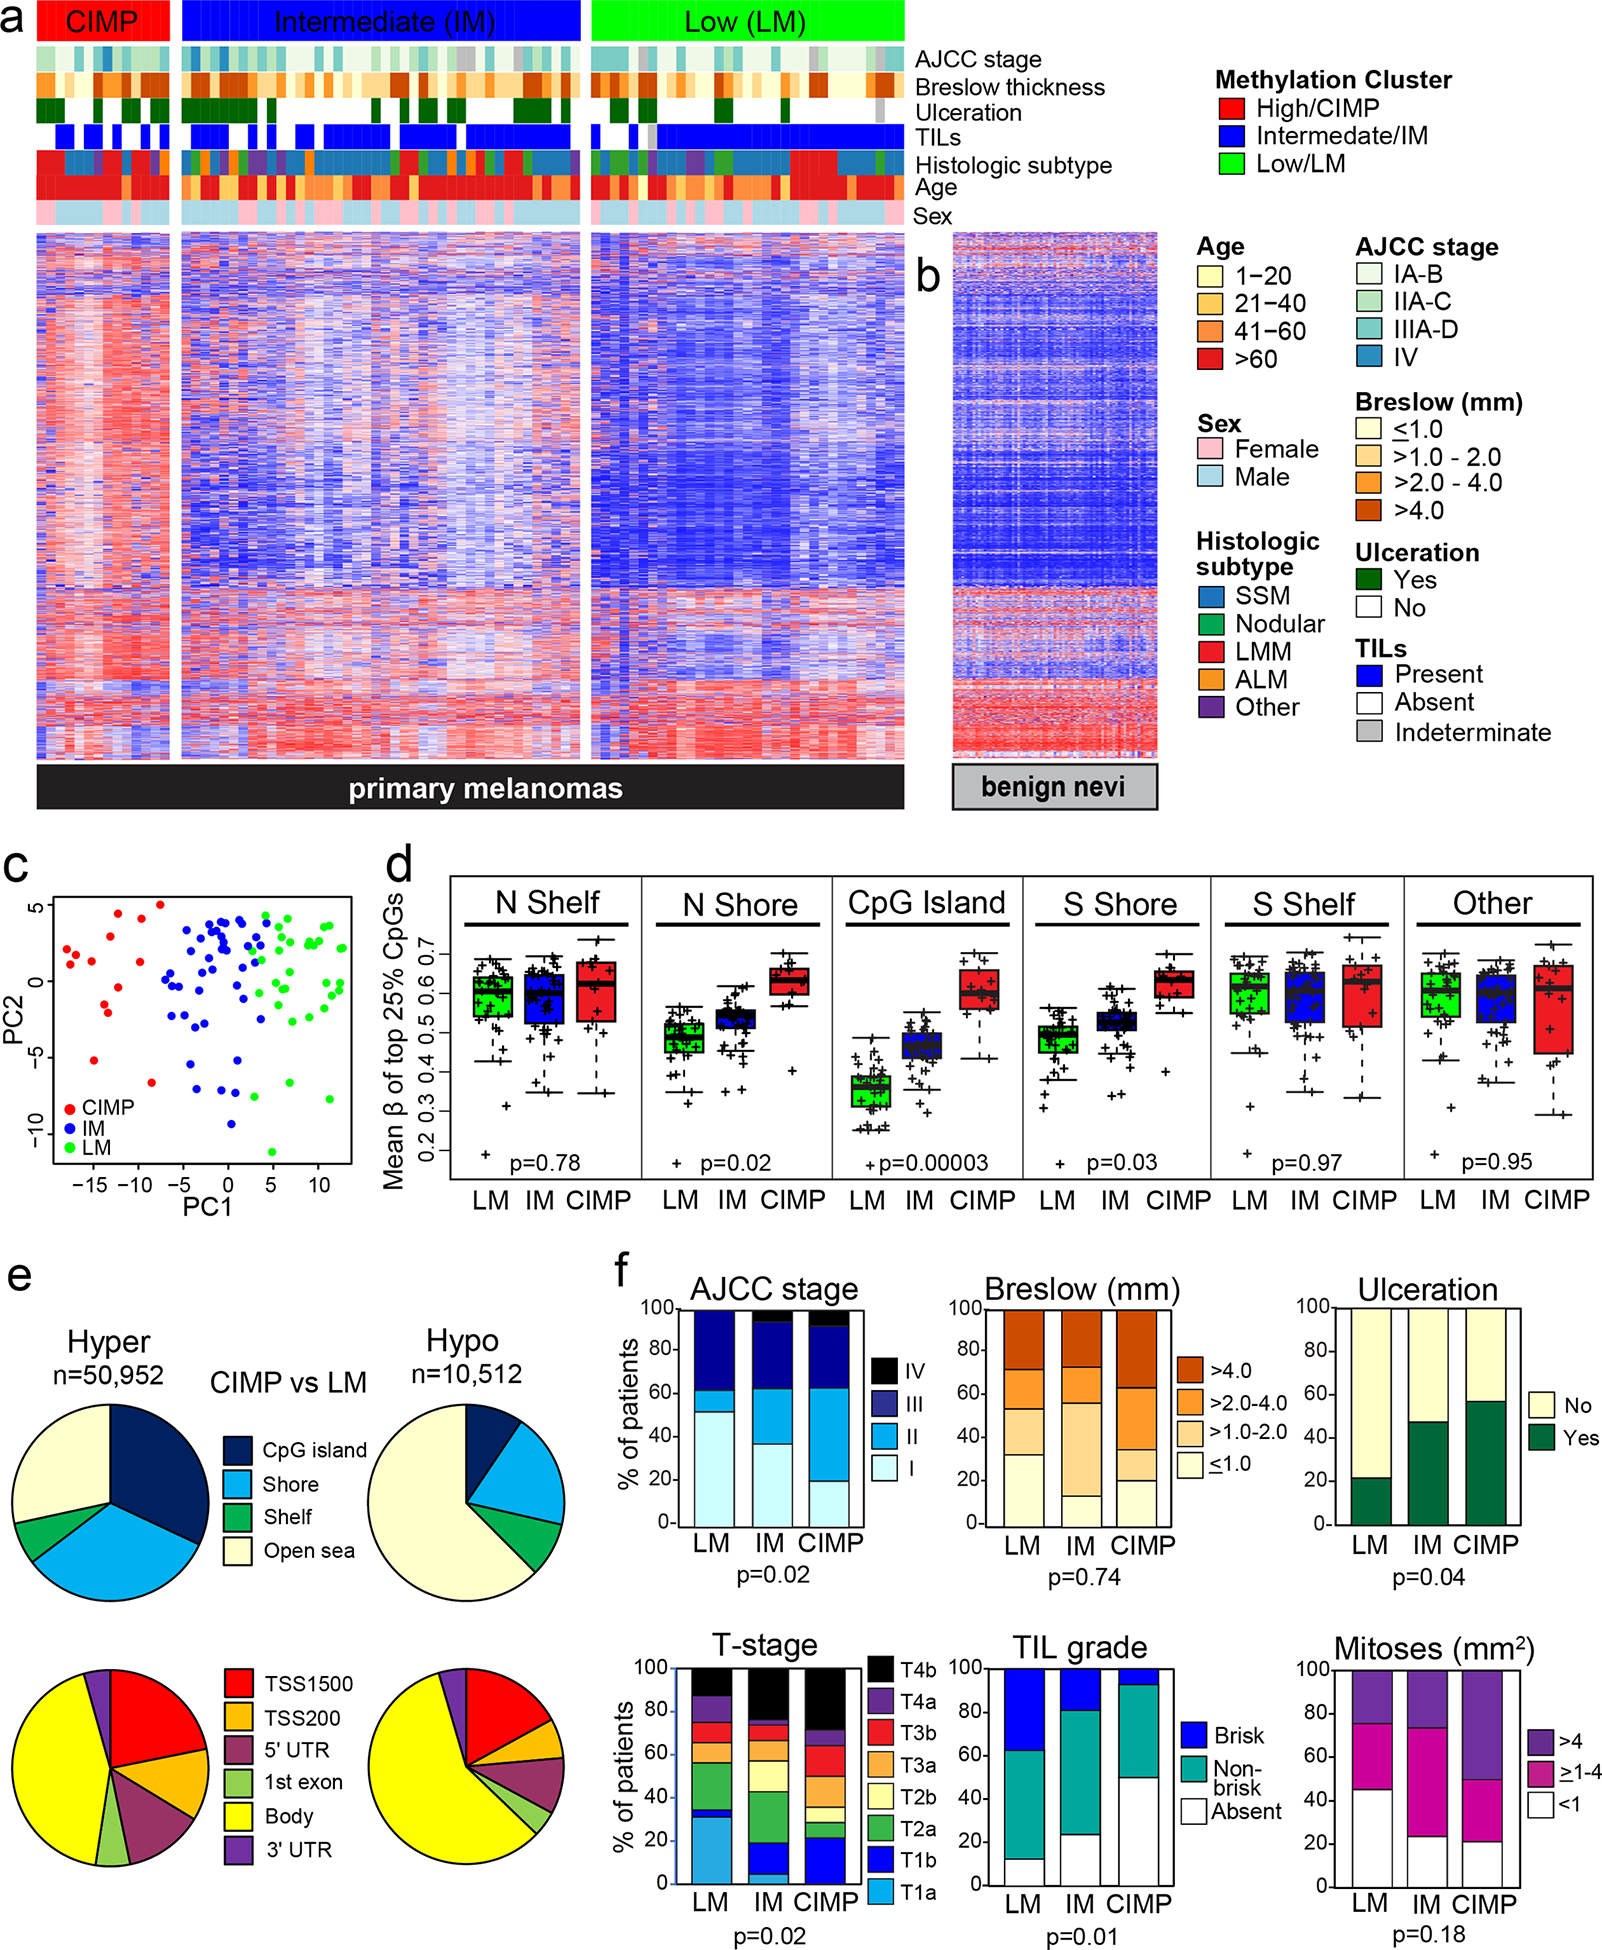
(a) Methylation-based subclasses among 89 primary invasive melanomas denoted as low methylation (LM), intermediate methylation (IM) and high methylation or CpG island methylator phenotype (CIMP). Characteristics are indicated by bars above the heatmap. (b) Methylation profiles for 73 benign nevi. (c) Principal components analysis (PCA) illustrating three melanoma subclasses. (d) Mean β of the top 25% most variant CpGs, by subclass and genomic location. (e) Genomic locations of differentially hypermethylated or hypomethylated CpGs in the CIMP versus LM subclass; probes were restricted to those with annotation for gene, location relative to a CpG island (top) or functional region and distance from the transcription start site (TSS) (bottom). (f) Boxplots illustrating characteristics of the three methylation subclasses. Adjusted p values are from the Fisher’s exact test.
Differential methylation between the CIMP and LM subtypes of CpG probes with annotation showed that 83% of CpGs (n=50,952) were hypermethylated in CIMP, mainly in CpG islands or shores and promoter regions, while only 17% of CpGs (n=10,512) were hypomethylated, mostly in open sea regions and gene bodies (Figure 1e). Similar results were observed when comparing CIMP versus the IM subclass (not shown). Among the differentially hypermethylated CpGs, 68% (n=34,456) exhibited a gradient of increasing methylation across the three melanoma subgroups from LM to IM to CIMP, suggesting that CIMP may represent an extreme accumulation of CpG island methylation due to one or more underlying mechanism(s).
Characteristics of the melanoma subclasses
Demographic, clinical and histologic characteristics were compared between the methylation subclasses. CIMP melanomas were more likely to be diagnosed at age ≥65 years (p=0.03), be of the lentigo maligna melanoma histologic subtype (p=0.01) and have ulceration (p=0.04), higher AJCC stage (p=0.02) and T-stage (p=0.02), lower TIL grade (p=0.01) and marginally more mitoses (p=0.18) than LM melanomas (Table 1; Figure 1f). CIMP melanomas were also more likely to be diagnosed at age ≥65 years (p=0.03) and be of the lentigo maligna melanoma subtype (p=0.02) than IM melanomas. Three CIMP melanomas were stage T1b, with Breslow thicknesses ≤1.00 mm and only one exhibiting ulceration, and two of these patients died either of or with melanoma. IM melanomas were also more likely to be ulcerated (p=0.03) and have higher T-stage (p=0.006) than LM melanomas.
Table 1.
Clinical characteristics of the three methylation-based primary melanoma subclasses
| Characteristic | Methylation subclass | CIMP vs. LM p value |
CIMP vs. IM p value |
IM vs LM p value |
||||||
|---|---|---|---|---|---|---|---|---|---|---|
| CIMP (n=14) |
IM (n=42) |
LM (n=33) |
||||||||
| % | % | % | ||||||||
| <65 | 21.4 | 57.1 | 57.6 | 0.03 | 0.03 | 1.00 | ||||
| ≥65 | 78.6 | 42.9 | 42.4 | |||||||
| Male | 64.3 | 64.3 | 63.6 | 1.00 | 1.00 | 1.00 | ||||
| Female | 35.7 | 35.7 | 36.4 | |||||||
| White | 78.6 | 92.9 | 87.9 | 0.41 | 0.16 | 0.69 | ||||
| Other/Unknowna | 21.4 | 7.1 | 12.1 | |||||||
| Head/neck | 50.0 | 26.2 | 33.3 | 0.82 | 0.48 | 0.93 | ||||
| Trunk | 21.4 | 33.3 | 30.3 | |||||||
| Upper extremities | 14.3 | 21.4 | 18.2 | |||||||
| Lower extremities | 14.3 | 19.0 | 18.2 | |||||||
| Superficial Spreading | 28.6 | 50.0 | 54.5 | 0.01 | 0.02 | 0.21 | ||||
| Nodular | 0 | 14.3 | 21.2 | |||||||
| Lentigo maligna | 50.0 | 11.9 | 15.2 | |||||||
| Acral lentiginous | 7.1 | 11.9 | 0 | |||||||
| Other/unclassifiedb | 14.3 | 11.9 | 9.1 | |||||||
| ≤1.0 | 21.4 | 14.3 | 33.3 | 0.74 | 0.24 | 0.13 | ||||
| >1.0–2.0 | 14.3 | 42.9 | 21.2 | |||||||
| >2.0–4.0 | 28.6 | 16.7 | 18.2 | |||||||
| >4.0 | 35.7 | 26.2 | 27.3 | |||||||
| Absent | 42.9 | 52.4 | 78.1 | 0.04 | 0.76 | 0.03 | ||||
| Present | 57.1 | 47.6 | 21.9 | |||||||
| Indeterminate | ||||||||||
| <1 | 21.4 | 23.8 | 45.5 | 0.18 | 0.22 | 0.11 | ||||
| ≥1–4 | 28.6 | 50 | 30.3 | |||||||
| >4 | 50 | 26.2 | 24.2 | |||||||
| IA/IB | 21.4 | 38.5 | 53.3 | 0.02 | 0.54 | 0.22 | ||||
| IIA/IIB/IIC | 42.9 | 25.6 | 10.0 | |||||||
| IIIA/IIIB/IIIC/IIID | 28.6 | 30.8 | 36.7 | |||||||
| IV | 7.1 | 5.1 | 0 | |||||||
| Unknown | ||||||||||
| T1a | 0 | 4.8 | 31.3 | 0.02 | 0.69 | 0.006 | ||||
| T1b | 21.4 | 14.3 | 3.1 | |||||||
| T2a | 7.1 | 23.8 | 21.9 | |||||||
| T2b | 7.1 | 14.3 | 0 | |||||||
| T3a | 14.3 | 9.5 | 9.4 | |||||||
| T3b | 14.3 | 7.1 | 9.4 | |||||||
| T4a | 7.1 | 2.4 | 12.5 | |||||||
| T4b | 28.6 | 23.8 | 12.5 | |||||||
| Unknown | ||||||||||
| N0 (negative) | 71.4 | 64.1 | 63.3 | 0.74 | 0.75 | 1.00 | ||||
| Any N (positive) | 28.6 | 35.9 | 36.7 | |||||||
| Unknown | ||||||||||
| M0 (negative) | 92.9 | 94.9 | 100. | 0.32 | 1.00 | 0.50 | ||||
| M1 (positive) | 7.1 | 5.1 | 0 | |||||||
| Unknown | 0 | |||||||||
| Absent | 50.0 | 23.8 | 12.5 | 0.01 | 0.21 | 0.17 | ||||
| Non-brisk | 42.9 | 57.1 | 50.0 | |||||||
| Brisk | 7.1 | 19.0 | 37.5 | |||||||
| Indeterminate | ||||||||||
| Absent | 35.7 | 19.0 | 12.1 | 0.20 | 0.46 | 0.36 | ||||
| Medium | 41.2 | 64.3 | 57.6 | |||||||
| Heavy | 14.3 | 16.7 | 30.3 | |||||||
| Absent | 9.1 | 28.6 | 14.8 | 0.47 | 0.45 | 0.82 | ||||
| Mild/moderate | 63.6 | 42.9 | 62.9 | |||||||
| Marked | 27.3 | 23.8 | 22.2 | |||||||
| Indeterminate | ||||||||||
Definitions: AJCC, American Joint Committee on Cancer. P-values were derived from the Fisher’s exact test for two groups (CIMP versus intermediate and low methylation).
Among patients categorized as Other/Unknown, one was African-American/Non-Hispanic, one was Other/Hispanic, and eight had unknown race/ethnicity. All White patients were Non-Hispanic.
Other types of melanoma include nevoid (n=2), desmoplastic (n=1), spindle cell (n=1), Spitzoid (n=1), unclassified (n=5).
AJCC stage and T-stage are based on AJCC 8th edition.
As shown in Kaplan-Meier plots, CIMP melanomas were associated with worse melanoma-specific and all-cause survival compared with the IM and LM subclasses among all patients (Figure 2a) and those without disease progression at diagnosis (AJCC stages I/II) (Figure 2b). Univariate hazard ratios (HR) for melanoma-specific survival of patients with CIMP melanomas were elevated compared to those with either LM (HR=12.50; 95% CI=3.62–43.40) or IM (HR=6.44; 95% CI=2.46–16.9) melanomas (Figure 2c). After adjusting for known prognostic characteristics (age, sex, AJCC stage) in multivariable Cox proportional hazards models, the CIMP subclass was significantly associated with worse melanoma-specific survival compared to either the LM (HR= 12.91; 95% CI=5.09–32.76) or IM (HR=5.33; 95% CI=2.10–13.52) subclasses. When additionally adjusted for TIL grade (absent, non-brisk, brisk), CIMP remained associated with worse outcome compared with either the LM (HR=11.84; 95% CI=4.65–30.20) or IM (HR=5.46; 95%=2.14–13.91) subclasses (Figure 2d). The presence of CIMP in earlier stage melanomas and the persistent adverse risk associated with this subclass in multivariable survival models suggests that CIMP is not necessarily a consequence of more advanced stage but may be related to more aggressive biology and anti-tumor immune suppression.
Figure 2. Survival based on methylation-based melanoma subclasses.

Kaplan-Meier plots showing melanoma-specific and all-cause survival based on the three methylation-based subclasses among (a) all melanoma patients or (b) patients without evidence of metastasis at diagnosis. Log rank p values are shown. (c) Forest plot of unadjusted hazard ratios for melanoma-specific survival, comparing the effect of methylation subclass with other prognostic and patient characteristics. The box size reflects the Cox p-value in −log10 scale. (d) Multivariable Cox proportional hazards ratios for melanoma-specific survival, adjusted for categorical variables of age (>65/≤65 yrs), sex (male/female) and AJCC stage (IA/IB, IIA/IIB/IIC, IIIA/IIIB/IIIC, IV), and TIL grade (absent/non-brisk/brisk).
Development of a methylation subtype classifier for melanoma
To facilitate independent validation of methylation subclasses and gene expression in The Cancer Genome Atlas (TCGA) melanomas, we used ElasticNet modeling in a training set of 58 UNC melanomas to develop a signature to distinguish CIMP, IM and LM melanomas. The final 171-CpG classifier predicted these subclasses in the test set (n=31) with 100% sensitivity, 88% specificity, and Area Under the Curve (AUC)=0.976 (Supplementary Figures S2a–d), with the predicted CIMP melanomas showing the worst melanoma-specific survival (Supplementary Figure S2e). Among primary and metastatic melanomas from TCGA, the 171-CpG classifier distinguished three subclasses, including the poorer-prognostic CIMP subclass (Supplementary Figure S2f, g). CIMP melanomas in TCGA defined by the 171-CpG signature comprised 15% of primary and metastatic melanomas (Supplementary Figure S2h), were previously classified as the ‘CpG island hypermethylated’ subclass (Supplementary Figure S2i) and included a mixture of mRNA expression subtypes (TCGA, 2015) (Supplementary Figure S2j).
Pathways and genes differentially hypomethylated in CIMP
Given their distinct clinical and survival differences, we examined differential methylation profiles between the CIMP and LM subclasses. Among promoter-associated CpGs, 89% (n=44,969) were differentially hypermethylated in CIMP versus LM melanomas, while only 11% (n=9,457) were hypomethylated. MethylRRA analysis of hypomethylated CpGs/genes revealed significant enrichment for gene sets related to olfactory receptor signaling and keratinization; pigmentation terms were also identified but were not significant at the FDR threshold (Figure 3a). Heatmap panels in Figure 3b provide examples of CIMP-related hypomethylation in open seas regions of genes related to keratinization. Figures 3c and 3d summarize the coordinated differential hypomethylation in the CIMP versus LM subclasses of melanocyte pigmentation-related genes that include SOX10, MITF, the master regulator of melanocyte growth and differentiation (Vachtenheim and Ondrusova, 2015), and its targets TYR, DCT, SLC45A2, EDNRB, and CDK2. MITF hypomethylation in CIMP melanomas occurred most prominently at cg11038507 near the transcription start site (TSS) of the melanocyte/melanoma-specific MITF-M transcript, which has been shown to inversely correlate with mRNA expression (Lauss et al., 2015a). In TCGA, CIMP primary melanomas exhibited hypomethylation and higher mRNA expression of several MITF target genes (Figure 3e), including CDK2 and EDNRB for which methylation was inversely correlated with expression (Figures 3f, g; Supplementary Table S2). Tissue-specific regulation of CDK2 by MITF has been shown to be crucial for maintaining proliferation in melanoma cells (Du et al., 2004). Overall, CIMP-related gene hypomethylation patterns seem to reflect melanocytic or epithelial cell types and/or the reported mRNA expression-based subtypes of melanoma (e.g., keratin or pigmentation) (Lauss et al., 2015a; TCGA, 2015).
Figure 3. Gene sets and pathways differentially hypomethylated in CIMP melanomas.

MethylRRA was conducted using promoter-associated CpGs/genes differentially hypomethylated (FDR p-value <0.05) between CIMP and LM subsets. (a) Bar plot showing −log10 of FDR p-values for the top enriched gene sets. Heatmap panels showing methylation in CIMP and LM tumors for selected genes involved in (b) keratinization and (c) pigmentation. The genes shown exhibited differential hypomethylation at two or more CpGs. (d) Boxplots summarizing hypomethylation of MITF and its target genes involved in pigmentation. In TCGA primary melanomas, heatmap panels show methylation and associated mRNA expression for pigmentation-related genes in CIMP vs. LM subsets identified by the 171 CpG classifier (e), and scatter plots of methylation and mRNA expression for CDK2 (f) and EDNRB (g). P-values are FDR-adjusted.
Pathways and genes differentially hypermethylated in CIMP
Many pathways and gene sets exhibited hypermethylation of constituent genes in CIMP (versus LM) melanomas, summarized according to their function in Figure 4A. Among these were gene sets involved in development/morphogenesis and differentiation, neural crest differentiation, the extracellular matrix (ECM), tissue remodeling and wound healing, epithelial differentiation, oncogenic signaling related to PI3 kinase or loss of BMI1, and immune regulation and inflammation, with considerable overlap in constituent genes between many of these gene sets. The majority of hypermethylated CpG sites resided in promoter regions, as shown in the volcano plot of Figure 4b. Of the hypermethylated CpG sites located in islands and promoters (and with gene annotation), 34% showed inverse Pearson correlations (r < −0.2) between methylation and mRNA expression in TCGA primary melanomas.
Figure 4. Selected gene sets and pathways differentially hypermethylated in CIMP melanomas.

MethylRRA analysis was conducted using promoter-associated CpGs/genes differentially hypermethylated (FDR p-value <0.05) between CIMP and LM subclasses. (a) Bar plot showing −log10 of FDR p-values for top gene sets hypermethylated in CIMP. (b) Volcano plot of CpGs hypermethylated (right) or hypomethylated (left) in promoter (red) and non-promoter (black) regions. CpGs above the broken line significant at FDR p-value <0.05. (c) Fraction of PRC2 and related gene targets defined by Ben-Porath et al (Ben-Porath et al., 2008) hypermethylated in CIMP. Heatmap panels and boxplots illustrate hypermethylation in CIMP vs. LM subclasses for VDR (d, e), PD-L1 (CD274) (g, h) and PTEN (j, k); the genes shown exhibited differential hypermethylation at two or more CpGs. Also shown are corresponding methylation and mRNA expression panels for TCGA primary melanoma subclasses defined by the 171 CpG signature, with tumors similarly ordered in both panels. Scatter plots show CpG methylation versus mRNA expression in TCGA primary melanomas for VDR (f) and PD-L1 (i), with Pearson correlations shown.
Many of the genes exhibiting CpG island hypermethylation in the CIMP subclass have roles in embryonic development and differentiation, and are transcriptional regulators and targets of the polycomb repressor complex 2 (PRC2) and its core proteins (SUZ12, EED) that add repressive H3K27 trimethylation marks on chromatin (Ben-Porath et al., 2008) (Figure 4c). PRC2 target gene hypermethylation occurs with age (Teschendorff et al., 2010), is an epigenetic hallmark of CIMP in other cancers and is often associated with aggressive tumor phenotypes and adverse outcomes (Easwaran et al., 2012; Hughes et al., 2013; Widschwendter et al., 2007). Developmental genes demonstrating CIMP-related hypermethylation included ESR2, RARB and FRZB and PRC2 target genes such as VDR and PITX1, and for many, primary melanoma data from TCGA confirmed CIMP-related hypermethylation, lower mRNA expression, and an inverse relationship between methylation and mRNA expression (Supplementary Figure S3 and Table S2). Methylation silencing and downregulation of these tumor suppressor genes have been reported in melanoma or other cancers, and are associated with adverse growth characteristics, more advanced cancer, or worse patient outcomes (Barut et al., 2016; de Giorgi et al., 2009; de Unamuno Bustos et al., 2018; Ekstrom et al., 2011; Ohira et al., 2019; Spyropoulos et al., 2015; Tanemura et al., 2009; Xue et al., 2007). Tumor suppressor genes, such as RASSF1 and CDKN2A, known to be hypermethylated in melanomas but not specifically identified through the MethylRRA gene set/pathway analysis were also more heavily methylated in CIMP tumors (Supplementary Figure S4).
An intriguing finding is hypermethylation of the vitamin D receptor (VDR) as part of the CIMP phenotype in melanomas (Figures 4d, e), which is correlated with reduced mRNA expression in TCGA primary melanomas (Pearson r= −0.412 for cg10037049) (Figure 4f). VDR mediates vitamin D signaling, exerts pro-differentiation and anti-proliferative properties (Burns et al., 2015) and supports anti-tumor immunity (Muralidhar et al., 2019). Loss of VDR signaling, including via methylation silencing, has been linked to more advanced tumor features, TIL deficiency, and worse outcomes among melanoma patients (Brozyna et al., 2014; Muralidhar et al., 2019; Newton-Bishop et al., 2009; Newton-Bishop et al., 2015). Our results, together with prior studies, suggest that methylation-related impairment of VDR signaling could contribute to the adverse clinical features and TIL deficiency observed in CIMP melanomas.
The extracellular matrix (ECM) serves as a critical barrier to tumor cell invasion and metastasis. Among genes hypermethylated in CIMP melanomas were those that stabilize and maintain the integrity of the ECM and basement membrane (e.g., COL1A2, NID1, NID2), form gap junctions (GJA1) or suppress cell migration or cytoskeletal remodeling (COL1A2, SPINT2, AIM1). Heatmaps demonstrating CIMP-related hypermethylation and supporting methylation and expression data in TCGA are shown in Supplementary Figure S3b and Table S2. ECM-related genes are expressed in melanomas and/or keratinocytes, and their silencing via methylation in melanomas or other cancer types promotes cell motility, invasion and metastasis (Ableser et al., 2014; Bonazzi et al., 2011; Chai et al., 2016; Chen et al., 2003; Haffner et al., 2017; Hoshimoto et al., 2012; Hwang et al., 2015; Koga et al., 2009; Tittarelli et al., 2015; Ulazzi et al., 2007; Wang et al., 2020).
A prominent feature of the CIMP subclass is a deficiency in anti-tumor immunity as evidenced by the lack of a robust TIL response. Several immune-related genes expressed by some tumors and antigen-presenting cells, such as PD-L1 (CD274), IRF6 and HLA-DOA, were hypermethylated in CIMP melanomas but relatively unmethylated in the LM subclass that exhibited abundant TILs (Supplementary Figure S3c; Figures 4g, h), and these findings were confirmed in TCGA primary melanomas. PD-L1 methylation was inversely correlated with mRNA expression (Figure 4i), consistent with prior studies indicating that PD-L1 hypermethylation was associated with reduced immune cell infiltrates and worse survival among melanoma patients (Madore et al., 2016; Micevic et al., 2019). CpG island hypermethylation in the promoter of PTEN, a tumor suppressor and negative regulator of the PI3K signaling pathway, was prominent in CIMP melanomas, likely occurring in some tumors in conjunction with mutation and/or deletion (Figures 4j, k; Supplementary Figure S3d). PTEN methylation is a prognostic marker for worse melanoma outcomes (Lahtz et al., 2010; Roh et al., 2016), and loss of PTEN protein correlates with reduced T-cell infiltration and resistance to checkpoint immunotherapy (Peng et al., 2016).
CIMP melanomas were more likely to exhibit promoter hypermethylation of the DNA demethylation gene, TET2, compared to the IM or LM subclasses (Figures 5a, b). Twelve of 14 (86%) CIMP melanomas (including all three T1 tumors) versus 2 of 33 (6%) LM tumors had TET2 methylation of β>0.2 (at cg00911488), which correlated with CIMP status (AUC=0.90) (Figure 5c). Both primary and metastatic CIMP melanomas in TCGA exhibited strong TET2 hypermethylation and lower mRNA expression compared with the LM subclass (Figure 5d). Moreover, TET2 methylation was inversely correlated with mRNA expression (Pearson r= −0.32) (Figure 5e). The molecular mechanisms underlying CIMP have not been fully established but include mutation of IDH1/IDH2 genes that can produce an oncometabolite inhibiting TET2 (Losman and Kaelin, 2013; Reitman and Yan, 2010). Epigenetic silencing of TET2 has also been reported in hypermethylated melanomas in association with an invasive phenotype (Gong et al., 2017; Koroknai et al., 2019). These observations raise the question of whether diminished demethylation capability contributes to the development or maintenance of CIMP in melanomas.
Figure 5. Hypermethylation of TET2 in the CIMP melanoma subclass.

(a) Heatmap panels showing TET2 hypermethylation in the CIMP subclass. FDR p values and CpG locations are given on the right. Methylation level is indicated by the β value, with higher methylation in red, low methylation in blue, and intermediate values shown in white. Clinical annotation is provided below the heatmap. (b) Boxplots summarizing CpG methylation differences in TET2 between melanoma subclasses. (c) Correlation of TET2 methylation of ≥0.2 β (vs. <0.2 β) with CIMP subclass status. In TCGA melanomas, (d) TET2 methylation and associated mRNA expression by subclasses defined by the 171-CpG classifier, and (e) scatter plot of TET2 methylation versus mRNA expression in primary TCGA melanomas.
Conclusions
Among primary invasive melanomas, we identified three methylation-based subclasses, including a CIMP subclass exhibiting hypermethylation of CpG islands and particularly poor melanoma-specific and overall survival after accounting for other prognostic factors. CIMP melanomas also frequently exhibited more adverse features of ulceration, higher T-stage and absence of TILs. However, CIMP was found in some early melanomas, suggesting this phenotype is not necessarily a consequence of tumor progression, but may help to identify patients at higher risk of recurrence. Our findings will need to be validated in a larger study that includes early melanomas. Limitations of our study include the lack of paired mRNA expression data and limited size of the CIMP subclass. However, TCGA melanomas, despite being thick primary tumors and metastases, validated many of our methylation findings in mostly earlier primary melanomas.
MATERIALS AND METHODS
Patients and tissues
FFPE primary invasive melanomas were assembled as previously described (Conway et al., 2019), and included all AJCC tumor stages based on the 8th Edition of the AJCC Cancer Staging Manual (Gershenwald et al., 2017) and a broad spectrum of histologic subtypes. Details of sample and clinical data acquisition and pathology review are provided in the Supplementary Materials. The institutional review boards at the University of North Carolina and the University of Rochester approved this retrospective study. They determined that the research met criteria for waiver of informed consent for research (45 CFR 46.116d]) and waiver of Health Insurance Portability and Accountability Act authorization (45 CFR 164.512[i][2][ii]) because the research involved no more than minimal risk to the subjects, the waiver would not adversely affect the rights and welfare of the subjects, and, the research could not be practicably carried out without the waiver. Patient demographics, and clinical and tumor histopathologic characteristics are provided in Supplementary Table S1.
TIL scoring
Histopathologic scoring of tumor infiltrating lymphocytes (TILs) was performed by the dermatopathologist using the 3-tier scoring criteria described by Clark et al (Clark et al., 1989). Briefly, if TILs were present throughout the area of the vertical growth phase or present and infiltrating across the entire base or the vertical growth phase, they were scored as brisk. TILs occurring in one or more foci of the vertical growth phase were considered non-brisk. If lymphocytes were present but did not infiltrate the melanoma, or if lymphocytes were not associated with any part of the vertical growth phase, they were considered absent.
DNA preparation
Melanomas were manually dissected using H&E slides as guides and DNA was prepared as described (Thomas et al., 2004).
HumanMethylation450 BeadChip analysis
Details on methylation array analysis and data preprocessing have been described (Conway et al., 2019). The final dataset contained 383,229 probes and 89 melanomas.
Identification of methylation subtypes
Hierarchical clustering and ConsensusClusterPlus (CCP) (Wilkerson and Hayes, 2010) with the top 1% most variable CpG probes measured by interquartile range (IQR) (after filtering) (n=3,833) were used to identify methylation-based melanoma subclasses, and resulting subtypes defined by the two methods were compared. CCP was performed with a resampling of 80% of probes and 80% of samples. Both clustering methods utilized the Euclidean distance measure and complete agglomeration method. Clusters K=2 to 10 were generated, and the optimal number of clusters was chosen based on consensus membership heatmaps and change in area under the CDF curve (AUC). Heatmaps depicting consensus and hierarchical clustering in tumors were generated using the top 1% most variant probes. Columns were annotated with patient, clinical and pathological attributes. Two-sided Fisher’s exact tests (Clarkson et al., 1993; Mehta and Patel, 1986; Mehta and Patel, 1983) assessed whether the clusters were associated with specific attributes. PCA depicted the segregation of methylation-based melanoma subclasses.
Survival analyses
The survival package in R was used to compute survival probabilities and Kaplan-Meier plots were generated to display survival differences between melanoma subclasses. The log-rank test was used to test differences in survival among subclasses. Cox proportional hazards regression models were used to compute hazard ratios between groups.
Methylation subtype classifier development
Multinomial regression with ElasticNet was performed on the training set of 58 (of 89) melanomas to derive a CpG classifier that distinguished the three methylation subclasses and was independently validated in the test set (n=31) and in 467 melanomas from The Cancer Genome Analysis (TCGA) provisional dataset (Supplementary Figure S2). The Area Under the Curve (AUC) plot was used to identify the number of CpGs in the multiclass classifier and the best alpha level that optimally distinguished each of the three subtypes using the multiclass.roc function from the pROC package (Hand and Till, 2001). Heatmaps were used to illustrate the resulting melanoma subclasses and Kaplan-Meier plots evaluated the survival of each cluster.
Differential methylation analysis
The ChAMP package (champ DMP function) (Morris et al., 2014) was used to identify promoter-associated CpG loci (residing in the TSS1500, TSS200, 1st exon, or 5’UTR) exhibiting differential hyper- or hypomethylation between melanoma subclasses. Other CpG annotations included relationship to transcription start site (TSS200, TSS1500), CpG island (Island, Shelf, Shore), or other regions (e.g., Body). CpG probes differentially methylated between two subclasses had delta mean β ≥0.1 and were significant at FDR-adjusted p-values of <0.05 (Benjamini and Hochberg, 1995).
MethylRRA analysis
Hypomethylated and hypermethylated CpG loci in promoters differing at FDR p<0.05 between the CIMP and LM subclasses were examined for enrichment of gene sets (GO gene sets/C5 biological processes, C6 oncogenic signatures, and C2 curated gene sets) available through the Broad Institute MSig database (http://software.broadinstitute.org/gsea/msigdb/index.jsp). Enrichment analysis was performed using the Robust Rank Aggregation method implemented by the methylRRA function from methylGSA (Ren and Kuan, 2019). For each gene, methylRRA computes an adjusted p-value based on ordered statistics of the CpG level p-values mapping to the gene.
TCGA analyses
Illumina 450K methylation data for TCGA-SKCM were downloaded from TCGABiolinks (n=466). All idat files were processed by ChAMP as follows. Filtering was performed for probes with detection p-value <0.01, with <3 beads in at least 5% of samples, overlapping SNPs, mapping to more than one locus or located on X or Y chromosomes. Missing beta values were then imputed by the K Nearest Neighbor (KNN) algorithm and BMIQ normalization was performed (Teschendorff et al., 2013). Clinical and high-quality survival data for TCGA-SKCM were obtained from Liu et al (Liu et al., 2018). Pearson correlations (r) were used to assess the relationship of methylation and mRNA expression. Analysis of differential methylation was performed as described for UNC melanomas.
Supplementary Material
ACKNOWLEDGEMENTS
This work was funded by the National Cancer Institute grants R21CA134368, R33CA160138, and R03CA199487 to K Conway and NE Thomas, P01CA206980 to M Berwick and NE Thomas, R01CA233524 to NE Thomas, M Berwick, C Begg, and H Anton-Culver and P30CA016086 to HS Earp. The LCCC Mammalian Genotyping Core Facility performed the methylation assays and was supported in part by a grant from the National Institute of Environmental Health Sciences (P30ES010126). We would like to acknowledge Pamela A. Groben MD, Professor Emeritus, Departments of Dermatology and Pathology and Laboratory Medicine, for participating in the pathology review. We also thank Rodger Zhou, Yu Gu, Samuel Rosin and Jean Jiang for analysis of TCGA data.
ABBREVIATIONS
- AJCC
American Joint Committee on Cancer
- AUC
Area under the receiver operator characteristic (ROC) curve
- CI
Confidence interval
- CCP
Consensus cluster plus
- CIMP
CpG island methylator phenotype
- DNA
Deoxyribonucleic acid
- ECM
Extracellular matrix
- FDR
False discovery rate
- HR
Hazard ratio
- IM
Intermediate methylation
- IQR
Interquartile range
- LM
Low methylation
- mRNA
Messenger RNA
- MethylRRA
Methyl Robust Rank Aggregation
- PRC2
Polycomb repressor complex 2
- PCA
Principal components analysis
- TCGA
The Cancer Genome Atlas
- TSS
Transcription start site
- TIL
Tumor infiltrating lymphocyte
- T-stage
Tumor stage
Footnotes
CONFLICT OF INTEREST STATEMENT
The authors state no conflict of interest.
DATA AVAILABILITY STATEMENT
The methylation dataset related to this article can be found at Gene Expression Omnibus (ncbi.nlm.nih.gov/geo) under accession number GSE120878.
REFERENCES
- Abe M, Ohira M, Kaneda A, Yagi Y, Yamamoto S, Kitano Y, et al. CpG island methylator phenotype is a strong determinant of poor prognosis in neuroblastomas. Cancer Res 2005;65(3):828–34. [PubMed] [Google Scholar]
- Ableser MJ, Penuela S, Lee J, Shao Q, Laird DW. Connexin43 reduces melanoma growth within a keratinocyte microenvironment and during tumorigenesis in vivo. J Biol Chem 2014;289(3):1592–603. [DOI] [PMC free article] [PubMed] [Google Scholar]
- AmericanCancerSociety. Cancer Facts & Figures 2020. Atlanta: American Cancer Society; 2020. [Google Scholar]
- Barut F, Udul P, Kokturk F, Kandemir NO, Keser SH, Ozdamar SO. Clinicopathological features and pituitary homeobox 1 gene expression in the progression and prognosis of cutaneous malignant melanoma. Kaohsiung J Med Sci 2016;32(10):494–500. [DOI] [PMC free article] [PubMed] [Google Scholar]
- Ben-Porath I, Thomson MW, Carey VJ, Ge R, Bell GW, Regev A, et al. An embryonic stem cell-like gene expression signature in poorly differentiated aggressive human tumors. Nat Genet 2008;40(5):499–507. [DOI] [PMC free article] [PubMed] [Google Scholar]
- Benjamini Y, Hochberg Y. Controlling the false discovery rate: a practical and powerful approach to multiple testing. J Royal Stat Soc, Series B (Methodological) 1995;57(1):289–300. [Google Scholar]
- Bonazzi VF, Nancarrow DJ, Stark MS, Moser RJ, Boyle GM, Aoude LG, et al. Cross-platform array screening identifies COL1A2, THBS1, TNFRSF10D and UCHL1 as genes frequently silenced by methylation in melanoma. PLoS One 2011;6(10):e26121. [DOI] [PMC free article] [PubMed] [Google Scholar]
- Brozyna AA, Jozwicki W, Slominski AT. Decreased VDR expression in cutaneous melanomas as marker of tumor progression: new data and analyses. Anticancer Res 2014;34(6):2735–43. [PMC free article] [PubMed] [Google Scholar]
- Burns EM, Elmets CA, Yusuf N. Vitamin D and skin cancer. Photochem Photobiol 2015;91(1):201–9. [DOI] [PMC free article] [PubMed] [Google Scholar]
- Chai AW, Cheung AK, Dai W, Ko JM, Ip JC, Chan KW, et al. Metastasis-suppressing NID2, an epigenetically-silenced gene, in the pathogenesis of nasopharyngeal carcinoma and esophageal squamous cell carcinoma. Oncotarget 2016;7(48):78859–71. [DOI] [PMC free article] [PubMed] [Google Scholar]
- Chen JT, Cheng YW, Chou MC, Sen-Lin T, Lai WW, Ho WL, et al. The correlation between aberrant connexin 43 mRNA expression induced by promoter methylation and nodal micrometastasis in non-small cell lung cancer. Clin Cancer Res 2003;9(11):4200–4. [PubMed] [Google Scholar]
- Cirenajwis H, Ekedahl H, Lauss M, Harbst K, Carneiro A, Enoksson J, et al. Molecular stratification of metastatic melanoma using gene expression profiling: Prediction of survival outcome and benefit from molecular targeted therapy. Oncotarget 2015;6(14):12297–309. [DOI] [PMC free article] [PubMed] [Google Scholar]
- Clark WH Jr., Elder DE, Guerry Dt, Braitman LE, Trock BJ, Schultz D, et al. Model predicting survival in stage I melanoma based on tumor progression. J Natl Cancer Inst 1989;81(24):1893–904. [DOI] [PubMed] [Google Scholar]
- Clarkson DB, Fan T, Joe H. A Remark on Algorithm 643: FEXACT: An Algorithm for Performing Fisher’s Exact Test in r x c Contingency Tables. ACM Transactions on Mathematical Software 1993;19:484–8. [Google Scholar]
- Conway K, Edmiston SN, Parker JS, Kuan PF, Tsai YH, Groben PA, et al. Identification of a Robust Methylation Classifier for Cutaneous Melanoma Diagnosis. J Invest Dermatol 2019;139(6):1349–61. [DOI] [PMC free article] [PubMed] [Google Scholar]
- Davar D, Kirkwood JM. Adjuvant Therapy of Melanoma. Cancer Treat Res 2016;167:181–208. [DOI] [PMC free article] [PubMed] [Google Scholar]
- de Giorgi V, Mavilia C, Massi D, Gozzini A, Aragona P, Tanini A, et al. Estrogen receptor expression in cutaneous melanoma: a real-time reverse transcriptase-polymerase chain reaction and immunohistochemical study. Arch Dermatol 2009;145(1):30–6. [DOI] [PubMed] [Google Scholar]
- de Unamuno Bustos B, Murria Estal R, Perez Simo G, Simarro Farinos J, Pujol Marco C, Navarro Mira M, et al. Aberrant DNA methylation is associated with aggressive clinicopathological features and poor survival in cutaneous melanoma. Br J Dermatol 2018;179(2):394–404. [DOI] [PubMed] [Google Scholar]
- Devitt B, Liu W, Salemi R, Wolfe R, Kelly J, Tzen CY, et al. Clinical outcome and pathological features associated with NRAS mutation in cutaneous melanoma. Pigment Cell Melanoma Res 2011;24(4):666–72. [DOI] [PubMed] [Google Scholar]
- Du J, Widlund HR, Horstmann MA, Ramaswamy S, Ross K, Huber WE, et al. Critical role of CDK2 for melanoma growth linked to its melanocyte-specific transcriptional regulation by MITF. Cancer Cell 2004;6(6):565–76. [DOI] [PubMed] [Google Scholar]
- Easwaran H, Johnstone SE, Van Neste L, Ohm J, Mosbruger T, Wang Q, et al. A DNA hypermethylation module for the stem/progenitor cell signature of cancer. Genome Res 2012;22(5):837–49. [DOI] [PMC free article] [PubMed] [Google Scholar]
- Ekstrom EJ, Sherwood V, Andersson T. Methylation and loss of Secreted Frizzled-Related Protein 3 enhances melanoma cell migration and invasion. PLoS One 2011;6(4):e18674. [DOI] [PMC free article] [PubMed] [Google Scholar]
- Fang F, Turcan S, Rimner A, Kaufman A, Giri D, Morris LG, et al. Breast cancer methylomes establish an epigenomic foundation for metastasis. Sci Transl Med 2011;3(75):75ra25. [DOI] [PMC free article] [PubMed] [Google Scholar]
- Gerami P, Cook RW, Wilkinson J, Russell MC, Dhillon N, Amaria RN, et al. Development of a prognostic genetic signature to predict the metastatic risk associated with cutaneous melanoma. Clin Cancer Res 2015;21(1):175–83. [DOI] [PubMed] [Google Scholar]
- Gershenwald JE, Scolyer RA, Hess KR, Sondak VK, Long GV, Ross MI, et al. Melanoma staging: Evidence-based changes in the American Joint Committee on Cancer eighth edition cancer staging manual. CA Cancer J Clin 2017;67(6):472–92. [DOI] [PMC free article] [PubMed] [Google Scholar]
- Gong F, Guo Y, Niu Y, Jin J, Zhang X, Shi X, et al. Epigenetic silencing of TET2 and TET3 induces an EMT-like process in melanoma. Oncotarget 2017;8(1):315–28. [DOI] [PMC free article] [PubMed] [Google Scholar]
- Guo X, Xu Y, Zhao Z. In-depth genomic data analyses revealed complex transcriptional and epigenetic dysregulations of BRAFV600E in melanoma. Mol Cancer 2015;14:60. [DOI] [PMC free article] [PubMed] [Google Scholar]
- Haffner MC, Esopi DM, Chaux A, Gurel M, Ghosh S, Vaghasia AM, et al. AIM1 is an actin-binding protein that suppresses cell migration and micrometastatic dissemination. Nat Commun 2017;8(1):142. [DOI] [PMC free article] [PubMed] [Google Scholar]
- Hand DJ, Till RJ. Simple Generalisation of the Area Under the ROC Curve for Multiple Class Classification Problems Machine Learning 2001;45(2):171–86. [Google Scholar]
- Hodi FS, O’Day SJ, McDermott DF, Weber RW, Sosman JA, Haanen JB, et al. Improved survival with ipilimumab in patients with metastatic melanoma. N Engl J Med 2010;363(8):711–23. [DOI] [PMC free article] [PubMed] [Google Scholar]
- Hoshimoto S, Kuo CT, Chong KK, Takeshima TL, Takei Y, Li MW, et al. AIM1 and LINE-1 epigenetic aberrations in tumor and serum relate to melanoma progression and disease outcome. J Invest Dermatol 2012;132(6):1689–97. [DOI] [PMC free article] [PubMed] [Google Scholar]
- Hughes LA, Melotte V, de Schrijver J, de Maat M, Smit VT, Bovee JV, et al. The CpG island methylator phenotype: what’s in a name? Cancer Res 2013;73(19):5858–68. [DOI] [PubMed] [Google Scholar]
- Hwang S, Kim HE, Min M, Raghunathan R, Panova IP, Munshi R, et al. Epigenetic Silencing of SPINT2 Promotes Cancer Cell Motility via HGF-MET Pathway Activation in Melanoma. J Invest Dermatol 2015;135(9):2283–91. [DOI] [PMC free article] [PubMed] [Google Scholar]
- Jonsson G, Busch C, Knappskog S, Geisler J, Miletic H, Ringner M, et al. Gene expression profiling-based identification of molecular subtypes in stage IV melanomas with different clinical outcome. Clin Cancer Res 2010;16(13):3356–67. [DOI] [PubMed] [Google Scholar]
- Juo YY, Johnston FM, Zhang DY, Juo HH, Wang H, Pappou EP, et al. Prognostic value of CpG island methylator phenotype among colorectal cancer patients: a systematic review and meta-analysis. Ann Oncol 2014;25(12):2314–27. [DOI] [PMC free article] [PubMed] [Google Scholar]
- Koga Y, Pelizzola M, Cheng E, Krauthammer M, Sznol M, Ariyan S, et al. Genome-wide screen of promoter methylation identifies novel markers in melanoma. Genome Res 2009;19(8):1462–70. [DOI] [PMC free article] [PubMed] [Google Scholar]
- Koroknai V, Szasz I, Hernandez-Vargas H, Fernandez-Jimenez N, Cuenin C, Herceg Z, et al. DNA hypermethylation is associated with invasive phenotype of malignant melanoma. Exp Dermatol 2019. [DOI] [PubMed] [Google Scholar]
- Lahtz C, Stranzenbach R, Fiedler E, Helmbold P, Dammann RH. Methylation of PTEN as a prognostic factor in malignant melanoma of the skin. J Invest Dermatol 2010;130(2):620–2. [DOI] [PubMed] [Google Scholar]
- Lauss M, Haq R, Cirenajwis H, Phung B, Harbst K, Staaf J, et al. Genome-Wide DNA Methylation Analysis in Melanoma Reveals the Importance of CpG Methylation in MITF Regulation. J Invest Dermatol 2015a;135(7):1820–8. [DOI] [PMC free article] [PubMed] [Google Scholar]
- Lauss M, Nsengimana J, Staaf J, Newton-Bishop J, Jonsson G. Consensus of Melanoma Gene Expression Subtypes Converges on Biological Entities. J Invest Dermatol 2016;136(12):2502–5. [DOI] [PubMed] [Google Scholar]
- Lauss M, Ringner M, Karlsson A, Harbst K, Busch C, Geisler J, et al. DNA methylation subgroups in melanoma are associated with proliferative and immunological processes. BMC Med Genomics 2015b;8:73. [DOI] [PMC free article] [PubMed] [Google Scholar]
- Linos E, Swetter SM, Cockburn MG, Colditz GA, Clarke CA. Increasing burden of melanoma in the United States. J Invest Dermatol 2009;129(7):1666–74. [DOI] [PMC free article] [PubMed] [Google Scholar]
- Liu J, Lichtenberg T, Hoadley KA, Poisson LM, Lazar AJ, Cherniack AD, et al. An Integrated TCGA Pan-Cancer Clinical Data Resource to Drive High-Quality Survival Outcome Analytics. Cell 2018;173(2):400–16 e11. [DOI] [PMC free article] [PubMed] [Google Scholar]
- Losman JA, Kaelin WG Jr. What a difference a hydroxyl makes: mutant IDH, (R)-2-hydroxyglutarate, and cancer. Genes Dev 2013;27(8):836–52. [DOI] [PMC free article] [PubMed] [Google Scholar]
- Madore J, Strbenac D, Vilain R, Menzies AM, Yang JY, Thompson JF, et al. PD-L1 Negative Status is Associated with Lower Mutation Burden, Differential Expression of Immune-Related Genes, and Worse Survival in Stage III Melanoma. Clin Cancer Res 2016;22(15):3915–23. [DOI] [PubMed] [Google Scholar]
- Mehta CM, Patel NR. Algorithm 643 Rexact: A Fortran Subroutine for Fisher’s Axact Test on Unordered r x c Contingency Tables. ACM Transactions on Mathematical Software 1986;12(2):154–61. [Google Scholar]
- Mehta CR, Patel NR. A network algorithm for performing Fisher’s exact test in r x c contingency tables. J Am Statistical Assoc 1983;78:427–34. [Google Scholar]
- Micevic G, Thakral D, McGeary M, Bosenberg MW. PD-L1 methylation regulates PD-L1 expression and is associated with melanoma survival. Pigment Cell Melanoma Res 2019;32(3):435–40. [DOI] [PMC free article] [PubMed] [Google Scholar]
- Micevic G, Theodosakis N, Bosenberg M. Aberrant DNA methylation in melanoma: biomarker and therapeutic opportunities. Clin Epigenetics 2017;9:34. [DOI] [PMC free article] [PubMed] [Google Scholar]
- Morris TJ, Butcher LM, Feber A, Teschendorff AE, Chakravarthy AR, Wojdacz TK, et al. ChAMP: 450k Chip Analysis Methylation Pipeline. Bioinformatics 2014;30(3):428–30. [DOI] [PMC free article] [PubMed] [Google Scholar]
- Muralidhar S, Filia A, Nsengimana J, Pozniak J, O’Shea SJ, Diaz JM, et al. Vitamin D-VDR Signaling Inhibits Wnt/beta-Catenin-Mediated Melanoma Progression and Promotes Antitumor Immunity. Cancer Res 2019;79(23):5986–98. [DOI] [PubMed] [Google Scholar]
- Newton-Bishop JA, Beswick S, Randerson-Moor J, Chang YM, Affleck P, Elliott F, et al. Serum 25-hydroxyvitamin D3 levels are associated with breslow thickness at presentation and survival from melanoma. J Clin Oncol 2009;27(32):5439–44. [DOI] [PMC free article] [PubMed] [Google Scholar]
- Newton-Bishop JA, Davies JR, Latheef F, Randerson-Moor J, Chan M, Gascoyne J, et al. 25-Hydroxyvitamin D2 /D3 levels and factors associated with systemic inflammation and melanoma survival in the Leeds Melanoma Cohort. Int J Cancer 2015;136(12):2890–9. [DOI] [PMC free article] [PubMed] [Google Scholar]
- Noushmehr H, Weisenberger DJ, Diefes K, Phillips HS, Pujara K, Berman BP, et al. Identification of a CpG island methylator phenotype that defines a distinct subgroup of glioma. Cancer Cell 2010;17(5):510–22. [DOI] [PMC free article] [PubMed] [Google Scholar]
- Nsengimana J, Laye J, Filia A, O’Shea S, Muralidhar S, Pozniak J, et al. beta-Catenin-mediated immune evasion pathway frequently operates in primary cutaneous melanomas. J Clin Invest 2018;128(5):2048–63. [DOI] [PMC free article] [PubMed] [Google Scholar]
- Nsengimana J, Laye J, Filia A, Walker C, Jewell R, Van den Oord JJ, et al. Independent replication of a melanoma subtype gene signature and evaluation of its prognostic value and biological correlates in a population cohort. Oncotarget 2015;6(13):11683–93. [DOI] [PMC free article] [PubMed] [Google Scholar]
- Ohira T, Kojima H, Kuroda Y, Aoki S, Inaoka D, Osaki M, et al. PITX1 protein interacts with ZCCHC10 to regulate hTERT mRNA transcription. PLoS One 2019;14(8):e0217605. [DOI] [PMC free article] [PubMed] [Google Scholar]
- Peng W, Chen JQ, Liu C, Malu S, Creasy C, Tetzlaff MT, et al. Loss of PTEN Promotes Resistance to T Cell-Mediated Immunotherapy. Cancer Discov 2016;6(2):202–16. [DOI] [PMC free article] [PubMed] [Google Scholar]
- Plass C Cancer epigenomics. Hum Mol Genet 2002;11(20):2479–88. [DOI] [PubMed] [Google Scholar]
- Pozniak J, Nsengimana J, Laye JP, O’Shea SJ, Diaz JMS, Droop AP, et al. Genetic and Environmental Determinants of Immune Response to Cutaneous Melanoma. Cancer Res 2019;79(10):2684–96. [DOI] [PMC free article] [PubMed] [Google Scholar]
- Reitman ZJ, Yan H. Isocitrate dehydrogenase 1 and 2 mutations in cancer: alterations at a crossroads of cellular metabolism. J Natl Cancer Inst 2010;102(13):932–41. [DOI] [PMC free article] [PubMed] [Google Scholar]
- Ren X, Kuan PF. methylGSA: a Bioconductor package and Shiny app for DNA methylation data length bias adjustment in gene set testing. Bioinformatics 2019;35(11):1958–9. [DOI] [PubMed] [Google Scholar]
- Roh MR, Gupta S, Park KH, Chung KY, Lauss M, Flaherty KT, et al. Promoter Methylation of PTEN Is a Significant Prognostic Factor in Melanoma Survival. J Invest Dermatol 2016;136(5):1002–11. [DOI] [PubMed] [Google Scholar]
- Segura MF, Belitskaya-Levy I, Rose AE, Zakrzewski J, Gaziel A, Hanniford D, et al. Melanoma MicroRNA signature predicts post-recurrence survival. Clin Cancer Res 2010;16(5):1577–86. [DOI] [PMC free article] [PubMed] [Google Scholar]
- Sigalotti L, Covre A, Fratta E, Parisi G, Sonego P, Colizzi F, et al. Whole genome methylation profiles as independent markers of survival in stage IIIC melanoma patients. J Transl Med 2012;10:185. [DOI] [PMC free article] [PubMed] [Google Scholar]
- Spyropoulos C, Melachrinou M, Vasilakos P, Tzorakoleftherakis E. Expression of estrogen receptors in melanoma and sentinel lymph nodes; a “female” clinical entity or a possible treatment modality? Eur J Gynaecol Oncol 2015;36(2):123–30. [PubMed] [Google Scholar]
- Tanemura A, Terando AM, Sim MS, van Hoesel AQ, de Maat MF, Morton DL, et al. CpG island methylator phenotype predicts progression of malignant melanoma. Clin Cancer Res 2009;15(5):1801–7. [DOI] [PMC free article] [PubMed] [Google Scholar]
- TCGA N Genomic Classification of Cutaneous Melanoma. Cell 2015;161(7):1681–96. [DOI] [PMC free article] [PubMed] [Google Scholar]
- Teschendorff AE, Marabita F, Lechner M, Bartlett T, Tegner J, Gomez-Cabrero D, et al. A beta-mixture quantile normalization method for correcting probe design bias in Illumina Infinium 450 k DNA methylation data. Bioinformatics 2013;29(2):189–96. [DOI] [PMC free article] [PubMed] [Google Scholar]
- Teschendorff AE, Menon U, Gentry-Maharaj A, Ramus SJ, Weisenberger DJ, Shen H, et al. Age-dependent DNA methylation of genes that are suppressed in stem cells is a hallmark of cancer. Genome Res 2010;20(4):440–6. [DOI] [PMC free article] [PubMed] [Google Scholar]
- Thomas NE, Alexander A, Edmiston SN, Parrish E, Millikan RC, Berwick M, et al. Tandem BRAF mutations in primary invasive melanomas. J Invest Dermatol 2004;122(5):1245–50. [DOI] [PubMed] [Google Scholar]
- Thomas NE, Busam KJ, From L, Kricker A, Armstrong BK, Anton-Culver H, et al. Tumor-infiltrating lymphocyte grade in primary melanomas is independently associated with melanoma-specific survival in the population-based genes, environment and melanoma study. J Clin Oncol 2013;31(33):4252–9. [DOI] [PMC free article] [PubMed] [Google Scholar]
- Thomas NE, Edmiston SN, Alexander A, Groben PA, Parrish E, Kricker A, et al. Association Between NRAS and BRAF Mutational Status and Melanoma-Specific Survival Among Patients With Higher-Risk Primary Melanoma. JAMA Oncol 2015;1(3):359–68. [DOI] [PMC free article] [PubMed] [Google Scholar]
- Tiffen J, Wilson S, Gallagher SJ, Hersey P, Filipp FV. Somatic Copy Number Amplification and Hyperactivating Somatic Mutations of EZH2 Correlate With DNA Methylation and Drive Epigenetic Silencing of Genes Involved in Tumor Suppression and Immune Responses in Melanoma. Neoplasia 2016;18(2):121–32. [DOI] [PMC free article] [PubMed] [Google Scholar]
- Tittarelli A, Guerrero I, Tempio F, Gleisner MA, Avalos I, Sabanegh S, et al. Overexpression of connexin 43 reduces melanoma proliferative and metastatic capacity. Br J Cancer 2015;113(2):259–67. [DOI] [PMC free article] [PubMed] [Google Scholar]
- Ulazzi L, Sabbioni S, Miotto E, Veronese A, Angusti A, Gafa R, et al. Nidogen 1 and 2 gene promoters are aberrantly methylated in human gastrointestinal cancer. Mol Cancer 2007;6:17. [DOI] [PMC free article] [PubMed] [Google Scholar]
- Vachtenheim J, Ondrusova L. Microphthalmia-associated transcription factor expression levels in melanoma cells contribute to cell invasion and proliferation. Exp Dermatol 2015;24(7):481–4. [DOI] [PubMed] [Google Scholar]
- Wang J, Zhao Y, Xu H, Ma J, Liang F, Zou Q, et al. Silencing NID2 by DNA Hypermethylation Promotes Lung Cancer. Pathol Oncol Res 2020;26(2):801–11. [DOI] [PubMed] [Google Scholar]
- Widschwendter M, Fiegl H, Egle D, Mueller-Holzner E, Spizzo G, Marth C, et al. Epigenetic stem cell signature in cancer. Nat Genet 2007;39(2):157–8. [DOI] [PubMed] [Google Scholar]
- Wilkerson MD, Hayes DN. ConsensusClusterPlus: a class discovery tool with confidence assessments and item tracking. Bioinformatics 2010;26(12):1572–3. [DOI] [PMC free article] [PubMed] [Google Scholar]
- Wouters J, Vizoso M, Martinez-Cardus A, Carmona FJ, Govaere O, Laguna T, et al. Comprehensive DNA methylation study identifies novel progression-related and prognostic markers for cutaneous melanoma. Bmc Med 2017;15(1):101. [DOI] [PMC free article] [PubMed] [Google Scholar]
- Xue Q, Lin Z, Cheng YH, Huang CC, Marsh E, Yin P, et al. Promoter methylation regulates estrogen receptor 2 in human endometrium and endometriosis. Biol Reprod 2007;77(4):681–7. [DOI] [PubMed] [Google Scholar]
Associated Data
This section collects any data citations, data availability statements, or supplementary materials included in this article.
Supplementary Materials
Data Availability Statement
The methylation dataset related to this article can be found at Gene Expression Omnibus (ncbi.nlm.nih.gov/geo) under accession number GSE120878.