Abstract
Nitrosomonas europaea and Nitrobacter winogradskyi (strain “Engel”) were grown in ammonia-limited and nitrite-limited conditions, respectively, in a retentostat with complete biomass retention at 25°C and pH 8. Fitting the retentostat biomass and oxygen consumption data of N. europaea and N. winogradskyi to the linear equation for substrate utilization resulted in up to eight-times-lower maintenance requirements compared to the maintenance energy demand (m) calculated from chemostat experiments. Independent of the growth rate at different stages of such a retention culture, the maximum specific oxygen consumption rate measured by mass spectrometric analysis of inlet and outlet gas oxygen content always amounted to approximately 45 μmol of O2 mg−1 of biomass-C · h−1 for both N. europaea and N. winogradskyi. When bacteria were starved for different time periods (up to 3 months), the spontaneous respiratory activity after an ammonia or nitrite pulse decreased with increasing duration of the previous starvation time period, but the observed decrease was many times faster for N. winogradskyi than for N. europaea. Likewise, the velocity of resuscitation decreased with extended time periods of starvation. The increase in oxygen consumption rates during resuscitation referred to the reviving population only, since in parallel no significant increase in the cell concentrations was detectable. N. europaea more readily recovers from starvation than N. winogradskyi, explaining the occasionally observed nitrite accumulation in the environment after ammonia becomes available. From chloramphenicol (100 μg · ml−1) inhibition experiments with N. winogradskyi, it has been concluded that energy-starved cells must have a lower protein turnover rate than nonstarved cells. As pointed out by Stein and Arp (L. Y. Stein and D. J. Arp, Appl. Environ. Microbiol. 64:1514–1521, 1998), nitrifying bacteria in soil have to cope with extremely low nutrient concentrations. Therefore, a chemostat is probably not a suitable tool for studying their physiological properties during a long-lasting nutrient shortage. In comparison with chemostats, retentostats offer a more realistic approach with respect to substrate provision and availability.
Bacteria in natural habitats are faced with fluctuating nutrient availabilities with a temporary excess supply followed by various periods of nutrient deficiency (21, 35). Under these conditions, a successful life strategy depends not only on the fast and effective uptake and conversion of nutrients, as measured and described in terms of μmax and μmax/Ks (18, 28), but also on an appropriate starvation survival strategy. In nonsporulating bacteria, this strategy should include a maintenance energy demand that is as low as possible while remaining ready for a fast response to nutrient upshifts.
In the life and survival strategies of nitrifying bacteria, well-balanced activities between ammonia oxidizers and nitrite oxidizers are crucial for the complete conversion of ammonia to nitrate. Incomplete nitrification occurs in activated sludge plants (26), wastewater reservoirs (2), and water distribution systems (13), and it is mainly caused by reduced or missing activity of nitrite-oxidizing bacteria such as Nitrobacter spp. (4). This may be due to inhibitory effects, low affinity to oxygen (19), or tardy starvation recovery of Nitrobacter spp. after nitrite upshifts following prolonged periods of starvation. Knowledge concerning starvation survival in autotrophic nitrifying bacteria is scarce, and studies were almost exclusively done with cells from batch cultures (see, for example, reference 30) in biofilms (see, for example, reference 5) and soil columns (40). As pointed out by Mason and Egli (20), the nature of the transition period from feast to famine may greatly influence the long-term survival and, in natural environments, one would expect to see a gradual transition from the exponential to the stationary phase rather than a sudden change. This gradual transition could be obtained for suspended cultures by decreasing dilution rate stepwise in continuous cultures (chemostats). However, extremely low dilution rates in chemostats (≪0.05 h−1) give rise to inhomogeneities due to mixing problems and low steady-state biomass concentrations (9). This problem can be overcome by using bioreactors combined with filtration devices to retain the biomass (retentostats or recyclostats) (11, 36). Such retention culture systems have also been successfully applied in studies of different physiological properties of microorganisms associated with slow growth, e.g., stringent response in Escherichia coli, Bacillus spp., and Paracoccus denitrificans (1, 9, 11, 15, 38); growth and product formation characteristics in Aspergillus niger at different growth rates (27, 39); or the maintenance energy demand of different prokaryotes, including Nitrosomonas spp. (6, 31, 32). In heterotrophic prokaryotes two (or three) growth domains could be distinguished during growth in retentostats (11, 38). The first growth domain could be described with a Pirt-type equation, and growth characteristics were similar to those found in continuous cultures; the second domain can be characterized by the onset of the stringent response, while growth seemed to be linear, resulting in a low yield and extremely low maintenance requirement values. The first objective of the present work was to show that, in accordance with an appropriate starvation-survival strategy, the maintenance energy demand of nitrifying bacteria is lower in nutrient-poor conditions compared to well-nourished cultures. A second objective of this study was to show that there is a difference in the time course of recovery between ammonia oxidizers and nitrite oxidizers after starvation as a possible explanation for the transient nitrite build-up in ecosystems. We used the retentostat culture system for the reasons given above and to have enough biomass for an in situ determination of oxygen consumption rates, thus avoiding contaminations and disturbances of the culture due to sampling.
MATERIALS AND METHODS
Organism, medium, and cultivation system.
Nitrobacter winogradskyi (strain “Engel”; obtained from H.-P. Koops, University of Hamburg) was grown in a completely mixed bioreactor (920 ml) with external biomass retention mediated by a stirred microfiltration cell (volume, 110 ml; polyvinylidene difluoride filter, 0.22-μm pore size; Millipore) in a bypass of the reactor. The culture suspension was pumped with a high flow rate through the microfiltration cell, causing a mean residence time of only 30 s for the bacteria within the filtration unit. Therefore, both units were considered a one-stage bioreactor with respect to the process kinetics. The whole system was set up by the mechanics workshop of the Institute of Biotechnology at Forschungszentrum Jülich GmbH.
The technical features of the filtration unit were in accordance with the features described elsewhere (32). The only difference was a reduced volume and the renunciation of two baffles. A conductivity contact positioned below the lid of the fermentor triggered a peristaltic pump that removed the filtrate at a rate equivalent to the substrate provision rate. The substrate provision rate was 1.42 mmol of NaNO2 · h−1 at a hydraulic retention time of 0.1 h−1 and 7.1 mmol of NaNO2 · h−1 for the same retention time during the starvation and reactivation experiments in order to achieve higher respiration rates for the mass spectrometric oxygen uptake determinations. The whole system was darkened to prevent photoinhibition, and the bioreactor was kept at 25°C by means of a temperature-regulated water jacket. Inlet and outlet gas tubings were made from stainless steel, and the other tubings consisted of silicone and polytetrafluoroethylene. An aeration rate of 10 liters of compressed air per h kept the dissolved oxygen (DO) (measured by a DO Probe; Ingold) at between 70 and 100% saturation and was sufficiently high for the mass spectrometer. The continuous addition of CO2 (5% [vol/vol]) in the inlet gas ensured a pH of 8.0 in the fermentor. The fermentor setup for Nitrosomonas europaea was as described previously (27); however, instead of a recycling finger, a ceramic bottom plate (0.2 μm) was used. The setup was very similar to the FZ-Jülich bioreactor. The culture volume was about 0.5 liter; ammonium concentration in the medium was 5 mM; and the hydraulic retention time (D) was ca. 0.11 h−1, resulting in substrate provision rates of about 0.3 mmol of ammonium h−1. The pH was kept at 8.0 by adding 5% (wt/vol) Na2CO3.
The inorganic medium contained NaNO2 or (NH4)2SO4 as indicated in the Results section and also (per liter) 80 mg of KCl, 50 mg of MgSO4 · 7H2O, 100 mg of CaCl2 · 2H2O, 100 mg of Na2HPO4 · 12H2O, 1,130 mg of NaHCO3, 0.71 mg of FeCl2 · 4H2O, 1.35 mg of Na2EDTA · 2H2O, and 1 ml of trace element solution as described by Tappe et al. (32). Na2HPO4 and NaHCO3 solutions were autoclaved separately and added after cooling. All retentostat cultures were regularly (weekly) checked for heterotrophic contaminations by incubating samples in tryptic soy broth and also by plating them on 10% nutrient broth agar plates. Turbidity or CFU values after 1 or 2 weeks of incubation, respectively, were assessed as heterotrophic contaminations. Results derived from contaminated runs as well as from runs with bacteria attached to the reactor walls were not taken into consideration.
BioCord (TBR Corp., Ltd.), a nylon cord with woven nylon attached to it, was used for immobilizing the bacteria. This BioCord has been successfully used as a bioscreen in rivers and wastewater treatment plants in Japan.
Analytical procedures.
Oxygen consumption kinetics were measured with a mass spectrometer (MM8-80F; VG Gas Analysis Systems). During continuous operation, the outlet gas passed through a 250-ml water-cooled condensing flask before it entered the mass spectrometer. When nitrite pulses were supplied during short-term shift-up experiments, the outlet was switched to a stainless steel tubing leading directly to the spectrometer to obtain a faster time-dependent signal resolution.
Dry weight was determined as described by Bulthuis et al. (10). Cell numbers and cell sizes were regularly determined with a Coulter Counter (Type Multisizer II, 20-μm orifice) and, in order to avoid large sampling volumes for dry-weight determinations, the biomass was largely calculated from the biovolume (mean cell size multiplied by the cell concentration) and from the relation between particulate organic carbon, the biovolume, and the dry weight. The particulate organic carbon content was measured with a Total Organic Carbon Analyzer (Dohrmann DC-190) as the difference between untreated and the 0.2-μm-filtered sample.
NO2− and NO3− were checked with Merckoquant test strips (Merck GmbH) and analyzed with an Autoanalyzer (Cenco B.V.). Starvation conditions were achieved simply by stopping the medium flow and filtrate removal pump while the stirrer and the aeration were kept running. Nitrite or ammonium pulses were added with a sterile syringe directly into the reactor via the sample port. The inlet of the sample port ended up next to the stirrer to ensure fast and thorough mixing.
Equations describing biomass production and oxygen consumption in the retentostat.
The full derivation of the equations is given by van Verseveld et al. (38). The basis of the model is formed by the carbon and energy balance for growth and product formation: CHmOl (substrate) + aNH3 + bO2 → yc CHpOnNg (biomass) + zCHrOsNt (product) + cH2O + dCO2. The subscripts stand for fractional or whole numbers, depending on the ratio of H, O, and N to one C atom in the respective molecules. For example, if glucose were the substrate, the subscripts “m” and “l” became “2” and “1.” Then:
 |
1 |
in which rs is the substrate provision rate (in moles per hour), ms is the maintenance requirement (in moles of substrate per gram [dry weight] of biomass per hour), xt is biomass present at time t (in grams [dry weight]), rx is the rate of biomass formation (in grams [dry weight] of biomass per hour), and Yxsm the growth yield corrected for the maintenance requirements (in grams [dry weight] of biomass per mole of substrate). Rearrangement leads to rx = (rs − msxt)Yxsm, and integration yields equation 2, when rs is a constant, as is the case in a retentostat:
 |
2 |
in which x0 is the biomass concentration at time zero.
Equation 3 shows the rate of oxygen consumption (rO2 [in moles of O2 per hour]), when no product is formed, and is obtained from the energy balance (b = 0.25[γs − ycγx]), yc = Yxs/Mx, (Yxs/Mx)/rs = rx/Mx, and rO2 = brsc, in which c is the amount of carbon atoms in the substrate.
 |
3 |
in which γs and γx are, respectively, the degree of reduction of substrate (for nitrifiers taken as NH3CO2 and HNO2CO2, as a combination between the energy source and CO2 and thus, respectively, as 6 and 2) and the degree of reduction of biomass (all on the C1 base). Mx is the molecular weight of 1 C1-mol of biomass. Data of retention experiments can be fitted nonlinearly by using equations 2 and 3 as explained below.
Data analysis.
As described in van Verseveld et al. (38), a computer program was developed that optimizes the best-fitting curves by means of nonlinear least-squares analysis. The program (PFIT) searches for optimal values for the variable parameters in the given functions by minimizing the sum of squared differences between experimental and predicted points divided by the number of data points (i.e., the SS value). Data were normalized because of the different orders of magnitude among the variables.
RESULTS AND DISCUSSION
Yxsm and ms of N. europaea and N. winogradskyi in retentostat culture.
N. europaea was batch grown in a mineral medium containing 5 mM (NH4)2SO4 and, after the consumption of all ammonia, was switched to retentostat mode.
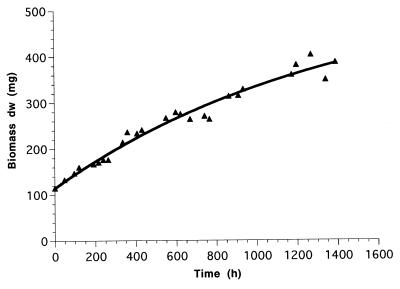
The substrate provision rate (rs) was 0.299 mmol of NH4+ h−1. Figure 1 shows the steady increase in biomass even after 1,600 h in the retentostat mode. Neither different modes of growth (12, 22, 34, 37) nor a linear increase of biomass or zero growth (as described by Panikov [24] for Pseudomonas and Bacillus spp., respectively) was indicated. The mean cell volume of batch-grown N. europaea reached 0.7 μm3 and was reduced only to 0.5 μm3 when batch-grown cells were subsequently starved for 7 weeks. In contrast, the retentostat-grown cells were reduced to a mean cell volume of 0.22 μm3 (data not shown) but were still bigger than dwarf cells, which are defined by Bakken (3) as cells with volumes of <0.07 μm3. This finding probably reflects the impact of the culture’s “history” on its actual physiological state (see reference 20). The oxygen consumption was measured continuously, and the consumption rate of 0.44 mmol O2 · h−1 at an rs of 0.299 mmol of NH4+ h−1 reflects the demand of 1.5 mol of O2 per mol of NH4+ oxidized to NO2−.
FIG. 1.
Biomass concentration in milligrams (dry weight) of N. europaea in continuous culture with 100% biomass retention (rs = 0.299 mmol of NH4+ h−1). Data show the increase of biomass after reaching 100 mg in the retentostat mode. The solid line represents the best fit for Xt, a value obtained by using the equations 2 and 3 as described in Materials and Methods. The results of one experiment are shown.
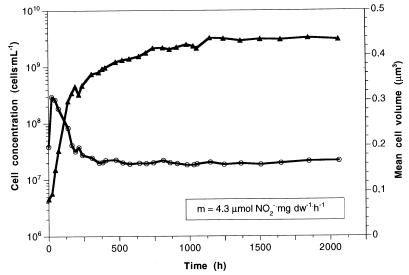
N. winogradskyi was batch grown with 14 mmol of NO2− liter−1 and switched to retentostat mode after all of the nitrite was consumed. Figure 2 shows the longest-lasting retentostat run (over 2,000 h) of three runs as an example of apparently reaching zero growth. The biomass concentration ended up at 332 mg (dry weight) liter−1. As seen in Fig. 2 and as mentioned for N. europaea above, mean cell volumes reached a maximum of about 0.3 μm3 initially and decreased slowly to a minimum value (0.17 μm3) with decreasing growth rate. For Nitrobacter, the measured O2 consumption was also consistent with the stoichiometric demand of 0.5 mol of O2 per mol of NO2− oxidized to NO3− (data not shown). Since the substrate provision rate was kept constant at 1.42 mmol of NaNO2 · h−1 (rs) during the whole run, the maintenance energy demand, if “zero growth” is assumed, can be calculated by the ratio of rs to the biomass (dry weight). This ratio was 4.3 mmol of nitrite per g (dry weight) per h.
FIG. 2.
Cell concentration in cells per milliliter (triangles) and mean cell volume in cubic micrometers (circles) of N. winogradskyi in continuous culture with 100% biomass retention (rs = 1.42 mmol of NaNO2 h−1). Cells were batch grown during the first 80 h. From 1,100 h onwards, the biomass concentration remained at ca. 332 mg (dry weight) per liter. The ratio of rs to steady-state biomass concentration reflects a maintenance energy demand (m) of 4.3 μmol of NO2− per mg (dry weight) per hour. The results of the longest of three similar experiments are shown.
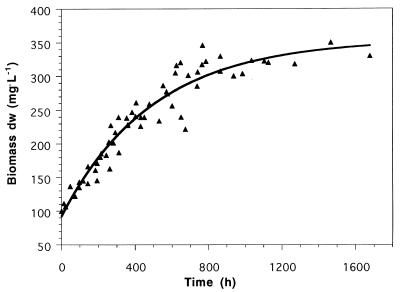
If all three retentostat runs with Nitrobacter were combined, the increase of biomass dry weight (Fig. 3) clearly leads to the conclusion that, as with Nitrosomonas, a true steady-state or zero growth could be approached but was practically not reached.
FIG. 3.
Biomass concentrations in milligrams (dry weight) per liter of three retentostat runs with N. winogradskyi (rs = 1.42 mmol of NaNO2− · h−1 in all runs). The data show the increase in biomass after it reached 100 mg (dry weight) per liter in the retentostat mode. The solid line represents the best fit. The fitted value for m was 2.8 μmol of NO2− per mg (dry weight) per h.
The fitted values of several runs, calculated by using the fit program as described in Materials and Methods, are shown in Table 1. The ms value for Nitrobacter, fitted by nonlinear analysis based on equations 2 and 3 (see Materials and Methods) was 2.84 mmol of nitrite per g (dry weight) per h, a value somewhat lower than the ms obtained simply by dividing rs and the biomass concentration at “zero growth” (4.3 mmol of nitrite per g [dry weight] per h). This result supports the assumption that either the experiments did not last long enough to achieve a real steady state or the extremely slow biomass increase was compensated for by removing small amounts of biomass during sampling.
TABLE 1.
Fitted retentostat data of N. europaea and N. winogradskyi grown under ammonium- and nitrite-limited conditions, respectivelya
| Organism | Retentostat data
|
|||||
|---|---|---|---|---|---|---|
|
Yxsm
|
ms
|
|||||
| Expt 1 | Expt 2 | Avg | Expt 1 | Expt 2 | Avg | |
| N. europaea | 1.33 | 1.09 | 1.21 | 0.56 | 1.27 | 0.92 |
| N. winogradskyi | 0.3 | 0.3 | 0.3 | 4.27 | 2.84 | 3.6 |
Two experiments were carried out independently with each strain, and Yxsm and ms are given as mean (average) values as well as for each run. The Yxsm is the maximum yield corrected for maintenance requirements in grams (dry weight) of biomass per mole of substrate; the ms is the maintenance requirement in millimoles per gram (dry weight) of biomass per hour.
From Table 1 it is also clear that biomass yields of N. europaea are higher than those of N. winogradskyi and, more importantly, that the maintenance requirements of N. winogradskyi are higher than those of N. europaea. Although there are relatively high variations for ms between the duplicates, the mean values for ms for the Nitrosomonas and Nitrobacter spp. are distinctly different, being three to four times higher for the latter organism. The higher Yxsm for Nitrosomonas is consistent with the higher molar energy yield per mole of ammonia oxidized compared to nitrite oxidation.
By comparing chemostat and retentostat data for N. europaea, Tomaschewski (33) showed that at lower growth rates less substrate was needed for maintenance requirements than at relatively higher μ values. For N. winogradskyi, we also determined the maintenance demand from steady-state biomass yields in chemostat cultures at different dilution rates by the method of Pirt (25), and this analysis yielded a three- to fourfold-higher value than in the retentostat cultures (results not shown). Other maintenance measurements (17) estimated values of 30 and 50 mmol g−1 h−1, respectively, for ammonia and nitrite oxidizers; these values were at least 10 times higher than our retentostat values. This result once more confirms that maintenance requirements are not constant but will depend on the actual growth rate, as has been shown for several heterotrophic organisms (1, 10, 11, 31, 36, 38). However, in heterotrophic organisms it has been concluded that the seemingly lower maintenance requirements are due to regulation induced by the stringent response, resulting in an apparently linear time-dependent increase in the biomass.
Homogeneity of “nongrowing” nitrifiers in the retentostat.
When bacteria are growing very slowly, either at low dilution rates in the chemostat or in a retentostat with biomass feedback, it has to be verified whether the whole population contributes to the total substrate uptake or whether one part of the population is dormant while the other part is responsible for all of the activity. Since the determination of viable counts of nitrifiers by most-probable-number techniques or direct plate counts is time-consuming and very inaccurate, the reactivity and homogeneity of the N. winogradskyi population was determined as the change in cell volume distribution after a nitrite upshift. It has been demonstrated for N. europaea (32) and P. fluorescens (42) that the pattern of changes in cell volume distribution after upshifts in energy availability can be used as an indicator for the physiological homogeneity or at least for the homogeneous or inhomogeneous reactivity of a culture. An undistorted shift to larger mean cell volumes (log-normal distribution) after an upshift in energy availability indicates that a culture is homogeneously reactive. In contrast, a bimodal shift in cell volume distribution indicates that a population consists of subpopulations with different reactivities (42).
Cultures of N. winogradskyi or N. europaea which were maintained in the retentostat for several weeks with the continued addition of an energy source, but apparently without net growth, both responded to a substrate pulse with an undistorted, homogeneous shift to larger cell volumes. From these findings, we conclude that the whole population responded actively in this state of approximately no growth, and we never found any indication of the existence of a dormant fraction in the fermentor.
In contrast, when N. winogradskyi was starved in the absence of an external energy source for several weeks, a structured population with respect to cell volume distribution became visible after nitrite was once again supplied. In this case, a bimodal distribution could be interpreted based on a fraction of small nongrowing or slowly growing cells (a dormant fraction?) and a proportion of larger and fast-proliferating cells. The same behavior was shown for N. europaea (ATCC 25196T) cultures when starved for 3 months (33).
Respiratory activity and resuscitation of Nitrosomonas and Nitrobacter after different periods of starvation.
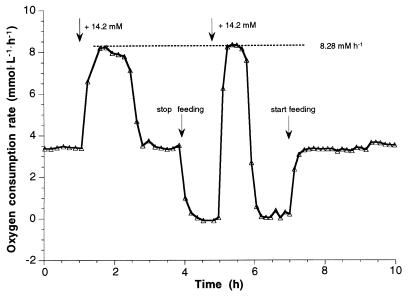
Further experiments with both nitrifiers with the retentostat mode of growth were carried out to establish the maximal activity and reactivity values after starvation. These cultures were used to determine the specific maximum activities of N. europaea and N. winogradskyi at different specific growth rates, as well as the reactivities after different energy starvation time intervals. To monitor oxygen consumption rates and consumption kinetics, ammonium or nitrite pulses were added to the reactor. Because of the impact on the culture during starvation and reactivation experiments, the actual growth rate at the moment of pulse addition could only be estimated roughly (in contrast to the almost undisturbed runs depicted in Fig. 1, 2, and 3). However, independent of the actual growth rate, at any state of the cultivation between μmax and very slow growth in the later stages of the run, the specific maximum oxygen uptake rates amounted to 40 to 46 μmol O2 · mg of biomass-C−1 · h−1 and 43 to 47 μmol O2 · mg of biomass-C−1 · h−1 for N. europaea and N. winogradskyi, respectively. Based on dissolved oxygen measurement, a response of the bacteria to the interrupted medium supply as well as the ammonia or nitrite pulse was detectable within a few seconds. The oxygen concentration in the outlet gas flow detected by the mass spectrometer was, of course, slightly retarded because of the phase transfer of oxygen from water to gas phase and the hysteresis due to mixing conditions within the gas phase above the culture suspension. But the pulsed amount of ammonia or nitrite and the time response of the system was always sufficient to detect the maximum oxidation rate. This result was verified with different concentrations of ammonia or nitrite added to ensure that the amount supplied was not limiting for the respiratory activity. Likewise, the maximum oxygen consumption rate gave the same results whether measured during continuous feeding or during disrupted feeding, provided that the respiratory activity exceeded the oxygen consumption rate necessary to consume the continuously supplied ammonia or nitrite (Fig. 4, data shown for Nitrobacter).
FIG. 4.
Oxygen consumption rate of N. winogradskyi responding to a pulse of 14.2 mM nitrite during continuous and disrupted feeding in a retentostat run with 100% biomass retention. The same specific maximum oxygen consumption rate of 44 μmol O2 · mg of biomass-C−1 · h−1 was reached after the substrate pulse in both cases at a biomass concentration of 188 mg of biomass-C · liter−1.
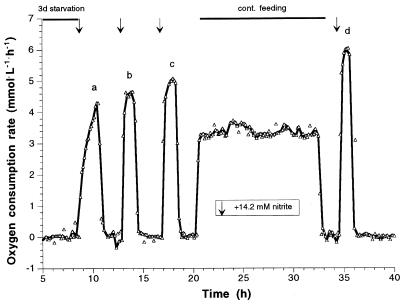
Spontaneous respiratory activity and resuscitation after repeated ammonia or nitrite pulses and continuous feeding were measured after different time periods for N. europaea and N. winogradskyi. N. europaea showed fast resuscitation after 3 days of starvation. After two successive pulses of ammonia, the original activity was established again, while the first pulse yielded ±70% of the activity of the unstarved population (data not shown). When N. winogradskyi was starved for 3 days, the maximum oxygen consumption rate still was 66% of the activity of the unstarved population (Fig. 5). The shape of the first peak (Fig. 5, peak a) clearly indicates that the maximum activity is not attained readily (apart from the hysteresis of the system as mentioned above), as happens in unstarved cells (see Fig. 4). Additional pulses gave rise to an increasing maximum respiratory activity, and it took 14 h of continuous feeding until the original activity was reestablished.
FIG. 5.
Resuscitation of N. winogradskyi after 3 days of nitrite depletion. Definitions: ↓ = nitrite pulses of 14.2 mM; biomass concentration = 137 mg of biomass-C · liter−1; maximum oxygen consumption rates 30 (a), 33 (b), 36 (c), and 44 μmol O2 · mg of biomass-C−1 · h−1. The maximum activity (see Fig. 4) was reestablished at the latest after 12 h of continuous feeding and the fourth pulse.
When N. winogradskyi was starved for 6 days, the response in activity was only 25% compared with the maximum respiratory activity of unstarved cells, but it increased to 80% after a second pulse and continuous feeding for 15 h. For these cells it took more than 3 h to attain the 25% maximum activity compared to unstarved cells during the first nitrite pulse after starvation (data not shown).
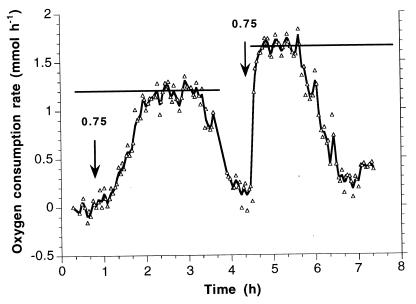
N. europaea started to show a somewhat retarded resuscitation after 17 days of starvation (Fig. 6). After a first pulse of 0.75 mM ammonia, the population reached 50% of the maximal oxygen consumption rate within 1 h, in contrast to N. winogradskyi, which was less active already after 6 days of starvation. After three pulses maximal activity was reached again. Consequently, the resuscitation of Nitrosomonas occurs much more quickly than the resuscitation of Nitrobacter.
FIG. 6.
Resuscitation of N. europaea after 17 days of ammonia depletion. Definitions: ↓ = ammonia pulses of 0.75 mM; biomass concentration = 138 mg of biomass-C · liter−1; maximum oxygen consumption rate of the first pulse = 22 μmol of O2 · mg of biomass-C−1 · h−1.
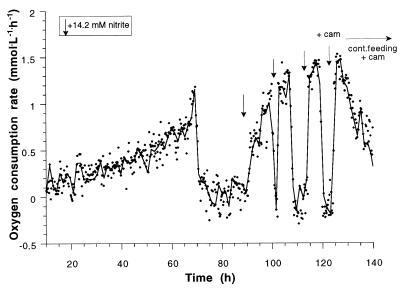
When N. winogradskyi has been starved for 35 days (Fig. 7) and pulsed with nitrite, no spontaneous oxygen consumption was detectable by mass spectrometric measurement of the difference in oxygen concentration of inlet and outlet gas for ca. 5 h. Nevertheless, within a few minutes, the dissolved oxygen concentration dropped to slightly below 100% saturation, indicating a very low level of immediate activity. Subsequently, it took ca. 60 h to oxidize the whole amount of nitrite added; this was accompanied by a steady increase in the oxygen consumption rate. Finally, a consumption rate of 17 μmol of O2 · mg of biomass-C−1 · h−1 (37% activity of unstarved cells) was attained. Another 20 h in the absence of nitrite again caused a drop in activity that was compensated for and even surpassed during the following pulse. Altogether, after four pulses of 14.2 mM nitrite, N. winogradskyi had recovered to 50% activity with respect to the maximum oxygen consumption rate of unstarved cells. In order to inhibit de novo protein synthesis, the next nitrite pulse was added to the fermentor together with chloramphenicol to give a final concentration of 100 μg · ml−1 (this concentration has been found to be sufficient to inhibit the growth of N. winogradskyi in a batch culture). Thereafter, the medium (plus 100 μg of chloramphenicol per ml) was continuously supplied again. After an even slightly higher spontaneous response in oxygen consumption rate compared to the former pulse (without nitrite), a decrease in activity could be seen, and the oxygen consumption rate dropped with 50% within the next 20 h. This suggests that protein synthesis is indispensable for recovering the original activity and further suggests that even the present physiological status cannot be maintained without synthesizing new proteins. Obviously, the protein turnover rate will be higher in the presence of an energy-delivering substrate because the spontaneous maximum oxygen consumption rates after several days of nitrite starvation were always higher than expected from the protein turnover. According to Bock et al. (7), both inactivation of the nitrite oxidoreductase and changes in the fine structure of the cells, especially with respect to the multiple intracellular membranes, take place during starvation. Therefore, resuscitation will be accompanied by similarly complex different rearrangements as well as by the synthesis of new cellular components depending on the duration of the time period of starvation. It is worth mentioning that a significant decrease in cell numbers during starvation was never observed. Even the mean cell volume remained constant during prolonged time periods in absence of nitrite. This finding is also in agreement with other studies (8, 42), and it confirms the challenge to improve the integral analysis of bacterial populations and the need to get more insight into the individual activity distributions to better understand the life strategies of these organisms.
FIG. 7.
Resuscitation of N. winogradskyi after 35 days of nitrite depletion. With the last pulse, the maximum specific activity amounted to 50% of the activity of unstarved cells (Fig. 4). Together with the last pulse, chloramphenicol was added to give a final concentration of 100 μg · ml−1. At the same time, the substrate supply was switched to continuous feeding, also including chloramphenicol at 100 μg · ml−1 to maintain the concentration. (Note that the absolute activity is lower compared to Fig. 4 and 5 due to the removal of biomass for another experiment.)
The findings of a faster resuscitation of Nitrosomonas in pure culture were checked in a mixed-culture experiment with both strains, which were additionally immobilized on BioCord. N. europaea and N. winogradskyi were immobilized on BioCord and kept at 4°C for 3 and 6 months. The recovery experiments confirmed the above-mentioned observations that N. europaea can be resuscitated more easily than can N. winogradskyi. After the BioCord was added to ammonia-containing growth medium at 25°C, nitrite accumulated immediately both on the 3- and 6-month-old samples, thus showing that N. europaea was able to immediately use available ammonia, whereas N. winogradskyi needed time to revive before it could use the accumulated nitrite.
If the above-mentioned findings, together with the finding that N. europaea is a better competitor for limiting amounts of oxygen than N. winogradskyi (19), are generally valid for the physiological responses of ammonia and nitrite oxidizers, it would explain the occasionally observed nitrite accumulation in surface waters (29), wastewater treatment plants (2, 26), and even soils (unpublished observations of soil columns of acid pine forest soils that were exposed to 0.5 mM ammonium sulfate after 3 weeks of starvation).
REFERENCES
- 1.Arbige M, Chesbro W R. Very slow growth of Bacillus polymyxa: stringent response and maintenance energy. Arch Microbiol. 1982;132:338–344. [Google Scholar]
- 2.Azov Y, Tregubova T. Nitrification processes in stabilisation reservoirs. Water Sci Technol. 1995;31:313–319. [Google Scholar]
- 3.Bakken L R. Culturable and nonculturable bacteria in soil. In: van Elsas J D, Trevors J T, Wellington E M H, editors. Modern soil microbiology. New York, N.Y: Marcel Dekker; 1997. pp. 47–61. [Google Scholar]
- 4.Balmelle B, Nguyen K M, Capdeville B, Cornier J C, Deguin A. Study of factors controlling nitrite build-up in biological processes for water nitrification. Water Sci Technol. 1992;26:1017–1025. [Google Scholar]
- 5.Batchelor S E, Cooper M, Chabra S R, Glover L A, Stewart G S A B, Williams P, Prosser J I. Cell density-regulated recovery of starved biofilm populations of ammonia-oxidizing bacteria. Appl Environ Microbiol. 1997;63:2281–2286. doi: 10.1128/aem.63.6.2281-2286.1997. [DOI] [PMC free article] [PubMed] [Google Scholar]
- 6.Beyeler W, Rogers P L, Fiechter A. A simple technique for the direct determination of maintenance energy coefficient: an example with Zymomonas mobilis. Appl Microbiol Biotechnol. 1984;19:277–280. [Google Scholar]
- 7.Bock E, Koops H-P, Harms H, Ahlers B. The biochemistry of nitrifying organisms. In: Shively J M, Barton L L, editors. Variations in autotrophic life. London, England: Academic Press, Ltd.; 1991. pp. 171–199. [Google Scholar]
- 8.Bock E, Heinrich G. Struktur- und Funktionsänderungen in reaktivierenden Zellen von Nitrobacter winogradskyi Buch. Arch Mikrobiol. 1971;77:349–365. [PubMed] [Google Scholar]
- 9.Bulthuis B A, Frankena J, Koningstein G M, van Verseveld H W, Stouthamer A H. Instability of protease production in a rel+/rel− pair of Bacillus licheniformis and associated morphological and physiological characteristics. Antonie Leeuwenhoek. 1988;54:95–111. doi: 10.1007/BF00419198. [DOI] [PubMed] [Google Scholar]
- 10.Bulthuis B A, Koningstein G M, Stouthamer A H, van Verseveld H W. A comparison between aerobic growth of Bacillus licheniformis in continuous culture and partial-recycling fermentor, with contributions to the discussion on maintenance energy demand. Arch Microbiol. 1989;152:499–507. [Google Scholar]
- 11.Chesbro W R, Evans T, Eifert R. Very slow growth of Escherichia coli. J Bacteriol. 1979;139:625–638. doi: 10.1128/jb.139.2.625-638.1979. [DOI] [PMC free article] [PubMed] [Google Scholar]
- 12.Chesbro W. The domains of slow bacterial growth. Can J Microbiol. 1988;34:427–435. doi: 10.1139/m88-075. [DOI] [PubMed] [Google Scholar]
- 13.Csanady M. Nitrite formation and bacteriological deterioration of water quality in distribution networks. Water Supply. 1992;10:39–53. [Google Scholar]
- 14.Egli T. The ecological and physiological significance of the growth of heterotrophic microorganisms with mixtures of substrates. Adv Microbial Ecol. 1995;14:305–386. [Google Scholar]
- 15.Frankena J, van Verseveld H W, Stouthamer A H. Substrate and energy costs of the production of exocellular enzymes by Bacillus licheniformis. Biotechnol Bioeng. 1988;32:803–812. doi: 10.1002/bit.260320612. [DOI] [PubMed] [Google Scholar]
- 16.Helder W, De Vries R T P. Estuarine nitrite maxima and nitrifying bacteria (Ems-Dollard Estuary) Neth J Sea Res. 1983;17:1–18. [Google Scholar]
- 17.Keen G A, Prosser J I. Steady state transient growth of autotrophic nitrifying bacteria. Arch Microbiol. 1987;147:73–79. [Google Scholar]
- 18.Kuenen J G. Aanpassingen van bacteriën aan voedselarme milieus. H2O. 1982;15:562–573. [Google Scholar]
- 19.Laanbroek H J, Gerards S. Competition for limiting amounts of oxygen between Nitrosomonas europaea and Nitrobacter winogradskyi grown in mixed continuous cultures. Arch Microbiol. 1993;159:453–459. [Google Scholar]
- 20.Mason C A, Egli T. Dynamics of microbial growth in the decelerating and stationary phase of batch culture. In: Kjelleberg S, editor. Starvation in bacteria. New York, N.Y: Plenum Press; 1993. pp. 81–98. [Google Scholar]
- 21.Moriarty D J W, Bell R T. Bacterial growth and starvation in aquatic environments. In: Kjelleberg S, editor. Starvation in bacteria. New York, N.Y: Plenum Press; 1993. pp. 25–53. [Google Scholar]
- 22.Müller R H, Babel W. Measurement of growth at very low rates (μ=0), an approach to study the energy requirement for the survival of Alcaligenes eutrophus JMP 134. Appl Environ Microbiol. 1996;62:147–151. doi: 10.1128/aem.62.1.147-151.1996. [DOI] [PMC free article] [PubMed] [Google Scholar]
- 23.Neijssel O M, Tempest D W. Bioenergetic aspects of aerobic growth of Klebsiella aerogenes NCTC 418 in carbon-limited and carbon-sufficient chemostat culture. Arch Microbiol. 1976;107:215–221. doi: 10.1007/BF00446843. [DOI] [PubMed] [Google Scholar]
- 24.Panikov N S. Microbial growth kinetics. London, England: Chapman & Hall; 1995. pp. 141–143. [Google Scholar]
- 25.Pirt S J. The maintenance energy of bacteria in growing cultures. Proc R Soc London Ser B. 1965;163:223–231. doi: 10.1098/rspb.1965.0069. [DOI] [PubMed] [Google Scholar]
- 26.Randall C W, Buth D. Nitrite build-up in activated sludge resulting from temperature effects. J Water Pollut Control Fed. 1984;56:1039–1049. [Google Scholar]
- 27.Schrickx J M, Krave A S, Verdoes J C, van den Hondel C A M J J, Stouthamer A H, van Verseveld H W. Growth and product formation in chemostat and recycling cultures by Aspergillus niger N402 and a glucamylase overproducing transformant, provided with multiple copies of a glaA gene. J Gen Microbiol. 1993;139:2801–2810. doi: 10.1099/00221287-139-11-2801. [DOI] [PubMed] [Google Scholar]
- 28.Schut F, Prins R A, Gottschal J C. Oligotrophy and pelagic marine bacteria: facts and fiction. Aquat Microb Ecol. 1997;12:177–202. [Google Scholar]
- 29.Smith R V, Burns L C, Doyle R M, Lennox S D, Kelso B H L, Foy R H, Stevens R J. Free ammonia inhibition of nitrification in river sediments leading to nitrite accumulation. J Environ Qual. 1997;26:1049–1055. [Google Scholar]
- 30.Stein L Y, Arp D J. Ammonium limitation results in loss of ammonia-oxidizing activity in Nitrosomonas europaea. Appl Environ Microbiol. 1998;64:1514–1521. doi: 10.1128/aem.64.4.1514-1521.1998. [DOI] [PMC free article] [PubMed] [Google Scholar]
- 31.Stouthamer A H, Bulthuis B A, van Verseveld H W. Energetics of growth at low growth rates and its relevance for the maintenance concept. In: Poole R K, Bazin M J, Keevil C W, editors. Microbial growth dynamics. Oxford, United Kingdom: IRL Press; 1990. pp. 85–102. [Google Scholar]
- 32.Tappe W, Tomaschewski C, Rittershaus S, Groeneweg J. Cultivation of nitrifying bacteria in the retentostat, a simple fermentor with internal biomass retention. FEMS Microbiol Ecol. 1996;19:47–52. [Google Scholar]
- 33.Tomaschewski C. Erhaltungsstoffwechsel und Überlebensfähigkeit des Ammoniak oxidierenden Bakteriums Nitrosomonas europaea. Ph.D. thesis. Aachen, Germany: Technical University of Aachen; 1997. [Google Scholar]
- 34.Tros M E, Bosma T N P, Schraa G, Zehnder A J B. Measurement of minimum substrate concentration (Smin) in a recycling fermentor and its prediction from the kinetic parameters of Pseudomonas sp. strain B13 from batch and chemostat cultures. Appl Environ Microbiol. 1996;62:3655–3661. doi: 10.1128/aem.62.10.3655-3661.1996. [DOI] [PMC free article] [PubMed] [Google Scholar]
- 35.van Elsas J D, van Overbeek L S. Bacterial responses to soil stimuli. In: Kjelleberg S, editor. Starvation in bacteria. New York, N.Y: Plenum Press; 1993. pp. 55–79. [Google Scholar]
- 36.van Verseveld H W, Arbige M, Chesbro W R. Continuous culture of bacteria with biomass retention. Trends Biotechnol. 1984;2:8–12. [Google Scholar]
- 37.van Verseveld H W, Chesbro W R, Braster M, Stouthamer A H. Eubacteria have 3 growth modes keyed to nutrient flow—consequences for the concept of maintenance and maximal growth yield. Arch Microbiol. 1984;137:176–184. doi: 10.1007/BF00414463. [DOI] [PubMed] [Google Scholar]
- 38.van Verseveld H W, de Hollander J A, Frankena J, Braster M, Leeuwerik F J, Stouthamer A H. Modelling of microbial substrate conversion, growth and product formation in a recycling fermentor. Antonie Leeuwenhoek. 1986;52:325–342. doi: 10.1007/BF00428644. [DOI] [PubMed] [Google Scholar]
- 39.van Verseveld H W, Metwally M, el Sayed M, Osman M, Schrickx J M, Stouthamer A H. Determination of the maximum product yield from glucoamylase-producing Aspergillus niger grown in the recycling fermentor. Antonie Leeuwenhoek. 1991;60:313–323. doi: 10.1007/BF00430372. [DOI] [PubMed] [Google Scholar]
- 40.Verhagen F J M, Duyts H, Laanbroek H J. Competition for ammonium between nitrifying and heterotrophic bacteria in continuously percolated soil columns. Appl Environ Microbiol. 1992;58:1962–1969. doi: 10.1128/aem.58.10.3303-3311.1992. [DOI] [PMC free article] [PubMed] [Google Scholar]
- 41.Verhagen F J M, Laanbroek H J. Effects of grazing by flagellates on competition for ammonium between nitrifying and heterotrophic bacteria in chemostats. Appl Environ Microbiol. 1992;58:1962–1969. doi: 10.1128/aem.58.6.1962-1969.1992. [DOI] [PMC free article] [PubMed] [Google Scholar]
- 42.Wilhelm R, Heller O, Bohland M, Tomaschewski C, Klein I, Tappe W, Groeneweg J, Soeder C J. Biometric analysis of physiologically structured pure bacterial cultures recovering from starvation. Can J Microbiol. 1998;44:399–404. [Google Scholar]


