Abstract
The dairy industry produces large quantities of whey as a by-product of cheese production and is increasingly looking for new ways to utilize this waste product. Gellan gum is reliably produced by Sphingomonas paucimobilis in growth media containing lactose, a significant component of cheese whey, as a carbon source. We studied and compared polysaccharide biosynthesis by S. paucimobilis ATCC 31461 in media containing glucose, lactose (5 to 30 g/liter), and sweet cheese whey. We found that altering the growth medium can markedly affect the polysaccharide yield, acyl substitution level, polymer rheological properties, and susceptibility to degradation. Depression of gellan production from lactose compared with gellan production from glucose (approximately 30%) did not appear to occur at the level of synthesis of sugar nucleotides, which are the donors of monomers used for biosynthesis of the repetitive tetrasaccharide unit of gellan. The lactose-derived biopolymer had the highest total acyl content; the glucose- and whey-derived gellans had similar total acyl contents but differed markedly in their acetate and glycerate levels. Rheological studies revealed how the functionality of a gellan polysaccharide is affected by changes in the acyl substitution.
The microbial exopolysaccharides (EPS) are a class of high-value polymers that have many industrial applications (36). Large amounts of one EPS, gellan gum, are synthesized by Sphingomonas paucimobilis ATCC 31461 (19, 35), and this compound is used in the food and pharmaceutical industries, as well as other industries (9, 30). The repeating unit of this linear heteropolysaccharide that is composed of d-glucose, (d-Glc), l-rhamnose (l-Rha), and d-glucuronic acid (d-GlcA), is the tetrasaccharide [→3)-β-d-Glcp(1→4)-β-d-GlcAp(1→4)-β-d-Glcp(1→4)-α-l-Rhap(1→] (17, 34). The native polysaccharide is partially esterified; the 1,3-d-Glc residue can be linked to l-glycerate at C-2 and/or to acetate at C-6, and there is 1 mol of glycerate per repeating unit and 0.5 mol of acetate per repeating unit (21). Acyl substituents affect the rheology of gels, and deacylation of native gellan results in a change from soft, elastic, thermoreversible gels to harder, more brittle gels. Using variants of gellan containing both glycerate and acetate, no substituents, and only an acetate substituent, Jay et al. confirmed that glycerate substituents are responsible for the significant changes in rheology observed after deacylation of gellan (18). These results confirmed both a prediction based on X-ray studies and results obtained in rheological studies of chemically deacylated gellan (2, 9).
Although the production yields, compositions, structures, and properties of bacterial EPS are genetically determined, it is possible to influence these factors by modifying culture conditions, such as temperature (22, 28), dissolved oxygen tension (23, 24), and growth medium composition (i.e., the concentration of cations [25, 29] and the carbon source used [6, 8, 33]). S. paucimobilis ATCC 31461 is able to grow with lactose (35), and previous observations indicated that this strain is able to produce a large amount of highly viscous EPS directly from lactose. In the present study we examined gellan gum production in basal medium containing glucose or lactose at concentrations ranging from 5 to 30 g/liter. Using media containing 2% (wt/vol) lactose or 2% (wt/vol) glucose, we examined the effects of carbon source on the specific activities of all of the gellan-biosynthetic enzymes necessary for the formation of the sugar nucleotides UDP-d-glucose, UDP-d-glucuronic acid, and dTDP-l-rhamnose, which are the monomer donors during biosynthesis of the repetitive tetrasaccharide unit of gellan (26), and on the chemical composition, structure, and properties of the gellan polymers produced. In this work we also assessed whether sweet cheese whey, provided by a Portuguese dairy, could be used as a fermentation medium for gellan gum production and whether its biological oxygen demand (BOD) could be reduced. Although cheese whey is frequently used as an animal feed, centralization of production has created a need for an alternative way to dispose of and valorize this substance. Whey is a nutrient-rich medium; in particular, sweet whey contains approximately 5% lactose, 0.2% lactic acid, and 1% protein, as well as fat, minerals, and vitamins (40). Proper disposal of this product has long been a concern to the dairy industry. The most desirable way of handling this waste is to utilize it as a substrate for the production of useful products; some of these products, bacterial EPS, have recently received some attention (40).
MATERIALS AND METHODS
Bacterial strain and growth conditions.
S. paucimobilis ATCC 31461 was maintained in agar-containing S medium, which contained (per liter of distilled water) 10 g of Na2HPO4, 3 g of KH2PO4, 1 g of K2SO4, 1 g of NaCl, 0.2 g of MgSO4 · 7H2O, 0.01 g of CaCl2, 0.001 g of FeSO4 · 7H2O, 1 g of Casamino Acids (Difco Laboratories, Detroit, Mich.), 1 g of yeast extract (Difco), 20 g of glucose, and 20 g of agar. The defined media used for gellan production were based on S medium; some of these media contained glucose (5 to 30 g/liter), and in some of them the glucose was replaced by lactose (5 to 30 g/liter). Overnight liquid cultures in S medium (100 ml) in shake flasks (250 ml) that were incubated at 30°C with orbital agitation (250 rpm) were used to prepare the inocula. The cultures were centrifuged, and the pellets were resuspended in growth media containing different concentrations of the two carbon sources in order to obtain initial culture optical densities at 640 nm (OD640) of 0.2 ± 0.01. Strain ATCC 31461 was grown in 500-ml Erlenmeyer flasks containing 250 ml of medium, and the cultures were incubated with orbital agitation (250 rpm) at 30 ± 0.1°C. Growth was monitored by monitoring the culture OD640.
Gellan production from glucose or lactose.
Gellan was produced by S. paucimobilis ATCC 31461 during incubation at 30 ± 0.1°C with orbital agitation (250 rpm) in basal S media containing glucose or lactose as the carbon source (at concentrations of 5, 10, 15, 20, 25, and 30 g/liter). The amount of gellan produced was determined by determining the dry weight (24 h, 80°C) of the precipitate recovered from the culture medium after 2.5 volumes of cold ethanol (95%, vol/vol) was added; the precipitate was washed several times with ethanol before it was examined. The ethanol-precipitate concentrations given below were based on mean values obtained from three independent determinations of the dry weight of each precipitate. The increases in broth viscosity during cultivation in the different media due to gellan production were monitored at 30°C by using a cone-and-plate viscometer (model LVIIT; Brookfield Engineering Laboratories, Stoughton, Mass.) at a shear rate of 24 s−1. During growth, the concentration of glucose or lactose remaining in a culture was determined by using the glucose-UV method (Boehringer, Mannheim, Germany) and test combination 176303 (Boehringer).
Assays of enzymes in the gellan synthesis pathway in lactose- or glucose-grown cells.
The specific activities of the gellan-biosynthetic enzymes were determined by using crude cell extracts prepared by ultrasonic treatment of S. paucimobilis ATCC 31461 cells grown at 30°C and harvested after 48 h of growth (28); the experimental conditions used have been described previously (27, 28). Assays for the following enzymes were performed: phosphoglucose isomerase (PGI) (EC 5.3.1.9), phosphoglucomutase (PGM) (EC 5.4.2.5), UDP-d-glucose pyrophosphorylase (UGP) (UTP-glucose 1-phosphate uridyltransferase; EC 2.7.7.9), dTDP-d-glucose pyrophosphorylase (TGP) (TTP-glucose 1-phosphate thymidyltransferase; EC 2.7.7.24), UDP-d-glucose dehydrogenase (UGD) (EC 1.1.1.22), and the dTDP-l-rhamnose biosynthetic enzyme system (TRS). The TRS includes dTDP-d-glucose 4,6-dehydratase (EC 4.2.1.46), which catalyzes the conversion of dTDP-glucose to the intermediate dTDP-4-oxo-6-deoxy-d-glucose, and the complex consisting of dTDP-4-dehydrorhamnose 3,5-epimerase (EC 5.1.3.13) and dTDP-4-dehydrorhamnose reductase (EC 1.1.1.133), which converts dTDP-4-oxo-6-deoxy-d-glucose to dTDP-l-rhamnose. Since the viscosity of the broth was very high, cultures were first diluted 1:10 so that cells could be recovered by centrifugation. The enzyme assays were based on NAD+ or NADP+ oxidation or reduction in coupled reaction systems (at 30 or 37°C), and increases or decreases in OD340 were recorded with a double-beam spectrophotometer (model U-2000; Hitachi Ltd., Tokyo, Japan). The enzymatic activities were calculated from the initial linear rates of cofactor reduction or oxidation after subtraction of endogenous activity (determined by enzyme assays lacking the substrate). Control assays in which the preparations lacked only the extracts were also carried out. Most enzymes were assayed at 37°C; the TRS was assayed at 30°C (27, 28). One unit of enzyme activity was defined as the amount of enzyme that reduced 1 μmol of NAD+ or NADP+ or oxidized 1 μmol of NADPH per min under the assay conditions used. The protein concentrations in the cell extracts were 3.5 ± 1.5 mg/ml, as estimated by the method of Bradford (5); bovine serum albumin (Sigma Chemical Co., St. Louis, Mo.) used as the standard. The specific activities given below are average values based on at least three enzyme assays and three protein determinations for each extract prepared from cells resulting from at least two identical independent growth experiments.
EPS production from whey and BOD5 reduction.
Sweet cheese whey was kindly provided by Martins & Rebelo, Lda., Aviz, Portugal. Immediately after the cheese whey was received, its pH (which was approximately 6.5) was adjusted to 7 with NaOH; then the whey was disinfected by three cycles of heating at 80°C (30 min each), frozen, and stored at −20°C until it was used. The concentrations of lactose and lactic acid in the whey were determined enzymatically by using test combination 176303 (Boehringer). The cheese whey BOD after 5 days of incubation (BOD5) and the residual BOD5 after S. paucimobilis ATCC 31461 growth in different water-diluted cheese whey preparations were determined at 20°C by using a BSB controller (model 1020T; Wissenschaftich-Technischen Werkståtten, Weilheim, Germany) as recommended by the manufacturer. The BOD5 values given below are mean values based on at least two independent determinations.
Gellan production was assessed in different whey preparations diluted with sterile distilled water. Appropriate volumes of overnight Luria broth (10 g of peptone [Difco] per liter of distilled water, 5 g of yeast extract [Difco] per liter of distilled water, 5 g of NaCl per liter of distilled water) cultures were centrifuged in order to obtain, after cell pellet resuspension, a standard initial cell concentration that resulted in an increase in the OD640 of cheese whey-derived medium of 0.3. The amount of gellan gum produced during growth was determined by determining the dry weight (24 h, 80°C) of the precipitate recovered from the culture medium after 2.5 volumes of cold ethanol (95%, wt/vol) was added; the precipitate was washed several times before it was examined. The ethanol precipitate concentrations given below are mean values based on three independent determinations of each precipitate dry weight. The increase in culture viscosity was measured at 30°C by using the Brookfield model LVIIT cone-and-plate viscometer at a shear rate of 0.6 s−1. The data given below are the means based on at least three measurements.
Chemical analysis of gellan polysaccharides.
The total carbohydrate contents of the EPS produced in different media were determined by determining the glucose contents by the method described by Dubois et al. (14). The levels of uronic acids were determined by the 3-hydroxybiphenyl method (15), which was calibrated with glucuronic acid (Sigma). The levels of 6-deoxyhexose were determined by determining the levels of rhamnose by the thiocarbamide method (3, 12).
The neutral sugar contents of the gellan samples were determined by acid hydrolysis with 2 M trifluoroacetic acid (Aldrich, Gillingham, United Kingdom) (4), derivatization to alditol acetates (1), and gas chromatography (GC) analysis. GC was performed with a model HP 5890 series II gas chromatograph (Hewlett-Packard, Delaware, N.Y.) equipped with a Thames Rtx-225 column (0.32 mm by 30 m) (Thames Restek, Windsor, United Kingdom). The carrier gas was helium at a flow rate of 3.0 ml min−1, and the following temperature program was used: 180°C for 1 min, increase at a rate of 2°C min−1 for 12.5 min, and 205°C for 30 min. 2-Deoxyglucose (Sigma) (200 μg per sample) was added as an internal standard, and derivatives of external sugar standards were used to identify analytes and to calibrate response factors.
The linkage sites of all of the sugar residues were determined by performing a methylation analysis. Samples were methylated by sequentially adding powdered sodium hydroxide and iodomethane (10, 32). After dialysis against deionized water, the samples were dried, extracted into CHCl3-CH3OH (1:1), dried, and reduced with lithium thriethyl borodeuteride (LiBDEt3) in tetrahydrofuran (THF) (Aldrich) for 2 h (39). They were then partitioned into CH2Cl2 with water, dried, hydrolyzed, and converted to partially methylated alditol acetates (PMAAs) by trifluoroacetic acid hydrolysis (4), NaBD4 reduction, and acetylation with acetic anhydride and N-methylimidazole (1). Borate was removed prior to acetylation by neutralizing the excess NaBD4 with 200 ml of acetic acid, coevaporating the preparation four times with 1 ml of methanol, adding 100 ml of water, and then acetylating the preparation. The PMAAs were analyzed by GC by using the following temperature program: 55°C for 2 min, increase at a rate of 45°C min−1 for 1.9 min, 140°C for 2 min, increase at a rate of 2°C min−1 for 35 min, and 210°C for 40 min. Analytes were identified by measuring their retention times relative to myo-inositol hexaacetate and then comparing the relative retention times to the retention times of external standards (13). The flame ionization detector signal was used to measure peak areas, which were calculated by determining the relative molar quantities with effective carbon response factors (38). The identities of PMAAs were diagnostically confirmed on the basis of their electron ionization mass spectra (7) by performing an analysis with an identical GC in series with a Fisons Analytical Trio 1S mass spectrometer (Fisons, Loughborouh, United Kingdom); the source temperature used was 200°C, and the ionization potential was 70 eV.
NMR spectroscopy.
1H (400-MHz) nuclear magnetic resonance (NMR) spectra were recorded with a model GX-400 spectrometer (JEOL Ltd., Tokyo, Japan) at 95°C; 1% gellan solutions in D2O (in 5-mm-outside-diameter tubes) were used for 1H one-dimensional NMR experiments. 1H spectra with acceptable signal-to-noise ratios for determinations of acetate and glycerate levels could be obtained in 100 scans (about 5 min). Chemical shifts were determined relative to tetramethylsilane by using sodium 3-trimethylsilylpropanoate (Aldrich) (1H, 0 ppm) in D2O as a secondary external reference. Data processing was carried out by using the Felix 95.0 software (Molecular Simulations, San Diego, Calif.). The level of acetate substitution on the 1,3-Glc residue was determined by integrating to obtain the peak areas at d2.11 + d2.13 (CH3 in acetate) and d1.26 + d1.27 (CH3 in 1,4-Rha) and measuring the ratio of these areas. The level of glycerate substitution on the 1,3-Glc residue was determined from the ratio of three times the peak area at d5.11 (H-1, 1,4-Rha without glycerate substitution) to the area of the Rha methyl.
Rheological characterization of gellan polysaccharides.
Gellan samples were purified and converted into the tetramethyl ammonium (TMA) forms in order to compare their rheological properties. Solutions prepared from the freeze-dried polymers were passed through a TMA Dowex ion-exchange column (H+ Dowex; BDH, Poole, United Kingdom) to convert the counterions to TMA. The solutions were then dialyzed exhaustively against distilled water and freeze-dried. The resulting TMA gellans were dissolved in water at twice the required concentration and then diluted while they were hot with KCl or water as required. The hot solutions were poured into 50-mm-diameter cylindrical molds and left overnight prior to testing. For rheological tests we used a model 3250 mechanical spectrometer (Instron Corporation, Camton, Mass.) operated in the parallel-plate (20-mm-diameter) configuration. Solutions were tested with constant rotation, while the gels were subjected to oscillatory shear over a range of frequencies (strain 0.01). For the gels the molds were glued to the lower platen.
Susceptibility of gellan polymers to S. paucimobilis ATCC 31461 depolymerizing activity.
The gellan type polysaccharides produced in the different media and deacylated gellan (Gelrite; Schweizerhall, South Plainfield, N.J.) were used at a concentration of 0.75% (wt/vol) to solidify a semisynthetic growth medium containing salts, 0.1% (wt/vol) yeast extract, and 0.1% (wt/vol) casein hydrolysate as a nitrogen source (37). To determine the susceptibilities of the different gellan polymers to S. paucimobilis ATCC 31461 depolymerizing activity, approximately 106 bacterial cells were inoculated onto the surface of each gellan-solidified growth medium, and the plates were incubated for 5 days at 30°C. The liquifying effects of bacterial growth on the different gellan-containing media were compared.
RESULTS
Gellan production from glucose or lactose by S. paucimobilis ATCC 31461.
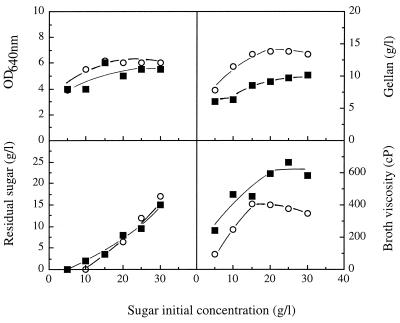
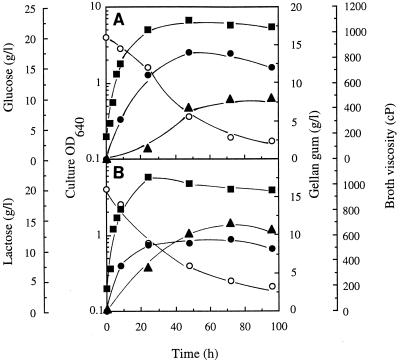
The industrial gellan-producing strain S. paucimobilis ATCC 31461 was able to produce an EPS directly from lactose (Fig. 1 and 2). Several batch cultures were grown for 4 days at 30°C in basal S media containing lactose or glucose at concentrations ranging from 5 to 30 g/liter. The growth kinetics in lactose- and glucose-containing media were similar after the first 48 h of incubation. After 48 h the concentrations of gellan (ethanol precipitate) that could be recovered from the cultures were maximal as the result of entry into the stationary phase (Fig. 2; data not shown). Significant residual concentrations of the sugars remained unused in media in which the initial sugar concentrations were greater than 10 g/liter at the stationary phase (Fig. 1 and 2), indicating that another nutrient limited growth. Maximal EPS production and maximal broth viscosity were observed when the initial concentrations of glucose and lactose were greater than 15 g/liter. Interestingly, despite the fact that the concentration of gellan polymer that was produced from glucose was higher than the concentration of gellan polymer that was produced from lactose (14 and 9 g/liter, respectively), the viscosity of the lactose-containing broth was significantly greater than the viscosity of the glucose-containing broth for all of the initial sugar concentrations examined (Fig. 1 and 2). To understand these results, we compared the chemical compositions, structures, and rheological properties of the gellan polymers produced after 48 h of incubation in media containing 2% (wt/vol) glucose and in media containing 2% (wt/vol) lactose. Additionally, we compared the specific activities of the gellan-biosynthetic enzymes involved in formation of the sugar-activated precursors of gellan polymers in cell extracts prepared from cells grown in glucose-containing media and in lactose-containing media.
FIG. 1.
Gellan production (expressed as the concentration of the ethanol precipitate isolated from culture broth), culture OD640, residual carbon source concentration, and broth viscosity (shear rate, 24 s−1) after 48 h of S. paucimobilis ATCC 31461 batch growth at 30°C and 250 rpm in basal S medium containing glucose (○) or lactose (■) at concentrations ranging from 5 to 30 g/liter.
FIG. 2.
Gellan production (expressed as the concentration of the ethanol precipitate isolated from culture broth) (●), residual carbon source concentration (○), broth viscosity (shear rate, 24 s−1) (▴), and OD640 (■) for batch cultures of S. paucimobilis ATCC 31461 grown at 30°C and 250 rpm with 20 g of glucose per liter (A) or 20 g of lactose per liter (B) as the carbon source.
Gellan-biosynthetic enzymes in lactose- or glucose-grown cells.
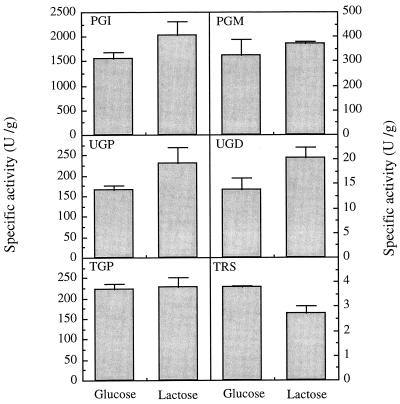
Cells of S. paucimobilis ATCC 31461 were grown in medium containing 2% (wt/vol) glucose and in medium containing 2% (wt/vol) lactose, and the specific activities of enzymes involved in the synthesis of sugar nucleotides were similar, although not identical, in the two cultures (Fig. 3). For most of the enzymes examined (PGI, PGM, UGP, and UGD) the specific activities did not correlate with gellan-specific production in the two media. In fact, the enzyme specific activities were slightly higher in lactose-grown cells, while gellan-specific production (associated with the amount of ethanol precipitate isolated per unit of OD640 at the early stationary phase) was lower in lactose-containing medium than in glucose-containing medium. However, the TRS activity in lactose-grown cells was slightly less than the estimated TRS activity in glucose-grown cells, and the TGP specific activities were apparently identical in the two types of cells (Fig. 3).
FIG. 3.
Specific activities of PGI, PGM, UGP, UGD, TGP, and TRS in cell extracts prepared from cells of S. paucimobilis ATCC 31461 harvested after 48 h of growth in glucose-containing or lactose-containing media. The bars indicate standard deviations based on at least three enzyme assays for each extract prepared from cells resulting from at least two independent growth experiments.
Gellan production from cheese whey.
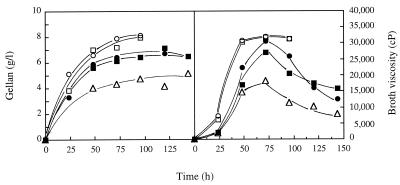
The concentrations of lactose and lactic acid in the sweet cheese whey used in this study were 52 and 0.5 g/liter, respectively. With undiluted whey (pH 7.0), the culture broth viscosity did not increase during incubation. It is possible that the undiluted cheese whey included metal ions or other compounds at concentrations that inhibited gellan production without drastically affecting cell growth. Whey diluted 1:4 to 1:5 with water produced maximal levels of EPS (approximately 7 g/liter after 2 to 3 days of incubation), and this was accompanied by a substantial increase in broth viscosity (Fig. 4). Greater dilution resulted in decreases in the final concentration of EPS produced (Fig. 4). The percentage of reduction in the initial BOD5 was maximal (66%) when whey diluted 1:5 was used, while greater dilution resulted in lower gellan concentrations and with no increase in the percentage of BOD5 removed (Table 1). Surprisingly, culture viscosity values, which were maximal after 2 to 4 days of incubation, decreased very substantially when preparations were incubated for 2 more days (Fig. 4). Such drastic decreases in broth viscosity did not occur during prolonged cell incubation (up to 7 days) in basal S medium containing lactose or glucose as the carbon source (Fig. 2; data not shown). However, a slight decrease in the early-stationary-phase broth viscosity was also detected after 12 days of incubation (data not shown). These results are consistent with the finding that different gellan-related polymers are susceptible to S. paucimobilis ATCC 31461 depolymerizing activity. Indeed, the susceptibility of the whey polymer to degradation by S. paucimobilis ATCC 31461 was confirmed, while the gellan samples obtained from lactose-containing and glucose-containing preparations were apparently not affected; however, Gelrite was more susceptible to bacterial enzyme degrading activity than the whey-derived polymer was (data not shown).
FIG. 4.
Gellan production (expressed as the concentration of the ethanol precipitate isolated from culture broth) and broth viscosity (shear rate, 0.6 s−1) during S. paucimobilis ATCC 31461 growth at 30°C and 250 rpm in cheese whey diluted 1:4 (○), 1:5 (□), 1:6 (●), 1:8 (■), or 1:10 (▵).
TABLE 1.
Concentration of gellan produceda
| Cheese whey dilution | Gellan (g/liter) | Residual BOD5 (mg/liter) | BOD5 removed (%) |
|---|---|---|---|
| 1:4 | 7.9 | 26,000 | 52 |
| 1:5 | 7.2 | 18,750 | 66 |
| 1:6 | 6.4 | 18,000 | 67 |
Expressed as the concentration of the ethanol precipitate isolated from the culture broth after 72 h of growth at 30°C and 250 rpm in different dilutions of cheese whey media. The residual BOD5 of cell-free cultures and the consequent percentage of BOD5 removed is also indicated. Initial whey BOD5 was 50,000 ± 1,500 mg/liter. The relative standard deviation for three independent growth experiments was less than 10%.
Chemical compositions and structures of gellan polysaccharides produced from lactose, glucose, or cheese whey.
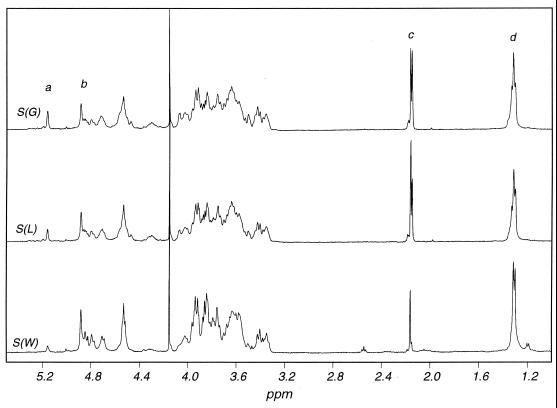
The results of our chemical and structural analysis of the gellans produced after 48 h of growth in defined medium containing lactose or glucose as the carbon source or in diluted (1:5) cheese whey after 72 h of incubation indicated that the gellans had similar primary carbohydrate structures (Table 2). The ratio of Glc to Rha in the neutral sugar analysis was higher than the ratio of Glc to Rha in the linkage analysis. This may have been due to partial degradation of free rhamnose under hydrolysis conditions, while the methylated sugar may have been less labile. It is not clear why the product obtained from whey did not exhibit such a difference. Reduction of uronic acid in the methylated samples reduced the resistance of certain glycosidic linkages to hydrolysis and thus may also have reduced selective degradation of some residues. Therefore, although the linkage analysis results were only semiquantitative, they were probably more reliable. Glucuronic acid appeared to be underreduced in the methylation analysis, since colorimetry indicated that it accounted for about one-fifth of the dry matter in all three samples. The sample from the culture grown in the presence of glucose also contained about 0.5 mol of a terminal sugar, either t-Glc or t-Man (which coeluted). The same peak was present in the lactose- and whey-grown samples, but it was much smaller. Since no true branched residue was observed, this terminal sugar may have been an artifact of degradation. A very small quantity of 1,3-linked mannose was detected in the glucose-grown sample. Complete structural characterization by two-dimensional NMR was not considered necessary, since such a characterization had been done previously for the polysaccharide produced from glucose (18). However, one-dimensional NMR gave useful information concerning the levels of acetate and glycerate, which were found to vary in the three polysaccharide samples examined (Fig. 5 and Table 2).
TABLE 2.
Chemical and NMR analysis of gellan polysaccharides, produced in basal S medium with glucose (G) or lactose (L) as the carbon source, or in diluted (1:5) cheese whey (W)
| Gellan sample | Carbohydrate as Glc (% [wt/wt]) | Uronic acid as GlcA (% [wt/wt]) | 6-Deoxy-hexose as Rha (% [wt/wt]) | Molar ratio of neutral sugars (Rha:Glc:Man) | Molar ratio of glycosidic linkages
|
Molar ratio of acyl substituents
|
||||
|---|---|---|---|---|---|---|---|---|---|---|
| 1,4-Rhap | 1,3-Glcp | 1,4-Glcp | 1,4-GlcpA | Acetate | Glycerate | |||||
| G | 44.4 | 18.3 | 33.1 | 1:2.8:0.17 | 1 | 0.90 | 0.86 | 0.51 | 0.63 | 0.51 |
| 1:2.4:0.20 | ||||||||||
| L | 49.9 | 18.9 | 34.5 | 1:2.4:0.15 | 1 | 0.88 | 0.92 | 0.44 | 0.53 | 0.75 |
| 1:3.0:0.10 | ||||||||||
| W | 57.9 | 20.2 | 37.1 | 1:1.4:0.08 | 1 | 0.96 | 0.94 | 0.46 | 0.18 | 0.89 |
FIG. 5.
400-MHz 1H NMR spectra (90°C) of S. paucimobilis gellan polysaccharides. S(G), cells grown in glucose-containing medium; S(L), cells grown in lactose-containing medium; S(W), cells grown in cheese whey-containing medium. Signal assignments: a, Rha H-1 (no glycerate); b, Rha H-1 (glycerate on 1,3-Glc); c, acetate CH3; d, Rha CH3.
Rheological properties of gellan polymers.
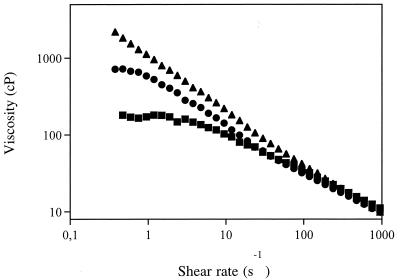
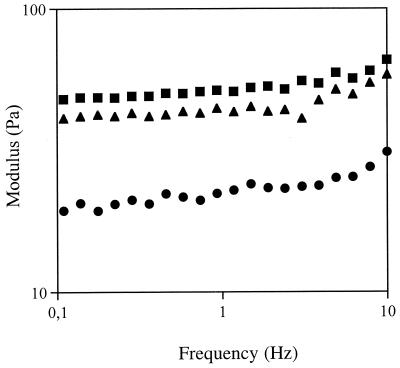
Figure 6 shows the results of a comparison of the viscosities of the three purified gellan polymers which we analyzed. The sample produced with whey had the highest bulk viscosity, while the sample produced with glucose had the lowest shear viscosity. The viscosity values appeared to be directly related to the level of glycerate present (Table 2). Figure 7 shows that the lactose-grown sample, which had the highest total acyl content (mole proportion, ∼1.3 [Table 2]), yielded the lowest modulus. The glucose- and whey-grown samples had similar total acyl contents (mole proportion, ∼1.1 [Table 2]) and their acetate and glycerate levels differed markedly, but the moduli of these samples were similar and higher than the modulus of the lactose-grown sample.
FIG. 6.
Viscosities in water of 0.2% TMA gellan samples from three different growth media, lactose-containing broth (●), glucose-containing broth (■), and cheese whey-containing broth (▴).
FIG. 7.
Frequency dependence of the storage moduli of 0.4% gellan gels as determined with 0.03 M KCl (1% deformation). Symbols: ●, lactose-containing broth; ■, glucose-containing broth; ▴, cheese whey-containing broth.
DISCUSSION
Gellan polysaccharides can be produced by the industrial strain S. paucimobilis ATCC 31461 in a laboratory-defined production base medium containing lactose (2%, wt/vol), although the yields are only around 70% of the yields obtained with glucose-containing medium. The results of the chemical and structural analysis of the two gellan samples indicated that they have the same primary carbohydrate structure, but the levels of acetate and glycerate are different. The gellan polysaccharide produced from lactose in sweet cheese whey diluted 1/5 with water also differed from the other two polysaccharides in the nature of the noncarbohydrate acyl substitution. Gellan modification may be strictly regulated and may depend not only on the enzyme activities that catalyze the corresponding biosynthetic steps but also on the intracellular concentrations of the acyl activated precursors, which may vary depending on cell metabolism in the different growth media. (16, 36).
The different acylation patterns affected the rheological properties of the three polymers obtained. The comparison of the viscosities of the three purified gellan polymers analyzed (Fig. 6) indicated that the sample produced from whey had the highest bulk viscosity, while the sample produced from glucose had the lowest shear viscosity. The viscosity values appeared to be directly related to the level of glycerate present (Table 2), as demonstrated previously (2, 18, 31). While the molecular analysis of X-ray fiber diffraction data suggested that glycerate alone is important in determining the gellan association and rheology, the results of studies of chemically modified gellans suggested that the rheology and conformation depend on both the level of acetate and glycerate substitution (18, 31). As shown in Fig. 7, the lactose-derived polymer, which had the highest total acyl content (mole proportion, ∼1.3 [Table 2]) yielded the lowest modulus, and the glucose- and whey-grown samples (which had similar total acyl contents [mole proportion, ∼1.1, as shown in Table 2] but markedly different acetate and glycerate levels) had similar moduli, which were higher than the modulus of the lactose-grown sample. The similarity of the modulus values obtained for the glucose- and whey-grown sample suggests that glycerate and acetate play significant roles in controlling polymer association and gelation, as does the total level of acyl substitution.
The lower yield of gellan from lactose than from glucose can hardly be explained on the basis of the levels of most of the enzymes that produce the activated sugar precursors for gellan gum polymerization, which were identical in lactose-grown cells and glucose-grown cells or were slightly higher in lactose-grown cells than in glucose-grown cells. Only the level of the TRS was depressed in lactose-grown cells. TRS and UGD are thought to be more specific enzymes for sugar precursor formation and to limit gellan biosynthesis (26), but the UGD specific activity was also lower in glucose-grown cells. Based on the overall results of the enzyme assays and the fact that the lactose- and glucose-derived gellans have similar primary carbohydrate structures, the control of gellan synthesis from lactose or glucose does not appear to take place at the level of nucleoside-sugar phosphate synthesis.
Direct fermentation of sweet cheese whey diluted 1:5 with water by S. paucimobilis ATCC 31461 resulted in production of approximately 7 g of EPS per liter and in a 70% reduction in the initial BOD5. We anticipate that supplementation of the medium with noncarbon nutrients and/or the use of whey permeate obtained after separation of a marketable protein concentrate may result in interesting valorization of this waste and in a reduction in its BOD.
The marked reduction in the high viscosity values of cheese whey-containing medium observed during the early stationary phase of S. paucimobilis ATCC 31461 growth when incubation was prolonged for a few days was not observed when the laboratory medium containing either glucose or lactose was used. This result was probably due to the activity of a gellan lyase with the whey-derived polymer. A number of Sphingomonas strains that are capable of synthesizing gellan-related polymers have been shown to possess constitutive gellan lyase activity, as well as β-d-glucosidase and β-d-glucuronidase activities (37). In addition, it has been found that enzymes degrade deacylated gellan due to extracellular eliminase types of enzymes (lyases), which cleave the sequence -β-d-glucosyl-(1→4)-β-d-glucuronosyl- in the tetrasaccharide repeat unit but exhibit negligible activity against the native acylated gellan polysaccharides. Other polysaccharide lyases active against alginate are also strongly inhibited by the presence of O-acetyl or other acyl groups on the polymeric substrates (11, 20). The suggested high levels of resistance of the polysaccharides produced in lactose- or glucose-containing media to the depolymerizing activity of S. paucimobilis ATCC 31461 compared with the level of resistance of the whey-derived polymer were confirmed, and Gelrite was the most susceptible polysaccharide. These results are consistent with the hypothesis that in gellan and gellan-related polymers complete removal of the side chains is required to obtain completely exposed carboxylate groups, which allows the enzyme to cleave at its recognition site (37), which in Gelrite is unsubstituted. In fact, we found that the percentage of acylation (calculated by using the sum of glyceryl and acetyl substituents) is lower in cheese whey-derived polymer than in the other two polymers produced in semisynthetic medium containing glucose or lactose. However, since the susceptibility of whey-derived polymer to depolymerization is dramatically higher, we are tempted to believe that this is mostly due to the very low level of acetylation of this type of gellan.
ACKNOWLEDGMENTS
This work was carried within the context of the Anglo-Portuguese Joint Research Programme, 1997 (Action B-29/97) and was supported in part by JNICT/FCT, FEDER, and PRAXIS XXI Programme (grant Praxis/2/2.1/BIO/1125/95 and scholarships to L.O.M. and J.H.L.). M.L.D. was an exchange student from the Université Paris 7, Paris, France, under the ERASMUS program. M.J.R, V.J.M, and A.J.J. are grateful to the B.B.S.R.C. for funding.
We thank Emília Borba and Isabel Campos for carrying out a few experiments.
REFERENCES
- 1.Albersheim P, Nevins D J, English P D, Karr A. A method for the analysis of sugars on plant cell-wall polysaccharides by gas-liquid chromatography. Carbohydr Res. 1967;5:340–345. [Google Scholar]
- 2.Baird J K, Talashek T A, Chang H. Gellan gum: effect of composition on gel properties. In: Phillips G O, Wedlock D J, Williams P A, editors. Gums and stabilizers for the food industry 6. Oxford, United Kingdom: Pergamon Press; 1992. pp. 479–487. [Google Scholar]
- 3.Baird J K, Smith W W. An analytical procedure for gellan gum in food gels. Food Hydrocoll. 1989;3:407–411. [Google Scholar]
- 4.Blakeney A B, Harris P J, Henry R J, Stone B A. A simple and rapid preparation of alditol acetates for monosaccharide analysis. Carbohydr Res. 1983;113:291–299. [Google Scholar]
- 5.Bradford M M. A rapid and sensitive method for the quantitation of microgram quantities of protein utilizing the principle of protein-dye binding. Anal Biochem. 1976;72:248–254. doi: 10.1016/0003-2697(76)90527-3. [DOI] [PubMed] [Google Scholar]
- 6.Bryan B A, Linhardt R J, Daniels L. Variation in composition and yield of exopolysaccharides produced by Klebsiella sp. strain K32 and Acinetobacter calcoaceticus BD4. Appl Environ Microbiol. 1986;51:1304–1308. doi: 10.1128/aem.51.6.1304-1308.1986. [DOI] [PMC free article] [PubMed] [Google Scholar]
- 7.Carpita N C, Shea E M. Linkage structure of carbohydrates by gas chromatography-mass spectrometry (GC-MS) of partially methylated alditol acetates. In: Biermann C J, McGinnis G D, editors. Analysis of carbohydrates by gas-liquid chromatography and mass spectrometry. Boca Raton, Fla: CRC Press; 1989. pp. 157–216. [Google Scholar]
- 8.Cerning J, Denard C M G C, Thibault J F, Bouillanne C, Laudon M, Desmazeaud M, Topisirovic L. Carbon source requirements for exopolysaccharide production by Lactobacillus casei CG11 and partial structure analysis of the polymer. Appl Environ Microbiol. 1994;60:3914–3919. doi: 10.1128/aem.60.11.3914-3919.1994. [DOI] [PMC free article] [PubMed] [Google Scholar]
- 9.Chandrasekaran R, Radha A. Molecular architectures and functional properties of gellan gum and related polysaccharides. Trends Food Sci Technol. 1995;6:143–148. [Google Scholar]
- 10.Ciucanu I, Kerek F A. Simple and rapid method for the permethylation of carbohydrates. Carbohydr Res. 1984;131:209–217. [Google Scholar]
- 11.Davidson I W, Sutherland I W, Lawson C J. Localization of O-acetyl groups of bacterial alginate. J Gen Microbiol. 1977;98:603–606. doi: 10.1099/00221287-98-1-223. [DOI] [PubMed] [Google Scholar]
- 12.Dische Z, Shettles L B. Specific color reaction of methylpentoses and a spectrophotometric micromethod for their determination. J Biol Chem. 1948;175:595–603. [PubMed] [Google Scholar]
- 13.Doares S H, Albersheim P, Darvill A G. An improved method for the preparation of standards for glycosyl-linkage analysis of complex carbohydrates. Carbohydr Res. 1991;210:311–317. [Google Scholar]
- 14.Dubois M, Gilles K A, Hamilton J K, Rebers P A, Smith F. Colorimetric method for determination of sugars and related substances. Anal Chem. 1956;28:350–356. [Google Scholar]
- 15.Filisetti-Cozzi T M C C, Carpita N C. Measurement of uronic acids without interference from neutral sugars. Anal Biochem. 1991;197:157–162. doi: 10.1016/0003-2697(91)90372-z. [DOI] [PubMed] [Google Scholar]
- 16.Ielpi L, Couso R O, Dankert M A. Sequential assembly and polymerization of the polyprenol-linked pentasaccharide repeating unit of the xanthan polysaccharide in Xanthomonas campestris. J Bacteriol. 1993;175:2490–2500. doi: 10.1128/jb.175.9.2490-2500.1993. [DOI] [PMC free article] [PubMed] [Google Scholar]
- 17.Jannsson P-E, Lindberg B, Sandford P A. Structural studies of gellan gum, an extracellular polysaccharide elaborated by Pseudomonas elodea. Carbohydr Res. 1983;124:135–139. [Google Scholar]
- 18.Jay A J, Colquhoun I J, Ridout M J, Brownsey G J, Morris V J, Fialho A M, Leitão J H, Correia I S. Analysis of structure and function of gellans with different substitution patterns. Carbohydr Polym. 1998;35:179–188. [Google Scholar]
- 19.Kang, K. S., and G. T. Veeder. October 1981. U. S. patent 4,377,636.
- 20.Kennedy L, McDowell K, Sutherland I W. Alginases from Azotobacter species. J Gen Microbiol. 1992;138:2465–2471. [Google Scholar]
- 21.Kuo M S, Mort A J, Dell A. Identification and location of l-glycerate, an unusual substituent in gellan gum. Carbohydr Res. 1986;56:173–187. [Google Scholar]
- 22.Leitão J H, Fialho A M, Correia I S. Effects of growth temperature on alginate synthesis and enzymes in Pseudomonas aeruginosa variants. J Gen Microbiol. 1992;138:605–610. doi: 10.1099/00221287-138-3-605. [DOI] [PubMed] [Google Scholar]
- 23.Leitão J H, Correia I S. Oxygen-dependent alginate synthesis and enzymes in Pseudomonas aeruginosa. J Gen Microbiol. 1993;139:441–445. doi: 10.1099/00221287-139-3-441. [DOI] [PubMed] [Google Scholar]
- 24.Leitão J H, Correia I S. Oxygen-dependent upregulation of transcription of alginate genes algA, algC and algD in Pseudomonas aeruginosa. Res Microbiol. 1997;148:37–43. doi: 10.1016/S0923-2508(97)81898-0. [DOI] [PubMed] [Google Scholar]
- 25.Leitão J H, Correia I S. Effects of growth-inhibitory concentrations of copper on alginate biosynthesis in highly mucoid Pseudomonas aeruginosa. Microbiology. 1997;143:481–488. doi: 10.1099/00221287-143-2-481. [DOI] [PubMed] [Google Scholar]
- 26.Martins L O, Fialho A M, Rodrigues P L, Correia I S. Gellan gum production and activity of biosynthetic enzymes in Sphingomonas paucimobilis mucoid and non-mucoid variants. Biotechnol Appl Biochem. 1996;24:47–54. [Google Scholar]
- 27.Martins L O, Correia I S. Gellan gum biosynthetic enzymes in producing and nonproducing variants of Pseudomonas elodea. Biotechnol Appl Biochem. 1991;14:357–364. [PubMed] [Google Scholar]
- 28.Martins L O, Correia I S. Temperature profiles of gellan gum synthesis and activities of biosynthetic enzymes. Biotechnol Appl Biochem. 1994;20:385–395. [Google Scholar]
- 29.Martins L O, Brito L C, Correia I S. Roles of Mn2+, Mg2+, and Ca2+ on alginate biosynthesis by Pseudomonas aeruginosa. Enzyme Microb Technol. 1990;12:794–799. [Google Scholar]
- 30.Moorhouse R. Structure/property relationships of a family of microbial polysaccharides. In: Yalpani M, editor. Industrial polysaccharides: genetic engineering, structure, structure/property relations and applications. Amsterdam, The Netherlands: Elsevier; 1987. pp. 187–206. [Google Scholar]
- 31.Morris E R, Gothard M G E, Hember M W N, Manning C E, Robinson G. Conformational and rheological transitions of welan, rhamsan and acylated gellan. Carbohydr Polym. 1996;30:165–175. [Google Scholar]
- 32.Needs P W, Selvendran R R. An improved methylation procedure for the analysis of complex polysaccharides including resistant starch and a critique of the factors which lead to undermethylation. Phytochem Anal. 1993;4:210–216. [Google Scholar]
- 33.Novak J S, Tanenbaum S W, Nakas J P. Heteropolysaccharide formation by Arthrobacter viscosus grown on xylose and xylose oligosaccharides. Appl Environ Microbiol. 1992;58:3501–3507. doi: 10.1128/aem.58.11.3501-3507.1992. [DOI] [PMC free article] [PubMed] [Google Scholar]
- 34.O’Neill M A, Selvendran R R, Morris V J. Structure of the acidic extracellular gelling polysaccharide produced by Pseudomonas elodea. Carbohydr Res. 1983;124:123–133. doi: 10.1016/0008-6215(86)80037-4. [DOI] [PubMed] [Google Scholar]
- 35.Pollock T J. Gellan-related polysaccharides and the genus Sphingomonas. J Gen Microbiol. 1993;139:1939–1945. [Google Scholar]
- 36.Sutherland I W. Biotechnology of microbial exopolysaccharides. Camb Stud Biotechnol. 1990;9:1–69. [Google Scholar]
- 37.Sutherland I W, Kennedy L. Polysaccharide lyases from gellan-producing Sphingomonas spp. Microbiology. 1996;142:867–872. doi: 10.1099/00221287-142-4-867. [DOI] [PubMed] [Google Scholar]
- 38.Sweet D P, Shapiro R, Albersheim P. Quantitative analysis by various GLC response-factor theories for partially methylated and partially ethylated alditol acetates. Carbohydr Res. 1975;40:217–225. [Google Scholar]
- 39.York W S, Darvill A G, McNeil M, Stevenson T T, Albersheim P. Isolation and characterization of plant cell walls and cell wall components. Methods Enzymol. 1985;118:3–40. [Google Scholar]
- 40.Zall R R. Source and composition of whey and permeate. In: Zadow J G, editor. Whey and lactose processing. London, England: Elsevier; 1992. pp. 1–72. [Google Scholar]


