

Abstract
A comprehensive, non-targeted analysis of polar organic pollutants using high resolution/accurate mass (HR/AM) mass spectrometry approaches has been applied to water samples from San Francisco (SF) Bay, a major urban estuary on the western coast of the United States, to assess occurrence of emerging contaminants and inform future monitoring and management activities. Polar Organic Chemical Integrative Samplers (POCIS) were deployed selectively to evaluate the influence of three contaminant pathways: urban stormwater runoff (San Leandro Bay), wastewater effluent (Coyote Creek, Lower South Bay), and agricultural runoff (Napa River). Grab samples were collected before and after deployment of the passive samplers to provide a quantitative snapshot of contaminants for comparison. Composite samples of wastewater effluent (24 hours) were also collected from several wastewater dischargers. Samples were analyzed using liquid-chromatography coupled to high resolution mass spectrometry. Resulting data were analyzed using a customized workflow designed for high-fidelity detection, prioritization, identification, and semi-quantitation of detected molecular features. Approximately 6,350 compounds were detected in the combined data set, with 424 of those compounds tentatively identified through high quality spectral library match scores. Compounds identified included ethoxylated surfactants, pesticide and pharmaceutical transformation products, polymer additives, and rubber vulcanization agents. Compounds identified in samples were reflective of the apparent sources and pathways of organic pollutant inputs, with stormwater-influenced samples dominated by additive chemicals likely derived from plastics and vehicle tires, as well as ethoxylated surfactants.
Introduction
Most efforts to assess the occurrence, sources, and fate of unregulated and potentially harmful environmental organic pollutants in freshwater, estuarine, and marine systems have largely focused on targeted monitoring of known and anticipated emerging contaminants including pharmaceuticals, surfactants, and personal care products 1–4. Despite significant progress in prioritization and assessment of likely emerging environmental contaminants via a priori knowledge such as data on chemical production, use, and toxic impacts5–8, significant gaps remain in our understanding of which organic pollutants are most prevalent in ambient waters, their sources, and their biological or chemical fate. In many cases, these gaps exist due to incomplete information concerning production and/or industrial and commercial application of organic chemicals used in commerce. In addition, biodegradation and other transformation processes may generate myriad chemical transformation products from organic pollutants, thus making an already complex mixture even more so9, 10.
The advent of sensitive, accurate, and robust high resolution mass spectrometers (HRMS) including time-of-flight and orbital trapping instruments, and their application together with cheminformatic and computational mass spectrometry data processing routines, have facilitated the application of non-targeted and suspect screening monitoring approaches for detecting and identifying novel emerging contaminants in the environment11–13. Application of these techniques to water quality monitoring has led to dramatic improvements in our collective ability to identify broad array of contaminants (especially polar organic pollutants) in freshwater14, 15 and estuarine/marine16–18 systems without the need for a priori knowledge of their occurrence, source, or even use patterns.
In the current study, we have utilized non-targeted monitoring analytical strategies based on liquid chromatography coupled to HRMS to identify and, where possible, quantify polar organic pollutants in waters of the highly urbanized San Francisco Bay estuary (San Francisco, CA, USA). San Francisco Bay receives discharges of pollutants through multiple pathways, including: 1) urban stormwater runoff; 2) treated wastewater effluent; and 3) agricultural discharges via riverine input. The overarching objective of the study was to discover which emerging polar organic pollutants are important contributors to SF Bay surface waters and to assess the potential sources of these pollutants where possible.
Our study design utilized the unique geography of the SF Bay to allow exploration of the differences in emerging contaminant occurrence and abundance profiles among Bay sites influenced predominantly by each of the three pathways noted above. We assessed the performance of grab and passive sampling strategies for non-targeted organic pollutant screening at each SF Bay site. While discrete grab samples are better able to capture contaminants that may be transient or otherwise temporally unstable, passive samplers offer a more integrated assessment of pollutant occurrence in a water bodies over a period of deployment. Lengthy passive sampler deployment time also means that contaminants at trace levels are more likely to be detected, provided they have favorable uptake dynamics into the sampler19, 20. Effluents from four wastewater treatment facilities discharging to the Bay were also analyzed and compared to SF Bay waters.
This investigation will serve as a case study of source- and pathway-informed non-targeted analysis of polar organic pollutants in urbanized estuaries with complex contaminant inputs. Our inclusion of sites influenced by different types of contaminant pathways enabled a robust examination of contaminant profiles of these different pathways despite limited a priori knowledge of their specific uses and/or discharge, and will guide comprehensive future targeted monitoring and management decisions.
Methods
Site Selection
Three ambient SF Bay sites, each predominantly influenced by a specific pathway of interest, were selected based on factors including land use information in the upstream watershed (Table SI-1), as well as the discharge of treated wastewater effluent in the vicinity. Site-specific information is summarized below and in Supplementary Information.
San Leandro Bay was selected for wet season sampling to characterize urban stormwater runoff from highly urbanized Central Bay watersheds (Figure 1). This site drains the watersheds of San Leandro Creek and an unnamed tributary that receives runoff from the Coliseum Industrial neighborhood; 88% of the watershed is urban (Table SI-1).
Figure 1.

Ambient Bay water sampling locations.
An accessible, tidally influenced site along the Napa River was selected to characterize the influence of agricultural discharges derived from extensive wine-growing and other agricultural practices in the Napa watershed (Figure 1). The dominant land uses in the watershed are open space (44%) and agricultural (42%), while population density is relatively low for the San Francisco Bay Area, at 148 people per square kilometer (Table SI-1). This less-urbanized portion of the Bay is more moderately influenced by treated wastewater effluent and urban stormwater discharges. Sampling was conducted at the end of the wet season to maximize the likelihood of capturing the presence of pesticides and other agricultural contaminants mobilized by spring rains.
Finally, a site in the Lower South SF Bay, on Coyote Creek at the confluence with Alviso Slough, was selected to characterize the influence of treated wastewater effluent (Figure 1). The Lower South Bay has the highest hydraulic residence time relative to other portions of SF Bay (Smith and Hollibaugh, 2006), and receives approximately 450 million liters per day of treated wastewater effluent. Wastewater-derived contaminants such as pharmaceuticals2, triclosan and related biocides21, and flame retardants22 are often observed at higher concentrations in this part of the Bay. To reduce the influence of stormwater, sampling at this site was conducted during the dry season.
In addition, four WWTPs with outfalls in the SF Bay provided samples of treated wastewater effluent for this study. All facilities used modern secondary treatment (solids and organics removal followed by disinfection prior to discharge), while some used additional, more advanced treatment measures such as nutrient removal and/or dual media filtration. Facilities ranged in capacity, with average daily discharges of 60 to 300 million liters per day.
Passive sampling at ambient sites
Polar Organic Chemical Integrative Samplers (POCIS, Environmental Sampling Technologies, St. Joseph, MO) were deployed at each of the SF Bay sites using methods consistent with published deployment protocols20. These samplers consisted of polymeric adsorbent (Waters Oasis Hydrophilic-Lipophilic Balance [HLB]) sandwiched between two permeable polyethersulfone membranes and held in place by stainless steel housings. The POCIS samplers were deployed in configurations consisting of a single canister per site, with each canister containing three identical POCIS samplers to provide triplicate measurements at each location. Each POCIS canister was maintained in situ at the sampling site for approximately three weeks before retrieval. Additionally, for the San Leandro Bay site, a single POCIS blank was prepared and transported to and from the field during deployment and retrieval; between deployment and retrieval, the blank was stored in the dark in a standard 4°C refrigerator.
San Leandro Bay was sampled during the wet season over March 8 – March 30, 2016 to characterize water influenced by urban stormwater runoff. Immediately prior to POCIS deployment, a precipitation event was recorded at a nearby NOAA rain gauge (Oakland NNW 4.4) on March 5-7 (0.87 mm), which resulted in limited flows of urban stormwater runoff, as well as discharges from the wet weather wastewater inflow and infiltration outfall to the north of the sample site on March 4-7. One additional precipitation event was recorded during deployment, from March 11-14 (0.97 mm), which led to limited urban stormwater flows, along with discharges of wet weather wastewater inflow and infiltration released on March 10-11 and March 13-14. The Napa River site was sampled at the end of the wet season over April 13 – May 2, 2016, to characterize water influenced by agricultural discharges. The POCIS was deployed during low tide and retrieved during high tide, allowing a preliminary assessment of tidal influence on the contaminant profiles observed in the deployment and retrieval grab samples at this site, which is further removed from the Bay. Coyote Creek was sampled during the dry season over August 23 – September 14, 2016, to characterize water influenced by wastewater effluent. No rainfall occurred during either of these periods.
Grab sampling at ambient sites
Grab samples (2.5 L) were collected in solvent-rinsed amber glass bottles using trace organic-clean techniques at the same locations on deployment and retrieval of the POCIS samplers. These samples were intended to provide snapshot, non-integrated measures of polar organic contaminants in water at each study location. A single sample was taken at both deployment and retrieval for the Napa River and San Francisco Bay sites; duplicate grab samples were taken at both deployment and retrieval for the Coyote Creek site. A field blank was collected at the San Leandro Bay site by transferring LCMS-grade blank water from one amber glass bottle to another at the field site. Temperature, pH, conductivity, and turbidity were measured in the field with a YSI meter, and in some cases salinity and turbidity were also measured in grab samples in the laboratory.
Composite sampling of effluent
Flow-weighted 24-hour composite samples of WWTP effluent from four dischargers were collected via in situ autosamplers and transferred to 2.5 L amber glass bottles on September 7, 2016, within the period of the Coyote Creek POCIS deployment. Triplicate samples were collected at WWTP “Site D.” A field blank of LC-MS grade water was collected at one of the wastewater facilities by opening the bottle to air during the sampling period.
All ambient (passive and grab) and effluent (composite) samples were shipped on ice from SFEI (Richmond, CA) to Duke University (Durham, NC) overnight within 24 hours of collection.
Analytical methods
Sample preparation
Aliquots (1 L) of each water/wastewater sample, including all field blanks and laboratory blanks consisting of 1 L HPLC-MS grade water, were immediately filtered upon receipt using combusted (450º C) filters (< 0.45μm GF/F, Whatman) for particle removal and subsequently processed by solid-phase extraction using an automated SPE system (Autotrace 280, ThermoFisher Scientific, Sunnyvale, CA) fitted with Waters Oasis HLB SPE cartridges (500 mg sorbent, eluted with 6 mL 10% MTBE in methanol). Prior to extraction, all 1 L aliquots were spiked with isotope-labeled surrogate standards (17β-estradiol-d4, 3,6-dichloro-2-methyl-d3-benzoic acid, atrazine-d5, carbaryl-d7, DEET-d7, imidacloprid-d4, iprodione-d5, mecroprop-d4, metalaxyl-d6, prometon-d14, propanolol-d7, thiophanate-methyl-d6, tramadol-d6). All surrogate standards were prepared at 10 μg mL−1 in methanol and spiked at 25 μL for a final concentration of 250 ng L−1.
POCIS samples, including the POCIS field blanks, were disassembled carefully upon receipt at the laboratory. Prior to disassembly, biofouling was carefully removed using solvent-rinsed stainless steel implements. For each sample, the sorbent was transferred to a clean (450º C combusted) empty glass 6 mL syringe barrel with a PTFE frit, using LCMS-grade water rinses to ensure quantitative transfer. The sorbent bed was capped with another PTFE frit, and cartridge was dried under vacuum for 30 minutes; compounds were then eluted with 10% MTBE in methanol.
Extracts from POCIS and SPE elutions were concentrated to near-dryness using a SpeedVac centrifugal evaporator (ThermoFisher Scientific, San Jose, CA) and reconstituted with HPLC starting mobile phase (1 mL volume, 95:5 water:acetonitrile), then spiked with isotope-labeled internal standards (13C6-caffeine, d4-equilin) for final concentrations of 250 ng L−1. Triplicate aliquots were prepared for San Leandro Bay and Napa River samples; one Napa River replicate was lost during the preparation process. One aliquot was prepared per sample for Coyote Creek samples. Solvent blanks containing LC starting mobile phase (1 mL volume, 95:5 water:acetonitrile) were also prepared for analysis.
Sample analysis
All samples (1 mL final volume, in combusted amber glass LC-MS vials) were analyzed by ultra-high performance liquid chromatography (UHPLC, ThermoFisher Scientific Ultimate 3000) coupled to high-field orbital trapping mass spectrometry (ThermoFisher Orbitrap Fusion Lumos). Specifically, samples were separated using reversed phase UHPLC (Thermo Hypersil Gold column, 1.9 μm particle size, 2.1 x 100 cm) over a 45 minute gradient prior to introduction to the mass spectrometer through the electrospray ion source. The Orbitrap Fusion Lumos was operated at 240,000 mass resolution with internal mass calibration to achieve < 1 part per million (ppm) mass accuracy across the mass range of interest. High resolution detection of analytes in MS mode was performed by the Orbitrap analyzer, with subsequent data-dependent MS/MS performed in the Orbitrap via higher energy collisional dissociation (HCD) after selection of precursor ions in the quadrupole assembly. Ions for MS/MS analysis (approximately 15-20 precursors per second) were dynamically chosen on a per-scan basis, with priority given to accurate mass values corresponding to compounds in a compiled “suspect” list containing masses corresponding to polyethoxylated surfactant ethoxymer formulas (749 unique molecular formulas represented), with secondary priority given to “non-target” analytes in order of decreasing intensity. These MS/MS data provided fragment ion data to aid in identification for non-target analytes.
Data generated through these approaches were applied to both commercially-available (TraceFinder, Compound Discoverer, and MassFrontier, all from ThermoFisher Scientific, San Jose, CA) and custom-written (R programming language) processing software designed to aid in annotating polar organic compounds with molecular & structural formula based on HRMS/MS data. Specifically, a custom data processing node was written for use in Compound Discoverer 3.1 (CD), which allowed implementation of the RAMclust algorithm23 for molecular feature consolidation as well as dereplication of adducts, isotopes, and in-source fragments after feature detection by the component elucidator step of CD. Blank samples (both field and laboratory) were used in the feature detection step to remove artifacts and ubiquitous, blank-derived compounds from the data set. Features having maximum peak areas in the data less than five times that of the average blank peak area were marked as background and removed from further consideration.
Molecular and structural formula annotation of compounds detected in the LC-HRMS/MS data was focused at the level of “probable identity” according to commonly-used convention in non-targeted analysis routines12. Specifically, emphasis was placed on identifying compounds via searching against curated high resolution MS/MS spectral libraries. A second set of custom functions written in Python were used to assemble locally searchable versions of the NIST1724 and MassBank of North America (https://mona.fiehnlab.ucdavis.edu/) collections of HRMS/MS spectra. These libraries were combined with the commercial but freely accessible mzCloud (ThermoFisher Scientific) online spectral library using the CD library search interfaces, with further processing using a third custom-written software for harmonizing, validating, and concatenating outputs from the merged spectral library search results. Specifically, this software uses spectral score comparison and adduct detection logic to validate library matches and then assign structure annotation to non-targeted analytes from either mzCloud or mzVault (local NIST & MONA libraries) in cases where multiple library spectral matches were obtained for single detected compounds. The total non-redundant compound count in the three libraries used in this work was 21,945 unique structures. Compounds detected in the non-targeted analysis were considered to be annotated with a probable structure identity if they (1) passed upstream filtering by RAMClust and in-source fragment, adduct, and isotope detection, (2) had precursor m/z values within 1.5 ppm of the theoretical value for the proposed molecular formula, and (3) gave spectral library match scores > 75 using the HighRes algorithm (HighChem, Bratislava, Slovakia), which uses a statistically-based algorithm incorporating Spearman rank order correlation using independent m/z and abundance coefficients for query and library spectra. The match score threshold of 75% was determined empirically through repeated analysis of known compounds in our laboratories. Specifically, it was found that a library score threshold of 75 was sufficient to correctly annotate compounds in our target list of 65 analytes from calibration curve samples (n = 7 injections) for which mzCloud, NIST, or MONA library spectra were available. Final validation of proposed structural identities was made based on authentic standard match wherever possible.
In cases where authentic standards were available for compounds detected through the non-targeted analysis approaches described above, quantitative calibration curves were prepared relative to the isotope-labeled surrogate and internal standards that were added to samples prior to analysis. Samples were injected in a randomized sequence with interleaved calibration standards. Quantitation was performed via reference to surrogate and internal standards to account for instrument drift and any slight injection-to-injection variability. Field & laboratory blanks were analysed to assess contamination and carryover (which was observed to be negligible in these analyses). In this way, ambient concentrations of organic pollutants in grab samples were measured, and total “burdens” of compounds in POCIS extracts were determined.
Estimating Dissolved Pollutant Concentrations from Passive Sampler Measurements
We utilized previously reported, compound-specific sampling rates wherever possible to calculate the time-weighted average (TWA) concentration (ng L−1) of quantified analytes measured in the POCIS samplers for each sampling site. For this calculation, we assumed first-order kinetics and used the following linear relationship:
where M is the total mass of analyte accumulated in the sampler (ng), Rs is the sampling rate (L d−1), and t is the exposure time (days)25.
Published sampling rates were selected from the best available values in the scientific literature. Specifically, we selected sampling rates from similar coastal or estuarine studies where available; where unavailable, we included sampling rates calculated for freshwater systems. Sampling rates calculated under quiescent conditions were not used in this study, as they would not accurately mimic the conditions found at our sampling sites (which tend to be dominated by tidal and/or estuarine flushing). A full table of sampling rates and their literature sources can be found in Table SI-3.
We evaluated correlations between POCIS TWA concentrations and water grab concentrations (both deployment and retrieval) for each sampling site. Statistical assessments were performed by determining the slope and confidence interval (p = 0.05) for linear models using each set of measurements; if the confidence interval included a slope value of 1, the data were considered to be consistent with a 1:1 relationship.
Results and Discussion
Quantitative measurements of organic pollutants in SF Bay Water
Although the primary focus of the current study was on non-targeted approaches to identify novel emerging contaminants in the SF Bay estuary, we took advantage of the opportunity available to make quantitative measurements of emerging contaminants that were either pre-targeted with standards or were confirmed in samples after non-targeted analysis and for which analytical standards were readily obtainable. The list of compounds targeted for quantitation in the LC-HRMS/MS data consisted of 65 compounds representing an assortment of pesticides, pharmaceuticals, and corrosion inhibitors. After data analysis, 38 of the 65 target compounds were detected in at least one sampling location, and all but one of these were quantified at levels above the reporting limit in at least one sample (Table 1). The reporting limit was defined as the lowest quantifiable calibration concentration for each analyte of interest (between 0.6 – 1.2 ng L−1 in water, compound-dependent).
Table 1.
Measured concentrations (ng L−1) of polar organic contaminants in grab water and composite effluent samples from the San Francisco Bay. Water sample measurements are given for both deployment and retrieval dates at each sample site. Missing values represent non-detects at the reporting limit (0.6 – 1.2 ng L−1). Values shown are the means of three laboratory replicates for each site sample (n=3) for Napa River, Effluent C, and San Leandro Bay samples, and the means of two field replicates (n=2) for Coyote Creek samples. Concentrations given without a standard deviation represent a single sample & measurement for each site (n=1).
| Coyote Creek |
Napa River |
San Leandro Bay |
Wastewater |
|||||||
|---|---|---|---|---|---|---|---|---|---|---|
| Deploy | Retrieval | Deploy | Retrieval | Deploy | Retrieval | Effluent A | Effluent B | Effluent C | Effluent D | |
| Pesticides | ||||||||||
|
| ||||||||||
| Atrazine | 2.2 ± 0.1 | 0.23 ± 0.1 | 0.98 | |||||||
| Atrazine-desisopropyl | 1.9 ± 0.3 | 0.34 | ||||||||
| Azoxystrobin | 0.5 ± 0.0 | 0.8 ± 0.1 | 3.5 | 4.3 ± 0.1 | 1.2 ± 0.2 | 1.2 ± 0.1 | 2.2 | 1.0 | 2.4 ± 0.1 | 6.9 |
| Benomyl | 1.6 ± 0.0 | 0.90 ± 0.8 | 56 | 7.3 | 13 ± 0.1 | 20 | ||||
| Carbendazim | 15 ± 0.6 | 21 ± 7 | 1.6 | 1.4 ± 0.7 | 8.4 ± 0.7 | 3.8 ± 1 | 82 | 103 | 77 ± 3 | 152 |
| DEET | 4.9 ± 0.2 | 13 ± 1 | 3.4 ± 0.0 | 8.1 ± 0.6 | 11 ± 1. | 165 | 40 | 43 ± 0.4 | 11 | |
| Fluoxastrobin | 0.18 ± 0.05 | 0.33 ± 0.2 | ||||||||
| Fluridone | 3.4 ± 0.04 | 3.8 ± 0.1 | 2.3 | 2.0 ± 0.1 | 0.71 ± 0.03 | 0.83 ± 0.04 | 1.8 | 4.5 ± 0.08 | 9.1 | |
| Flutolanil | 0.2 | 0.14 ± 0.04 | ||||||||
| Halosulfuron-methyl | 0.88 | |||||||||
| Imazapyr | 0.66 ± 0.2 | 1.4 ± 0.1 | 1.2 ± 2 | 1.1 | 1.9 ± 0.2 | 1.3 | ||||
| Metalaxyl | 0.58 ± 0.5 | 0.15 ± 0.1 | 0.61 | |||||||
| Metsulfuron-methyl | 1.6 | |||||||||
| Oxadiazon | 0.20 ± 0.02 | 0.56 ± 0.4 | 5.8 ± 0.6 | 15 ± 0.7 | 1.2 | 2.4 | 0.31 ± 0.4 | 9.5 | ||
| Prometon | 0.18 ± 0.03 | 1.9 ± 0.2 | 1.4 ± 0.01 | 0.12 | 5.8 | |||||
| Pronamide | 0.15 | |||||||||
| Propiconazole | 0.64 ± 0.3 | 1.5 ± 1 | 0.69 | 11 ± 3 | 26 ± 1 | 3.0 | 1.9 | 2.6 ± 0.7 | 17 | |
| Quinclorac | 0.51 ± 0.2 | 1.5 ± 1 | 0.71 | |||||||
| Simazine | 0.82 ± 0.1 | 0.79 ± 0.1 | 11 | 9.8 ± 0.7 | 1.9 ± 0.2 | 1.8 ± 0.08 | 1.9 | 0.089 | 2.6 | |
| Sulfapyridine | 2.3 ± 0.2 | 6.2 ± 2 | 0.068 | 0.38 | 58 | 30 | 104 ± 3 | 107 | ||
| Tertbutylazin-desethyl | 0.82 ± 0.1 | 0.79 ± 0.1 | 11 | 9.8 ± 0.7 | 1.9 ± 0.2 | 1.8 ± 0.08 | 1.9 | 0.089 | 2.6 | |
| Thiencarbazone-methyl | 0.63 | |||||||||
|
| ||||||||||
| Pharmaceuticals | ||||||||||
|
| ||||||||||
| Carbamazepine | 35 ± 0.6 | 1.5 ± 0.02 | 2.6 ± 0.5 | 2.2 ± 0.07 | 121 | |||||
| cis-Diltiazem | 0.75 ± 0.02 | 3.5 ± 0.6 | 0.37 | 0.48 ± 0.3 | 0.15 ± 0.01 | 31 | 42 | 75 ± 2 | 70 | |
| Citalopram | 0.65 ± 0.06 | 1.3 ± 0.1 | 0.115 | 0.079 ± 0.0 | 0.29 ± 0.31 | 8.5 | 75 | 75 ± 3 | 39 | |
| Dextromethorphan | 1.3 ± 0.1 | 3.7 ± 0.2 | 0.47 ± 0.3 | 6.5 | 34 | 32 ± 5 | 38 | |||
| Diphenhydramine | 0.46 ± 0.1 | 0.91 ± 0.2 | 78 | 29 | 44 ± 3 | 68 | ||||
| Genistein | 0.43 | 27 ± 1 | 0.53 ± 0.2 | 1.1 ± 0.2 | ||||||
| Iminostilbene | 19 ± 0.4 | 34 ± 0.3 | 1.6 | 1.5 ± 0.3 | 2.3 ± 0.2 | 2.1 ± 0.4 | 95 | 125 | 103 ± 3 | 126 |
| Irbesartan | 3.4 ± 0.05 | 8.8 ± 0.1 | 0.56 | 0.43 ± 0.04 | 42 | 55 | 101 ± 6 | 104 | ||
| Pramoxine | 0.064 ± 0.1 | |||||||||
| Propanolol | 0.78 ± 0.1 | 2.1 ± 0.1 | 0.14 | 0.20 | 4.9 | 29 | 21 ± 0.2 | 29 | ||
| Rosuvastatin | 0.88 | 56 | 3.4 ± 0.07 | 9.1 | ||||||
| Sulfamethoxazole | 27 ± 0.02 | 63 ± 0.9 | 0.97 | 0.97 ± 0.2 | 3.5 ± 0.6 | 1.8 ± 0.2 | 128 | 150 | 208 ± 48 | 156 |
| Trimethoprim | 1.6 ± 0.01 | 0.90 ± 0.8 | 56 | 7.3 | 13 ± 0.08 | 20 | ||||
| Verapamil | 0.57 ± 0.01 | 0.66 ± 0.06 | 0.47 | 0.49 ± 0.01 | 0.96 ± 0.7 | 0.58 ± 0.04 | 5.5 | 43 | 30 ± 0.5 | 27 |
|
| ||||||||||
| Corrosion Inhibitors | ||||||||||
|
| ||||||||||
| Benzotriazole | 346 ± 40 | 792 ± 9 | 4.3 | 17 ± 2 | 38 ± 2 | 31 ± 4 | 1252 | 701 | 606 ± 10 | 1443 |
As expected, organic pollutant concentrations were typically highest in WWTP effluent for most compounds measured (Table 1). Several pharmaceuticals and pesticides observed in effluent were more frequently detected and were observed at slightly elevated concentrations at the wastewater-influenced Coyote Creek site relative to the other SF Bay sites, although the concentrations were still generally low (≤ 15 ng L−1). Higher levels of the corrosion inhibitor benzotriazole (up to 1,400 ng L−1) were also observed in the WWTP effluent samples, although these levels are somewhat lower than treated effluent concentrations of this compound reported in other environments (typically > 10 000 μg L−1)26, 27, suggesting either lower abundance in the influent or higher degree of removal during treatment in the current study. Benzotriazole and related compounds are abundant and persistent contaminants widely reported as wastewater pollutants around the world26–29, and it may thus be considered as a source/pathway indicator for this pollutant source. Benzotriazole was the most abundant targeted micropollutant measured in SF Bay water, reaching levels of nearly 800 ng L−1 in Coyote Creek, consistent with the elevated inputs of treated wastewater at this location. Polar organic pollutants measured in Napa River samples were predominantly agricultural herbicides and other pesticides such as azoxystrobin, simazine, and terbuthylazine-desethyl, all measured at low ng L−1 levels. All of these compounds are consistent with use and discharge in heavily agricultural areas and eventual occurrence in the Bay’s tributaries. San Leandro Bay samples were notable for detections of turf pesticides at low ng L−1 levels, such as carbendazim and oxadiazon. This may be indicative of discharge of stormwater runoff from suburban/peri-urban landscapes on which these pest management chemicals are applied. Carbendazim is also used as a preservative in paint, and can be mobilized from this source into urban and suburban stormwater30. Overall, concentrations of emerging polar organic contaminants reported here were consistent with previous measurements of pharmaceuticals, personal care products, and other organic pollutants in estuarine waters of San Francisco Bay2 as well as other urbanized estuaries such as the Hudson River estuary16 and Puget Sound17.
Comparison of organic contaminants in POCIS and grab samples
Polar organic contaminants listed in Table 1 were also measured in POCIS extracts, allowing the opportunity to examine the relationship between grab sample water concentrations and those derived from the total burdens accumulated by the passive samplers. For all three sampling sites, we therefore assessed the association between estimated POCIS TWA concentrations for quantifiable pollutants and the concentrations in deployment and retrieval grab samples for each compound measured.
With respect to selection of POCIS sampling rates (Rs) for compounds of interest, we utilized the best available data that could be located in published literature for compounds of interest. Ultimately, Rs values are approximations rather than definitive numbers: many experimental, compound-specific, and exposure-specific factors can influence the sampling rate for a given compound31. Several key variables must be considered when selecting Rs literature values for use in data analysis. Most crucially, it is known that water flow has the greatest influence on Rs values: Harman et al. reviewed five studies comparing flow rates of compounds at varying water turbulences, and each study determined that Rs values increase multiple-fold between quiescent and flow circumstances31. Salinity can also affect POCIS Rs values, particularly for basic compounds32. However, as the “salting-out” effect increases with compound size and decreases with compound polarity33, salinity should in fact have minimal effect for most POCIS analytes of interest. Given these considerations, while we prioritized use of published sampling rates developed from studies of coastal or estuarine settings, where these were unavailable, we utilized sampling rates calculated in freshwater flow systems (Table SI-3).
For accurately applied sampling rates and POCIS samplers in equilibrium with waters having stable organic pollutant concentrations, a 1:1 relationship should exist between measured water concentrations and predicted TWA concentrations based on Rs values31, 34. Our results (Figure 2) indicate that while POCIS TWA concentrations were generally concordant with grab concentrations, only a few had statistically significant 1:1 correlations. Both deployment and retrieval grab samples from Napa River (Figure 2B) had a statistically significant 1:1 relationship with POCIS samples (p < 0.05), while for San Leandro Bay (Figure 2C) this was only true for the retrieval samples. Neither deployment nor retrieval samples had statistically significant 1:1 correlations with POCIS at the Coyote Creek site (Figure 2A). It should be noted that many additional environmental parameters may have influenced the observed relationship between POCIS-derived TWA concentrations and measured grab samples in this study, including colloid- or NOM-associated pollutants, which may have been under sampled by POCIS but captured in grab sample analysis.
Figure 2.

Relationship between calculated POCIS-based time-weighted average (TWA) water concentrations of polar organic pollutants and dissolved concentrations measured in grab samples taken at POCIS deployment (•) and retrieval (Δ) for Coyote Creek (A), Napa River (B), and San Leandro Bay (C). POCIS accumulated organic contaminant burdens were converted to a time-weighted average (TWA) concentration (ng L−1) using sampling rates from the literature, as described in the text. A table of these sampling rates can be found in Supplementary Information (Table SI-3). Dashed lines represent a hypothetical 1:1 relationship.
The presence of a significant correlation between measured grab samples and modeled TWA from POCIS measurements may reflect the relative similarity or difference in concentrations sampled at each site and by each technique, as influenced by different contamination pathways. Napa River is known to be predominantly impacted by agricultural runoff, a pathway that can receive discharges contaminated with seasonal applications of pesticides; the observed correlation for those samples suggests that such applications may have remained fairly constant during the 21-day POCIS deployment period during the spring. This hypothesis is further supported by the relatively consistent deployment and removal grab sample concentrations, particularly for those contaminants observed at higher levels (Table 1). Napa River also experienced a less diverse and lower-concentration contaminant burden than the other ambient sites (Table 1 and discussed below).
San Leandro Bay, meanwhile, was most likely impacted primarily by stormwater (see discussion below), and thus is subject to episodic inputs of contaminants depending on the amount of rainfall and proximity of point contaminant sources. Table 1 suggests that San Leandro Bay had a more diverse and slightly higher-concentration contaminant burden at the time of deployment than at the time of retrieval, consistent with this pathway. In a stormwater-impacted site such as San Leandro Bay, the integrated contaminant profile provided by the POCIS is likely a reflection of the change over the deployment period from the time of deployment to the time of retrieval instead of a representation of sampler equilibrium with a relatively stable organic contaminant input loading. It is therefore reasonable that the poor agreement would likely be observed for modeled vs. measured concentrations of organic pollutants in San Leandro Bay. Interestingly, all of the water sample measurements in Figure 2C for San Leandro Bay fell above the 1:1 line, further suggesting that the POCIS sampler at this site may not have reached equilibrium with water samples, hence underpredicting water concentrations after TWA calculation.
As illustrated by the data in Table 1, Coyote Creek was likely most heavily influenced by organic pollutant inputs from proximal wastewater treatment discharge. The relationship between measured contaminant water concentrations and POCIS TWA at this site (Figure 2A) suggests a different and non-linear relationship, compared to the other two sites measured. Specifically, although compounds that were present at higher water concentrations (> ~ 1 ng L−1) showed good agreement between modeled and measured concentrations, a departure from this agreement was observed for compounds with lower POCIS loadings. It is possible that these low-concentration compounds were highly variable in discharge from wastewater and were thus captured at relatively high concentrations in grab samples while being under-sampled by the POCIS device.
Overall, our results suggest that POCIS samplers may be useful as quantitative predictors of contaminant concentrations in ambient water, depending upon the pathway impacting the ambient water site and flow conditions at that site. Further work will be required to fully parameterize this behavior for individual chemicals and explore the limitations with respect to chemical structure, molecular weight, solubility, and hydrophobicity.
Non-targeted analysis
Non-targeted analysis of POCIS and grab samples from the three ambient SF Bay sites (San Leandro Bay, Coyote Creek, and Napa River) as well as composite samples from four WWTP effluents using LC-HRMS/MS via positive electrospray ionization resulted in the detection of 6,348 unique molecular species after rigorous removal of isotope peaks, redundant adducts, in-source fragment ions, blank contaminants, and noise artifacts from the data. The resulting set of non-redundant compounds detected across the full set of samples (Figure 3) covered a wide range of molecular weights (< 200 to > 2500 Da), and hydrophobicities (chromatographic retention times) across more than 4 orders of magnitude of mass spectral abundance (i.e. chromatographic peak area). Notably, there were relatively few poorly-retained (low retention time) compounds detected, possibly reflecting a bias in both POCIS and SPE sampling toward compounds that are efficiently extracted by the applied adsorbents. Of these compounds, high-quality spectral library matches (> 75% match score) were obtained for 424 unique compounds, which were then annotated as probable structural identifications12. Names, InChIKey identifiers, molecular formulas, spectral library match scores, and mass measurement errors for these 424 probable identifications are given in Table SI-7.
Figure 3.
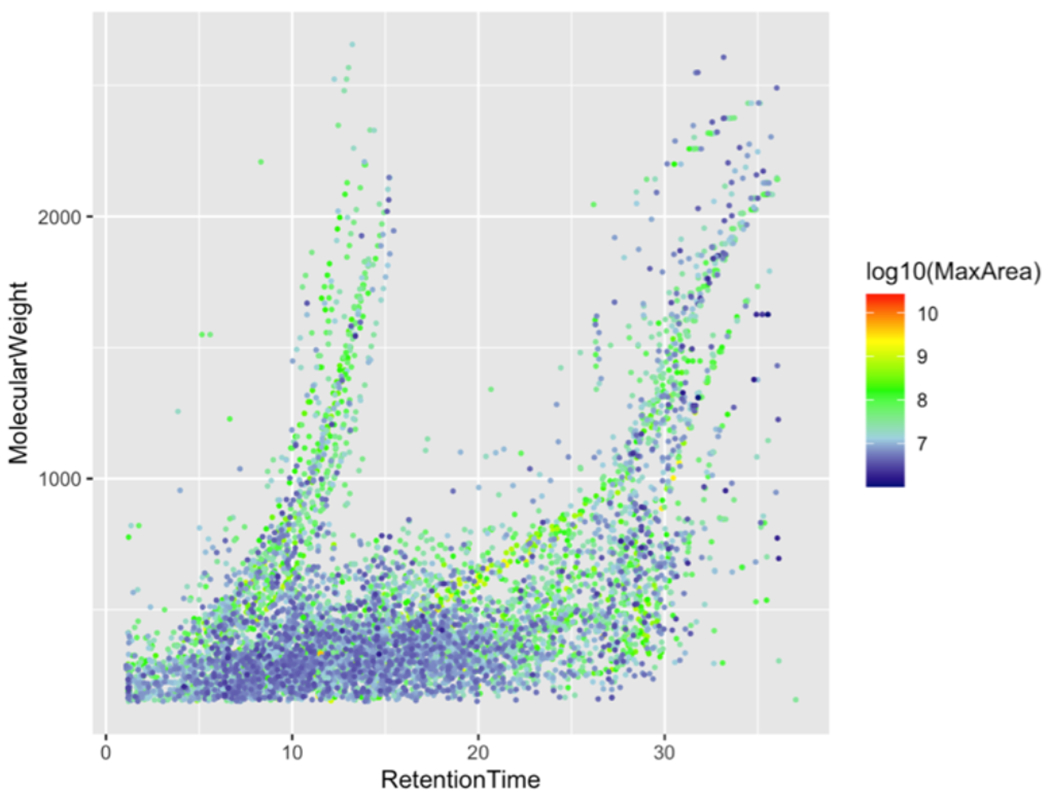
Molecular weight vs. retention time map of non-redundant compounds detected in Bay water POCIS and WWTP effluent extracts. Compounds are colored by log 10 transformed maximum peak area.
Ethoxylated surfactants in SF Bay waters
Close examination of Figure 3 revealed multiple series of repeating molecular patterns wherein compounds aligned along arcs in retention time vs. molecular weight space. These arcs were found to represent sets of polymeric organic compounds, principally surfactants, which were present at relatively high intensities in SF Bay waters. Important members of these polymeric surfactant series include the alkylphenol ethoxylate surfactants (nonylphenol and octylphenol ethoxylates, which are known to be precursors of endocrine-disrupting alkylphenols35–37), alcohol ethoxylate surfactants, and polyethylene and polypropylene glycol. These compound classes are ubiquitous in industrial, consumer, and commercial applications and find their way into the ambient environment through discharge of treated wastewater36, 38, 39, stormwater runoff18, direct application in cleaning products, use in firefighting foam40 and as adjuvants in pesticides41.
Conventional wisdom, informed by many years of research35, 36, 42, 43, has indicated that polyethoxylated and polypropoxylated surfactants are readily degraded during biological (i.e., secondary) wastewater treatment. It is therefore unusual to find elevated abundances of polymeric surfactants of these types in treated wastewater. Indeed, most of the monitored polymeric surfactants showed higher peak area profiles in ambient waters than in WWTP effluents (Figure 4), with the notable exception of the polypropylene glycol series and the C9 and C13 alcohol ethoxylate series. In the case of polypropylene glycol, these compounds may actually be formed during the biological treatment process through cleavage of the ether linkage of polypropoxylated surfactants at the surfactant’s hydrophobic portion (hydrophobe), leading to the release of polypropylene glycol, which is likely slower to degrade than polyethylene glycol due to its branched structure. The hydrophobes of both C9 and C13 alcohol ethoxylate surfactants are synthesized from a petrochemical feedstock and are thus predominantly branched alcohols. This branched structure may make these compound classes more recalcitrant toward biological wastewater treatment and thus more likely to accumulate in treated wastewater.
Figure 4.

Peak area profiles for polymeric surfactants present in ambient Bay grab samples and WWTP effluent samples. Each graph is plotted with various chain lengths for each class of ethoxylates on the x-axis and with measured peak areas for each chain length on the y-axis. NR = Napa River, SLB = San Leandro Bay, CC = Coyote Creek.
The polyethoxylated surfactant peak intensity profiles in Figure 4 illustrate surprisingly high peak areas for linear (even-numbered alkyl chain) alcohol ethoxylates as well as alkylphenol ethoxylate surfactants in grab samples of water collected from San Leandro Bay and Coyote Creek. San Leandro Bay in particular is strongly influenced by urban stormwater runoff, and the presence of what appear to be relatively elevated peak areas for “undegraded” mixtures of (relatively labile) alcohol and alkylphenol ethoxylate surfactants at this site may indicate that wastewater input is not the most important pathway for the discharge of polymeric surfactants to the SF Bay. Ethoxylated surfactants have recently been observed as significant stormwater-related contaminants in a non-targeted screening study of road runoff and urban creeks in Seattle, WA18 as well as the receiving waters of the Puget Sound17. This may be important when considering the elevated estrogenicity of alkylphenol ethoxylate degradation products, such that stormwater could prove to be a heretofore under-appreciated pathway for endocrine disruptor precursors to enter the aquatic environment. In addition, the alcohol ethoxylate surfactants, although typically considered readily degraded particularly via wastewater treatment, may be of concern due to potential aquatic toxicity1.
Detections of ethoxylated surfactants at the Coyote Creek site, in contrast, may be derived from treated wastewater effluent and/or urban runoff. While this site was selected to highlight the contributions of wastewater to environmental contamination of SF Bay, and sampled during the dry season, the influence of runoff (stormwater and dry season) cannot be discounted. A previous targeted study of a limited number of alkylphenol ethoxylates in SF Bay matrices found 4-nonylphenol in San Leandro Bay water (43 ng L−1), but did not detect it in water collected from the Lower South Bay2. In contrast, sediments from this Lower South Bay site contained the highest levels of 4-nonylphenol and its mono- and diethoxylates observed in SF Bay (86, 40, and 19 ng g−1 dry weight, respectively)17.
Non-polymeric contaminants identified in WWTP effluents and ambient waters
The 424 unique, high-confidence, level-2 tentatively identified compounds, which were identified through non-targeted analysis as described above, were clustered according to similarity in peak area with respect to compound identity and sample location. The heat map shown in Figure 5 presents a summary of the non-targeted analysis results for these 424 compounds in ambient Bay water grab samples and WWTP effluent. In this display, each compound is represented by a row in the heat map, and compound peak areas have been scaled to the range 0 - 1 across rows, such that intensities in the heat map should be compared only on a row-wise basis. Compounds were clustered according to Euclidean distance across rows by similarity in their profiles among samples, while samples are clustered across columns by similarity in compound abundance profiles. From the intensity color scale, it is visually apparent that WWTP effluents exhibited the highest peak areas for most of the compounds detected, with notable exceptions for clusters of compounds that were more abundant in ambient Bay water samples. Replicate extractions and analyses of WWTP effluent C and SF Bay water samples (deployment and retrieval grabs) clustered together, illustrating good analytical reproducibility.
Figure 5.

Relative (heat map) and absolute (horizontal bars) intensities of the 424 compounds detected through non-targeted analysis of water and wastewater samples, which were annotated at the level of probable structure (See Table SI-7 for the full compound list). Each row represents a single compound and each column represents a discrete sample. The sample source (e.g. WWTP effluent or Bay water collection site) is color-coded along the bottom of the heat map. Water samples marked “D” were collected on POCIS deployment, while “R” indicated samples collected at retrieval. The same color scheme indicates the site from which the absolute peak area intensities for each compound (horizontal bars on the right side of the figure) is derived.
Figure 5 reveals differences in compound abundance profiles among the four WWTP effluents measured in this study. It is notable that, when samples were clustered across columns by compound abundance similarity as shown in Figure 5, WWTP A and WWTP D clustered together but did not cluster near the other WWTPs. These differences may reflect unique “sewersheds” with distinct pollutant input profiles (e.g., from specific industries or commercial activities), variations in wastewater treatment technologies and implementation, or both. Regardless, it is clear that, at least for the purposes of this study, WWTP effluent cannot be treated as a uniform pathway for defined organic pollutants. In fact, non-targeted pollutant profiling may prove useful in apportioning WWTP effluent upstream sources through assessment of contaminant fingerprints.
Across the ambient SF Bay water samples, inspection of Figure 5 shows that the Coyote Creek waters were the most wastewater-impacted. The light blue/white coloration in Coyote Creek sample columns near the top of the heat map (corresponding to intense clusters of red in most of the WWTP effluents) indicates that Coyote Creek may contain diluted effluent signatures. By contrast, the deep blue coloration shown in the San Leandro Bay sample columns demonstrates a striking difference in organic pollutant intensity profiles from the intense red clusters in the WWTP effluents, indicating that wastewater was likely not a dominant contributor to the pollutant burdens of these waters. Additionally, the retrieval and deployment grab samples from San Leandro Bay and Coyote Creek (taken three weeks apart) were sufficiently distinct in contaminant profile that they clustered together by replicates but apart by sampling dates. This clustering indicates that contaminant burdens at the San Leandro Bay and Coyote Creek sites were not static and that temporally-distinct profiles may evolve through variation in inputs. Interestingly, a NOAA precipitation gage near San Leandro Bay (Oakland, 4.4 NNW) recorded rain immediately prior to deployment at San Leandro Bay; no rainfall occurred immediately prior to retrieval at San Leandro Bay. Compared to both the Coyote Creek samples and San Leandro Bay samples, the Napa River samples showed low relative peak areas for nearly all compounds detected via non-targeted analysis, indicating a relatively clean system with low inputs of wastewater and urban stormwater.
The horizontal bar chart on the right side of Figure 5 shows, for each compound tentatively identified, the maximum scaled peak area detected in the sample set. These bars are colored according to which sampling location gave the highest peak area. The predominance of black bars illustrates the large abundance of organic pollutants in WWTP effluent relative to ambient SF Bay waters. However, several clusters of relatively high peak areas were observed for compounds in ambient water. Tables 2 – 5 present the top 10 (or six in the case of the Napa River) most intense (based on chromatographic peak area) non-polymeric compounds having probable structure annotations from Figure 5 (and Table SI-7) that had maximum peak areas in WWTP effluent or ambient SF Bay water grab samples. For example, for a compound to appear in Table 3 (which shows the top compounds with maximum peak areas in San Leandro Bay), it must be present in Figure 5, and the maximum peak area observed for that compound across all WWTP effluent and ambient Bay grab samples must have been observed in a San Leandro Bay sample. Furthermore, peak area for that particular compound must be among the top 10 highest peak areas for compounds with maximum peak areas observed in San Leandro Bay water samples.
Table 2.
Ten most abundant non-polymeric compounds with maximum peak area identified at the probable structure level in WWTP effluent samples.

|
Table 5.
Six most abundant non-polymeric compounds with maximum peak area identified at the probable structure level in Napa River samples.

|
Table 3.
Ten most abundant non-polymeric compounds with maximum peak area identified at the probable structure level in San Leandro Bay samples.

|
The ten most abundant compounds identified through non-targeted analysis with maximum peak area identified in one of the WWTP samples are shown in Table 2. Most intense among these was the compound fexofenadine, which is an over-the-counter antihistamine drug (active ingredient in Allegra). This compound is widely used and is known in the literature to be recalcitrant to wastewater treatment44. The remaining compounds in Table 2 represent pharmaceutical drugs, transformation products, industrial chemicals, the insect repellant DEET, and an oxidation product of natural fatty acids. Overall, these tentatively identified compounds detected in WWTP effluent as presented here are consistent with what would be expected from municipal wastewater in the developed world13,45. These data confirm that WWTP effluents represent significant pathways for numerous pharmaceuticals and industrial/consumer chemicals to enter the aquatic environment.
The compounds shown in Table 3 represent the ten most abundant non-polymeric compounds with maximum peak area identified in San Leandro Bay water samples. This list represents a set of compounds that is quite distinct from compounds often found in wastewater or other point-sources of organic pollution to the aquatic environment. Specifically, the table includes rubber polymer additives (e.g., hexa(methoxymethyl) melamine [HMMM] and trialkyl phosphates), rubber vulcanization additives (e.g., N,N’-diphenylguanidine [DPG]), a cyclic silicone oligomer, a designer drug (MTTA), and the fungicide propiconazole. HMMM is a newly recognized aquatic environmental environmental contaminant that has been found to be associated with polymers and rubber components used in the automotive industry, with consequent input to waters through stormwater discharge from roadways18,46. Likewise, the vulcanization agent DPG has recently been indicated as a prominent tire rubber-derived component of urban stormwater runoff entering Puget Sound, where it reached concentrations > 500 ng L−1 in receiving waters47. In addition, silicone additives are used in numerous consumer and industrial products, while fungicides such as propiconazole are often applied by businesses and homeowners on lawns, gardens, and suburban green spaces. Taken together, the prominence of the compounds annotated in Table 3 suggest that San Leandro Bay is heavily influenced by contaminants in urban runoff, including tire-wear particles, plastics and their associated additives, and compounds used in consumer products, wood preservation, and lawn care. These tentative identifications in the San Leandro Bay samples indicate that stormwater may introduce novel, rarely studied polar organic pollutants to the ambient waters of SF Bay. More study is needed to assess the quantitative importance of this pathway, and to assess the implications for aquatic life.
Table 4 shows the ten most abundant non-polymeric compounds with maximum peak area, which were identified in Coyote Creek samples via non-targeted analysis. Compounds prominent in the table are reflective of plastic and polymer materials. In particular, compounds such as bis(2,2,6,6-tetramethyl-4-piperidyl) sebacate (also known as Tinuvin 770) and didodecyl 3,3’-thiodipropionate oxide are known to be used as additives in thermoplastic polymers such as polyolefins. Tinuvin 770 is a hindered amine light stabilizer (HALS) known to cause contact dermatitis in human exposure48. Didodecyl 3,3’-thiodipropionate oxide is an antioxidant, commonly applied to plastic materials. To our knowledge, this is the first report of the occurrence of either of these compounds in ambient waters after discharge. It is likely that these compounds either leached directly into the water from plastic debris or were discharged along with treated wastewater. Coyote Creek also showed relatively high peak areas for cationic surfactants such as cetrimonium and benzyldodecyldimethylammonium ions. Both of these quaternary ammonium compounds are used as consumer antiseptics and antimicrobial agents and have been previously reported as prominent contaminants in wastewater-influenced environments (particularly in sediments)49,50. It is likely that they persist in the ambient environment after discharge through wastewater or stormwater, due to low biodegradability and tendency to adsorb to negatively-charged mineral surfaces51.
Table 4.
Ten most abundant non-polymeric compounds with maximum peak area identified at the probable structure level in Coyote Creek samples.

|
Compared to other SF Bay sites, Napa River samples showed little evidence of diverse organic pollutant contamination (Table 5). Only six compounds were found to have maximum peak area in Napa River samples, and only seven compounds total were tentatively identified in grab samples from Napa River water, all but one of which were pesticides. Three of these compounds were also quantified and reported in Table 1. The insecticide methoxyfenozide, the herbicides simazine (and transformation product 2-hydroxysimazine) and atrazine, and the fungicides azoxystrobin and fluopyram were detected with highest peak area in Napa River water. These data are consistent with the land use patterns in the Napa River watershed, which are dominated by wine-growing agricultural activities.
Conclusions
A comprehensive, non-targeted analysis of polar organic micropollutants inSF Bay using a study design informed by the influence of contaminant pathways has provided critical data to diagnose contaminant sources and pathways and to inform risk-based monitoring priorities for the future in the region. Among the 424 high-quality spectral library matches obtained from analysis of POCIS and grab samples, close examination showed sets of polymeric, ethoxylated surfactants – alkylphenol ethoxylates, alcohol ethoxylates, and polyethylene and polypropylene glycol – present at relatively high intensities in SF Bay waters. These polyethoxylated surfactants were present at surprisingly high relative abundances in both the stormwater-influenced site (San Leandro Bay) and the wastewater-influenced site (Coyote Creek), indicating that wastewater input may not be the most important pathway for discharge of polymeric surfactants to the San Francisco Bay. More work is needed to quantify the extent of ethoxylated surfactant contamination within the Bay.
Results from analysis of the stormwater-influenced site, San Leandro Bay, also indicated that urban stormwater runoff contains detectable levels of other potentially harmful polar organic contaminants. Stormwater-derived compounds identified with high confidence include DPG and HMMM, both likely derived from vehicle tires. The European Chemicals Agency has established predicted no effect concentration (PNECs) for DPG of 30 μg L−1 in freshwater and 3 μg L−1 in marine waters (ECHA 2018). While the non-targeted analysis data presented here provides qualitative data only, the high relative strength of the DPG signal in San Leandro Bay suggests that this contaminant has the potential to be present at concentrations similar to PNECs. Meanwhile, the detections of pharmaceuticals, antimicrobial surfactants, pesticides, plastic additives, and transformation products suggest these contaminant classes may merit additional investigation. Collectively, these results demonstrate that non-targeted analysis of sites influenced by different contaminant pathways can inform future targeted emerging contaminant monitoring by helping to identify new potential contaminants of concern without specific a priori knowledge of their use and/or discharge to receiving waters.
Supplementary Material
Acknowledgements
Funding for this study was provided by the Regional Monitoring Program for Water Quality in San Francisco Bay. Special thanks to the four Bay Area wastewater treatment plants that voluntarily participated in this study. Additional thanks to K.H. Sutton, P. Kim and P.R. Trowbridge for assistance in POCIS deployment, and to the East Bay Regional Parks District for 2016 Permit 839 allowing sampling in San Leandro Bay. A. Gilbreath compiled watershed information on sample sites, M. Salomon provided GIS expertise for creation of Figure 1, E. Kolodziej provided valuable analytical insights, and B. Arnold J. Davis, M. Foley, D. Greig, G. LeFevre, K. Moran, D. Muir, and J. Orlando, provided useful comments. G Getzinger developed data processing code used in the non-targeted analysis workflow.
Footnotes
Conflicts of interest
There are no conflicts to declare.
Electronic Supplementary Information (ESI) available: [details of any supplementary information available should be included here]. See DOI: 10.1039/x0xx00000x
References
- 1.Thomas KV and Hilton MJ, The occurrence of selected human pharmaceutical compounds in UK estuaries, Mar Pollut Bull, 2004, 49, 436–444. [DOI] [PubMed] [Google Scholar]
- 2.Klosterhaus SL, Grace R, Hamilton MC and Yee D, Method validation and reconnaissance of pharmaceuticals, personal care products, and alkylphenols in surface waters, sediments, and mussels in an urban estuary, Environ Int, 2013, 54, 92–99. [DOI] [PubMed] [Google Scholar]
- 3.Benotti MJ and Brownawell BJ, Distributions of pharmaceuticals in an urban estuary during both dry- and wet-weather conditions, Environ. Sci. Technol, 2007, 41, 5795–5802. [DOI] [PubMed] [Google Scholar]
- 4.Kolpin DW, Furlong ET, Meyer MT, Thurman EM, Zaugg SD, Barber LB and Buxton HT, Pharmaceuticals, hormones, and other organic wastewater contaminants in US streams, 1999-2000: A national reconnaissance, Environ. Sci. Technol, 2002, 36, 1202–1211. [DOI] [PubMed] [Google Scholar]
- 5.Muir DCG and Howard PH, Are there other persistent organic pollutants? A challenge for environmental chemists, Environ. Sci. Technol, 2006, 40, 7157–7166. [DOI] [PubMed] [Google Scholar]
- 6.Howard PH and Muir DCG, Identifying New Persistent and Bioaccumulative Organics Among Chemicals in Commerce, Environ. Sci. Technol, 2010, 44, 2277–2285. [DOI] [PubMed] [Google Scholar]
- 7.Howard PH and Muir DCG, Identifying New Persistent and Bioaccumulative Organics Among Chemicals in Commerce. III: Byproducts, Impurities, and Transformation Products, Environ. Sci. Technol, 2013, 47, 5259–5266. [DOI] [PubMed] [Google Scholar]
- 8.Howard PH and Muir DCG, Identifying New Persistent and Bioaccumulative Organics Among Chemicals in Commerce II: Pharmaceuticals, Environ. Sci. Technol, 2011, 45, 6938–6946. [DOI] [PubMed] [Google Scholar]
- 9.Helbling DE, Hollender J, Kohler HPE, Singer H and Fenner K, High-Throughput Identification of Microbial Transformation Products of Organic Micropollutants, Environ. Sci. Technol, 2010, 44, 6621–6627. [DOI] [PubMed] [Google Scholar]
- 10.Kern S, Fenner K, Singer HP, Schwarzenbach RP and Hollender J, Identification of Transformation Products of Organic Contaminants in Natural Waters by Computer-Aided Prediction and High-Resolution Mass Spectrometry, Environ. Sci. Technol, 2009, 43, 7039–7046. [DOI] [PubMed] [Google Scholar]
- 11.Hollender J, Schymanski EL, Singer HP and Ferguson PL, Nontarget Screening with High Resolution Mass Spectrometry in the Environment: Ready to Go?, Environ. Sci. Technol, 2017, 51, 11505–11512. [DOI] [PubMed] [Google Scholar]
- 12.Schymanski EL, Jeon J, Gulde R, Fenner K, Ruff M, Singer HP and Hollender J, Identifying Small Molecules via High Resolution Mass Spectrometry: Communicating Confidence, Environ. Sci. Technol, 2014, 48, 2097–2098. [DOI] [PubMed] [Google Scholar]
- 13.Schymanski EL, Singer HP, Longree P, Loos M, Ruff M, Stravs MA, Vidal CR and Hollender J, Strategies to Characterize Polar Organic Contamination in Wastewater: Exploring the Capability of High Resolution Mass Spectrometry, Environ. Sci. Technol, 2014, 48, 1811–1818. [DOI] [PubMed] [Google Scholar]
- 14.Ruff M, Mueller MS, Loos M and Singer HP, Quantitative target and systematic non-target analysis of polar organic micro-pollutants along the river Rhine using high-resolution mass-spectrometry - Identification of unknown sources and compounds, Water Res, 2015, 87, 145–154. [DOI] [PubMed] [Google Scholar]
- 15.Carpenter CMG, Wong LYJ, Johnson CA and Helbling DE, Fall Creek Monitoring Station: Highly Resolved Temporal Sampling to Prioritize the Identification of Nontarget Micropollutants in a Small Stream, Environ. Sci. Technol, 2019, 53, 77–87. [DOI] [PubMed] [Google Scholar]
- 16.Carpenter CMG and Helbling DE, Widespread Micropollutant Monitoring in the Hudson River Estuary Reveals Spatiotemporal Micropollutant Clusters and Their Sources, Environ. Sci. Technol, 2018, 52, 6187–6196. [DOI] [PubMed] [Google Scholar]
- 17.Tian ZY, Peter KT, Gipe AD, Zhao HQ, Hou F, Wark DA, Khangaonkar T, Kolodziej EP and James CA, Suspect and Nontarget Screening for Contaminants of Emerging Concern in an Urban Estuary, Environ. Sci. Technol, 2020, 54, 889–901. [DOI] [PubMed] [Google Scholar]
- 18.Peter KT, Tian ZY, Wu C, Lin P, White S, Du BW, McIntyre JK, Scholz NL and Kolodziej EP, Using High-Resolution Mass Spectrometry to Identify Organic Contaminants Linked to Urban Stormwater Mortality Syndrome in Coho Salmon, Environ. Sci. Technol, 2018, 52, 10317–10327. [DOI] [PubMed] [Google Scholar]
- 19.Sultana T, Murray C, Hoque ME and Metcalfe CD, Monitoring contaminants of emerging concern from tertiary wastewater treatment plants using passive sampling modelled with performance reference compounds, Environ Monit Assess, 2017, 189, 19. [DOI] [PubMed] [Google Scholar]
- 20.Alvarez DA, Petty JD, Huckins JN, Jones-Lepp TL, Getting DT, Goddard JP and Manahan SE, Development of a passive, in situ, integrative sampler for hydrophilic organic contaminants in aquatic environments, Environ. Toxicol. Chem, 2004, 23, 1640–1648. [DOI] [PubMed] [Google Scholar]
- 21.Kerrigan JF, Engstrom DR, Yee D, Sueper C, Erickson PR, Grandbois M, McNeill K and Arnold WA, Quantification of Hydroxylated Polybrominated Diphenyl Ethers (OH-BDEs), Triclosan, and Related Compounds in Freshwater and Coastal Systems, Plos One, 2015, 10, 19. [DOI] [PMC free article] [PubMed] [Google Scholar]
- 22.Sutton R, Chen D, Sun J, Greig DJ and Wu Y, Characterization of brominated, chlorinated, and phosphate flame retardants in San Francisco Bay, an urban estuary, Sci Total Environ, 2019, 652, 212–223. [DOI] [PubMed] [Google Scholar]
- 23.Broeckling CD, Afsar FA, Neumann S, Ben-Hur A and Prenni JE, RAMClust: A Novel Feature Clustering Method Enables Spectral-Matching-Based Annotation for Metabolomics Data, Anal. Chem, 2014, 86, 6812–6817. [DOI] [PubMed] [Google Scholar]
- 24.Yang XY, Neta P and Stein S, Building a high quality reference tandem mass spectral library for comprehensive compound identification, Abstr Pap Am Chem S, 2017, 254, 2. [Google Scholar]
- 25.Ibrahim I, Togola A and Gonzalez C, Polar organic chemical integrative sampler (POCIS) uptake rates for 17 polar pesticides and degradation products: laboratory calibration, Environmental Science and Pollution Research, 2013, 20, 3679–3687. [DOI] [PubMed] [Google Scholar]
- 26.Voutsa D, Hartmann P, Schaffner C and Giger W, Benzotriazoles, alkylphenols and bisphenol a in municipal wastewaters and in the Glatt River, Switzerland, Environmental Science and Pollution Research, 2006, 13, 333–341. [DOI] [PubMed] [Google Scholar]
- 27.Reemtsma T, Miehe U, Duennbier U and Jekel M, Polar pollutants in municipal wastewater and the water cycle: Occurrence and removal of benzotriazoles, Water Res, 2010, 44, 596–604. [DOI] [PubMed] [Google Scholar]
- 28.Hollender J, Zimmermann SG, Koepke S, Krauss M, McArdell CS, Ort C, Singer H, von Gunten U and Siegrist H, Elimination of Organic Micropollutants in a Municipal Wastewater Treatment Plant Upgraded with a Full-Scale Post-Ozonation Followed by Sand Filtration, Environ. Sci. Technol, 2009, 43, 7862–7869. [DOI] [PubMed] [Google Scholar]
- 29.Giger W, Schaffner C and Kohler HPE, Benzotriazole and tolyltriazole as aquatic contaminants. 1. Input and occurrence in rivers and lakes, Environ. Sci. Technol, 2006, 40, 7186–7192. [DOI] [PubMed] [Google Scholar]
- 30.Bollmann UE, Vollertsen J, Carmeliet J and Bester K, Dynamics of biocide emissions from buildings in a suburban stormwater catchment-Concentrations, mass loads and emission processes, Water Res, 2014, 56, 66–76. [DOI] [PubMed] [Google Scholar]
- 31.Harman C, Allan IJ and Vermeirssen ELM, Calibration and use of the polar organic chemical integrative sampler-a critical review, Environ. Toxicol. Chem, 2012, 31, 2724–2738. [DOI] [PubMed] [Google Scholar]
- 32.Togola A and Budzinski H, Development of polar organic integrative samplers for analysis of pharmaceuticals in aquatic systems, Anal. Chem, 2007, 79, 6734–6741. [DOI] [PubMed] [Google Scholar]
- 33.Endo S, Pfennigsdorff A and Goss KU, Salting-Out Effect in Aqueous NaCl Solutions: Trends with Size and Polarity of Solute Molecules, Environ. Sci. Technol, 2012, 46, 1496–1503. [DOI] [PubMed] [Google Scholar]
- 34.Bayen S, Segovia E, Loh LL, Burger DF, Eikaas HS and Kelly BC, Application of Polar Organic Chemical Integrative Sampler (POCIS) to monitor emerging contaminants in tropical waters, Sci Total Environ, 2014, 482, 15–22. [DOI] [PubMed] [Google Scholar]
- 35.Ferguson PL and Brownawell BJ, Degradation of nonylphenol ethoxylates in estuarine sediment under aerobic and anaerobic conditions, Environ. Toxicol. Chem, 2003, 22, 1189–1199. [PubMed] [Google Scholar]
- 36.Ferguson PL, Iden CR and Brownawell BJ, Distribution and fate of neutral alkylphenol ethoxylate metabolites in a sewage-impacted urban estuary, Environ. Sci. Technol, 2001, 35, 2428–2435. [DOI] [PubMed] [Google Scholar]
- 37.Giger W, Brunner PH and Schaffner C, 4-Nonylphenol in Sewage-Sludge - Accumulation of Toxic Metabolites From Nonionic Surfactants, Science, 1984, 225, 623–625. [DOI] [PubMed] [Google Scholar]
- 38.Lara-Martin PA, Gonzalez-Mazo E, Petrovic M, Barcelo D and Brownawell BJ, Occurrence, distribution and partitioning of nonionic surfactants and pharmaceuticals in the urbanized Long Island Sound Estuary (NY), Mar Pollut Bull, 2014, 85, 710–719. [DOI] [PubMed] [Google Scholar]
- 39.Stephanou E and Giger W, Persistent Organic-Chemicals in Sewage Effluents .2. Quantitative-Determinations of Nonylphenols and Nonylphenol Ethoxylates By Glass-Capillary Gas-Chromatography, Environ. Sci. Technol, 1982, 16, 800–805. [DOI] [PubMed] [Google Scholar]
- 40.Garcia RA, Chiaia-Hernandez AC, Lara-Martin PA, Loos M, Hollender J, Oetjen K, Higgins CP and Field JA, Suspect Screening of Hydrocarbon Surfactants in AFFFs and AFFF-Contaminated Groundwater by High-Resolution Mass Spectrometry, Environ. Sci. Technol, 2019, 53, 8068–8077. [DOI] [PubMed] [Google Scholar]
- 41.Krogh KA, Halling-Sorensen B, Mogensen BB and Vejrup KV, Environmental properties and effects of nonionic surfactant adjuvants in pesticides: a review, Chemosphere, 2003, 50, 871–901. [DOI] [PubMed] [Google Scholar]
- 42.Ahel M, Giger W and Schaffner C, Behavior of Alkylphenol Polyethoxylate Surfactants in the Aquatic Environment .2. Occurrence and Transformation in Rivers, Water Res, 1994, 28, 1143–1152. [Google Scholar]
- 43.Ahel M, Giger W and Koch M, Behavior of Alkylphenol Polyethoxylate Surfactants in the Aquatic Environment .1. Occurrence and Transformation in Sewage-Treatment, Water Res, 1994, 28, 1131–1142. [Google Scholar]
- 44.Kosonen J and Kronberg L, The occurrence of antihistamines in sewage waters and in recipient rivers, Environmental Science and Pollution Research, 2009, 16, 555–564. [DOI] [PubMed] [Google Scholar]
- 45.Loos R, Carvalho R, Antonio DC, Cornero S, Locoro G, Tavazzi S, Paracchini B, Ghiani M, Lettieri T, Blaha L, Jarosova B, Voorspoels S, Servaes K, Haglund P, Fick J, Lindberg RH, Schwesig D and Gawlik BM, EU-wide monitoring survey on emerging polar organic contaminants in wastewater treatment plant effluents, Water Res, 2013, 47, 6475–6487. [DOI] [PubMed] [Google Scholar]
- 46.Alhelou R, Seiwert B and Reemtsma T, Hexamethoxymethylmelamine - A precursor of persistent and mobile contaminants in municipal wastewater and the water cycle, Water Res, 2019, 165, 9. [DOI] [PubMed] [Google Scholar]
- 47.Hou F, Tian ZY, Peter KT, Wu C, Gipe AD, Zhao HQ, Alegria EA, Liu FM and Kolodziej EP, Quantification of organic contaminants in urban stormwater by isotope dilution and liquid chromatography-tandem mass spectrometry, Anal Bioanal Chem, 2019, 411, 7791–7806. [DOI] [PubMed] [Google Scholar]
- 48.Ota A, Takehara Y, Okawa T, Ikegami R, Sasaki K and Numata M, Contact allergy to Tinuvin 770, a hindered amine light stabilizer in sandals contributing to hyperkeratotic foot dermatitis, Contact Dermatitis, 2019, 81, 288–290. [DOI] [PubMed] [Google Scholar]
- 49.Pati SG and Arnold WA, Comprehensive screening of quaternary ammonium surfactants and ionic liquids in wastewater effluents and lake sediments, Environ Sci-Proc Imp, 2020, 22, 430–441. [DOI] [PubMed] [Google Scholar]
- 50.Li XL and Brownawell BJ, Quaternary Ammonium Compounds in Urban Estuarine Sediment Environments - A Class of Contaminants in Need of Increased Attention?, Environ. Sci. Technol, 2010, 44, 7561–7568. [DOI] [PubMed] [Google Scholar]
- 51.Brownawell BJ, Chen H, Collier JM and Westall JC, Adsorption of Organic Cations to Natural Materials, Environ. Sci. Technol, 1990, 24, 1234–1241. [Google Scholar]
Associated Data
This section collects any data citations, data availability statements, or supplementary materials included in this article.