Abstract
Since the first pioneering studies on small deuterated peptides dating more than 20 years ago, 1H detection has evolved into the most efficient approach for investigation of biomolecular structure, dynamics, and interactions by solid-state NMR. The development of faster and faster magic-angle spinning (MAS) rates (up to 150 kHz today) at ultrahigh magnetic fields has triggered a real revolution in the field. This new spinning regime reduces the 1H–1H dipolar couplings, so that a direct detection of 1H signals, for long impossible without proton dilution, has become possible at high resolution. The switch from the traditional MAS NMR approaches with 13C and 15N detection to 1H boosts the signal by more than an order of magnitude, accelerating the site-specific analysis and opening the way to more complex immobilized biological systems of higher molecular weight and available in limited amounts. This paper reviews the concepts underlying this recent leap forward in sensitivity and resolution, presents a detailed description of the experimental aspects of acquisition of multidimensional correlation spectra with fast MAS, and summarizes the most successful strategies for the assignment of the resonances and for the elucidation of protein structure and conformational dynamics. It finally outlines the many examples where 1H-detected MAS NMR has contributed to the detailed characterization of a variety of crystalline and noncrystalline biomolecular targets involved in biological processes ranging from catalysis through drug binding, viral infectivity, amyloid fibril formation, to transport across lipid membranes.
1. Introduction
1.1. Scope of This Review
By probing structure, dynamics, and interactions of biomolecules at atomic resolution, nuclear magnetic resonance (NMR) spectroscopy is one of the most powerful tools available for structural biology. While NMR in solution is a mature technique, nowadays focusing primarily on applications, the development of magic-angle spinning (MAS) NMR methods for hydrated solid proteins is currently a thriving field of research.
A successful application of solid-state NMR depends critically on resolution and sensitivity. For many years, biomolecular solid-state NMR has been developing exploiting the detection of nuclei with low gyromagnetic ratio (γ), such as 13C and 15N, for which MAS in combination with strong 1H dipolar decoupling suffices to recover narrow lines. However, the detection of low-γ nuclei compromises sensitivity and thus requires long experimental times and considerable sample amounts.
The direct detection of proton coherences, exploiting the high gyromagnetic ratio and abundance of proton nuclei, is the most natural way to enhance the spectral sensitivity, and it is the standard in solution NMR. The very same high gyromagnetic ratio and abundance, coupled to the small spectral dispersion of 1H resonances, however, generate a network of strong dipolar couplings, which results in severe line broadening at moderate (10–20 kHz) MAS rates. This has prevented for a long time the straightforward application of 1H detection to proteins in the solid state and limited its scope to extensively deuterated systems.
The field of MAS NMR has experienced an extremely rapid development over the last two decades, promoted by continuous advances in terms of probe and magnet technology. The continuous development of probes capable of reaching faster MAS rates (above 100 kHz today) and higher magnetic fields has allowed a more efficient averaging of the 1H dipolar interactions, ultimately enabling the direct detection of the larger magnetic moment available from 1H at high resolution. These new possibilities have progressively fueled a large number of developments in the technique, transforming the spectroscopic tools and the sample preparation practices, reducing the sample quantity requirements, accelerating the spectral acquisition and analysis, broadening size and variety of the biomolecular target systems, and expanding the scope of information that can be extracted.
Thanks to these leaps forward, proton-detected solid-state NMR at very fast MAS has now matured into a technique that has finally stepped out of the shadow of its solution counterpart and enabled the site-specific investigation of structure, dynamics, and interactions in proteins of several tens of kDa within crystalline and noncrystalline preparations.
In this review, we guide the reader through these developments which span the last two decades, presenting the underlying concepts and the associated experimental protocols, and give a flavor of the many different biomolecular application areas. We first introduce the factors determining the linewidth observed in the NMR spectra of biomolecular solids and discuss the effects of higher frequency MAS and magnetic fields on resolution and sensitivity. Next, we present the set of spectroscopic tools improved over the years to obtain multidimensional correlations at fast (>40 kHz) MAS conditions. We then describe the various strategies capable of correlating backbone and side-chain resonances which efficiently provide site-specific resonance assignment. We explain how these schemes are extended to experiments reporting on protein geometry, via the direct evaluation of 1H–1H proximities, or dynamics, via the measurement of scaled anisotropic interactions and relaxation parameters. We finally review the main protocols enabling the calculation of structures and the description of molecular motions at high resolution. We finish with a passage through the ever-growing number of example studies where 1H-detected NMR has contributed in bridging structure to function in a variety of biological processes.
1.2. Previous Reviews
The field of proton detection for biological solids has been constantly developing for about 20 years or more. A first review on the early work was published in 2006,1 followed by several accounts on the use of highly deuterated proteins at moderate MAS rates by the Reif group.2−4 The methodological novelties enabled by the first experiments in the 60 kHz MAS regime were covered in a review by Lange’s group in 2011, which additionally discussed the prospect of direct proton detection.5 In 2013, the Lyon and Florence groups reviewed their first results of 60 kHz MAS NMR with a special focus on paramagnetic metalloproteins.6 In 2015, the Griffin group wrote an extensive review on the latest progress of 1H detection with fast MAS and DNP enhanced solid-state NMR at low temperatures.7 In the same period, methods and applications developed in this MAS regime were summarized in two perspective papers in the Journal of Magnetic Resonance, which included outlook sections on the expected benefits of higher spinning rates.8,9
The Linser and Ishii groups summarized their work in 2018, including, respectively, strategies for determining structure and dynamics in microcrystalline proteins,10 as well as a discussion of the sensitivity enhancement and on assignment strategies at fast MAS rates.11 We published a review with a focus on 1H detected solid-state NMR on membrane proteins in 201812 and a general membrane protein review in 2021.13 Mandala and Hong presented a short review on the latest progress of 1H detection with fast MAS and DNP enhanced solid-state NMR at low temperatures.14 Nishiyama presented a summary on the development of 1H-detected MAS NMR for the analysis of samples at natural abundance,15 and Samoson presented a perspective paper on MAS rates up to 170 kHz.16
Sections relating to the benefits of 1H-detected MAS NMR in a biomolecular context can be found in several reviews centered on broader thematic areas, such as amyloids,17 microcrystalline proteins,18 viruses,19,20 and paramagnetic systems.21 Many reviews dealt with the topic of protein dynamics in the solid state.22−24 In particular, Schanda and Ernst published a very elaborate topical review on all aspects of protein dynamics,25 and Rovó focused on relaxation–dispersion methods.26 Finally, our recent work highlights all recent developments in the field with a special focus on 1H-detected methodological advances.27
Solid-state nuclear magnetic resonance spectroscopy is a method with widespread application in chemistry and biology. A general overview and introduction to the subject was published very recently by Reif, Ashbrook, Emsley, and Hong.28
2. Lineshapes and Linewidths in Solid-State NMR
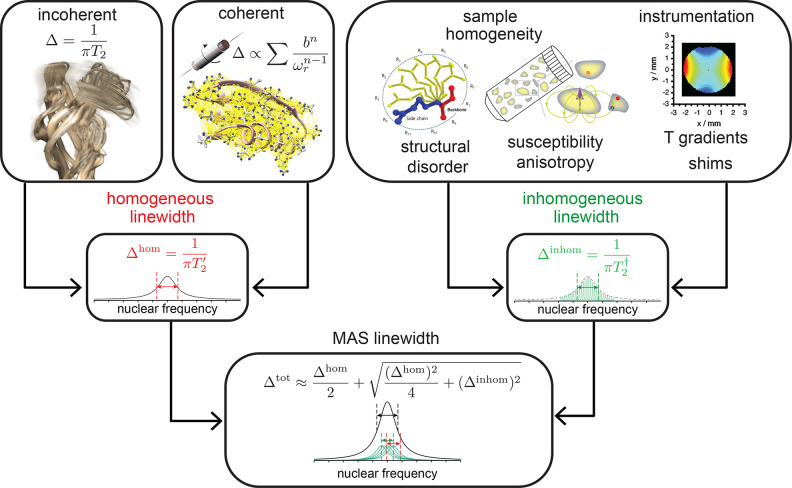
In this section, we discuss the decoherence of NMR signal components under MAS conditions29,30 and how this affects the lineshape and linewidth in the NMR spectrum. Three main contributions are responsible in solids for signal decay and associated linewidth, namely, inhomogeneous, homogeneous coherent and homogeneous incoherent (Figure 1). In the following, we will describe in detail their origin and response to experimental conditions which are predominantly the static magnetic field strength and MAS frequency. Throughout the following section, we denote the MAS frequency as ωr in rad s–1 and νr = ωr/2π in Hz.
Figure 1.
Schematic showing the different sources of spectral line broadening in solid-state MAS NMR and how they contribute to the final lineshape. Both the incoherent and coherent homogeneous broadening is assumed to be Lorentzian, and all sources of inhomogeneous broadening are assumed to be Gaussian.
2.1. Homogeneous Incoherent Effects
A first component to the observed lines in solid-state NMR is transverse spin relaxation, originating from molecular global or local motions.31−33 Relaxation is caused by random time-dependent fluctuations of the local field felt by the nuclei, producing an exponential decay senv(t) = exp(−R2t) of the envelope of the time-domain signal S(t), characterized by a decay, or transverse relaxation, rate constant R2, or equivalently a decay time constant T2 = 1/R2. The corresponding peak in the NMR spectrum (the real part of the frequency domain S̃(ω)) is then described by a Lorentzian function, so that
| 1 |
where S(0) is the signal at t = 0 and Ω is a resonance frequency. The linewidth, Δ, defined by the full width at half-maximum (FWHM), is given by R2/π = 1/(πT2) in Hz; i.e., the linewidth is directly proportional to the rate constant.
The mechanism which randomly modulates the spin interactions over time is rotational diffusion, a process by which the molecule or part of the molecule randomly changes its orientation. Rotational diffusion may be unrestricted and isotropic, such as for molecules tumbling in an isotropic solvent, or restricted, where the motion is restrained. The precise nature of the motion is described by a model, of which there are several available. For the purposes of this discussion, we employ the so-called model-free approach,34,35 where the motion is characterized by a correlation time τc and an order parameter S2. The correlation time is the mean time required for a change in molecular orientation of 1 rad and can be interpreted as the time scale of the dynamic process. The order parameter characterizes how restricted the rotational is and takes values from S2 = 0 for unrestricted isotropic motion to S2 = 1 for complete restriction, i.e., no motion. The random motion can be broken down into oscillations occurring at different frequencies, with the amount of motion at frequency ω being given by the spectral density function j(ω). For the model-free approach, j(ω) is given by34,35
| 2 |
The relaxation rate constant R2 is often described as the sum of two terms R2(0) and R2ex. R2(0) accounts for proper spin relaxation and can be decomposed into the different paths corresponding to the anisotropic interactions involved, which are, for a pair of spin 1/2 nuclei, i and j, the homonuclear and heteronuclear dipolar couplings and the chemical shift anisotropy (CSA). An explicit expression for the relaxation rates is usually provided by Redfield theory.31,32,36 Using this approach, R2(0) rate constants are given by25,37
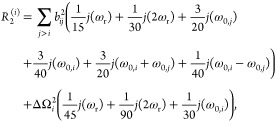 |
3 |
where bij = −μ0ℏγiγj/(4πrij3) is the dipolar coupling constant between spins i and j, μ0 is the permeability of free space, γi is the gyromagnetic ratio of spin i, ℏ is Planck’s constant divided by 2π, and rij is the distance between the two spins. ΔΩi is the chemical shift anisotropy, which for an axially symmetric chemical shielding tensor is given by ΔΩi = −γiB0(σ∥ – σ⊥), where σ∥ and σ⊥ are the parallel and perpendicular components of the chemical shielding tensor in its principle axis frame.
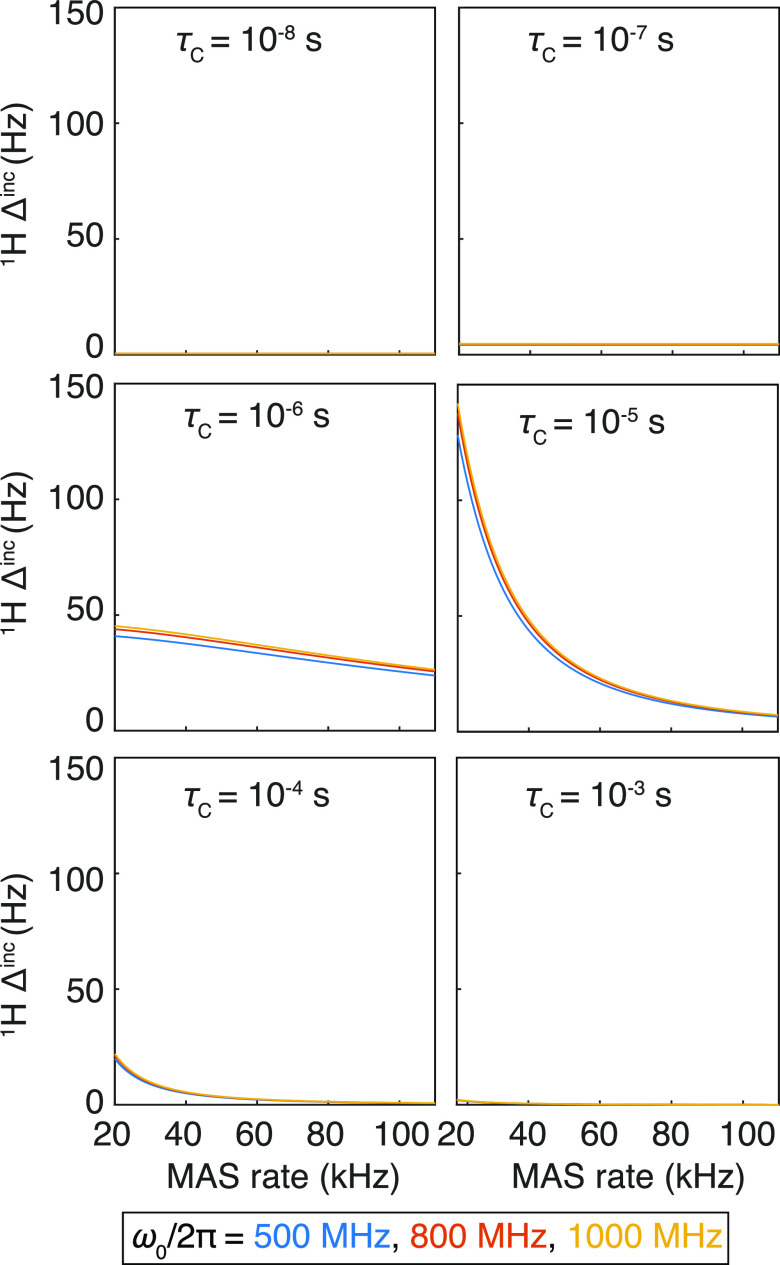
For motions with correlation times that are much shorter than the rotor period τr = 2π/ωr (e.g., by at least two orders of magnitude), R2 is independent of both MAS frequency and magnetic field and represents a modest contribution to the overall linewidth. However, for slower motions, such that the correlation time is comparable to the rotor period, which currently has a lower bound of ∼10 μs for practicable spinning frequencies, it becomes a much larger contribution (up to several hundred Hz, see Figure 2). This broadening is reduced at faster MAS frequencies.
Figure 2.
Homogeneous incoherent contribution to 1H linewidths (1H Δinc) calculated with eq 3, with a homonuclear coupling to a proton at a distance of 3 Å, heteronuclear coupling with the bonded 15N at a distance of 1.04 Å, and 10 ppm of 1H CSA. The correlation functions were calculated with the simple model-free approach, with S2 set to 0.9 and τc varied between 10–8 and 10–3 s. One should note that the values given here are only semiquantitative as Redfield theory is not a rigorous approach for the slowest motions (largest τc).
In solution, resolution is often dominated by R2, which in turn is mainly determined by the overall tumbling of the molecule. This is an intrinsic limitation of solution NMR for biomolecules of large size. In contrast, relaxation in solids is driven by local fluctuations of the structure and is therefore usually slower (except when τc is comparable to τr) and independent of the size of the target.
The other contribution to R2, R2ex, is caused by stochastic modulation of isotropic chemical shifts through conformational rearrangements (exchange). R2ex can be formalized by Bloch–McConnell equations38−40 and depends mainly on the chemical shift distribution of the ensemble of conformers, the relative populations of the exchanging states, their rate of interconversion, and the strength of the external magnetic field. As in solution NMR experiments, exchange has a strong impact on the MAS NMR signals from parts of the molecule undergoing microsecond to millisecond motions.
2.2. Homogeneous Coherent Effects
The homogeneous coherent component of signal decay is the factor that in many cases determines the resolution of 1H MAS NMR spectra. It is due to the evolution of the transverse magnetization under an extended strong dipolar coupling network and so is dominated by the 1H spins in the structure.29,41,42 The effect was initially described by van Vleck using a moment expansion43 and subsequently applied to samples under MAS.44−48 In a spinning solid, we can gain insight into the spin dynamics and the resulting spectrum by restricting our signal observation to integer multiples of the rotor period τr, and employing average Hamiltonian theory (AHT). From this we calculate the average Hamiltonian H̅, which determines the spin dynamics in such restricted observation conditions and is given by the following series41,42
| 4 |
where H̅(n) is the nth-order average Hamiltonian. The analytical expressions for the H̅(n) become increasingly complicated with increasing n. The first three terms are
| 5 |
| 6 |
| 7 |
Spin interactions contribute differently to these averages depending on whether the Hamiltonian commutes or not with itself when sampled at pairs of arbitrary time points. For interactions such as an isolated two-spin dipolar coupling and an isolated CSA, the terms for n > 1 vanish and the average Hamiltonian is zero and becomes a meaningful description of the spectrum when νr is larger than the strength of the interaction.49 For a larger network (i.e., between more than two spins) of dipolar couplings, however, subsequent average Hamiltonians of higher-order n do give rise to homogeneous resonance broadening, with amplitudes that have the form [bn]/ωrn–1, where [bn] represents a product of n dipolar coupling constants.9,50 As a result, this coherent homogeneous effect translates (to a reasonably good approximation) into a monoexponential signal decay, whose rate constant Rcoh contains contributions that vary as 1/ωrn–1. The leading contribution to Rcoh is the second moment which varies as 1/ωr, and which is therefore reduced by increasing the MAS frequency. Overall, coherent and incoherent effects add up to give the following signal decay envelope
| 8 |
where R2′ is given by the sum of the two homogeneous rate constants (R2′ = R2coh + R2).
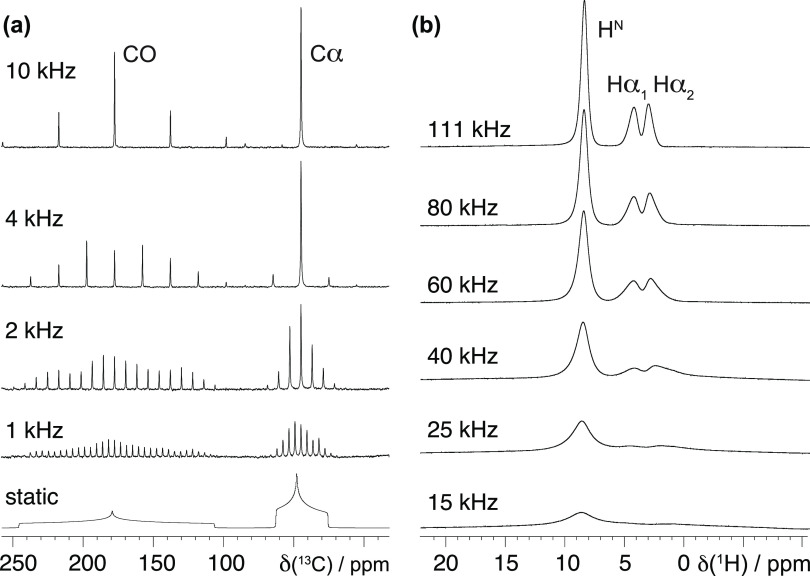
An illustration of these different effects of MAS averaging is presented by the experimental 13C and 1H solid-state MAS NMR spectra of glycine powder in Figure 3a,b. The 13C spectra were acquired with broadband irradiation of the 1H in order to decouple the 1H–13C dipolar coupling interactions, and the lineshapes are therefore determined by the 13C CSA. For these spectra, coherent homogeneous broadening under MAS is largely suppressed, and the signals break into a pattern of narrow signals separated by the MAS frequency (spinning side-band pattern), with residual linewidths largely constant over a range of MAS frequencies from 1 to 10 kHz. On the other hand, the 1H spectra show a clear narrowing of the peaks on increasing the MAS frequency but remain significantly broadened over the whole range of MAS rates from 15 to 111 kHz, although the strength of the H–H dipolar interaction between neighboring protons is only ≃10–25 kHz. No decoupling was applied during the acquisition of these spectra, and so the lineshape is dominated by the homogeneous coherent contribution, which as shown decreases with increasing MAS frequency.
Figure 3.
Experimental 13C and 1H solid-state MAS NMR spectra of natural abundance glycine acquired at increasing spinning frequencies. The 13C spectra shown in (a) were acquired under broadband heteronuclear 1H decoupling, and so the coherent homogeneous contribution to the linewidth of the spinning side-bands is largely suppressed, and the total linewidth is largely independent of MAS frequency. By contrast, the 1H spectra in (b) were not acquired with any decoupling sequence, and so the coherent homogeneous linewidth is dominant and decreases with increasing MAS frequency.
2.3. Inhomogeneous Effects
An inhomogeneous contribution to the signal decay arises in cases where the signal is a superposition of different components from nuclear spins at different spatial positions in the sample, each oscillating at a slightly different frequencies. The most frequently described case is where the Larmor frequency of the spin is spatially dependent, due to either a spatial variation in the external magnetic field B0, the chemical shift δ, or variations in the magnetic susceptibility over the sample.
The contributions to the inhomogeneous decay and associated line broadening in solids can be partitioned into two groups: those due to the intrinsic nature of the sample and those due to the instrumentation. Contributions due to the sample include structural disorder, where the atomic positions throughout the sample are different for different molecules throughout the structure that are otherwise nominally equivalent. Since the chemical shift depends on the molecular conformation, any such disorder leads to a spatial distribution of chemical shifts and thus line broadening. A second contribution is due to the anisotropic bulk magnetic susceptibility (ABMS), where a nuclear spin in a sample crystallite experiences a magnetic field in addition to B0 from neighboring sample crystallites, due to the discontinuity in the sample susceptibility at the crystallite boundary.51−53 This contribution depends on both the magnetic properties of the molecule itself, as well as the packing of the crystallites in the rotor. Contributions to the inhomogeneous broadening due to the instrumentation include the spatial deviation of the external magnetic field B0 from perfect uniformity and temperature gradients across the sample due to MAS, which introduce a spatial variation in temperature-dependent chemical shifts. In addition, there is an ABMS contribution due to the shape of the sample holder (rotor).
Although all of these contributions originate from different sources and effects, they can all be classified as inhomogeneous because they can all be treated as being due to a spatial variation of the Larmor frequency and can all be refocused by use of a spin–echo sequence. The inhomogeneous contribution to the signal decay is frequently assumed to be monoexponential, resulting in a Lorentzian lineshape, characterized by a decay rate R2† or equivalently a time constant T2†. However, its contribution in the solid state is often better approximated by a Gaussian function, of decay envelope of the form
| 9 |
where γ is a parameter that characterizes the rate of decay. The corresponding peak in the spectrum is also described by a Gaussian function given by
| 10 |
with a FWHM equal to  in rad s–1, or
  in Hz. The
inhomogeneous linewidth in Hz
scales with the external field B0, or
equivalently the linewidth in parts per million is independent of B0. On both scales, it is independent of the
MAS frequency for samples at constant temperature.
2.4. Overall Linewidth
All three contributions
described above contribute to the actual decay rate of the signal
component, depending on the experimental conditions employed and the
nature of the pulse sequence element. The total lineshape in the spectrum
is thus a convolution of a Lorentzian lineshape due to homogeneous
broadening and a Gaussian lineshape due to inhomogeneous broadening,
referred to as a Voigt profile, with a total homogeneous linewidth
still given by Δhom = R2′/π in Hz and inhomogeneous linewidth by  Hz. In contrast to the case where all contributions
to the signal decay are monoexponential, the total linewidth Δtot is no longer the simple Pythagorean sum of Δhom and Δinhom but is approximately equal
to
| 11 |
3. Biomolecular NMR at Fast MAS
The development of 1H-detected solid-state NMR has relied on two orthogonal and highly complementary approaches, the development of new hardware capable of faster MAS for better averaging the proton–proton dipolar interactions and of strategies for weakening the interaction network by partial substitution of protons with deuterons. In the following sections, we discuss the efficiency and complementarity of both routes, with a particular emphasis on spectral resolution and sensitivity.
3.1. Faster MAS and Resolution
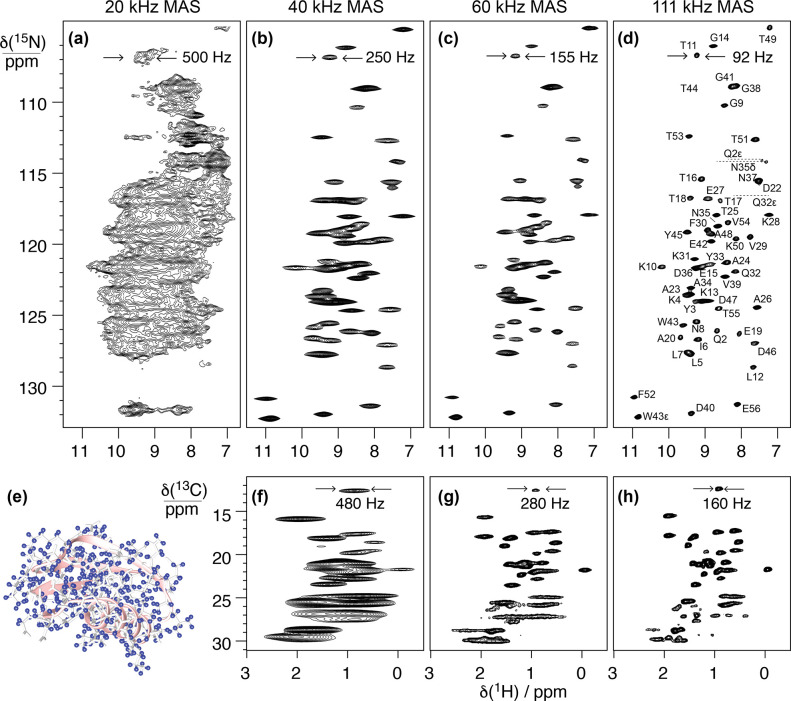
Figure 4 illustrates the effect of faster MAS on the quality of 1H-detected solid-state NMR spectra of a biomolecule. It presents different 15N–1H and 13C–1H dipolar-based heteronuclear single-quantum correlations (CP-HSQC) recorded at 1 GHz with MAS rates ranging between 20 and 111 kHz for a microcrystalline preparation of the protein GB1, a 6.2 kDa model system known for its high spectral quality in solid-state NMR.
Figure 4.
2D amide 1H–15N (a–d) and methyl 1H–13C (f–h) correlation spectra acquired at variable MAS frequencies [(a) 20, (b,f) 40, (c,g) 60, and (d,h) 111 kHz] on a microcrystalline sample of protonated GB1 (structure displayed with hydrogen atoms in blue in panel e).
The first spectrum on the left (panel a) was acquired at 20 kHz MAS with the most traditional setup for solid-state NMR, which is suitable for the detection of 13C resonances but completely incongruous for 1H-detected NMR. The spectra from panels b and f were acquired at 40 kHz MAS, a spinning regime which became available in the first years of the century and enabled the acquisition of the first resolved 1H-detected correlations on a small, fully protonated model microcrystalline protein.54 The spectra from panels c and g were acquired at 60 kHz MAS, which corresponds to the regime where the possibility of fingerprinting fully protonated medium-size proteins was demonstrated about 10 years ago. Finally, the spectra from panels d and h, recorded at 111 kHz, illustrate the benefits brought by the introduction of Bruker’s latest 0.7 mm MAS probe technology, which enables today full structure determinations on a variety of biosolids.
These spectra constitute a very useful representation of the concepts introduced in the previous section. GB1 is a well-characterized and rigid system, and its microcrystalline preparations conserve only motional processes with small amplitude and occurring in the sub-microsecond time scale.55 Incoherent contributions thus contribute only weakly to the observed 1H linewidths, which are determined by the relative interplay between homogeneous and inhomogeneous coherent contributions. The observed total linewidths decrease monotonously with the spinning frequency over the entire range of 20–111 kHz, with a quadratic improvement in 1H coherence lifetimes (Figure 5).50,56 At the fastest spinning condition, amide proton linewidths average to about 100 Hz (0.1 ppm at 1 GHz). Aliphatic protons exist in a denser network of homonuclear couplings and feature larger linewidths. In panel c of Figure 5, linewidths are plotted against the inverse of the MAS rate and show that the line narrowing is dominated by the decrease of the homogeneous component. The slope of this curve is a function of the overall proton density corresponding to the second- and third-order terms in average Hamiltonian theory. The plot also indicates that, for GB1 at 1 GHz, inhomogeneous effects resulting from imperfect magnetic field homogeneity and static disorder in the sample contribute for about 50–60 Hz to the lineshape.
Figure 5.
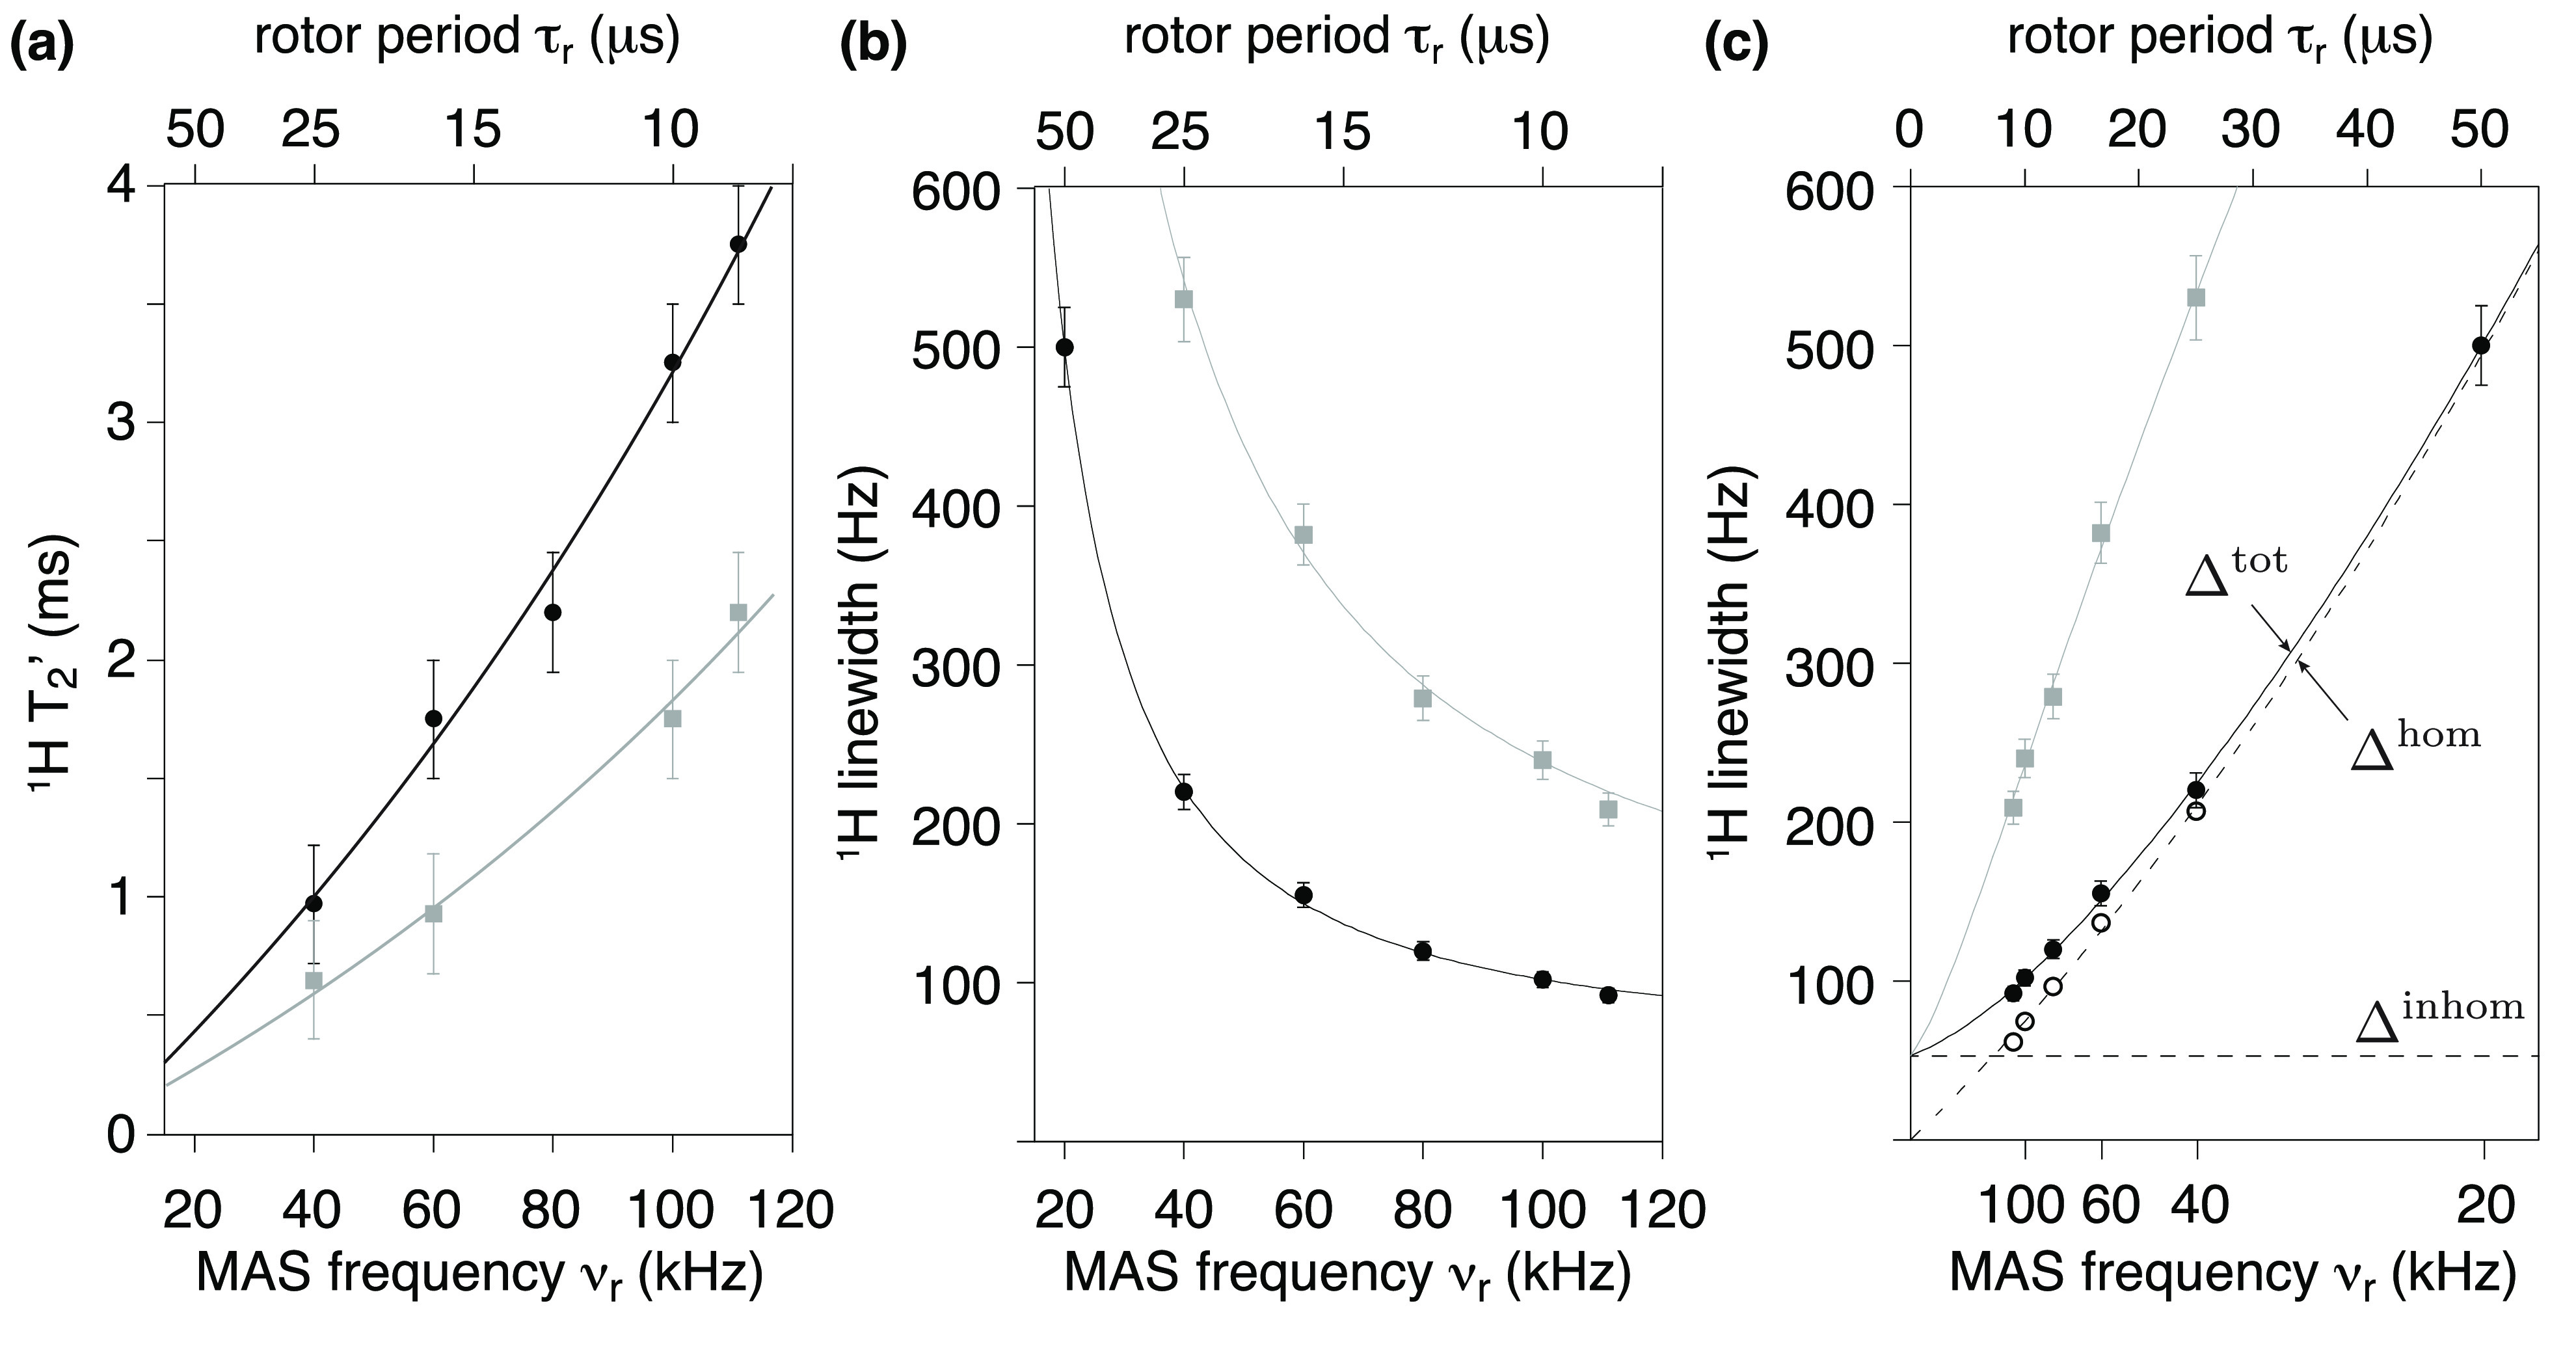
(a) Bulk T′2 of amide (black) and methyl 1H (gray) in a microcrystalline sample of nondeuterated GB1 plotted versus MAS frequency (at field strength B0 = 23.5 T). (b−c) Total linewidths, Δtot, of amide (black) and methyl 1H (gray) of residue T11 as a function of the MAS frequency (νr linear with the x-axis in b, and τr linear with the x-axis in c). T′2 values translate into homogeneous contributions, Δhom, and for amide 1H of residue T11 are depicted in (c) along with total linewidths, Δtot, and the fitted inhomogeneous contribution, Δinhom.
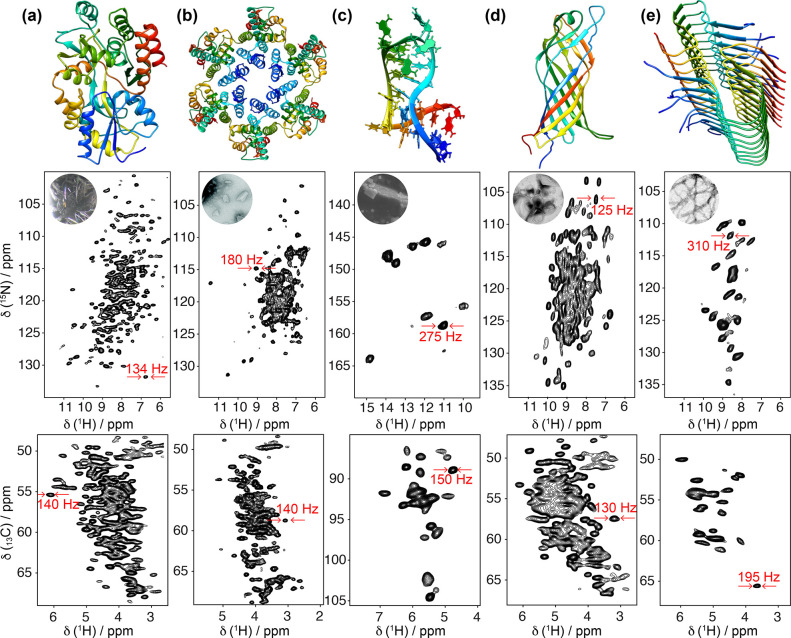
Today high-quality correlation spectra can be acquired in a matter of minutes to hours on fully protonated samples of different nature and aggregation state with MAS at 100 kHz and above, and Figure 6 compiles several recent examples. A resolution comparable to that of GB1 is frequently encountered in microcrystalline samples, which feature a high degree of sample homogeneity. At 100 kHz MAS and on 800–1000 MHz spectrometers, amide proton linewidths of ≃100 Hz, comprising approximately equal contributions from homogeneous and inhomogeneous sources, have been reported for a number of microcrystalline preparations of proteins and enzymes of different molecular size, macromolecular assemblies, and RNAs. These samples are ideal for biological investigation, as well as for the systematic measurement of factors affecting homogeneous resolution. Interestingly, equally narrow signals were reported for noncrystalline, sedimented proteins, although these preparations do not possess a mesoscopic order.
Figure 6.
2D 1H–15N (top) and 1H–13C (bottom) correlation spectra acquired at 100 kHz MAS frequency for (a) microcrystalline maltose binding protein,57 (b) tubular HIV-1 capsid protein assemblies,58 (c) 26mer box C/D RNA bound to the L7Ae protein,59 (d) membrane protein AlkL,60 and (e) fibrils of Aβ42.61 Displayed regions correspond to amide and α sites (a,b,d,e) and imino N–H and ribose C1′–H1′ and U/C C5–H5 moieties (c). The corresponding structures (PDB codes 1ANF, 6WAP, 2N0R, 6QWR, 5KK3) are displayed on top of each pair of spectra.
Broader lines are generally observed for fibrils and membrane-embedded proteins, which exhibit increased structural heterogeneity. For these samples, poor preparations often feature few resonances, indicating that most signals are broadened beyond detection or a single unresolved intensity, associated with the presence of multiple static conformational states. Such heterogeneity can, however, be significantly reduced with intensive sample optimization, involving seeding procedures and/or truncation of the primary sequence to a better-defined core region for fibrils, or optimization of the composition of the lipid phase during reconstitution for transmembrane proteins (see section 4.1). Even when prepared carefully, for these samples, the inhomogeneous linewidth is typically larger, about 0.1 to 0.2 ppm. In fibrils, heterogeneous line broadening is particularly severe for amide protons, whose shifts are sensitive to distortions of hydrogen bond geometries.62,63 Membrane proteins are endowed with higher conformational flexibility, and their broader lines may additionally reflect a larger contribution from motional processes.
3.2. Faster MAS and Sensitivity
3.2.1. Sensitivity of Direct and Indirect Detection
The sensitivity of the NMR signal scales with the gyromagnetic ratio of the detected nuclei so a gain of approximately (γH/γN)3/2 ≃31 and (γH/γC)3/2 ≃8 is expected using 1H signal to indirectly detect 15N and 13C resonances, respectively, with an identical experimental setup. While proton detection has been recognized as the main avenue to maximize the sensitivity of solution NMR from the onsets of the technique,64 its advantages for solid-state NMR experiments have long been a forbidden dream. In the following, we recall some elements for a clearer understanding of this point.
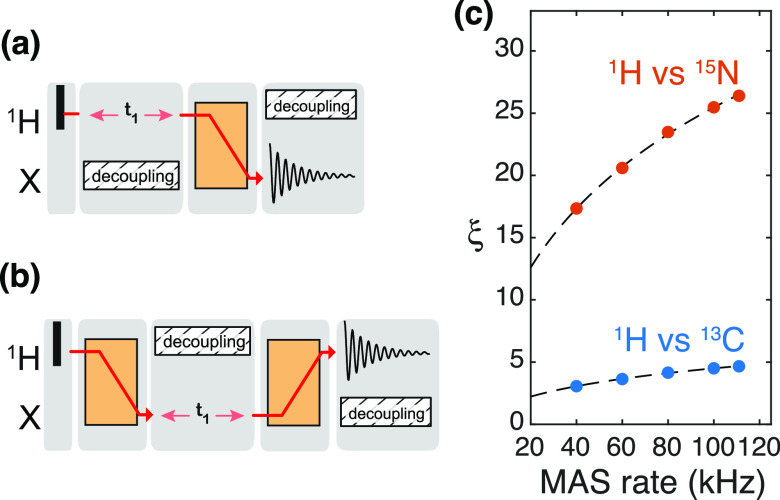
The sensitivity gain (ξ) associated with indirect detection of a heteronucleus can be evaluated by comparison of 2D X(=13C/15N)/1H correlations detected either on 1H or on X65 (see Figure 7a,b for the corresponding irradiation schemes). In these conditions where all other experimental parameters are kept constant, the sensitivity ratio of indirect (ID) versus direct detection (DD) is expressed as
| 12 |
where the factor f (≃0.5) accounts for the efficiency of the additional transfer step in the 1H detection scheme, WH and WX are the linewidths of the detected signals, and QH and QX are the quality factors of triple-resonance probes (typically QH/QC ≃1.5 and QH/QN ≃2).
Figure 7.
Sensitivity gains by detecting on 1H with respect to heteronuclei (X being 15N or 13C). Virtual RF irradiation schemes for measuring 2D 1H–X correlations with (a) heteronuclei detection and (b) proton detection. Excitation pulses are depicted as black rectangles; indirect chemical shift encoding is performed during the t1 evolution time, and transfer sequences are shown as orange blocks. (c) Sensitivity gain factors ξ are calculated with eq 12 with linewidths (W) measured on a fully protonated microcrystalline GB1 sample: WH = 220, 156, 120, 102, 95 Hz (at 40, 60, 80, 100, 111 kHz MAS, respectively), WC = 105 Hz, and WN = 55 Hz. Both WC and WN are supposed to be constant over the 20–111 kHz MAS frequency range.
3.2.2. Sensitivity Gains versus MAS Rates
The sensitivity gains are therefore intimately connected to the resolution. In static or slow MAS experiments, 1H lines are much broader than 1 kHz, and no sensitivity gains are possible. However, as soon as MAS exceeds 20–30 kHz, sensitivity enhancements are progressively observed for nuclei of increasing γ. Ishii and Tycko were the first to demonstrate the relevance of indirect detection in MAS NMR in dry preparations of peptides and polymers, with enhancements of 2.0–3.2 versus 15N detection65 and 1.5–2.5 versus 13C detection66 demonstrated with MAS rates of 30 kHz. Comparable enhancements were subsequently measured for a fully protonated sample of GB1 spinning at 40 kHz MAS,54 paving the way for the development of efficient assignment and structure calculation strategies with proton detection. With the intention of quantifying the trends, we calculate the relative sensitivity of 1H over 13C and 15N detection for the prototypical biomolecular sample GB1 as a function of the MAS rate (Figure 7c). A steady increase in the sensitivity gain is provided by faster spinning, with a theoretical maximum of 29 and 5 governed by the ratio of the inhomogeneous linewidths of 1H and heteronuclei. At the fastest MAS rates enabled today by Bruker hardware (111 kHz), inverse detection outplays the directly detected counterpart by a factor of 5 and 27 for 13C and 15N, respectively, for model microcrystalline systems.
3.2.3. Absolute and Mass Sensitivity
The gains demonstrated above refer to sensitivity without considering the sample mass, i.e., the calculation implies that the sample amount is the same at different MAS rates. We refer to this as the mass sensitivity, as it is equivalent to sensitivity per sample mass. Naturally, an increase in rotation rate imposes a reduction in the rotor diameter (d) to limit the linear speed of rotor periphery and ensure its physical integrity. Of note, efforts are made to push forward this limit with alternative spherical rotor designs, more resistant to centrifugal stress than their cylindrical counterparts.67
Table 1 reports some physical characteristics of a variety of commercial rotors, manufactured by Bruker Biospin, Phoenix NMR, and JEOL as well as by the laboratory of Samoson who has been continuously setting the stage for any new records in MAS rates.16
Table 1. Comparison of a Set of Commercially Available MAS Rotorsa.
| dout (mm) | din (mm) | sample volume (μL)b | max νR (kHz) | surface velocity (m·s–1) | RCF (106g) | Pcentri (bar) | frictional heating (K) | detection sensitivity (au) |
|---|---|---|---|---|---|---|---|---|
| Bruker Biospin | ||||||||
| 7.0 | 6.0 | 250 | 6 | 132 | 0.4 | 51 | n/a | 4.48 |
| 4.0 | 3.0 | 70.0 | 15 | 188 | 1.4 | 80 | 25 | 2.20 |
| 3.2 | 2.6 | 35.6 | 24 | 241 | 3.0 | 154 | 35 | 1.40 |
| 3.2 | 2.2 | 25.5 | 24 | 241 | 2.5 | 110 | 35 | 1.00 |
| 2.5 | 1.5 | 13.5 | 35 | 275 | 3.7 | 109 | 45 | 0.68 |
| 1.9 | 1.5 | 10.0 | 42 | 251 | 5.3 | 157 | n/a | 0.66 |
| 1.3 | 0.9 | 2.50 | 67 | 274 | 8.1 | 143 | 35 | 0.24 |
| 0.7 | 0.5 | 0.59 | 111 | 244 | 12.4 | 121 | 25 | 0.11 |
| Phoenix NMR | ||||||||
| 6.0 | 5.1 | 200 | 6 | 113 | 0.4 | 37 | n/a | 4.18 |
| 6.0 | 4.5 | 155 | 9 | 170 | 0.7 | 65 | n/a | 3.24 |
| 4.0 | 3.2 | 88 | 14 | 176 | 1.26 | 79 | n/a | 2.76 |
| 4.0 | 2.46 | 46 | 18 | 226 | 1.6 | 77 | n/a | 1.16 |
| 3.2 | 2.6 | 34 | 15 | 151 | 1.2 | 60 | n/a | 1.33 |
| 3.2 | 2.0 | 21 | 25 | 251 | 2.5 | 99 | n/a | 0.82 |
| 2.5 | 1.88 | 20 | 30 | 236 | 3.4 | 126 | n/a | 1.0 |
| 1.6 | 1.14 | 8 | 40 | 201 | 3.7 | 82 | n/a | 0.63 |
| 1.2 | 0.64 | 1.0 | 60 | 226 | 4.7 | 60 | n/a | 0.10 |
| JEOL Resonance | ||||||||
| 8.0 | n/a | 616 | 8 | 201 | n/a | n/a | n/a | 9.66 |
| 4.0 | n/a | 69 | 19 | 269 | n/a | n/a | n/a | 2.16 |
| 3.2 | 2.2 | 49 | 24 | 241 | 2.5 | 110 | n/a | 1.92 |
| 2.0 | 1.6 | 17 | 40 | 251 | 5.0 | 152 | n/a | 1.07 |
| 1.0 | 0.5 | 0.8 | 80 | 251 | 6.4 | 63 | n/a | 0.10 |
| Samoson’s lab (Darklands OU) | ||||||||
| 3.0 | n/a | n/a | 30 | 282 | n/a | n/a | n/a | n/a |
| 1.8 | n/a | 15 | 50 | 283 | n/a | n/a | n/a | 1.05 |
| 1.3 | n/a | 5.2 | 67 | 274 | n/a | n/a | n/a | 0.50 |
| 0.81 | 0.55 | 1.02 | 100 | 254 | 11.1 | 119 | 24 | 0.16 |
| 0.51 | 0.35 | 0.31 | 150 | 240 | 15.8 | 109 | 30 | 0.08 |
dout and din are the outer and inner diameters, respectively. Their maximum available MAS rates (νR) are given along with the velocity of the rotor surface. Maximal relative centrifugal forces (RCF = 1/g × 4π2νr2 × din/2) and pressures (Pcentri = 1/3ρ × 4π2νr2 × (din/2)2, where ρ is the sample density, estimated to be 1200 kg·m–3) are calculated at these speeds. Temperature increase induced by the rotation (frictional heating) is reported for the maximal MAS rate (see Figure 20 for Bruker systems). The detection sensitivity is the product of the rotor volume and the inverse of the outer diameter and is normalized with respect to a Bruker 3.2 mm standard wall rotor.
For rotors manufactured by Bruker, the entry corresponds to the active volume. For all other rotors, we report the actual sample volume.
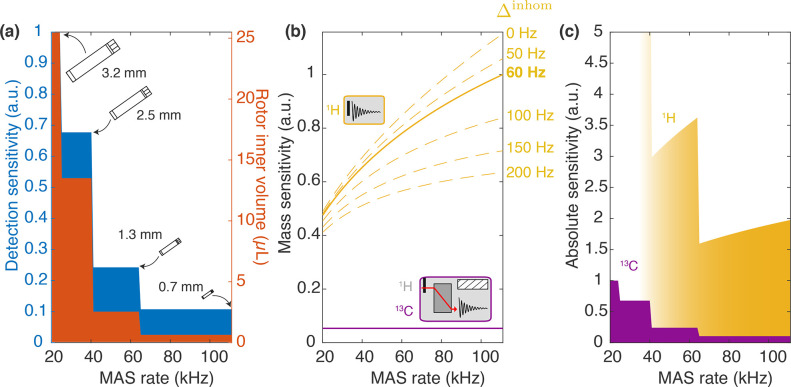
As can be readily appreciated from the comparison of the commercial rotors listed in Table 1 and displayed in Figure 8, a drastic decrease in the sample volume is entailed. In principle, it could scale with d2; however, in practice, also rotor length must be scaled accordingly, resulting in a ∝d3 dependence of a rotor (and approximately also sample) volume (Figure 9a, orange area). For example, 0.7 mm rotors can accommodate 0.59 μL, while 3.2 mm rotor inner volume is 25.5 μL, resulting, in principle, in a > 40 ratio of the overall sensitivity. This penalty is partially offset by the inductive coupling between a coil and sample, which improves as coil size decreases (∝d–1). In Figure 9a (blue area), the detection sensitivity for a series of commercial rotors is plotted against the achievable MAS rates, showing a roughly d2 dependence, with the detection sensitivity in a 0.7 mm rotor being nearly 10 times lower than 3.2 mm (Table 1).
Figure 8.

Comparison of six Bruker rotors spinning at MAS frequencies up to 111 kHz. The rotor outer diameters are indicated, while a pencil serves as a scale reference.
Figure 9.
Detection sensitivity as the function of MAS frequency (thus also rotor size) for 13C and 1H nuclei. (a) Rotor inner volume for different commercial rotors (Bruker 3.2, 2.5, 1.3, and 0.7 mm) is depicted an orange area. The detection sensitivity of the probe, calculated as the product of the sample volume and the inverse of the rotor diameter, is shown in blue in the same plot. Values are normalized to the detection sensitivity of a Bruker 3.2 mm probe. (b) Mass sensitivity of a direct proton 1D experiment (yellow) as compared to 13C-detected 1D CP (purple) versus MAS. CP efficiency of 50% was assumed. Increasing MAS reduces homogeneous contribution to 1H linewidths, which in turn translates into better sensitivity. Simulations are performed for different inhomogeneous contributions to the lines (from 0 to 200 Hz, dashed lines) and calculated values for microcrystalline GB1 correspond to the solid line (60 Hz inhomogeneous linewidth). 13C LW are supposed to be identical in the whole MAS range, corresponding to constant mass sensitivity. Values are normalized to 1H detection at 111 kHz MAS (with Δinhom = 60 Hz). (c) Product of the probe detection sensitivity and the mass sensitivity is given as the absolute sensitivity of 1H detection (yellow) and 13C detection (purple). Values are normalized to 13C detection at 20 kHz MAS.
In addition, provided that the acquisition time is adjusted to T2*, the signal-to-noise ratio scales inversely to the square root of the linewidth, producing a monotonic sensitivity gain with increasing MAS rate (per unit of sample). This effect yields an improvement of more than a factor of 2 between 20 and 111 kHz (Figure 9b, solid line). Of note, the gain of this kind depends strongly on the contributions to the linewidths, with larger mass sensitivity enhancements for the ideal case of purely homogeneous linewidths and more moderate gains when the inhomogeneous contribution is substantial (Figure 9b, dashed lines). This reduces the benefit of faster MAS for preparations characterized by large inhomogeneous broadening. Overall, the sensitivity of proton detection in a 0.7 mm rotor is still nearly twice as large as carbon detection in a 3.2 mm rotor, despite the massive sample reduction (Figure 9c).
The reduction in the required sample volume to fill small, fast-spinning rotors is of particular importance for biological samples, as it opens the way to the investigation of biological solids available in limited amounts. Notably, the decrease in sample quantity requirement below a milligram reached with 0.7 mm rotors brings complex membrane proteins into reach, which can often only be produced in small quantities.
Faster MAS rates have an additional indirect effect on sensitivity through longer coherence lifetimes, which result in a higher efficiency of the transfer steps employed in triple-resonance experiments (as delineated in section 5). Each scalar or dipolar transfer is governed by R2′ or R1ρ rate and pulse sequences performing not one but multiple successive coherence transfers between neighboring spins along the protein skeleton exponentially amplify this additional indirect sensitivity gain, with respect to the number of transfers.68
3.3. Paramagnetically Accelerated Acquisitions
It is interesting to note that (as we will discuss in detail in section 5) the RF schemes employed above 40 kHz MAS rely on both CP and heteronuclear decoupling performed with low-power irradiation. This translates into a further increase in sensitivity because it enables a reduction in the interscan delay to about 1 s (governed solely by T1). The high-power irradiations necessary at slower MAS require on the contrary longer delays (3–5 s thus ≫1.5 T1) in order to avoid excessive sample heating and subsequent deterioration.
In samples containing paramagnetic radicals or metal ions, T1 times are shortened, both for nuclei in proximity of the unpaired electrons (hyperfine interactions) and also across the entire sample (via spin-diffusion mechanism, particularly efficient for 1H due to their high gyromagnetic ratio). As a result, recycle delays as short as a few tens of milliseconds can be used for detection of the paramagnetic signals,69−71 boosting the theoretical sensitivity of 1H solid-state NMR by an order of magnitude compared to that of diamagnetic systems.
This sensitivity enhancement can be obtained in diamagnetic
substrates
using paramagnetic ion doping. This is usually performed by soaking
a sample with a buffer containing Cu2+ ions complexed with
EDTA72−74 or Gd3+ complexed with DTPA75 or DOTA76 or by incorporating
a thiol-specific EDTA–metal reagent bound to Cu2+ or Mn2+.77 These paramagnetic
ions effectively enhance the longitudinal relaxation rates of protons
without significant line broadening and chemical shift perturbation
side effects, yielding a sensitivity gain of  (where ν′rec and
νrec stand for the recycling rates with and without
paramagnetic doping, respectively). The approach, dubbed “paramagnetic
relaxation-assisted condensed data collection”,78 tackles the adverse scaling of T1 times with increasing MAS rates and raises the possibility
of extending fast MAS to systems available only in small quantities,
such as fibrils and membrane proteins, or to complex heterogeneous
biological systems at natural abundance.
3.4. Proton Dilution
3.4.1. Deuteration of the Backbone
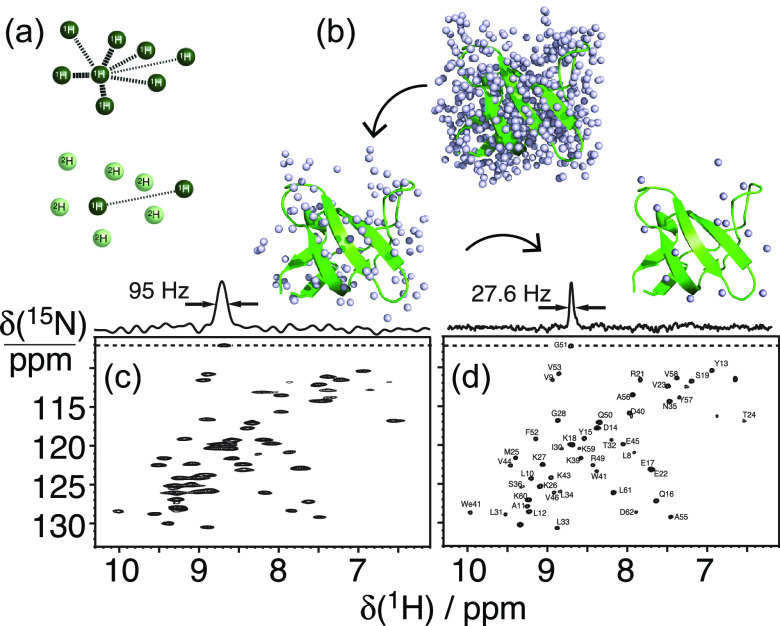
Ultrafast NMR probes have become available only recently. For many years, the only means to extract resolved information from 1H-detected NMR on biosolids has come through the combination of MAS with dilution of the proton content in the sample. After the first proof-of-concept demonstrations on small organic molecules and peptides,79−81 the concept was translated to proteins, where proton dilution is conveniently achieved by expression in perdeuterated media and then by exchanging the amides using buffers with appropriate H2O/D2O ratios to achieve protonation at a controlled level (Figure 10a,b). Resolution enhancements following protein deuteration were first demonstrated at MAS rates of 10–20 kHz on samples with full protonation of the amide sites (Figure 10c), yielding factors ξ of 5–7 in sensitivity enhancement versus 15N detection in microcrystalline model samples.82−84
Figure 10.
Proton dilution for high-resolution proton detection. The general dilution scheme is shown in (a) for an arbitrary spin network. In (b), the protons of SH3 are depicted for full protonation, exchangeable protons only, and finally, 10% exchangeable protons at random. 2D 1H–15N correlation spectra of a perdeuterated sample of microcrystalline SH3 with (c) 100% back-exchange and (d) 10% back-exchange acquired at 13 kHz MAS frequency at a magnetic field of 14.1 T. Reproduced with permission from ref (85) (copyright 2006 John Wiley & Sons) and ref (3) (copyright 2012 Elsevier).
Reif’s group showed that a further improvement in resolution could be achieved by lowering the levels of amide protonation down to 10%.85 On microcrystalline SH3, this approach yielded the most resolved 1H correlation spectrum in the solid state reported to date on a protein, with 1H linewidths of 17–35 Hz on a 600 MHz spectrometer (Figure 10d). At the same time, however, the extreme spin dilution countered the overall sensitivity benefits of 1H detection (Figure 11).
Figure 11.
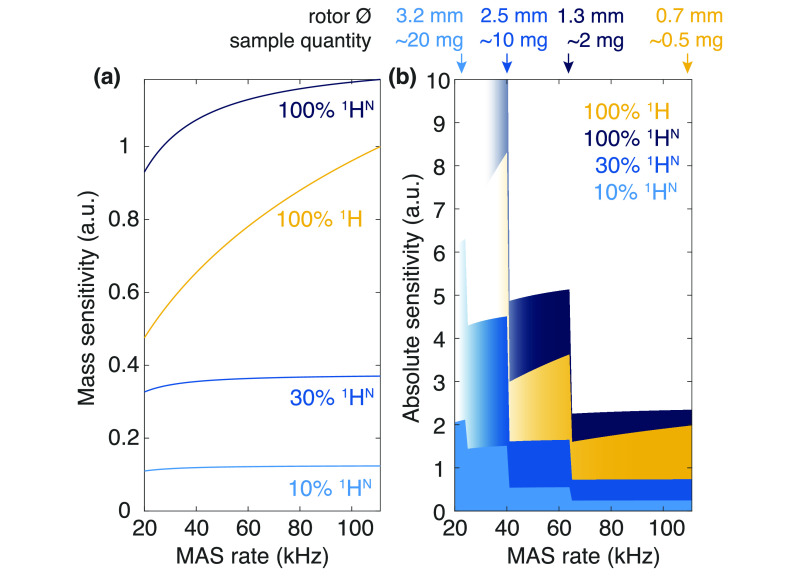
(a) Evolution of the mass sensitivity of 1H-detected experiments with MAS rates, estimated for different labeling schemes: 1H (100%) natural abundance (yellow), perdeuteration with 10% (light blue), 30% (medium blue), and 100% (dark blue) proton back-exchange at labile sites. 1H sensitivity is assumed to be proportional to αWH–1/2, where α is the level of protonation at the labile sites and WH is the 1H linewidth. The latter parameter is as measured on GB1 (for 100% 1HN and 100% 1H) or calculated with an inhomogeneous contribution of 60 Hz and homogeneous contributions extrapolated from refs (86) (for 10% 1HN) and (87) (for 30% 1HN). Similarly to Figure 8b, mass sensitivity is given with respect to 100% 1H samples spun at 111 kHz. (b) Absolute sensitivity of 1H-detected experiments, calculated as the product of probe detection sensitivity from Figure 8a and mass sensitivity. Values are indicated for the four labeling schemes of panel a with the same color code. Arrows indicate the conditions that maximize sensitivity without compromising resolution for each sample preparation. As in Figure 8c, the reference sensitivity is that of 13C detection in a Bruker 3.2 mm rotor at 20 kHz MAS.
Since the linewidths in that regime are dominated by inhomogeneous broadening, trade-offs in resolution were possible with higher (30–40%) 1H concentrations, with a larger number of total protons increasing sensitivity.88 At 24 kHz MAS, reprotonation levels of 40% were found as the best compromise between resolution and sensitivity for the NMR spectra of microcrystalline SH3.89 With faster MAS, however, the network of 1H dipolar interactions is more efficiently averaged and less 1H dilution is necessary to achieve the same narrow linewidths. At 60 kHz, this compromise is no longer necessary. Proton lines of two microcrystalline SH3 samples, perdeuterated with 10 and 100% exchangeable 1H, were found to be virtually identical, and both were dominated by inhomogeneous broadening on a 1 GHz spectrometer.86 Similarly, 1H linewidths of perdeuterated systems are only marginally different upon increasing MAS from 60 to 100 kHz.90 In fully back-exchanged (100% 1H at exchangeable sites) and otherwise [2H,13C,15N]-labeled microcrystalline GB1, for example, average amide 1H linewidths of 87 Hz can be obtained at 60 kHz and of about 81 Hz at 100 kHz. Nonetheless, 1HNT′2 increases steeply with MAS rate in this spinning regime regardless of the labeling scheme, halving the coherent contribution to the linewidths. In the case of deuterated GB1, 1HN coherence lifetimes of 23 ms were obtained at 111 kHz MAS versus 11 ms at 60 kHz, corresponding to a decrease of the 1HN homogeneous linewidth from 30 to 14 Hz.
3.4.2. Deuteration of Side-Chains
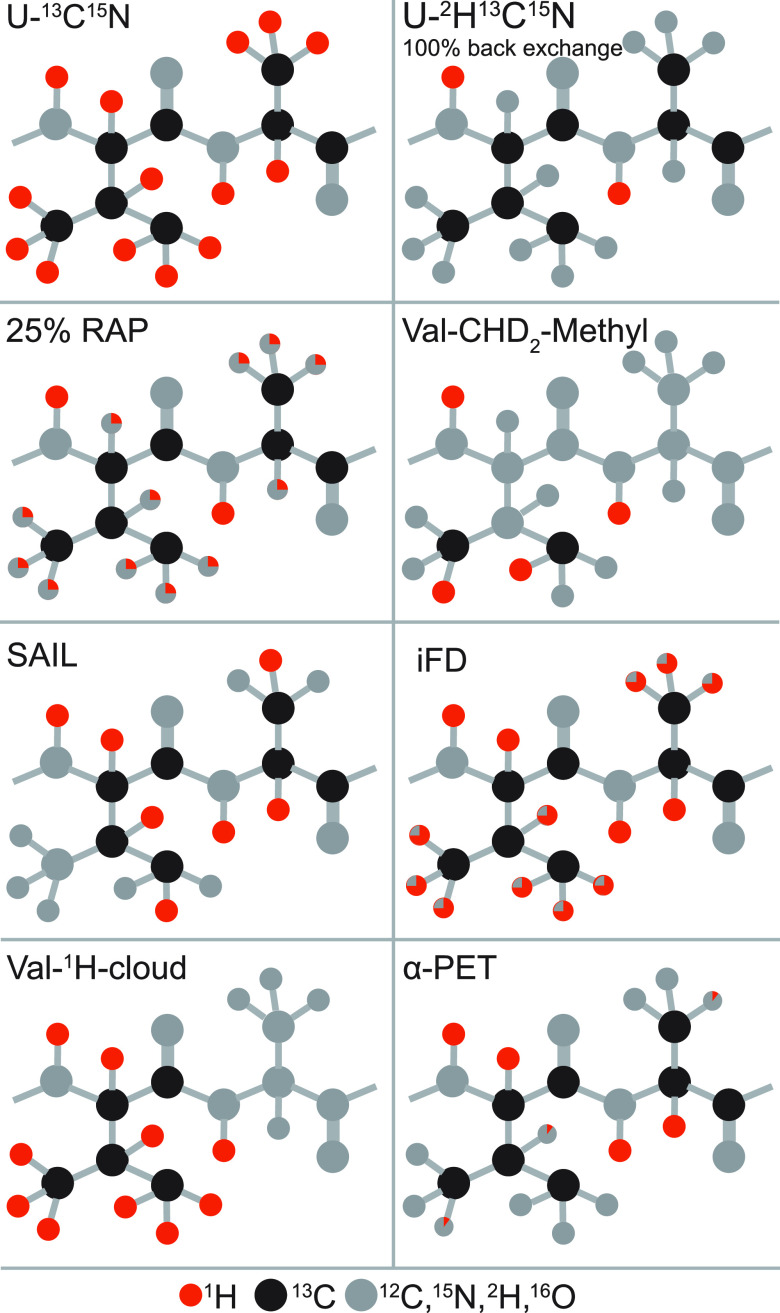
Side-chain signals are essential reporters of structure, dynamics, and interactions in a protein, but their observation is abolished in the perdeuteration and exchange approach. In contrast to amide sites, introduction of protons or deuterons in side-chains can only take place during protein expression. Several alternative protocols have therefore been developed for proton dilution within aliphatic and aromatic side-chains in order to observe their resonances with increased resolution and enable general application of 1H detection to large targets. A graphical summary of these labeling schemes is given in Figure 12, together with the resulting levels of 1H incorporation into the side-chains.
Figure 12.
Schematic representation of labeling schemes in a valine–alanine fragment. The nuclei present in natural abundance (C, N, O) and deuterons are colored in gray, 13C in black, and 1H in red. For positions that are only partially labeled in the protein, the rough 1H/2D ratio is indicated by a red/gray pie chart.
The first reports targeted the detection of high-resolution signals in methyl groups, which are important reporters of side-chain dynamics and, for the majority of globular proteins, provide tertiary contacts essential to define a protein fold with high precision. It was quickly realized that the deuterated precursors employed for protein biosynthesis are not completely 1H-depleted, and samples produced from >97% enriched 2H-glucose contain a non-negligible degree (∼9%) of methyl protonation.91 This finding progressively crystallized into two routes for the dilution of side-chain protons, consisting either in expression using 2H,13C-glucose and controlled low concentration (5–25%) of H2O in a D2O buffer, an approach termed reduced adjoining protonation (RAP),92 or in using 1H,13C-glucose in D2O media, in the so-called fractional deuteration (FD) method.93 These methods result in the incorporation of protons at a level of 10–40% into deuterated protein matrices and yield aliphatic 1H linewidths with a resolution between 25 and 60 Hz at 55 kHz MAS, permitting their site-specific assignment and opening the doors to structural and dynamical studies.
These approaches enhance resolution through a low site occupancy of aliphatic protons, as most sites are labeled in a largely random fashion from water or glucose sources. This, however, counters the benefits of 1H detection by impacting sensitivity. An alternative concept consists in supplementing an Escherichia coli deuterated expression medium with suitably labeled metabolic precursors. Following an idea originally proposed in the context of solution NMR, proton occupancy at methyl sites was shown to be significant when expression takes place from a partially (40%) protonated pyruvate precursor in 1:9 H2O/D2O media.94 Despite the fact that methyl groups of alanine, valine, leucine, and isoleucine are expressed as isotopomeric mixtures, the use of relaxation filters allows the acquisition of 1H,13C-methyl correlation spectra from a single isotopomer at a ultrahigh resolution comparable to that of solution NMR. Later, the use of α-keto acids and acetolactate as precursors was demonstrated to be the most efficient route for labeling of valine, leucine, and isoleucine residues, providing either 13C1H3 or stereospecific 13C1HD2 incorporation with 100% occupancy for these three residue types.95,96 CHD2 labeling provides lower occupancy but is useful when coupled to 60 kHz MAS for obtaining 1H–1H distance restrains without dipolar truncation97 as well as for the description of side-chain dynamics.98 Under these MAS conditions, CH3 labeling was shown to entail a certain loss of resolution compensated by a 2-fold higher sensitivity in fingerprint 13C,1H correlation spectra.
A technique which is not restricted to the presence of methyl groups is proton-cloud labeling, consisting in the incorporation of specific fully protonated amino acids into an otherwise deuterated matrix.99 This approach can be implemented with most canonical amino acids, which are added independently in a desired 1H-cloud pattern. Incorporation of protons in undesired amino acids (“scrambling”) is dependent on the biosynthetic pathways active in a given expression system. In E. coli, this is generally negligible for almost all amino acids outside of the citric acid cycle or can be suppressed with auxotrophic strains. A 2–3-fold reduction of proton linewidths and spectral crowding was reported at 60 kHz MAS for a V,L 1H-cloud-labeled sample of microcrystalline ubiquitin and a V,L,K 1H-cloud-labeled sample of membrane-embedded BamA, a component of the β-barrel assembly machinery.99
3.4.3. Incomplete Exchange Issue
Expression in D2O is a common requirement in all methods for proton dilution described above. The use of highly concentrated D2O, however, slows down growth and lowers the expression levels in bacteria and is often incompatible with certain expression systems, e.g., insect or mammalian cells. Reintroduction of 1H by exchange requires additionally transient or chemically induced unfolding and refolding and is thus limited to exchangeable and solvent-accessible sites if a protein is folded in the presence of suitable chaperones. This is also the case for systems that assemble directly after expression such as viral coat proteins or for integral membrane proteins, where a drastic loss of information is observed for the extensive hydrophobic transmembrane regions shielded by the lipid bilayers.100 Different labeling strategies provide a solution to the issue.
Inverse fractional deuteration (iFD), proposed by Weingarth and co-workers,101 relies on a minimal expression medium composed by 2H-glucose in H2O. This results in low (10–40%) and random deuterium incorporation in side-chains but in 100% 1H occupancy at Hα sites, including those in exchange-protected regions. iFD increases 1H coherence lifetime by about 40% compared to full protonation and entails remarkable resolution enhancements in 1H,15N and 1H,13Cα correlations not only at 60 kHz MAS but also at 100 kHz MAS.90 Most importantly, iFD was shown to provide access to backbone and side-chain resonances in transmembrane regions of the potassium transporter KcsA.101 In this scheme, improved 1H resolution is also observed for the rest of the side-chain resonances, where the advantage is, however, offset by an increased broadening of the 13C resonances (up to 0.3 ppm per 2H) due to the 1H/2H isotopomeric distributions. The α proton exchange by transamination (α-PET), demonstrated by Andreas’ group,102 allows for full protonation at the backbone Hα position, while maintaining protein side-chains with a high level of deuteration. This method consists of supplementing a growth medium with keto acids, which are converted by E. coli transaminase activity to the respective amino acids, while adding a proton at the α position from the water pool. Protonation of Hα positions higher than 90% was observed for Ile, Leu, Phe, Tyr, Met, Val, Ala, Gln, Asn, Thr, Ser, Glu, and Asp while suppressing many side-chain signals. Gly methylene carbon is labeled preferentially with a single deuteron, allowing stereospecific assignment of its α protons. A resolution improvement by a factor of 2 or higher was observed in 1H,13Cα correlations with respect to fully protonated samples at 55 kHz MAS, easing the determination of Hα–Hα and Hα–HN contacts defining β-sheet topologies.
Stereoarray isotope labeling (SAIL) conjugates proton dilution with complete site incorporation at any aliphatic side-chain position.103 It offers access to all side-chain sites and considerably reduces spectral crowding due to flexibility and precise control over sites of incorporation with inherent absence of scrambling. For example, reduction of 1H linewidths by factors ranging between 2 and 7 were reported for valine residues in microcrystalline ubiquitin at moderate MAS rates (∼30 kHz).104 Coupled with 80 kHz MAS, SAIL was demonstrated to yield a complete side-chain signal assignment in microcrystalline ubiquitin with as little as 10 nmol of sample within 3 days.105 Due to the high cost of specifically labeled amino acids, the approach has so far seen specialized implementation but is expected to become viable for backbone and side-chain assignment with the sub-milligram sample requirements of fast MAS.
Finally, with sample amounts decreasing below a milligram at very fast MAS, the use of cell-free protein synthesis (CFPS) expression systems becomes feasible for NMR sample preparation.106 CFPS has the advantage that various NMR isotope labeling schemes, including amino-acid-selective labeling, can be easily implemented. Importantly, also deuteration in combination with complete amide protonation can be achieved directly during synthesis, avoiding a denaturation and refolding step. In this context, the wheat-germ (WG) CFPS has recently been shown to be instrumental for the production of hepatitis C virus (HCV) membrane proteins in both fully protonated and deuterated/back-exchanged forms, demonstrating the possibility of structural investigations of eukaryotic membrane proteins by solid-state NMR.107−109
3.5. Why Do We Need to Spin Even Faster?
As seen above, the incredible progress in probe technology that occurred over the last 20 years has extended the range of available MAS frequencies up to above 100 kHz, enabling the detection of resolved resonances from fully protonated samples. From a necessity, deuteration has turned today into an option for studies by 1H-detected solid-state NMR.
Nonetheless, even at the fastest MAS rotation frequencies available, the spectral resolution obtained from deuterated samples is superior to that observed using protonated samples, with a strong dependence of 1H and heteronuclear coherence lifetimes on the deuteration level.90,110
Meier’s laboratory has extensively investigated the MAS behavior of the homogeneous linewidths in microcrystalline ubiquitin, in deuterated and 100% back-exchanged114 as well as in fully protonated preparations.50,115 They have recently shown that a relatively quantitative determination of these linewidths could be obtained with a second moment approach for rigid parts of the protein.116 The linewidths can also be simulated using (computationally expensive) numerical methods for a small number, on the order of 10, spins,116−118 although the results are not expected to be quantitative.
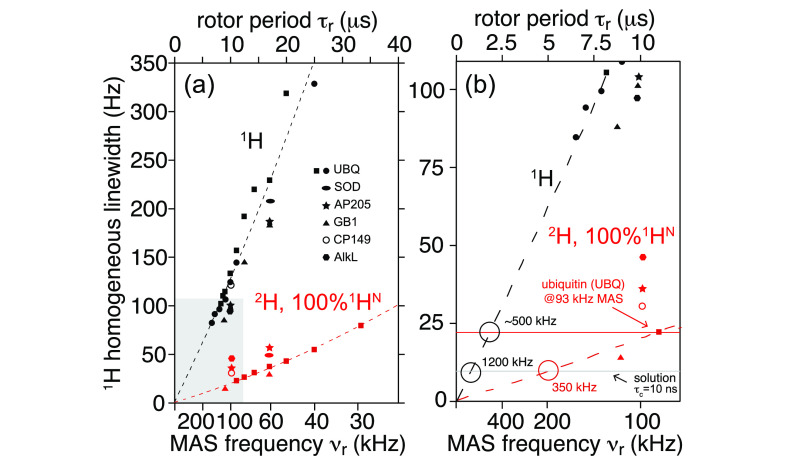
Homogeneous linewidths measured by Meier and co-workers are compiled into Figure 13 together with several other literature data on different microcrystalline and noncrystalline systems. From this plot, it is evident that coherent effects still determine the 1H resolution at 100 kHz MAS for fully protonated samples, and that further linewidth reduction is envisaged with faster MAS. The first studies on prototype probes capable of spinning at 12650 and even 150 kHz MAS115 report a further improvement in the resolution for fully protonated systems, but also in these cases, the observed homogeneous linewidths are still significantly larger than those accessible combining MAS with spin dilution. One can appreciate from Figure 13b that MAS rates of above 500 kHz would be necessary to reduce the homogeneous linewidth of a protonated system to that observed today on a partly deuterated protein at 100 kHz. Figure 13b extrapolates also the MAS rates required in order to match the homogeneous linewidths typically observed in solution for a protein of the molecular weight of ubiquitin (τC ≃10 ns). This corresponds to MAS rates over 300 and 1000 kHz for deuterated/back-exchanged and protonated samples, respectively (note, however, that slower rates would be required for larger proteins, for which the solution linewidth grows to ∼50–100 Hz while the solid-state linewidth is expected to still be the same).
Figure 13.
Homogeneous linewidths reported in the literature for protonated (black) and perdeuterated samples with 100% back-exchange of labile protons (red), at 23.5 T B0 field: GB1, microcrystalline β1 immunoglobulin binding domain of protein G (triangles);111 SOD, microcrystalline CuI,ZnII-loaded dimeric superoxide dismutase (ellipses);112 AP205, Acinetobacter phage 205 coat protein (stars);111 AlkL, outer-membrane alkane transporter from Pseudomonas putida (hexagons);60 and at 20.0 T B0 field strength: UBQ, microcrystalline human ubiquitin (squares and filled circles); CP149, hepatitis B viral capsid core protein (open circles).113 For ubiquitin, three sets of experimental values correspond to the studies by Penzel et al. (squares),114 Penzel et al. (filled circles),50 and Schleedorn et al.115 and dashed lines to the fits reported therein (valid for B0 ≈ 20.0 T). The right panel shows a close-up view for MAS rates above 100 kHz, indicating the putative MAS rate (νr ≃500 kHz) for which protonated samples will reach the coherent linewidth (red horizontal line) of deuterated samples spun at 100 kHz. Similarly, the gray horizontal line indicates a hypothetical MAS rate required for a protonated (νr ≃ 1200 kHz) and a deuterated (νr ≃350 kHz) sample to match 1H resolution observed in solution NMR for a small protein of MW = 10 kDa (τc ≃10 ns). Note that the x-axis is linear with rotor period.
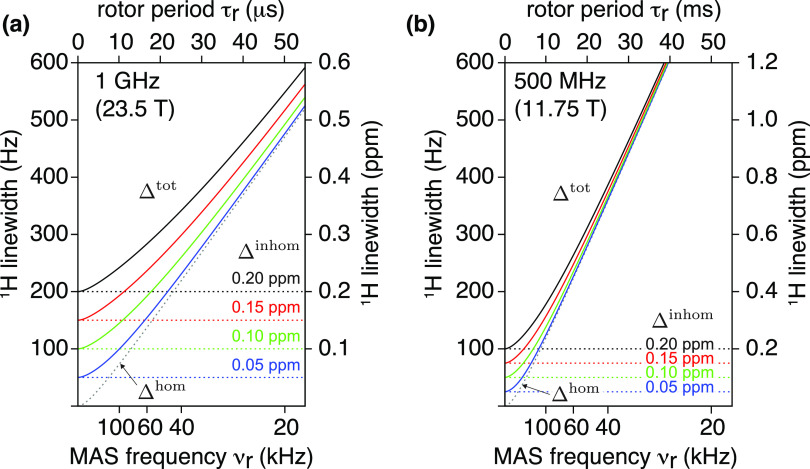
Whether these prospective improvements in homogeneous linewidth would turn into observable resolution enhancements, however, would depend on the nature of the sample, according to the relative weight of the (MAS independent) inhomogeneous contribution in the total linewidth (Figure 14). For samples of exceptional quality, the inhomogeneous line is sufficiently narrow that substantial line narrowing can be expected beyond 150 kHz MAS. For example, for a microcrystalline system such as GB1 (Δinhomog ≈ 0.05 ppm), a reduction of the linewidth by 30% can be expected by increasing MAS rates from 100 to 200 kHz, which corresponds to the ability to resolve at least twice as many signals in a multidimensional experiment containing two proton dimensions. For samples with a less ideal homogeneity such as fibrils or membrane proteins in lipid bilayer preparations (Δinhomog ≈ 0.15–0.2 ppm), diminishing improvements in resolution are expected beyond 100 kHz. Also for these samples, however, the indirect gain associated with longer coherence lifetimes will always be present, with the immense potential to enhance global sensitivity, notably in spectra of high dimensionality, which contain multiple transfer steps.
Figure 14.
1H resolution as a function of degree of sample or structural inhomogeneity (Δinhom). Total effective linewidth, Δtot (solid curves), is simulated for a range of MAS frequencies using eq 11, assuming the inhomogeneous contribution of 0.2, 0.15, 0.10, and 0.05 ppm (black, red, green, and blue solid and dashed curves, respectively), and the homogeneous contribution as determined experimentally for νr = 40–111 kHz for a representative amide 1H of residue T11 in nondeuterated GB1 on 23.5 T (a) and 11.75 T (b) spectrometers. The x-axis is linear with rotor period. Note that despite a generally lower absolute linewidth (in Hz) on a 500 MHz 1H spectrometer (b) for νr > 60 kHz, the actual resolution in ppm (second vertical axes) is inferior compared to that of a 23.5 T spectrometer (a).
3.6. Why Do We Need Higher Fields?
Equally important in 1H-detected MAS NMR is the use of very high magnetic fields, which simultaneously enhance resolution and sensitivity. The leaps forward accomplished by 1H-detected NMR over the past decade have been made possible by the availability of high magnetic fields in the range between 18.8 and 23.5 T (800 MHz and 1.0 GHz in 1H Larmor frequency), and this momentum continues to be fueled with the installation and the operation of the first persistent superconducting magnets at 28.2 T (1.2 GHz) by Bruker Biospin and with the development of a series-connected hybrid magnet capable of increasing the 1H Larmor frequency up to 1.5 GHz at the National High Magnetic Field Laboratory in Tallahassee (FL).
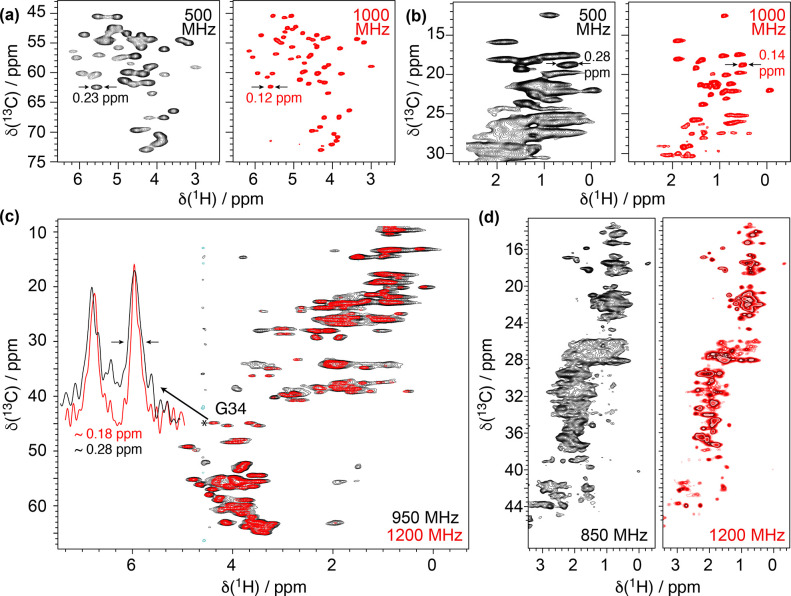
Magnetic fields do not have an impact on resolution in the presence of dominant inhomogeneous broadening (which is constant in parts per million) but do improve resolution for homogeneously broadened signals. The effect of a field increase is two-fold, that is, a larger chemical shift dispersion (which scales with 1/B0) and a further reduction of the coherent contributions to the linewidth (note the difference in slope of Δhom in Figure 14 between 23.5 and 11.75 T fields), as heavily overlapped proton resonances become more separated and spin polarization exchanges by flip-flops are slowed down. This latter effect is stronger for protonated samples, where the proton dipolar network is denser, and may lead to remarkable more than linear improvements in resolution at higher fields (Figure 15) and is particularly noticeable for CH2 and CH3 aliphatic side-chain resonances.
Figure 15.
Comparisons of 2D 1H–13C correlation spectra at 100 kHz MAS and at two different external magnetic fields for fully protonated (a,b) microcrystalline GB1 (ω0,H/(2π) = 500 MHz in black and 1000 MHz in red), (c) M2 embedded in lipid membrane (ω0,H/(2π) = 950 MHz in blue and 1200 MHz in red),118 and (d) sedimented Rpo4/7 protein complex (ω0,H/(2π) = 850 MHz in blue and 1200 MHz in red).119 Reproduced with permission from ref (118) (copyright 2021 MDPI) and ref (119) (copyright 2021 Springer Nature).
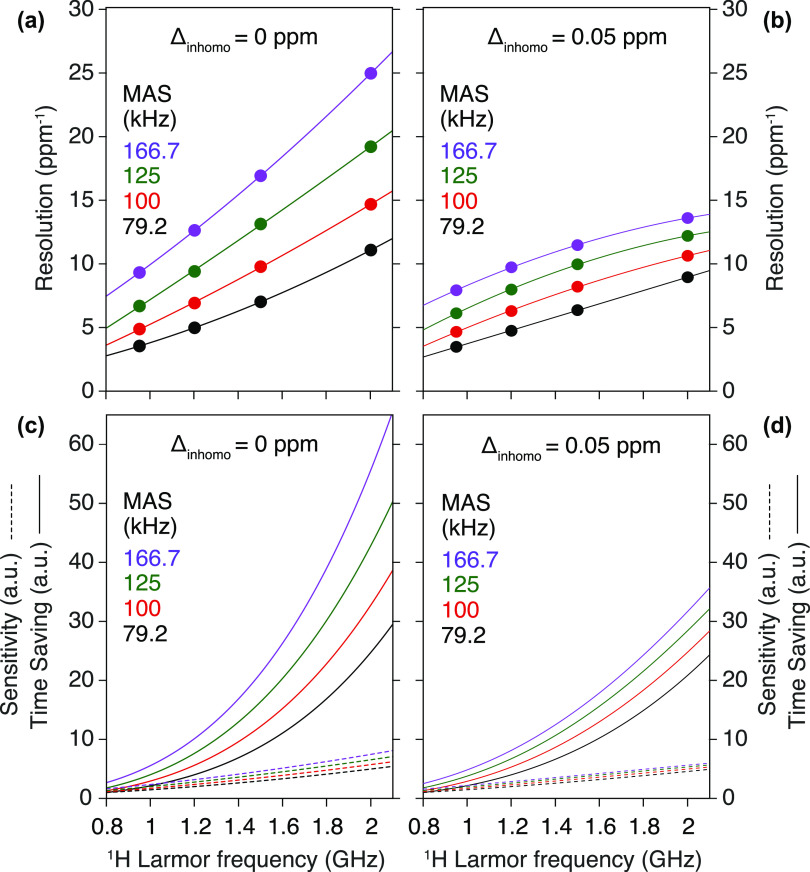
This phenomenon was reported for microcrystalline proteins at 750 MHz54 and 1 GHz120 and more recently confirmed on a variety of samples including membrane proteins, fibrils and capsids investigated by Andreas’ and Meier’s groups at 1200 MHz.118,119 These resolution enhancements are even more important if one again considers that NMR spectra are mostly recorded in a multidimensional frequency space. In this light, for example, a 25% increase in field strength (1 GHz versus 800 MHz or 1.2 GHz versus 950 MHz) translates into the possibility of resolving 2- and 2.5-fold more signals in a 3D or a 4D correlation, respectively. Given that dipolar coherent contributions still play a major role in the linewidth even above 100 kHz MAS, a significant resolution gain can be predicted for the combined use of faster MAS rates and higher field strengths (Figure 16a).118
Figure 16.
Evolution of resolution (a,b) and sensitivity (c,d) as a function of the external magnetic field, simulated for glycine protons.118 In addition to the homogeneous dipolar broadening, panels (b,d) include an inhomogeneous contribution of 0.05 ppm to the lines. Resolution is defined as the inverse of the full linewidth at half-maximum (FWHM) of the proton signal in parts per million and is calculated for 79.2 kHz (black), 100 kHz (red), 125 kHz (green), and 166.7 kHz (purple) MAS frequencies. Sensitivity was assumed to scale as B03/2 and WH–1/2, where B0 is the external magnetic field and WH is the FWHM of the proton signal in hertz. Time saving was defined as the square of the sensitivity.
This effect would still be relevant even in the presence of moderate inhomogeneous contributions (Figure 16b). Spectral sensitivity depends on the external magnetic field strength and scales with B03/2 (Figure 16c,d). For the 1H–15N and 1H–13C correlation spectra of Figure 15, improvements in sensitivity of about 2.8 and 1.4 (i.e., of ≃8 and 2 in experimental time) were observed on the 1 GHz as compared with the 500 and 800 MHz instruments, respectively, and of about 1.3 (1.6 in experimental time) on the 1.2 GHz as compared with the 950 MHz. Even larger gains in sensitivity are expected for 1H–1H dipolar interactions transitioning from a strong coupling to a weak coupling limit upon increasing the field strength. For example, upon increasing the magnetic field from 11.7 T (500 MHz) to 23.5 T (1 GHz), additional gains as large as a factor of 2 beyond the expected factor of 23/2 = 2.83 were observed for methyl groups located in proton-dense regions.121 Overall, the improvement in sensitivity and resolution brought up from the combined use of faster MAS rates and higher field strengths is set to produce unprecedented benefits for biomolecular 1H-detected solid-state NMR, clearly broadening the applicability of the method and bringing a whole range of new systems within reach.
4. Practical Aspects of 1H-Detected MAS NMR
4.1. Sample Optimization
Unlike the solution counterpart, solid-state NMR has no protein molecular weight limitation, and furthermore, higher pH values (>7.4), inclusion of salts, lipids, or precipitation agents needed to maintain sample homogeneity do not impact spectral quality, with the exception being t1 noise from proton containing components present in large quantity. Therefore, almost any kind of protein sample can be investigated by solid-state NMR, provided it can be isotopically labeled and immobilized in a MAS rotor.
Small soluble proteins in a microcrystalline state are traditionally used for methodology developments.18 Crystalline preparations usually show the highest homogeneity, resulting in long coherence lifetimes and sensitive, well-resolved spectra. While X-ray crystallography studies require small amounts of large crystals, solid-state NMR requires milligram quantities of protein crystals, but diffraction quality is not required. Buffer conditions for protein microcrystallization are usually inspired from previous crystallography works.122 Most commonly, protein solutions at very high concentrations are titrated with precipitants such as polyethylene glycol (PEG), 2-methyl-1,3-propanediol, or ammonium sulfate until the solubility limit is reached and, when conditions are matching, the protein precipitates as microcrystals. Using batch methods, tens to hundreds or milligrams of protein can be prepared, sufficient material to fill large 3.2 and 4 mm rotors. This procedure is very fast and efficient for highly stable samples but might be too harsh for more fragile proteins. The development of smaller rotors reduced the sample requirements to 0.5–2 mg and returned to the traditional sitting-drop crystallization setup.
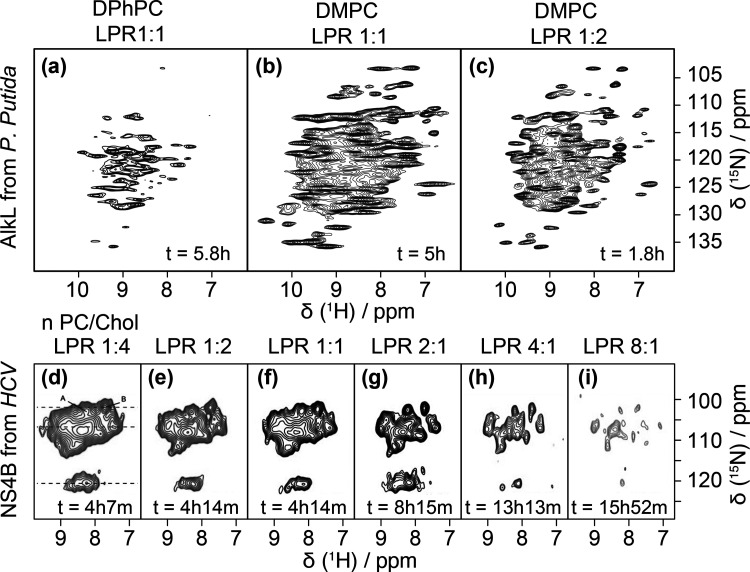
Membrane proteins are usually more challenging because of the lower expression yields and the need of a suitable membrane mimic to maintain stability during purification. Since these premises are conserved among all in vitro techniques, also here existing protocols can be adopted. Crystallization is a possible method for membrane protein preparation but reconstitution into lipid bilayers is experimentally more straightforward and physiologically closer to the native environment.123,124 Lipid preparations are commonly sedimented by ultracentrifugation and packed into the NMR rotor as a hydrated lipid paste. Parameters such as the type(s) of lipid, the lipid-to-protein ratio, pH, and salt concentration, and the reconstitution method itself need to be optimized in order to improve sample homogeneity. Screening can be performed with activity assays, if applicable, or directly by comparing solid-state NMR fingerprint spectra. Figure 17 shows the sample optimization for AlkL (top) in terms of lipid type, and the NS4B protein from HCV (bottom) for the lipid-to-protein ratio. Optimal conditions can be deduced from the quality of the (H)NH correlation spectra. Proteins and peptides prone to formation of amyloids are either expressed or synthesized and kept under denaturing conditions throughout the purification. Fibril formation is then initialized by buffer exchange and oligomerization occurs within minutes, hours or up to several days depending on the protein. Experimental conditions influence the formation of specific polymorphs and the sample homogeneity in general.125 Preformed seeds can be used to accelerate fibril formation and drive it toward a specific polymorph of particular interest.126 Fibrils are packed in rotors as hydrated protein aggregates. Other methods for immobilization of soluble proteins are direct sedimentation by ultracentrifugation127 or entrapment into biosilica materials.128 Sedimentation works particularly well for large multimeric protein assemblies such as viral capsids.
Figure 17.
Top: Sample optimization of 15N-labeled AlkL in lipid bilayers of different compositions. (a) DPhPC, protein-to-lipid ratio 1:1, (b) DMPC, protein-to-lipid ratio 1:1 recorded on a 800 MHz spectrometer at 60 kHz MAS, (c) DMPC, protein-to-lipid ratio 2:1, recorded on a 1000 MHz spectrometer at 111 kHz MAS. Reproduced with permission from ref (12). Copyright 2018 Elsevier. Bottom: Spectral resolution as a function of LPR. Two-dimensional 1H,15N correlation spectra of Gly- and Tyr-labeled NS4B reconstituted into PC/Chol liposomes at LPRs from 0.25 to 8 acquired at ωH = 850 MHz and 80 kHz (d–g) or 90 kHz (h,i) MAS. Reproduced with permission from ref (108). Copyright 2020 John Wiley & Sons.
4.2. Rotor Packing
The rotor packing process should achieve maximal signal/noise, ensure biological relevance, and be robust and reproducible. Of equal importance is the sample hydration, which critically impacts homogeneity and thus for high-resolution NMR, hydration must typically be preserved at all times including the process of packing.
In order to maximize the NMR signal, one aims to pack the maximum amount of sample at the expense of excess buffer. Centrifugation is typically employed to concentrate the biological solids to fit them into the MAS rotor volume. Traditionally the hydrated sample is centrifuged into a dense pellet and transferred into the rotor either by carefully scooping the sample with microspatulas or using funnel-shaped devices made of pipet tips or other common lab plastics in combination with a fixed-angle tabletop centrifuge. These methods risk sample losses, partial dehydration and uneven packing of the material, the latter compromising MAS stability. Furthermore, these approaches become increasingly inconvenient with smaller rotors.115 A superior method, successfully employed in our and other laboratories for many years, relies on the use of dedicated ultracentrifugal packing tools129−131 (Figure 18). Sample pelleting and rotor filling are combined in a single step and the use of swing-out rotors guarantees the even packing of the sample. While crystalline preparations have limited capacity of compression and can be packed in short time, membrane and fibril samples profit from extended centrifugation times for dense packing and removal of excess water. Such devices can also be used to sediment soluble proteins directly into a MAS rotor.132
Figure 18.
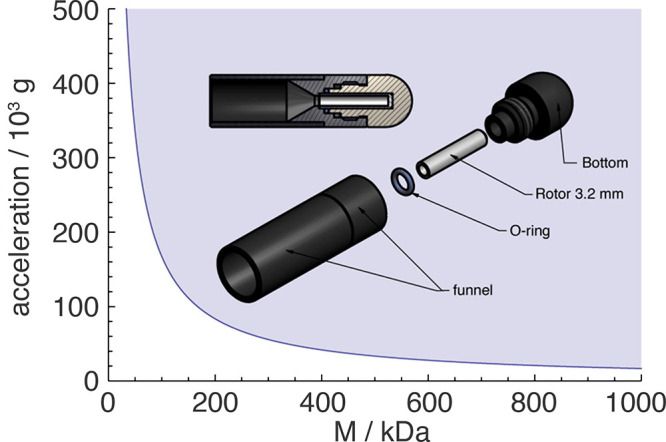
Schematic drawing of a solid-state NMR rotor filling tool for a swinging bucket ultracentrifuge rotor. The plot indicates the theoretical acceleration needed to sediment a protein (assembly) of a given molecular weight. Adapted with permission from ref (133). Copyright 2019 Elsevier.
4.3. Frictional Heating and Temperature Control
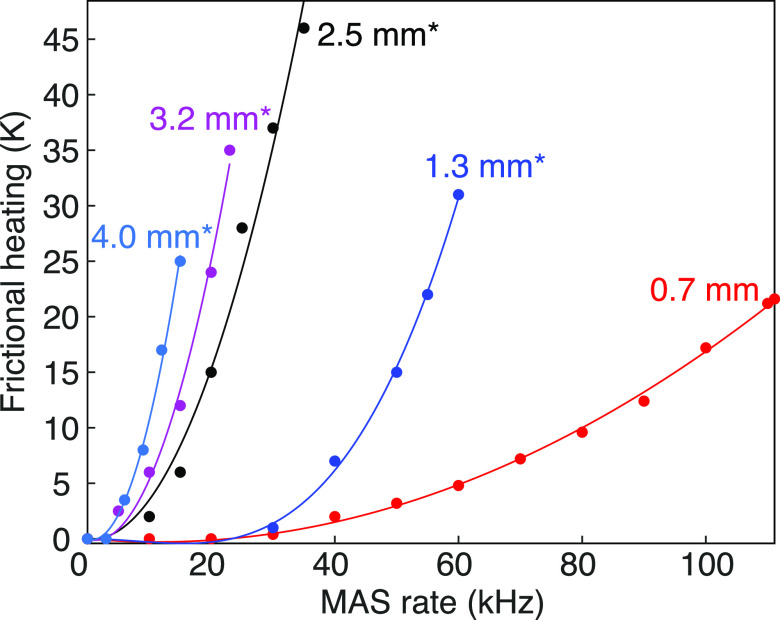
Magic-angle spinning induces frictional heating which, if not controlled, might result in dehydration or degradation of biological samples. Frictional heating increases with the linear speed at the rotor periphery and depends strongly on the stator design. The temperature increase induced by frictional heating is illustrated as a function of MAS frequency in Figure 19 for commercial Bruker probe models.
Figure 19.
Frictional heating induced by MAS rotors of different sizes in dependence of their spinning frequency. Parabolic fit curves are plotted as lines. Asterisks label the experimental datasets, determined by monitoring the chemical shift of lead chloride. Data points for the 0.7 mm probe are inferred from the 79Br chemical shift of KBr following the procedure described in ref (135). In this experiment, the variable-temperature gas flow was set to 1200 L/h and regulated at 293 K. Adapted with permission from ref (134). Copyright 2017 Elsevier.
A strong flow of cooling gas is applied to counter the heating and keep the sample in a physiologically relevant temperature range. The temperature is usually measured at the cooling gas outlet and not inside the rotor, resulting in a discrepancy between the displayed temperature and the actual sample temperature. Understanding the extent of frictional heating as a function of MAS frequency requires the use of an external or internal “NMR thermometer”, i.e., specific compounds that exhibit a temperature dependence of the isotropic chemical shift. Suitable substances for external temperature calibration are KBr, Sm2Sn2O7, Pb(NO3)2, or (CH3NH3)PbCl3 (refer to Table 1 in ref (134)). KBr has the advantage that a designated rotor is most likely already available in a laboratory and that every probe for biomolecular NMR tunes to 79Br which has a frequency close to 13C. Considering that the frictional heating and sample cooling efficiency vary only minimally from one rotor to another, external temperature calibration can provide a very good estimation of the sample temperature. Water is most commonly used as an internal temperature sensor in biomolecular solid-state NMR even though its 1H peak is usually not very sharp and might correspond to different water pools.130 Methyl or methylene proton signals from precipitants such as PEG or MPD or from lipids in membrane protein preparations can serve as an internal chemical shift reference. Water-soluble lanthanide complexes such as TmDOTP can be added to the sample for a more precise measurement of the sample temperature in real time.136 This is also useful for the quantification of temperature gradients across the rotor and their dependence on radio frequency irradiation or spinning frequency.
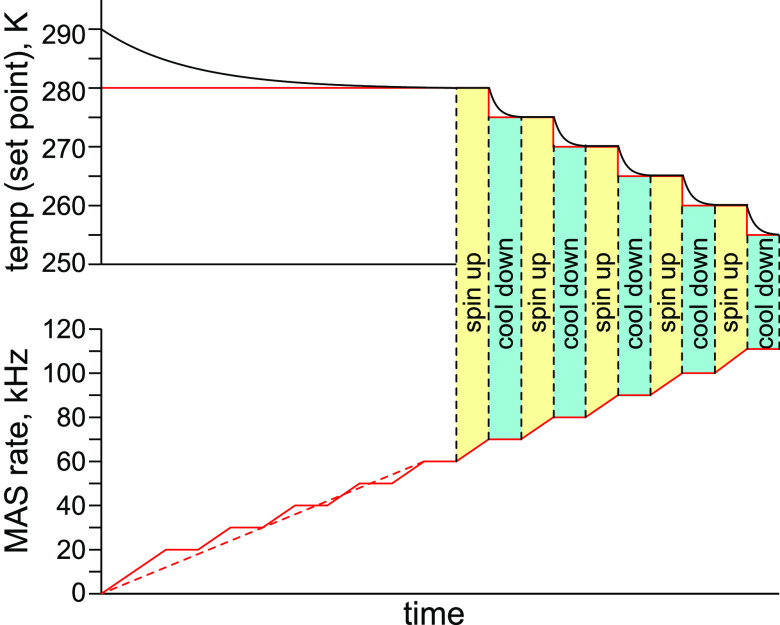
In order to compensate the temperature variation and preserve sample integrity, a stepwise spin-up and cool-down (and, vice versa, spin-down and warm-up) protocol is typically applied as shown in Figure 20 for a 0.7 mm Bruker rotor.
Figure 20.
Spin-up and cool-down method to counter frictional heating with sample cooling in order to keep the sample temperature constant in a Bruker 0.7 mm rotor.
4.4. Magic-Angle Setting
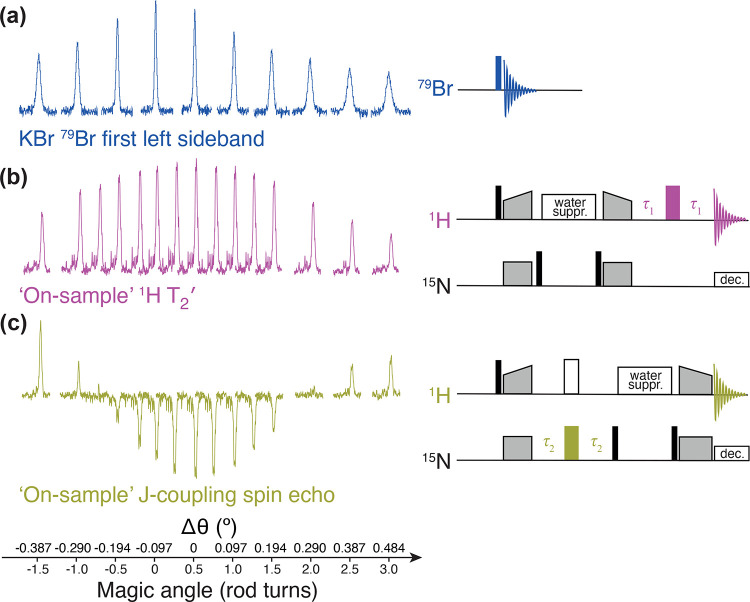
The magic angle on MAS NMR probes is traditionally set using KBr.137 A small quadrupole coupling in crystalline KBr is the result of defects in the cubic lattice. Under MAS, this manifests itself in the 79Br spectrum as a pattern of side-bands, whose relative intensities are very sensitive to the magic-angle setting. In MAS probes, the intensity of the first spinning side-band is used to monitor the effect of systematic adjustments around the magic angle, usually at low MAS frequencies of about 5–10 kHz. Figure 21a shows the side-band intensity changes by turning the rod by 180°.
Figure 21.
Spectral data and simplified pulse sequences for three methods to set the magic angle. (a) Classic 79Br (KBr) method is shown on top, methods for angle adjustment directly on a protein sample rely either on (b) optimizing the 1H T2′ (middle) or (c) H–N J coupling spin–echo (bottom). In (b), the 1H echo delay τ1 is set close to T2′/2, whereas in (c), the 15N echo delay τ2 is set to exactly (2 JNH)−1 ≈ 10.87 ms to fully refocus 1JNH coupling.
For fast MAS probes, the small sample volume and a design optimized for 1H detection results in low sensitivity of the KBr method. At the same time, the 1H linewidth becomes particularly sensitive to the magic angle in the fast-spinning regime. Simulations showed that measuring at 0.05° off the magic angle already results in 10% or more increase in linewidth at 100 kHz MAS. Notably, just changing from KBr to a protein sample can induce such a mis-set. This observation led us to adjust the spinning angle for each sample based on the observation of proton T2′.118 First, the sample is spun to about 100 kHz and the cooling gas temperature set to the desired value. Then, only after the probe temperature is equilibrated, the (H)NH CP experiment is optimized. Finally, the angle is adjusted by maximizing the amide 1H T2′ for the bulk proton signal, using a 1D Hahn echo of appropriate duration (on the order of ∼T2′, Figure 21b). Amide signals are selected in this method and solvent signals suppressed by appending the Hahn echo to the (H)NH CP experiment. A slightly different alternative of the “on-sample” method was presented by Penzel et al., where the angle is set by optimizing the H–N J coupling full spin–echo.138 In this method, the goal is to eliminate the contribution of residual N–H dipolar coupling to the evolution of the scalar coupling (from the in-phase 15N single quantum (SQ), through the antiphase term, back to 15N SQ coherence) during the period incorporated into a regular CP-HSQC scheme (described in section 5). A comparison of the two methods is shown in Figure 21b,c. The J-modulated signal oscillates with angle deviations, whereas the T2′-based method produces a monotonically increasing function toward the optimal value. Both methods are suitable to adjust the angle on a fully protonated protein. The J modulation method is slightly more sensitive to angle deviations; however, the T2′-based method is more helpful when the angle setting is far from the magic angle, as it is always clear how to optimize toward the single maximum in the signal intensity.
5. Dissecting Triple-Resonance Pulse Sequences
Biomolecules contain hundreds to thousands of unique 1H resonance frequencies due to local differences in spin chemical environment and presence of anisotropic fields (e.g., ring currents). A key to detailed studies on structure, dynamics or interactions by NMR is thus site-specific resolution, but 1H line narrowing alone is far from sufficient to reach this objective. In fact, resolution is mostly enhanced by spreading detected 1H resonances in multidimensional spectra, where 1H frequencies are correlated to those of 13C or 15N spins (thus so-called triple-resonance techniques), leveraging on sample isotope enrichment. The actual choice of correlation type, i.e., the kind of coherence transfer between spins, determines whether the spectrum provides information on bond and spin topology (in resonance assignment techniques), dynamics properties, or structural features. In this section, we discuss the spectroscopic methods to obtain such correlations under fast (>40 kHz) MAS conditions which are commonly employed in resonance assignment. A vast majority of the discussed techniques are also used (along with additional tailored RF schemes) to compose experiments reporting on structure or dynamics, discussed later in this review.
5.1. Block Design of Correlation Experiments
Multidimensional experiments, despite their apparent complexity, consist in fact of a relatively small number of concatenated primitive building blocks. A general scheme shown in Figure 22a encompasses 1H excitation, several heteronuclear transfers or homonuclear mixing periods, interleaved with indirect evolution of chemical shifts, and a final acquisition of 1H FID signal. A simple but fundamental 2D correlation usually employs a dipolar coupling based cross-polarization (“CP-HSQC”,83Figure 22b) to effect a transfer between 1H and a heteronucleus X. Spin pairs that undergo microsecond or faster time scale dynamics evade the transfer, but can sometimes be detected using scalar-based methods (refocused “J-HSQC”, Figure 22c). Such a 1H–15N transfer found application in historically first triple-resonance techniques.139 However, as shown in Figure 23, it requires sufficiently long 1H coherence lifetimes (on the order of (2JXH)−1) for reasonable efficiency, thus it is practical only for extensively deuterated proteins139 or otherwise requires very fast MAS (above 100 kHz). A particular application is 1H,13C J-HSQC of selectively protonated 13CHD2-labeled methyl sites, which usually outperforms CP-HSQC due to particular dynamics of methyl spins97,140 (nevertheless, the highest sensitivity at about 60 kHz MAS is obtained with 13CH3 labeling and CP-HSQC, at a slight expense of resolution141). In either CP or J experiments, in contrast to a standard HSQC in solution NMR, in t1 one evolves an in-phase 15N or 13C SQ coherence under constant 1H decoupling for optimal resolution. Quite different than in solution, the HMQC-type of correlations proved disadvantageous even for extensively deuterated proteins,141 since strong homonuclear 1H interactions enhance relaxation of ZQ/DQ 1H–X coherences present in t1, offsetting any gain of suppressed incoherent direct dipolar 1H–X relaxation.
Figure 22.

(a) General block scheme of a multidimensional NMR experiment with 1H detection. An RF scheme of 2D 1H,15N or 1H,13C correlation experiments employing either two (b) cross-polarizations (“CP-HSQC”) or (c) refocused scalar transfers (“J-HSQC”) between 1H and heteronuclear spins (X).
Figure 23.
Efficiency of an out-and-back scalar-coupling-based transfer between 1H and 15N (1JNH = 93 Hz) as a function of 1H refocused coherence lifetime T″2 (neglecting efficiency loss of refocusing the antiphase to in-phase 15N coherences). Red, light blue, and blue circles correspond to 1HN bulk coherence lifetimes reported, respectively, for deuterated, inverse fractionally deuterated,101 and nondeuterated proteins. Labels denote the proteins, for which coherence lifetimes were reported in the following literature: UBQ, microcrystalline ubiquitin;50,142 GB1, microcrystalline β1 Immunoglobulin Binding Domain of Protein G;90,111 SH3, microcrystalline chicken α-spectrin Src-homology 3;86 SOD, microcrystalline superoxide dismutase;112 SSB, gel-like precipitate of the tetrameric single-stranded DNA-binding protein;120 AP205 sedimented, Acinetobacter phage 205 coat protein;90,111 β2mD76N, β2 microglobulin fibrils.68 The MAS frequency is indicated for each case.
5.2. Cross-Polarization
Dipolar transfer, most notably cross-polarization, is the most common and sensitivity determining building block of protein experiments. Floquet theory predicts recoupling under constant RF irradiation of dipolar-coupled nuclei A and B under the following set of conditions:
| 13 |
| 14 |
referred to as respectively zero-quantum (“high-power”)143 and double-quantum (“low-power”)144 CP conditions. Importantly, these two phenomena lead to opposite polarization transfer and interfere destructively if both conditions are exactly or approximately satisfied. As a consequence, there is a striking difference between CP at “slow” (Figure 24a) and “fast” MAS (Figure 24b,c). The increased spacing between ZQ and DQ conditions results in straightforward, predictable low-power (in terms of ν1/νR) conditions accessible at 60145,146 or 111 kHz MAS. Experimentally determined efficiency of 1H,15N CP-HSQC at variable RF strength during first CP (dubbed “square plot”, Figure 24d) generally follows the pattern predicted by spin dynamics simulations in SIMPSON.147 Additional features, specifically the skewed and broadened CP bands, originate from B1 field inhomogeneity on both RF channels and are possible to reproduce qualitatively (Figure 24e) using a relatively unsophisticated model of an RF coil comprising a few separate current loops. It is worth noting that due to a relatively broad B1 distribution in a short MAS RF coil, CP conditions entail a spatial selectivity148 and associated substantial sensitivity loss (compare Figure 24c,e). A common remedy is either a linearly ramped or tangentially modulated (“adiabatic” CP149) RF strength for one nucleus, typically the one with larger RF amplitude (usually 1H). Sensitivity improvement (Figure 24f) is two-fold: a larger sample volume contributes to the signal, and for a specific sample element, CP efficiency increases since deleterious effects of CSA are minimized. Ramped RF also broadens the effective CP condition (Figure 24f), thus contributing to higher stability of the transfer with respect to inevitable RF strength variations during long experiments. Recent CP RF schemes developed using optimal-control (OC) theory perform superior in recovering signal from sample in inhomogeneous B1 field.148 While, in principle, a specific OC pulse is extensively optimized for a particular MAS frequency, a relatively high efficiency (≥90%) can be retained in the range of 0.7–1.3 of nominal νR by appropriate rescaling of applied RF strength and pulse duration.150 Nevertheless, for largely different MAS frequency ranges (e.g., 50–70 and 80–120 kHz) individually optimized pulses must be used to account for time scale of evolution of various recoupled or suppressed spin interactions (which are not flexible with νR).
Figure 24.
Efficiency of 1H to 15N cross-polarization (a–c,e,f) simulated in SIMPSON147 and (d) measured experimentally using the 1H,15N CP-HSQC experiment with variable 1H and 15N RF strengths (within available power limits) during the first CP performed for a microcrystalline sample of maltose binding protein at 111 kHz MAS on an 18.8 T spectrometer. Theoretical CP efficiency at (a) 20, (b) 62.5, and (c) 111 kHz MAS with DQ and ZQ conditions color coded in blue and red, respectively. Simulations (a–c) assumed a uniform B1 field within an RF coil, the same sample amount and coil geometry in all cases, a contact time of 300 μs, and a spin system consisting of 15N and four 1H spins (1HN, 1Hα 1Hβ2, 1Hβ3) of a geometry and chemical shift tensors described in detail in ref (151). Time dependence of inhomogeneity (due to MAS) was not considered. (e) CP efficiency derived from (c) by taking into account the spatially dependent B1 field distribution, modeled according to the Biot-Savart law in 10,000 sample voxels, and generated by an 8-loop RF coil with infinitely thin wire of a geometry closely corresponding to Bruker 0.7 mm coil design (courtesy of Frank Engleke, Bruker BioSpin GmbH). (f) CP efficiency assuming additionally a moderately ramped 1H RF amplitude (varied from 0.9 to 1.0), as typically used for greater sensitivity and RF stability of the CP. All simulations included B1-dependent: excitation, sample coupling to the RF coil, and additional spatial filtering by a second CP (from 15N to 1H). (g,h) Simulated relative efficiency of (g) 1H to 15N (“forward”) and (h) 15N to 1H (“backward”) CP as a function of a contact time for the cases where the 1H RF amplitude is either constant (blue curve) or linearly varied from 0.8, 0.7, or 0.5 to 1.0 of the maximum RF over contact time (green, magenta, and orange curves, respectively).
CP transfer requires a certain time (dubbed “contact time”)
to build up, dependent on the magnitude of dipolar coupling ωD (in frequency units). For an isolated 1H–X
spin pair under MAS undergoing no stochastic motions, the transferred
X spin signal intensity has an oscillatory nature described as  , where β stands for the angle between
an internuclear vector and the rotation axis and τ denotes the
contact time.152,153 The first maximum should theoretically
occur at approximately 60 μs, 120 μs, and 1.0 ms, for
isolated 1H–13C, 1H–15N, and 13C′–15N spin
pairs. For a multispin system with concurrent long-range 1H–X dipole interactions, there is a superimposed slowly building
contribution, which shifts the first maximum, and the major oscillation
is damped with increasing τ (Figure 24g). The use of ramped RF on 1H spin also suppresses oscillations since effective (crystallite-averaged)
dipolar coupling is altered when traversing across Hartmann–Hahn
conditions. Also, sample elements in inhomogeneous B1 field contribute at various time, further averaging
out oscillations of CP signal. Excessive ramps should be avoided since
the passage would span over destructively interfering ZQ and DQ condition
(Figure 24g). For
the case of 1H–15N CP with a moderate
ramp (e.g., 0.7 to 1.0), a plateau is achieved at about 6–8
ms (Figure 24g); however,
in practice, the 1H T1ρ-like relaxation leads to an optimum typically already at 2–3
ms. Particular care should be taken when optimizing the contact time
of the backward transfer (from 15N to 1H). Although
simulation shows a maximum transfer in this case at about τ
= 2 ms (Figure 24h),
due to relaxation and the undesirable signal dispersion over multiple 1H sites one usually truncates the transfer at τ between
0.5 and 1 ms. Naturally, the 1H–X optimal contact
time can depend on the occupancy of proton sites: in perdeuterated
samples, back-exchanged at labile sites, it is about 5 ms for both
X = 13Cα and 13C′ as they undergo
long-range transfers; however, in fully protonated samples, only 1H–13C′ experiences a slow CP buildup.
5.3. Solvent Signal Suppression
Proper hydration of a solid protein sample is crucial to preserve resolution and long coherence lifetimes (Figure 25a).154 However, solvent 1H signal, which is at least 1 order of magnitude stronger than those of protein (Figure 25b), requires effective means of suppression.82 While a certain degree of depolarization is already achieved with 1H irradiation during CP (Figure 25c,d), an additional saturation, e.g., with a MISSISSIPPI scheme155 over typically 50–200 ms, with or without a homospoil gradient,82 leads to a fairly effective suppression (Figure 25c,d). Recently, Ishii and co-workers proposed a novel scheme for suppression of solvent signal from liquid phase employing adiabatic pulses (dubbed SLAP)156 which improves its efficiency by a factor of 3 (with regard to MISSISSIPPI), using even smaller 1H RF power and in a considerably shorter time (40–50 ms). The latter is of particular interest in the context of fast scan repetition (discussed in subsection 5.7), where solvent suppression contributes considerably to the overall experiment time.
Figure 25.
Relevance of sample hydration and efficiency of water signal suppression in 1H-detected MAS NMR. (a) Effect of gradual sample dehydration due to improper sealing of the rotor observed in 1H 1D spectra that lead to degradation of resolution of 1H and 15N resonances. (b–f) 1D spectra of a microcrystalline sample of chicken α-spectrin SH3 labeled uniformly with 2H, 13C, and 15N, selectively 13CH3-labeled for ILV residues, and back-exchanged at labile 1H sites, measured on a 18.8 T spectrometer in a 0.81 mm rotor at 94.3 kHz MAS. (b) Directly excited 1H spectrum with a close-up of a baseline. 1D first-increment spectra of (c,e) 1H,15N and (d,f) 1H,13C CP-HSQC experiments performed with one-step (c,d) or two-step (e,f) phase cycling. Green curves correspond to spectra with active suppression of water resonance by MISSISSIPPI of 40 ms duration (without use of a homospoil gradient).
When active suppression is combined with a basic coherence selection by appropriate phase cycling, the solvent signal is eliminated usually to the extent that no digital filtering is required (Figure 25e,f), provided stable experimental conditions (e.g., no coil vibrations) between scans. An important implication is the feasibility of 1Hα-detected experiments under fast MAS.62
5.4. Heteronuclear 15N–13C Transfer
An extension of
HSQC of Figure 22b
to triple-resonance experiments requires
an introduction of a heteronuclear 15N–13C transfer, which can be implemented by CP or, as in the early versions
for perdeuterated proteins,139,157 by a scalar transfer
(INEPT). Their relative efficiencies were meticulously compared for
a microcrystalline sample of a deuterated ubiquitin spun at a frequency
of 93 kHz.114 For a J-mediated
out-and-back 13C′–15N transfer,
the efficiency is equal to  , η = πJNC′T′2,N and depends only on a usually long 15N coherence
lifetime (Figure 26a). The 13Cα–15N case, however,
is more challenging due to the concurrent evolution of one- and two-bond
couplings and smaller coupling constants. Experimental efficiencies
of 41 and 22% were reported, strongly suggesting the preference of
CP against INEPT at least for recording 1H–15N–13Cα correlations. Recently, it
was also suggested that 15N,13C TEDOR significantly
outperforms CP in deuterated microcrystalline proteins.158
Figure 26.
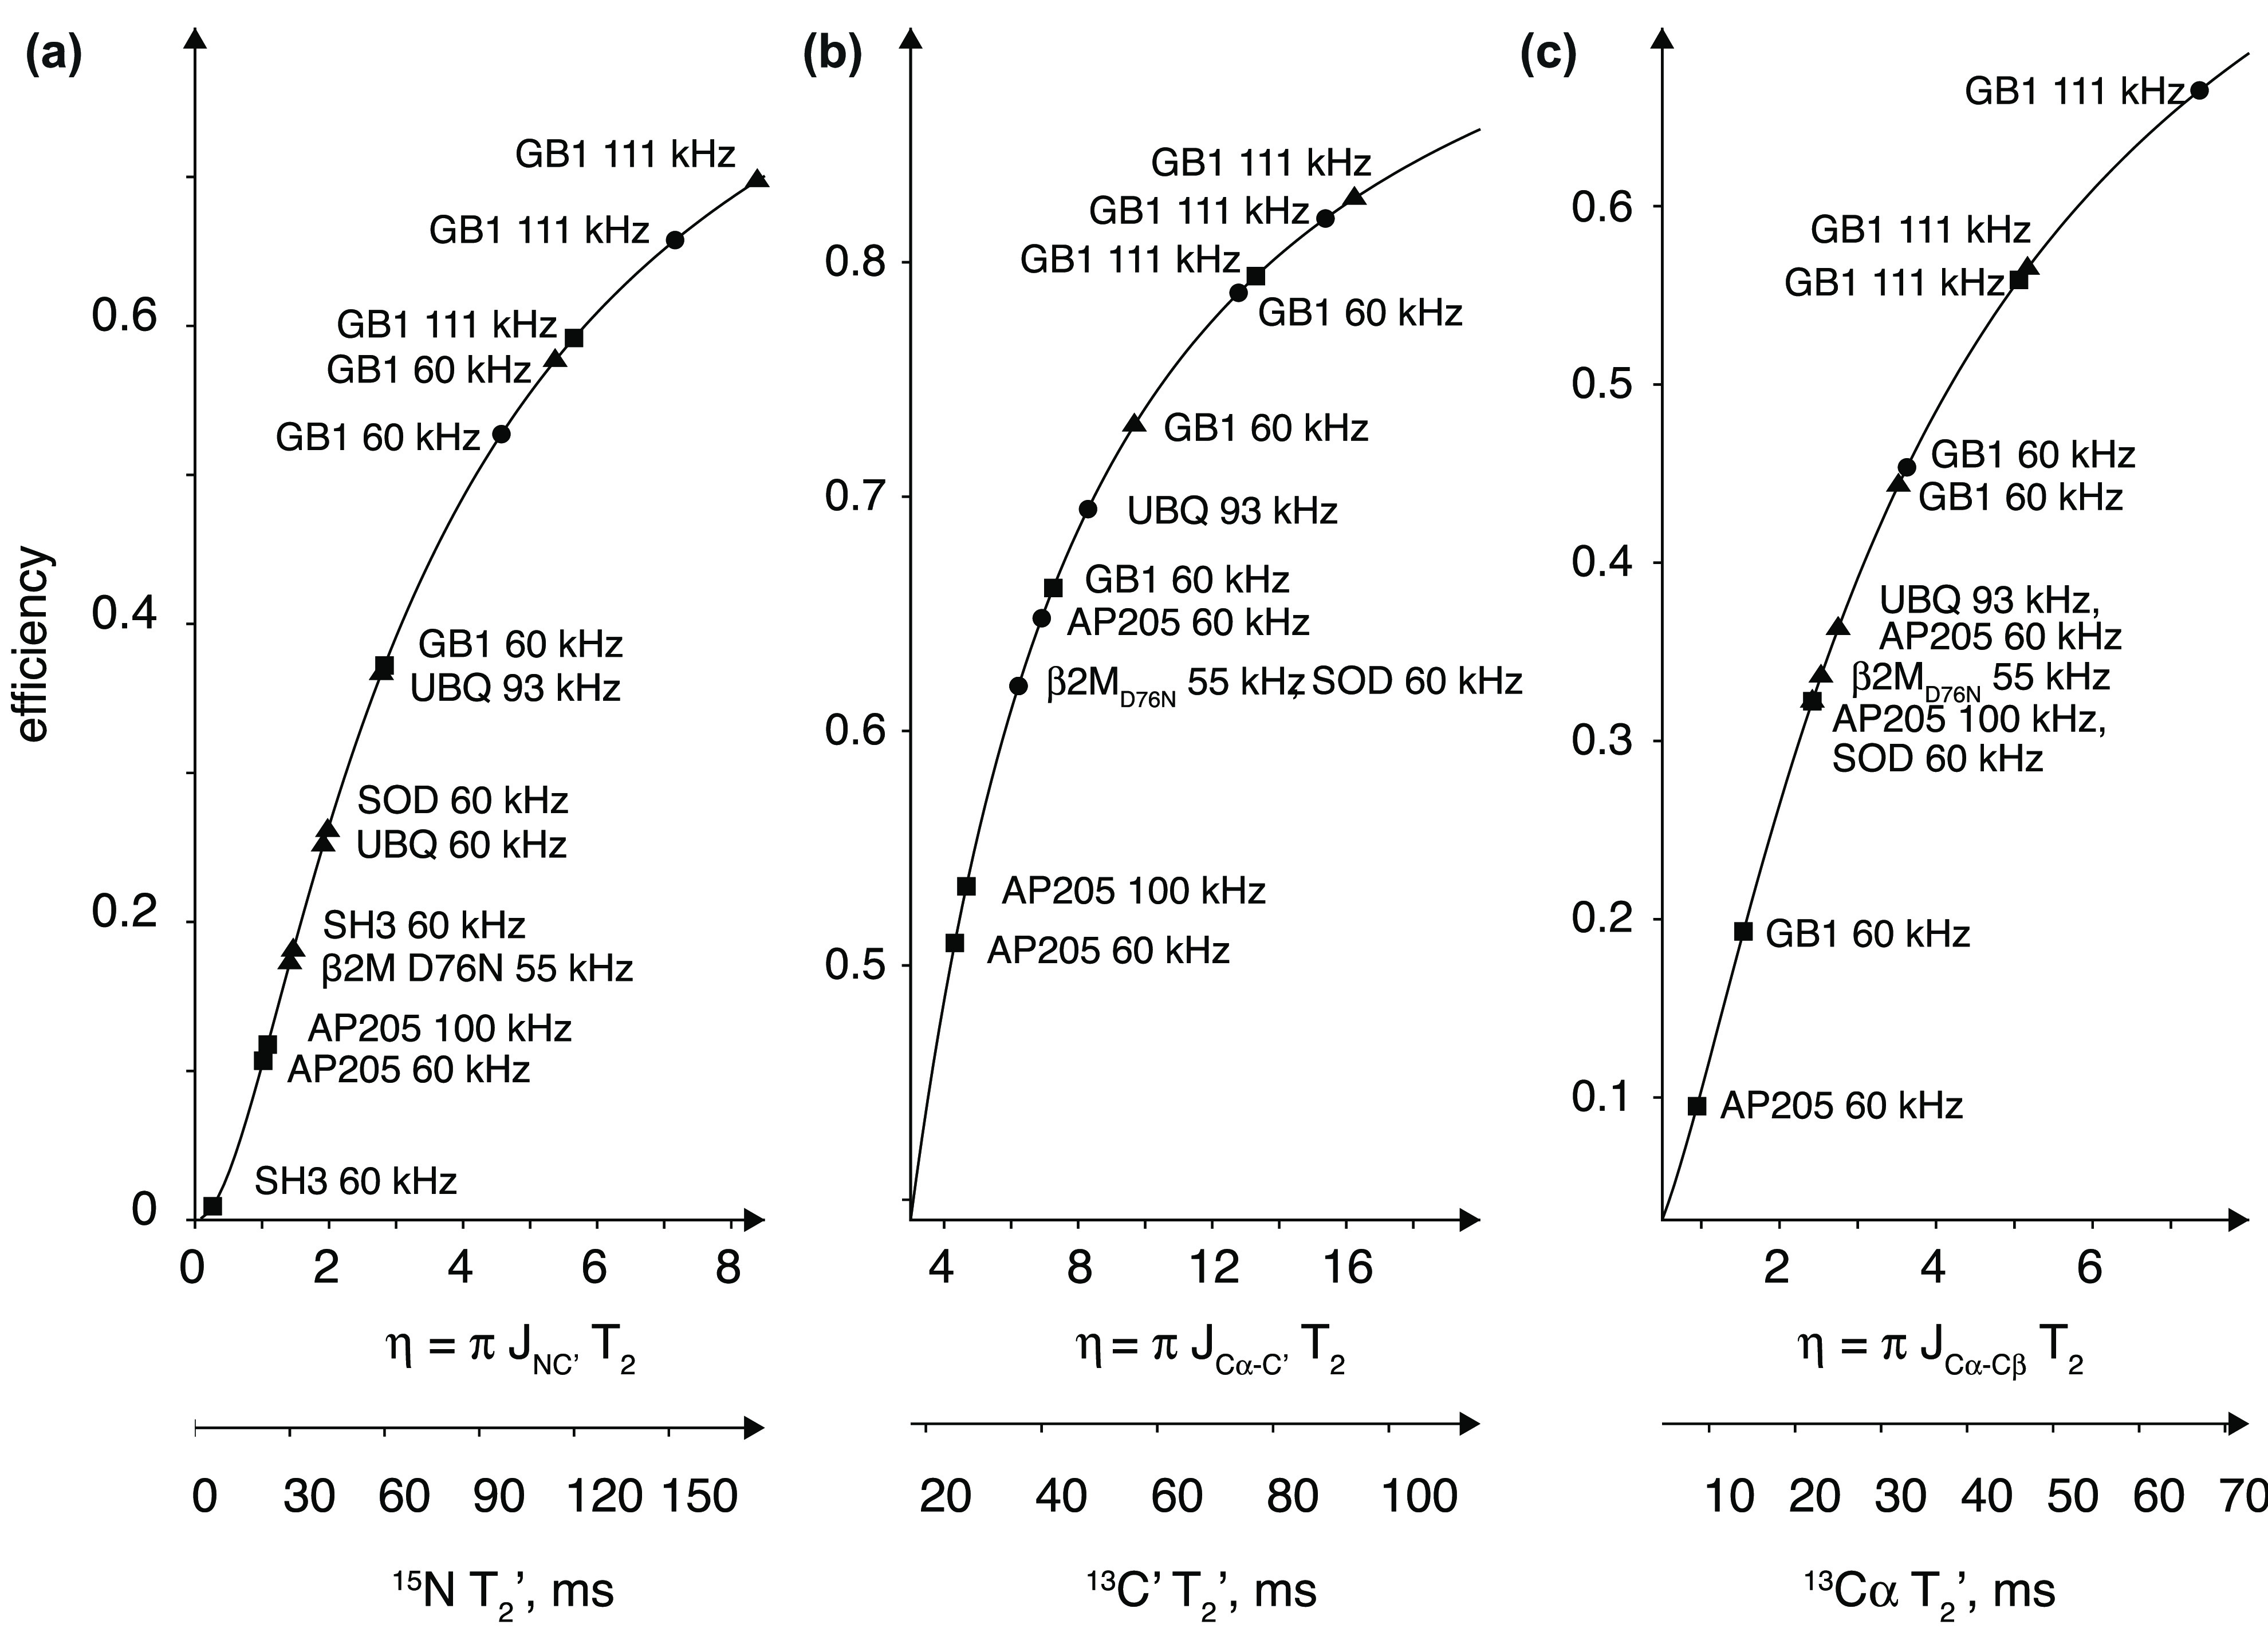
Efficiency of an out-and-back scalar transfer between (a) 15N and 13C′, (b) 13C′ and 13Cα, and (c) 13Cα and 13Cβ as a function of 15N, 13C′, or 13Cα refocused coherence lifetime, respectively, and a reduced variable η (see text). Triangles, circles, and squares correspond to bulk coherence lifetimes reported in the literature for heteronuclei in deuterated, inverse fractionally deuterated,101 and nondeuterated proteins at MAS frequency labeled for each case: UBQ,114 GB1,90,111 SH3,86 SOD,68,112 AP205,111,159 and β2mD76N (fibrils).68 Protein name abbreviations are the same as in the caption to Figure 23.
15N–13C CP is slightly different from the above considered 1H–X CP in a sense that a typically available RF power allows only a DQ condition under fast MAS, which also entails higher spatial selectivity (i.e., lower tolerance to B1 inhomogeneity). There are three additional important considerations. First, 15N–13C CP can be approximated by an isolated spin pair with a dominant coupling of DNC′ = 1.3 kHz or DNCα = 1.0 kHz, which justifies the use of adiabatic CP,149 with the RF strength modulated tangentially as
| 15 |
where DNCeff is the orientation-averaged dipolar coupling, Δ is the empirically optimized modulation depth, and ωavg is the average RF strength. Second, 15N–13Cα CP occurs primarily between the bonded nuclei, as the inter-residue coupling is approximately 4.4-fold smaller, and the transfer is further reduced due to the stronger coupling, though not to the extent of truncation in homonuclear recoupling.160 This, compared to solution NMR, greatly simplifies the spectra correlating 1H, 15N and 13Cα nuclei. Finally, in the case of 15N → 13C (“reverse”) transfer, one should ensure that 15N–13Cα and 15N–13C′ RF matching conditions do not overlap by preferring a low-power 13C irradiation (SPECIFIC-CP161,162). Should this require a prohibitively high RF of 15N, at least a proper time order of the two conditions can be imposed by choosing a certain direction of RF ramp (increasing 13C or decreasing 15N RF strength over the contact time).59
5.5. Homonuclear 13C—13C Transfer
A majority of triple-resonance experiments also employ a 13C homonuclear transfer to route the coherence pathway through 13C nuclei within the backbone (between 13Cα and 13C′) or side-chains. One-bond transfer is particularly convenient for the use of INEPT (Figure 27a) and usually provides very high efficiency for the out-and-back (Figure 27b) 13C′–13Cα–13C′ pathway159 (Figure 26b). An analogous 13Cα–13Cβ–13Cα scalar transfer159 is efficient only if refocused 13Cα lifetime T′2 is above 20 ms (Figure 26c), thus either in perdeuterated proteins114 or for fully protonated ones under MAS above 100 kHz,111 where large 1H–13Cα dipolar couplings (≈22 kHz) are sufficiently suppressed.62 Alternatives for the one-bond 13C–13C transfer are dipolar-based techniques, such as DREAM (Figure 27f)163,164 or band-selective homonuclear CP (BSH)165 (Figure 27g). Particularly, DREAM, an adiabatic passage through the 13C HORROR condition, proved attractive for incorporation in triple-resonance experiments under slow166 and fast MAS,114 due to low RF power required (ν1 = νR/2) and spin selectivity adjustable with the RF offset. A particular care must be taken for 13C′–13Cα DREAM transfer at high B0 fields and intermediate MAS frequencies, where large chemical shift difference approaches or exceeds the effective DREAM bandwidth of about 0.5 νR. In this case, a frequency-selective transfer can still be obtained up to Δν (13C′–13Cα) = 0.9 νR but with an altered DREAM RF strength.164
Figure 27.
Simplified RF schemes for commonly used 13C homonuclear mixings. (a–e) Transfers based predominantly on 13C–13C scalar couplings. Schemes in (f–h) recouple either dipolar 13C–13C couplings (f–h) or (i) higher-order cross-terms involving also 1H–13C dipolar couplings. In (a) and (b), bell-shaped pulses represent band-selective pulses; “BS” denotes the Bloch–Siegert phase compensation pulses, and δJ is a delay adjusted to the magnitude of scalar coupling: δJ = (4J)−1.
Homonuclear 13C mixing schemes are also core elements of experiments for assignment of side-chain 13C (and 1H) resonances. Low-power variants of the symmetry-based rotor-synchronized TOBSY technique167 are suitable under fast MAS.168 In this symmetry-based method built around C9n1 with POST block169 (Figure 27c), anisotropic interactions (13C CSA and DCH) are suppressed to the first order, and the transfer is predominantly mediated by one-bond 13C couplings (1JCC = 35 Hz). A similar logic supports the use of the classical solution NMR decoupling scheme WALTZ170 at rotation frequency-dependent RF amplitude ν1 = νR/4 (Figure 27e).62,111 Interestingly, under fast MAS a mostly scalar-based transfer within the 13C spin network can be obtained in a rotor-asynchronous mode using the MOCCA scheme (Figure 27d),171 although conditions under dipolar or CS recoupling are attenuated, are somewhat empirical, and require further investigations. In contrast to the slow spinning conditions, a dipolar-based DREAM can be employed for mixing within the full aliphatic 13C band, with the specific effect of alternating signs of cross-peaks or their possible cancellations.166,168 Suitable dipolar-based schemes are also finite-pulse RFDR172 (Figure 27h), efficient particularly for small side-chain spin systems (3–4 spins), or symmetry-based CORD173 with a short mixing time (Figure 27i). A combination of the mentioned first-order (RFDR) and second-order (CORD) recoupling methods was shown to overcome dipolar truncation effects and lead to more uniform transfers or even long-range 13C–13C contacts in uniformly labeled proteins at moderate MAS (40 kHz).174 However, extended periods of 1H irradiation during CORD may compromise hydration of fragile biomolecular samples at very fast MAS.
5.6. Band-Selective Pulses
Important building blocks of the 13C–13C INEPT blocks of Figure 27a,b and of evolution periods of either 13C′ or 13Cα chemical shifts are band-selective inversion and refocusing pulses. Established solution NMR designs such as Gaussian cascades (Q3, Q5)175 or BURP-family members (iBURP-2, ReBURP)176 can be employed,177 with the steepness of a transition band, and top-hat profile being minor differences (Figure 28a,b). Under fast MAS (νR ≳ 60 kHz), their performance is indistinguishable from the “isotropic” case (where all anisotropic interactions are neglected), whereas at νR = 20 kHz insufficiently averaged CSA side-bands degrade the pulse quality for 13C′ and, to a smaller extent, also for 13Cα spins (Figure 28c,d). The application of selective pulses at fast MAS is further facilitated by the fact that their bandwidth (thus also RF strength and duration) can be adjusted in a wide range without recoupling of anisotropic interactions (Figure 28e). Therefore, modern convenient implementations of triple-resonance pulse programs178 automatically determine shaped pulse parameters. In contrast, at 20 kHz MAS, even very selective (long) Q3 pulses, which retain high on-resonance performance, simultaneously invert spins on a spinning side-band (i.e., νR apart from the irradiation offset) (Figure 28e). It is worth noting that a simultaneous inversion of 13C′ and 13Cα spins, as required in the INEPT block (Figure 27a), historically performed by a rectangular π pulse, can also be accomplished by a pairs of shaped pulses (Figure 28f). The latter choice optimizes efficiency and reduces phase distortions that otherwise occur due to limited RF strength available for 13C rectangular pulses (ν1 < 100 kHz).
Figure 28.
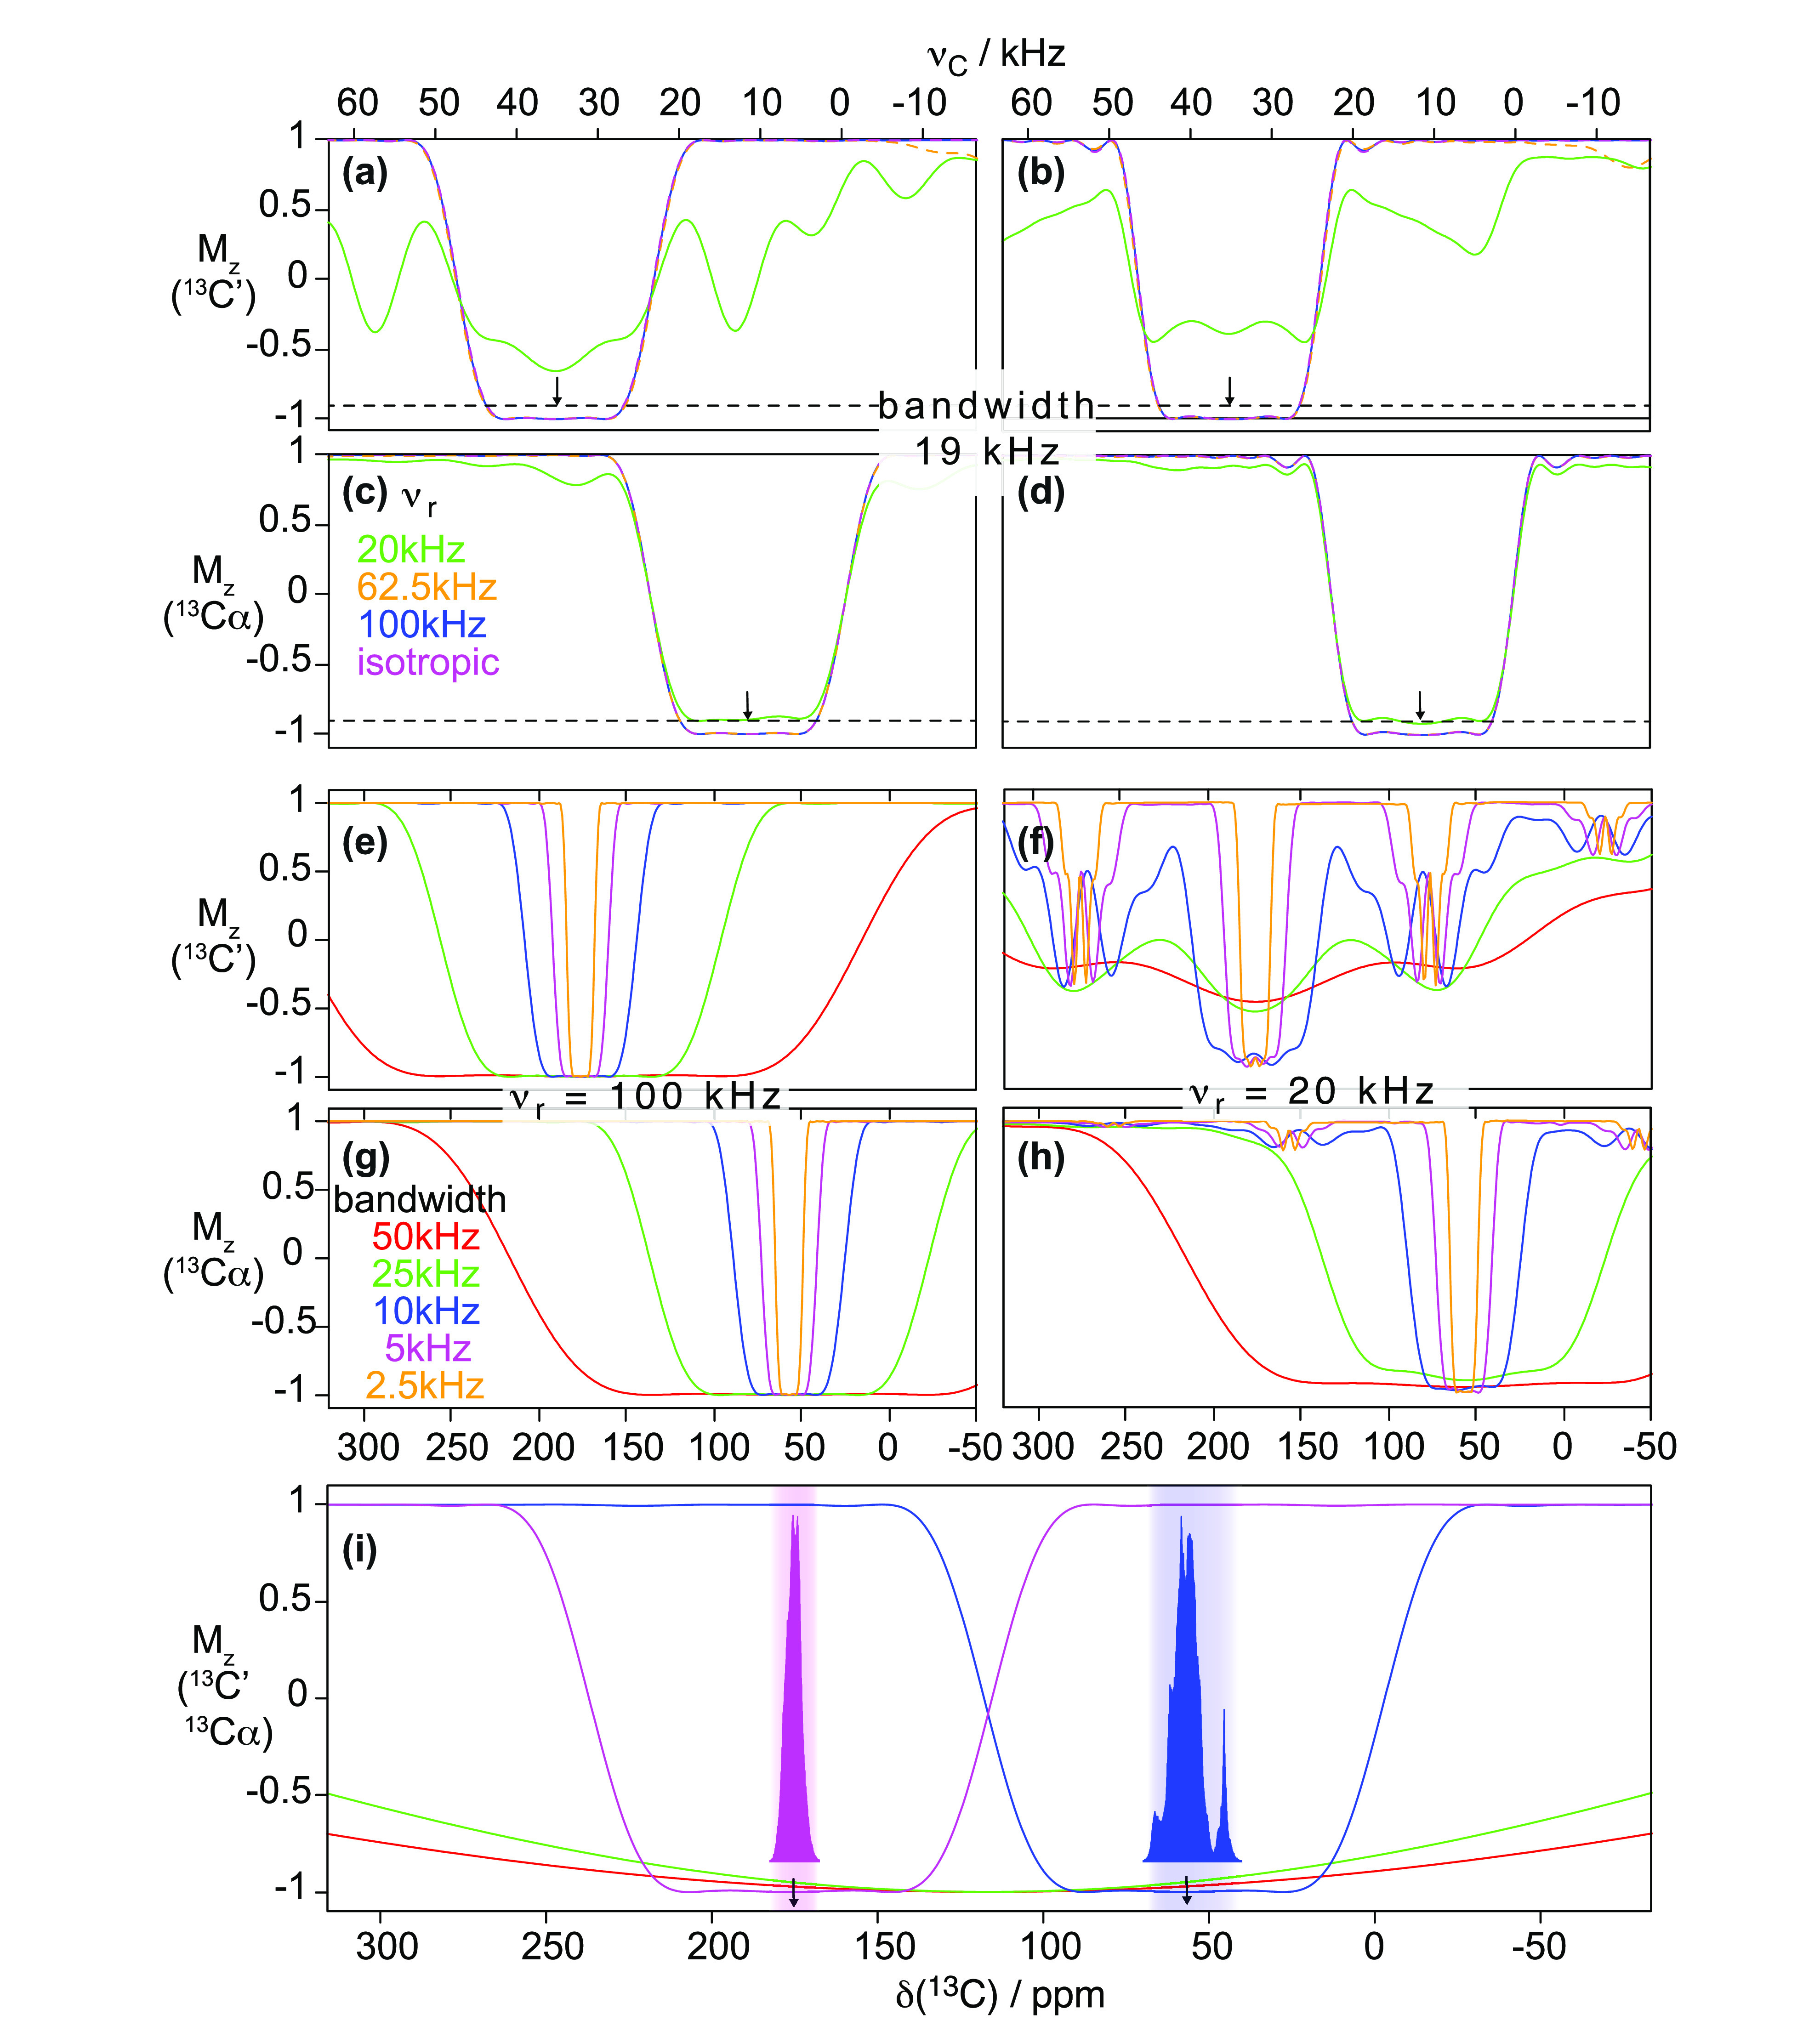
Inversion profiles of Q3 (a,c,e–h) and ReBURP (b,d) pulses acting on (a,b,e,f) 13C′ and (c,d,g,h) 13Cα spins in a three-spin system (including additionally a 13Cβ spin), simulated using SIMPSON. Simulations were performed for spinning frequencies of 20, 62.5, and 100 kHz and are color coded in (a–d) with green, orange, and blue curves, respectively. Additionally, an isotropic case was emulated by preserving only isotropic chemical shifts, and the corresponding curve (magenta) virtually superimposes with the case of 100 kHz MAS. The duration of Q3 and ReBURP pulses were set to, respectively, 179.6 and 244.2 μs to ensure an identical nominal bandwidth of 19 kHz (95 ppm for 13C at 18.8 T). (e–h) Inversion profiles of Q3 pulses with duration and RF amplitude varied accordingly to yield a nominal bandwidth of 50, 25, 10, 5, and 2.5 kHz are shown as red, green, blue, magenta, and orange curves, respectively. In simulations, MAS frequency was set to (e,g) 100 and (f,h) 20 kHz. (i) Inversion profiles of two independent Q3 pulses applied at the centers of a chemical shift band of 13C′ (176 ppm, magenta) and 13Cα (56 ppm, blue), superimposed with inversion profiles of rectangular π pulses of RF amplitude ν1C = 100 (red curve) and 75 kHz (in green) applied at the offset between 13C′ and 13Cα. Typical ranges of 13C′ and 13Cα chemical shifts are indicated. In (i), a spinning frequency of 100 kHz was assumed. In all simulations, the following spin system parameters were set: (δiso, δaniso, η) = 175.0 ppm, 124.3 ppm, 0.99 (for 13C′); 6.8 ppm, −30 ppm, 0.89 (for 13Cα); 40.6 ppm, 25.9 ppm, 0.98 (for 13Cβ); D(13C′–13Cα) = 2180 Hz, J(13C′–13Cα) = 50 Hz, D(13Cα–13Cβ) = 2085 Hz, J(13Cα–13Cβ) = 33 Hz, D(13C′–13Cβ) = 502 Hz, J(13C′–13Cβ) = 3 Hz; 1 ppm of 13C corresponds approximately to 200 Hz at assumed B0 field of 18.8 T.
5.7. Heteronuclear Decoupling
Decoupling of heteronuclear interactions with rare spins, i.e., 1H coherences from 15N and 13C spins, is a trivial task under MAS frequencies exceeding the direct dipolar coupling (approximately 22 and 14 kHz for bonded 1H–13C and 1H–15N spins, respectively). The remaining scalar interaction is suppressed by conventional WALTZ-16170 or DIPSI-3179 decoupling with a moderate RF strength (ν1 = 10–20 kHz), determined by a bandwidth of spins to decouple and the figure of merit of a particular decoupling scheme. The opposite case, i.e., a decoupling of heteronuclear (13C and 15N) coherences from abundant 1H spins, is fundamentally different due to evolution of multispin 1H system on a time scale of sample rotation, including coherent and incoherent effects (e.g., ZQ transitions). Efficient 1H decoupling for fully protonated samples of proteins undergoing dynamics on a time scale of the rotor period (≈10 μs) is crucial for both heteronuclear resolution and efficiency of 13C–13C INEPT transfer180,181 and remains an active area of research.182 Irrespective of a particular decoupling scheme, a recoupling of dipolar 1H–13C interactions is destructive to heteronuclear coherences at ν1H = νR or 2νR.183 At 20 kHz MAS, a substantial RF strength (>5νR) is required for efficient continuous-wave decoupling (Figure 29). As first demonstrated by Emsley and co-workers,146,184 under 60 kHz MAS or above, a very efficient decoupling is feasible also with a low-power 1H irradiation (ν1H between νR/4 and νR/2, see Figure 29a,b). Carefully optimized swept frequency185,186 two-pulse phase modulation187 (SWfTPPM) allows one to broaden the low-power decoupling condition, increasing its efficiency virtually to the case of infinite RF for rigid molecules (Figure 29d). Alternative schemes such as X-inverse-X (XiX),188 its amplitude modulated and supercycled version (AM-XiX),189 PISSARRO,190 or refocused continuous-wave (rCW)191 have been proposed in the context of fast MAS. The benefit of the low-power decoupling condition is two-fold: fragile samples are no longer exposed to detrimentally strong 1H RF irradiation for extended periods of time, and faster recycling is allowed compared to typical conditions of triple-resonance experiments at slow MAS.
Figure 29.
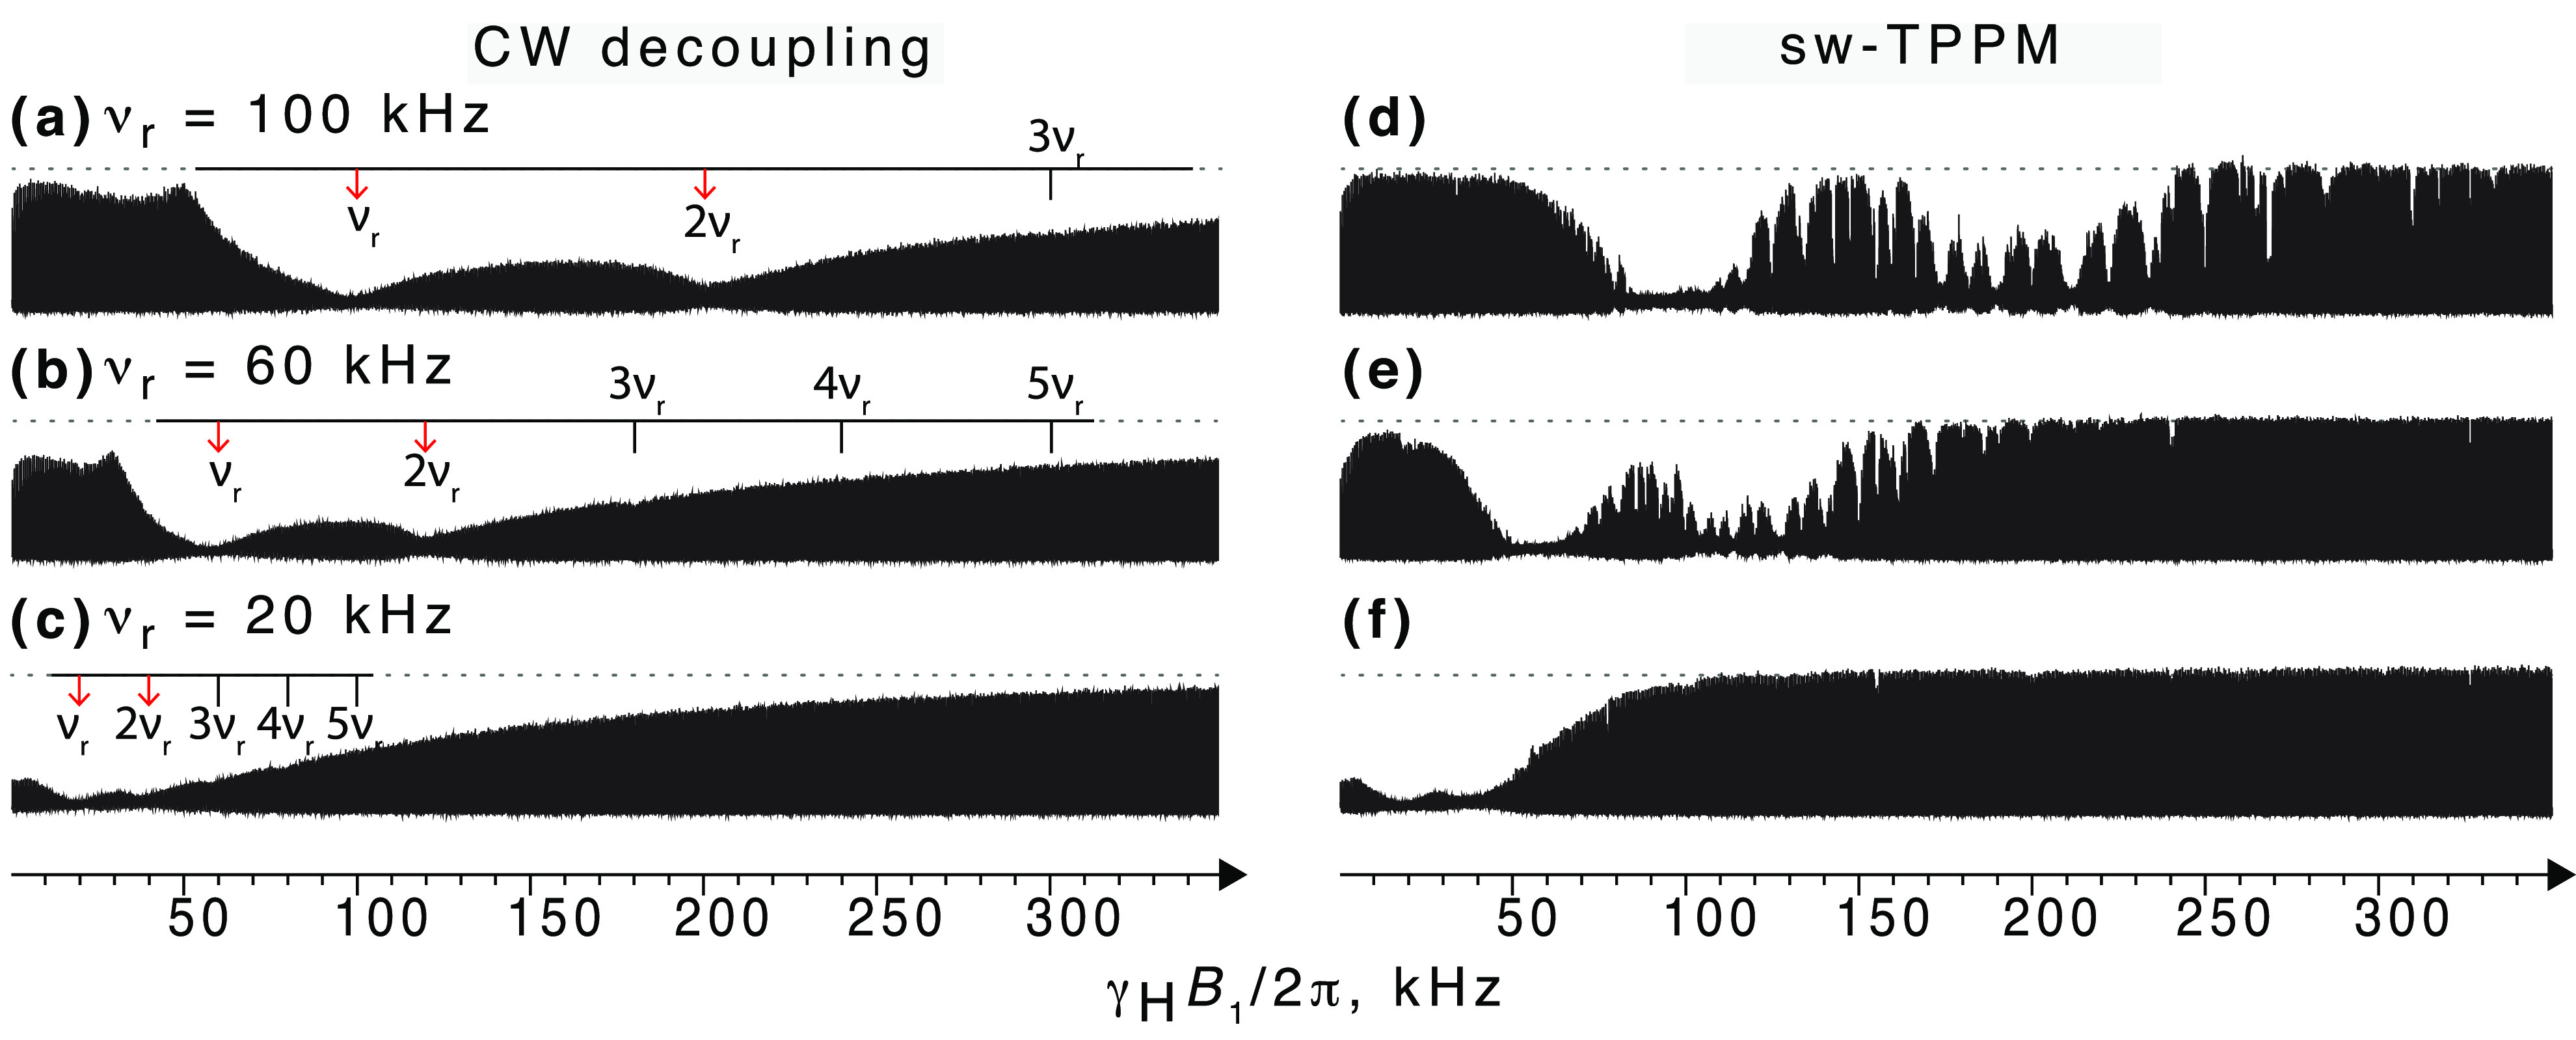
Efficiency of 1H continuous-wave (a–c) and swept-frequency TPPM (d–f) decoupling as a function of RF amplitude (νH = γHB1/2π) varied between 0 and 350 kHz, monitored with the intensity (and linewidth) of 13Cα resonances of a microcrystalline sample of uniformly 13C,15N-labeled N-formylated Met-Leu-Phe tripeptide (purchased from Giotto Biotech, Italy) packed into a 0.81 mm MAS rotor. For each decoupling condition, a 1D 13C signal was acquired for 24.5 ms under 1H decoupling immediately after 1H,13C CP. For SWf-TPPM, the phase difference within the primitive pulse pair was set to 25°, and the pulse duration was varied between 0.78 and 1.22 of a nominal length τ180. Measurements were performed at B0 field of 18.8 T at 100, 62.5, and 20 kHz MAS, using a MAS probe built by the group of Samoson (Darklands OU, Estonia).
Protein partial deuteration, while beneficial for 1H linewidths and coherence lifetime, can have adverse effects on 13C resolution due to nonuniform isotope shifts in mixtures of isotopomers,90,192 second-order scalar relaxation, or scalar one-bond couplings (1JCD ≈ 19–23 Hz). The last two effects can be tackled given either home-built193 or commercially available probes (Bruker) with a 2H channel. Only a weak RF irradiation (1–2 kHz) using WALTZ decoupling is sufficient to remove 1:2:3:2:1 quintets in CHD2 groups141,193 (Figure 30a,b). Another relevant application is removal of triplet splittings (or quintets for Gly) in 13Cα dimension of (H)CANH and (H)(CO)CA(CO)NH experiments (Figure 30c,d). The potential of resolution enhancement for other 13C sites (e.g., 13Cβ) is limited due to difficulties in removing 13C–13C scalar couplings by selective pulses and the magnitude of 1JCC (35 Hz) that obscure 1JCD fine structure.
Figure 30.
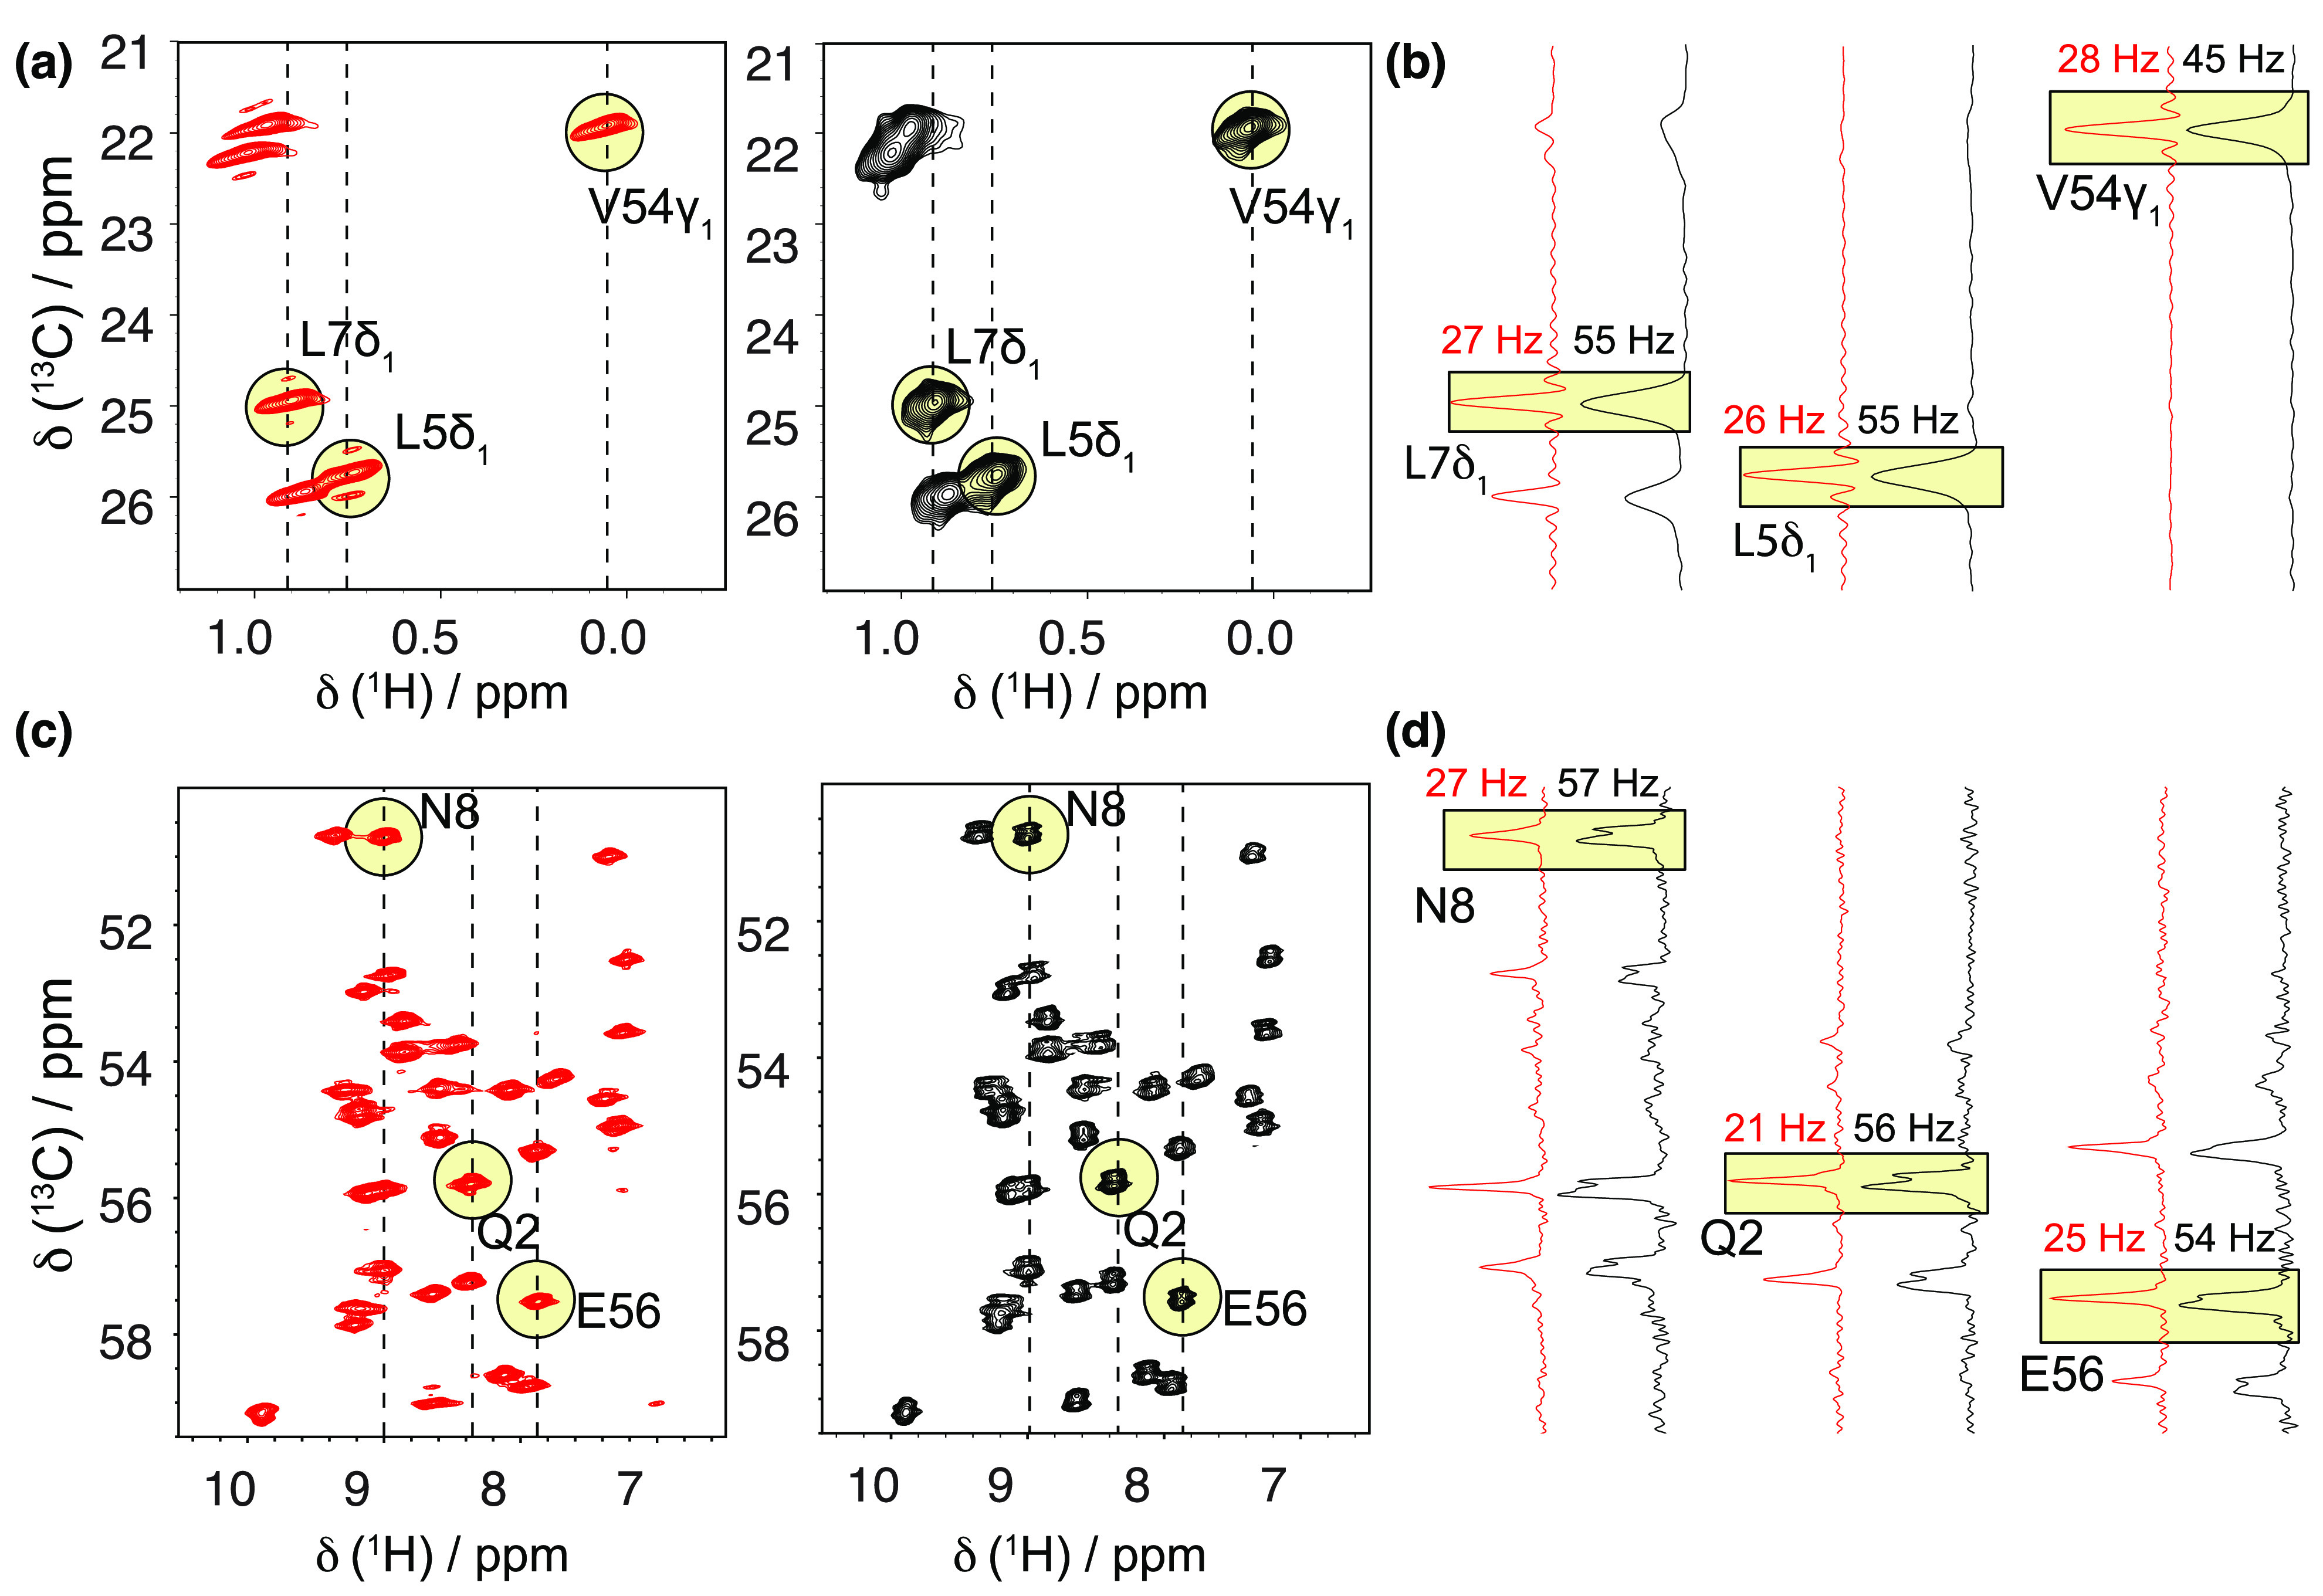
(a) Leu-1Hδ/13Cδ and Val-1Hγ/13Cγ region of 1H,13C J-HSQC recorded for a sample of perdeuterated microcrystalline sample of GB1 protein, with selectively 13C1HD2-labeled methyl Ile-δ1 and Pro-R groups of Leu and Val (and otherwise at natural abundance of 13C and 12C). 13C chemical shifts were indirectly evolved up to 24.8 ms under low-power 1H decoupling (black contours) or additionally under 2H WALTZ decoupling (red contours). (c) 2D (H)CA(N)H planes of (H)CANH experiment recorded for uniformly 13C,15N,2H,1HN-labeled GB1 under low-power 1H decoupling (black contours) or additionally under 2H WALTZ decoupling (red contours), as well as with 13C′ and 13Cβ selective inversion pulses during 13Cα evolution time (t1,max = 20 ms). (b,d) Comparison of 13C linewidths for three selected (b) methyl 1H,13C or (d) 13Cα–1HN cross-peaks. All spectra were recorded using a Bruker 0.7 mm HCND MAS probe on a 18.8 T spectrometer at 111 kHz MAS.
6. Sequential Resonance Assignment
Site-specific resonance assignment is a key step toward the in-depth analysis of dynamics, interaction or structural NMR data. Biopolymers are usually characterized by a large number of resonances, high degree of frequency overlap, but repetitive local bond topology. Thus, a reasonable solution is a systematic process which relies on correlation of detected 1H spins to shared neighboring heteronuclei, usually 13C and 15N, leading finally to the sequence of resonances along the biopolymer backbone. To this end, one employs multidimensional (at least 3D) spectra on uniformly 13C- and 15N-labeled samples, where unambiguous chemical shift correlations originate mostly from short-range spin interactions, e.g., one- or two-bond scalar or short-distance (through-space) dipolar couplings.
6.1. Backbone Assignment Using HN Detection
A significant 1H line narrowing under fast MAS (≳40 kHz) suggested that systematic resonance assignment strategy established in solution NMR, centered around the detected amide 1H resonances, can be adapted in a straightforward way for immobilized proteins. The classical solution NMR protocol aims at correlating amide 1H,15N with inter- and intraresidue 13Cα, 13Cβ, and 13C′ chemical shifts in experiments such as HNCO, HNCA,194,195 and HNCACB.196 The simplest (H)CANH and (H)CONH correlation experiments based exclusively on dipolar transfers were first proposed by Rienstra and co-workers at 40 kHz MAS in application to 13C,15N-labeled protein GB1.54 Soon, Reif and co-workers showed that a direct translation of (entirely J-based) solution NMR experiments HNCO, HNCA, and HNCACB can yield sequential backbone assignment of a perdeuterated model α-spectrin SH3 domain at relatively slow MAS (9 and 14 kHz).139 The same group then adapted the solution NMR HN(CA)CO experiment which provides intraresidue correlations to 13C′ resonances and showed that at these conditions C′ nuclei feature exceptionally narrow lines (≈15 Hz).197 Shortly after, Pintacuda’s group proposed (H)CO(CA)NH and (H)CA(CO)NH experiments177 which make use of heteronuclear dipolar and homonuclear scalar transfers. These implementations are applicable to moderately or nondeuterated samples under fast MAS (≳50–60 kHz) and thus represent a more general solution to obtain intraresidue 13C′ and inter-residue 13Cα chemical shifts. Finally, the incorporation of out-and-back INEPT transfers allowed recording intra- and inter-residue correlations to 13Cβ with (H)(CA)CB(CA)NH159 and (H)(CA)CB(CA)(CO)NH198 experiments, respectively. Figure 31a–f gathers the state-of-the-art implementations of these six experiments. It is noteworthy that implementations with scalar 13C transfers replaced by either adiabatic (DREAM)114 or nonadiabatic199 passage through the HORROR condition can be advantageous for nondeuterated and noncrystalline preparations such as amyloid fibrils199 or membrane-embedded proteins, which usually show shorter 13C coherence lifetimes.
Figure 31.
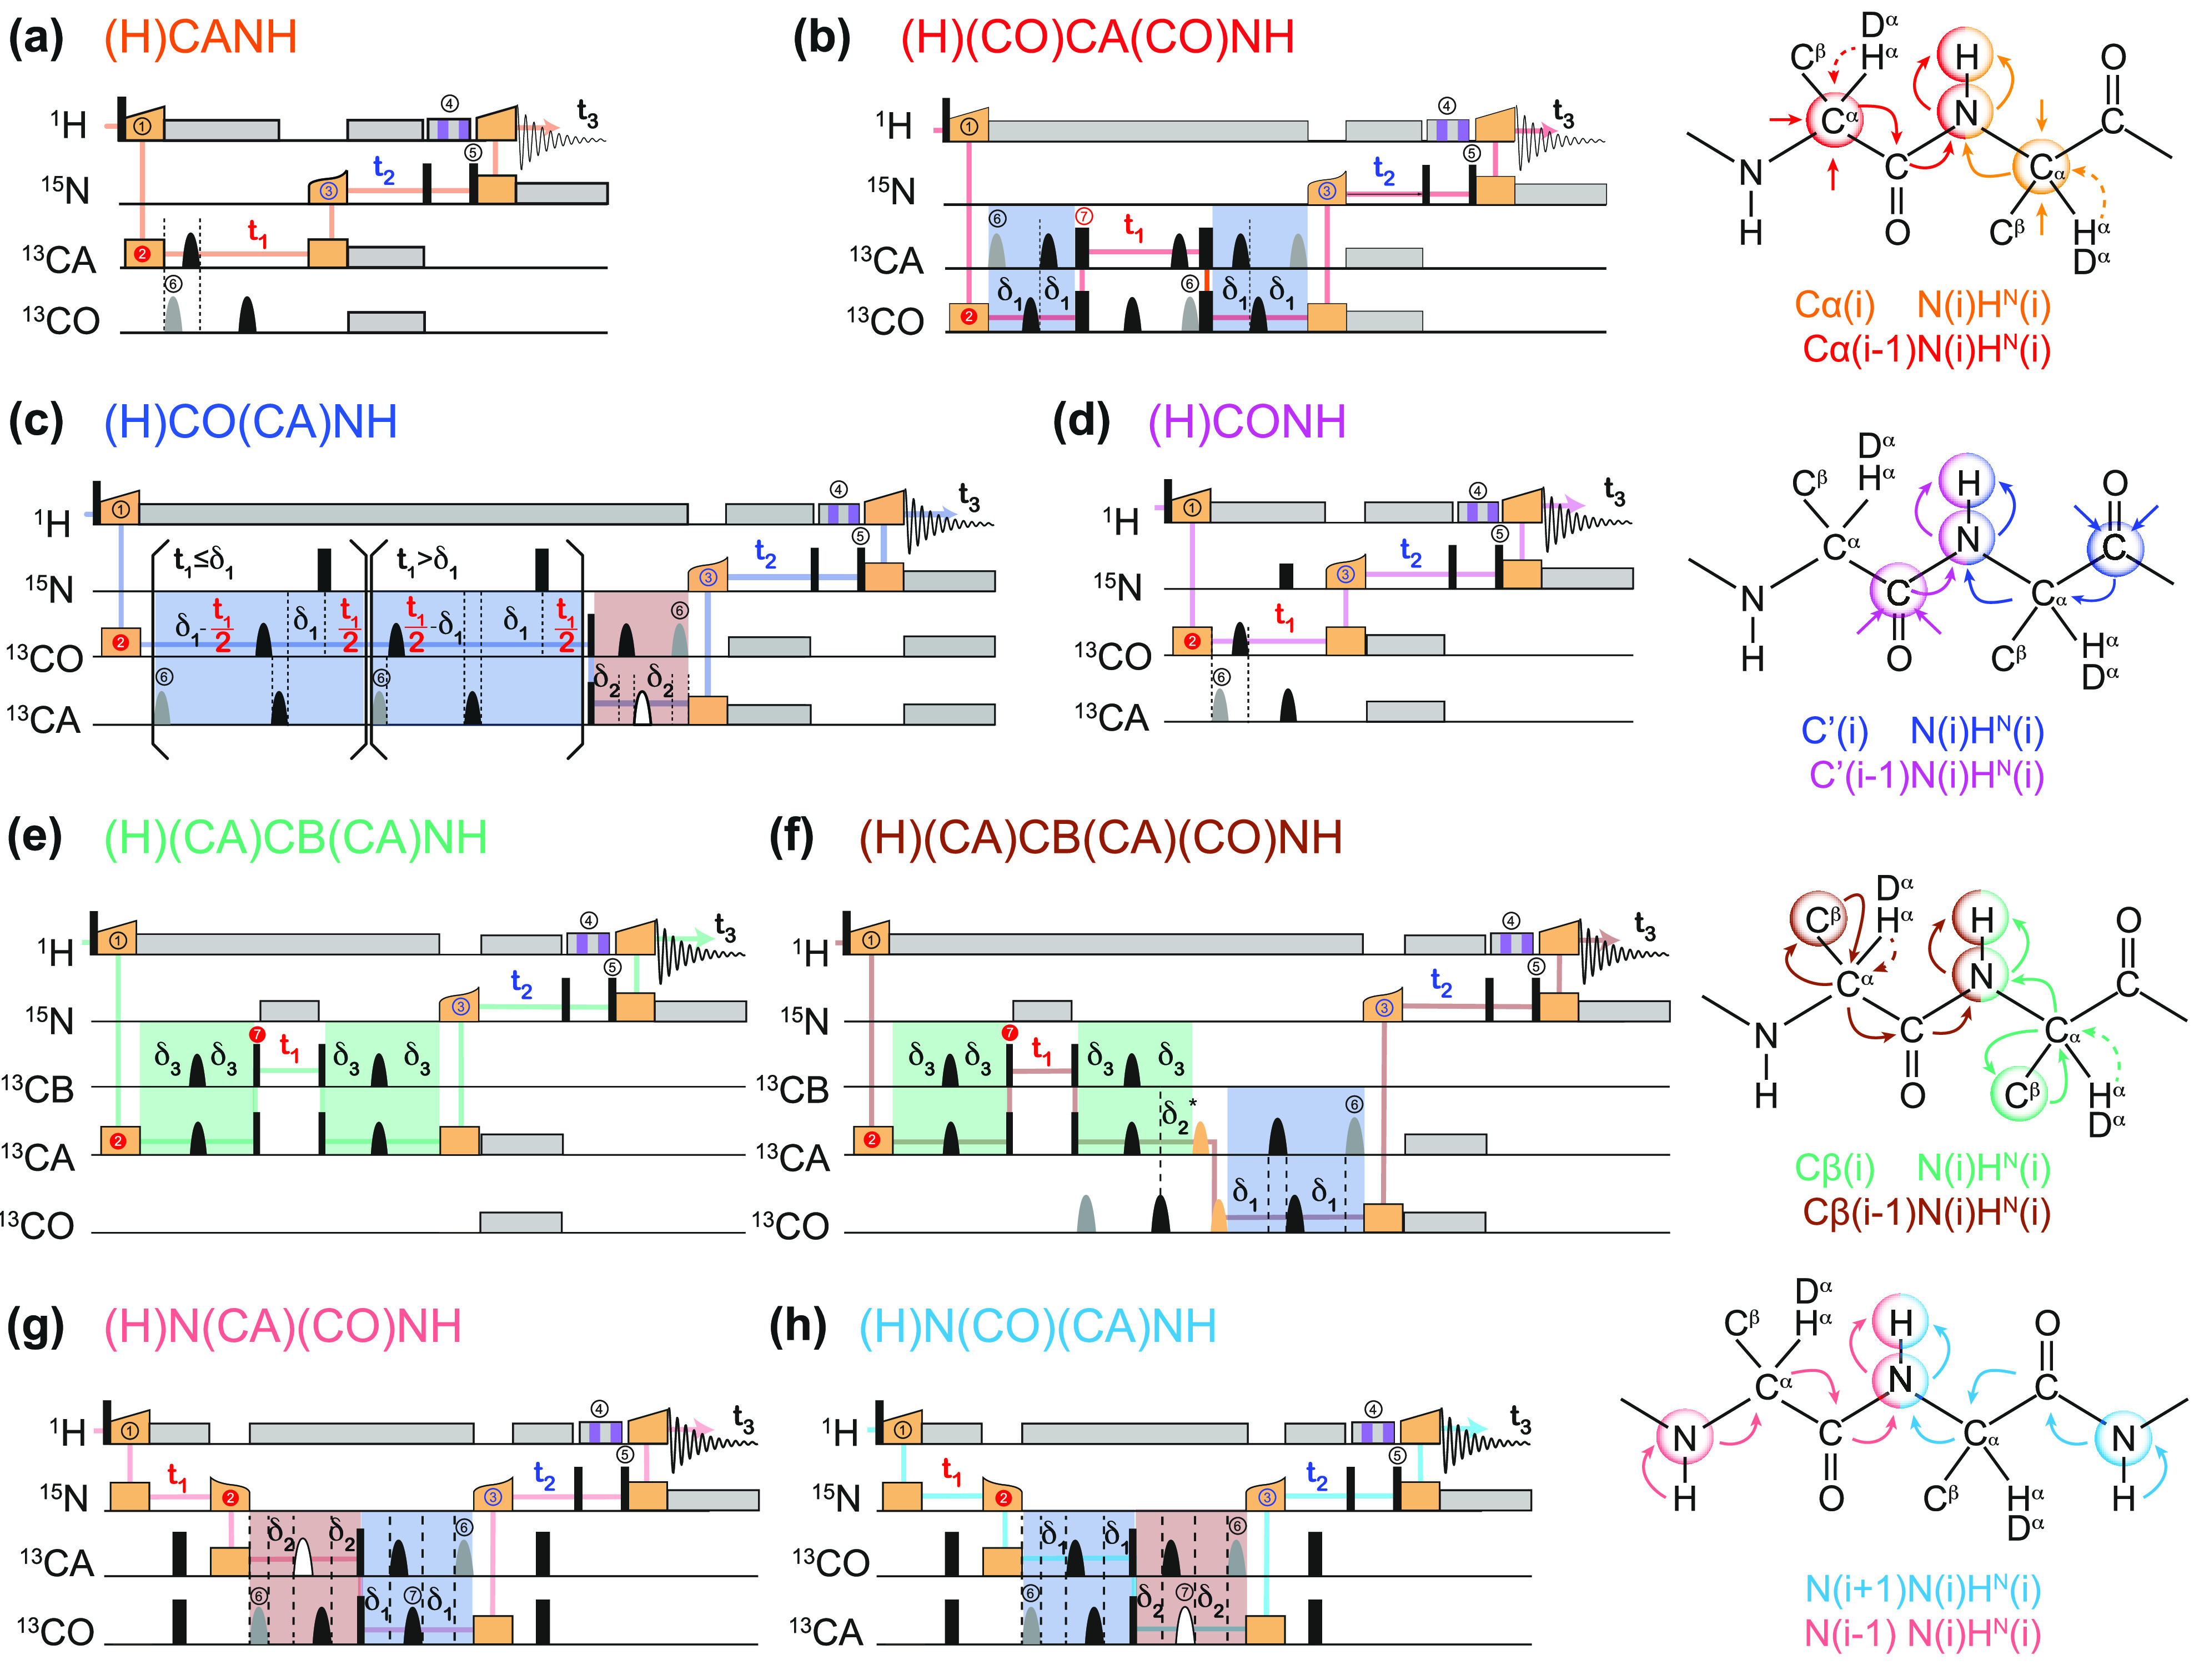
RF irradiation schemes of 3D correlation experiments
with backbone
amide 1H detection. Experiments in each row yield a pair
of matching correlations to (a) intra- and (b) inter-residue 13Cα (1Hi–15Ni–13Cαi and 1Hi–15Ni–13Cαi–1, respectively),
(c) intra- and (d) inter-residue 13C′ (1Hi–15Ni–13C′i and 1Hi–15Ni–13C′i–1, respectively), (e) intra- and
(f) inter-residue 13Cβ (1Hi–15Ni–13Cβi and 1Hi–15Ni–13Cβi–1, respectively), (g) preceding and (h) successive 15N (1Hi–15Ni–15Ni–1 and 1Hi–15Ni–15Ni+1, respectively). For each
pair, color-coded coherence transfer pathways are illustrated on a
schematic structure of a protein backbone (note that the first transfer
involves both short- and long-range CP). High-power π/2 and
π flip angle pulses are denoted as narrow and wide rectangles,
respectively. 13Cα, 13Cα/13Cβ, or 13C′-selective Q3 pulses are shown
as solid bell shapes; the orange bell shapes in (f) represent 13Cα or 13C′-selective Q5 pulses, and
the open bell shapes in (c,g,h) denote 13Cα-selective
ReBURP pulses. Gray bell shapes denote pulses for compensation of
Bloch–Siegert phase. Heteronuclear decoupling and CP transfers
are shown as gray rectangles and orange rectangles or trapezoids,
respectively. In all experiments except (H)CANH and (H)CONH, scalar
coupling is employed for homonuclear 13C transfer and highlighted
in blue, light red, and green for 13C′ → 13Cα, 13Cα → 13C′,
and 13Cα → 13Cβ transfers,
respectively. Corresponding transfer delays δ1, δ2, and δ3 should be set to the relaxation-adjusted
values: δ1 = 1/2tan–1(πJCαC′T′2,C′)/(πJCαC′), δ2 = 1/2tan–1(πJCαC′T′2,Cα)/(πJCαC′), δ3 = 1/2tan–1(πJCαCβT′2,Cα)/(πJCαCβ), with the exception of pulse sequence (f) where the full transfer
time δ2* = 1/4(JCαC′)−1 and δ3 > δ2* must be set. All phases are applied along the x axis except for the pulses labeled with encircled numbers, for which
the phases are cycled as follows: in all sequences, ① = 
 , ②
=
, ②
=  , ③
=
, ③
=  , ⑤ = y. In (b,e,f), ⑦
= x,
and in (g,h), ⑦ = 8(x)8(y). Additionally, in (a−d,f,g,h),
⑥ = xy for suppression of undesired pathways. In (a−f),
ϕrec =
 , and in (g,h),
ϕrec =


 . The full
phase-cycle length of 8 for (a−f),
and 16 (g,h) can be reduced to 4 and 8, respectively, with a minimal
loss of quality. The phases of the MISSISSIPPI pulses ④ = xy
 are not cycled. Open and filled red (or
blue) circles indicate phases which are respectively incremented or
decremented for quadrature detection in t1 (or t2) according to the States-TPPI
procedure. Off-resonance CP or selective pulses are performed with
a fine stepwise phase modulation. The former require appropriate phase
alignment either at the beginning or end of the CP pulse. In (b) and
(c), 13C chemical shifts are evolved off-resonance; however,
folding (aliasing) of resonance frequencies is avoided by t1 time-proportional phase incrementation: Δφ
= 360°ΔΩt1 (in degrees),
ΔΩ = ΩC′/Cα – Δcarrier, where ΩC′/Cα are effective
(requested) centers of either 13C′ or 13Cα bands. In (c), transfer time δ1 is exploited
for a constant-time evolution of 13C′ if t1 < δ1; otherwise, a real-time
mode is used. Panels (a–f) were adapted with permission from
ref (198) (copyright
2014 American Chemical Society) and panels (g−h) from ref (200) (copyright 2015 Springer
Nature).
The complete protocol was demonstrated on a variety of deuterated198 (see spectra for Acinetobacter phage 205 (AP205) coat protein in Figure 32a) and protonated120 proteins at 60 kHz MAS, and, while largely successful, also showed certain limitations of the approach.
Figure 32.
Representative 2D cross sections (strip plots) from (a) six HN-detected 3D experiments providing intra- and inter-residue correlations to 13C′, 13Cα, and 13Cβ chemical shifts and (b) five Hα-detected 3D experiments correlating to 13C′, 15N, and 13Cβ. Chemical shift of the orthogonal (a) 15N or (b) 13Cα dimensions is indicated in each strip. Spectra were recorded on the deuterated (a) and nondeuterated (b) U-13C,15N-labeled samples of Acinetobacter phage 205 coat protein. Adapted with permission from (a) ref (198) (copyright 2014 American Chemical Society) and (b) ref (62) (copyright 2016 John Wiley & Sons).
First, 1H and 15N linewidths determine the limiting size of a protein for which resolution of a 15N CP-HSQC presents an impassable barrier for either manual or automated assignment. Additionally, increased overlap in 3D spectra leads indirectly to loss of resolution, since peak positions are increasingly difficult to define. Second, a success of the approach requires the presence of corresponding peaks in both intra- and inter-residue correlation spectra. Unfortunately, there is a considerable sensitivity difference between experiments in each of the three kinds of correlations (Figure 33) due to the uneven number of 13C–13C transfers. In this respect, the efficiency of the correlations can be optimized by smart exploitation of the delays necessary to evolve scalar couplings and chemical shifts of the backbone nuclei. For example, the implementation of the experiments presented in Figure 33 shows two significant improvements with respect to those reported in ref (198). In the (H)CO(CA)NH experiment (Figure 33c), the 13C−13C scalar transfer time can be exploited for a semi-constant time evolution of the 13C′ chemical shift. In the (H)(CA)CB(CA)(CO)NH (Figure 33f) experiment, Cα-Cβ and C′−Cα scalar transfer blocks are concatenated and produce an overall efficiency similar to that of the shorter (H)(CA)CB(CA)NH sequence.
Figure 33.
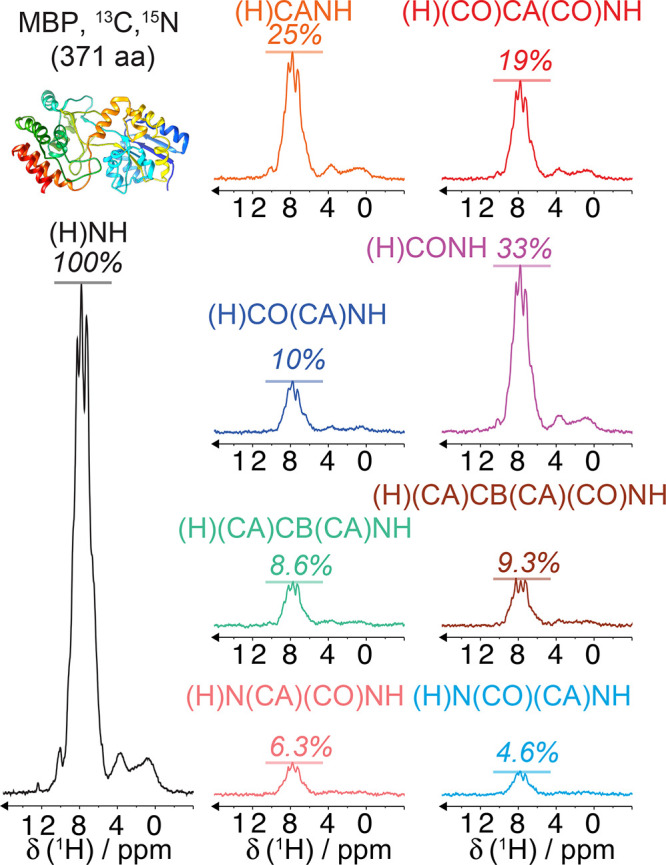
Sensitivity of eight HN-detected triple-resonance correlation experiments of Figure 31 relative to 1H,15N CP-HSQC, measured in the first FIDs on a 13C,15N-labeled sample of microcrystalline maltose binding protein under 107 kHz MAS and at B0 = 18.8 T.
Another concern is that, while correlations to 13Cα and 13C′ show generally higher sensitivity compared to those to 13Cβ, the obtained chemical shifts do not provide specific information on a residue type, which is essential in the assignment process. Regarding the accuracy of 13C frequency matching between pairs of correlations, it should be emphasized that, at least for deuterated proteins, 13C linewidths are close to those in solution NMR, the scalar couplings to 13Cβ, 2H and to 13Cα, 13Cγ and 2H being the major limiting factors for 13Cα and 13Cβ spins, respectively.200,201 To summarize, a pair of correlations to 13Cα is typically sensitive and weakly indicates a few amino acid types but alone is insufficient to yield unambiguous assignment due to resolution limitations of 13Cα. Correlations to 13C′ potentially benefit from superior resolution (in Hz) due to absence of irrefocusable scalar coupling and usually longer 13C′ coherence lifetimes but suffer from a narrow chemical shift distribution. The correlations to 13Cβ are superior in terms of frequency matching200,201 but are often incomplete due to lower sensitivity. One final flaw of the approach is the vulnerability of a large set of six experiments to instrumental (B0 field, shim, temperature) or sample temporal instability. A number of solutions have been proposed to tackle the above issues. To a certain extent, the limited resolution of 3D spectra was addressed by high-dimensional extensions of the four experiments which provide correlations to 13Cα and 13C′.202 Heterogeneous samples can greatly benefit from this approach as showed by Linser and co-workers (Figure 34).199
Figure 34.
Assignment of heterogeneous filaments of protein Tau.63,199 (a) Backbone walk using a pair of 4D nonuniformly sampled (H)CACONH and (H)COCANH spectra (black and pink contours, respectively), illustrated by a sequence of alternating 2D HN/N and 13Cα/13C′ (orthogonal) cross sections. The strategy is supplemented by a 3D (H)N(CO)(CA)NH spectrum (gray contours). (b) Coherence transfer pathways of the three experiments used, sketched on a protein backbone. Adapted with permission from ref (199). Copyright 2016 Royal Society of Chemistry.
An orthogonal approach was a direct correlation of amide pairs using directional transfer through intervening 13Cα and 13C′ spins in (H)N(CA)(CO)NH and (H)N(CO)(CA)NH experiments200,201 (Figure 31g,h). Since, in principle, the resonance connectivity is derived in a single experiment, the impact of instrumental instabilities is minimal. Narrow lines, well-distributed 15N chemical shifts and the absence of diagonal peaks contribute to high resolution of these spectra, the only disadvantage being relatively low sensitivity due to in total five coherence transfer steps. High dimensional extensions were also proposed, in which either all 1H and 15N dimensions (in 4D HN(CA)(CO)NH203 and 5D HN(CA)CONH204), or all 13C chemical shifts are recorded (5D (H)NCACONH and (H)NCOCANH).68 They showed potential to obtain resonance assignment of either heterogeneous samples or large microcrystalline proteins203,204 or to automate the process to the extent that no manual spectral analysis is required.68
6.2. Backbone Assignment Using Hα Detection
Availability of spinning frequencies above 100 kHz enabled a complementary assignment strategy based on detection of α-protons, which were shown to feature similar or even smaller linewidths than for amide ones.62 In fact, Hα are not engaged in H-bonds and thus are less susceptible to temperature gradients or instabilities or to sample structural heterogeneity as, for example, prevalent in amyloid fibrils.62,192 For the homogeneous contribution to linewidths, similar lifetimes (2.5–3 ms) as for amide protons were observed in nondeuterated proteins.62 The ability to record sensitive 2D 1H,13C correlations, with the α-region virtually devoid of residual solvent signal, permitted a development of a set of five triple-resonance experiments in which two pairs yield matching intra- and inter-residue correlations of 1Hα and 13Cα to amide 15N and 13C′ chemical shifts (note that the (H)NCAHA experiment was originally proposed by Rienstra’s group54). The (H)(CA)CBCAHA experiment, although alone does not offer sequential resonance matching, shows a significantly higher sensitivity than the HN-detected analogue due to topological proximity of 1Hα to 13Cβ spins. Representative strips for Hα-detected experiments, also for AP205 coat protein, are shown in Figure 32b. It is noteworthy that, with lower MAS frequencies available, the strategy is applicable to samples with other labeling schemes that show high occupancy of Hα sites but a certain degree of deuteration, such as α-PET,102 iFD,101 or partial random deuteration.192
Interestingly, if chemical shifts of only 1Hα (or 1Hβ) are sought (e.g., for the secondary structure information encoded) and amide 1HN resonances are already assigned, correlations can be obtained using inverse second-order CP transfer directly from amide 15N, in principle, even in (singly) 15N-labeled proteins.205 Otherwise, a combination of (H)CANH and (H)NCAHA spectra should yield unambiguous extension of the assignments to 1Hα resonances.
As the experimental toolset for resonance assignment increases, so does the issue of chemical shift inconsistency across the entire data set. It was shown recently that the medium term, approximately linear B0 instabilities can be tackled at the data processing stage with appropriate phase corrections.206 Even the nonlinear magnet drifts, usually occurring after helium fill or magnet charging, helium boil-off or during probe (and bore) temperature stabilization after insertion, can be monitored by small-angle excitation of 1H spectra and corrected afterward.207 A dedicated hardware, dubbed the bore temperature control system,208 was also proposed as a remedy for fast B0 drifts related to bore temperature changes during probe equilibration after insertion or during temperature-swept spectral series.
A complementary approach to improve agreement of chemical shifts is an interleaved acquisition of independent intra- and inter-residue correlation experiments, although its implementation is technically challenging. An elegant alternative is a parallel acquisition of Hα- and HN-detected experiments, which offers additional sensitivity gains. Pairwise combinations for intra- and inter-residue 13C–15N–1H correlations were demonstrated.151,209 Direct amide-to-amide coherence transfer schemes200,201 offer even greater opportunities for the recovery of typically suppressed chemical shift correlations (so-called RAVASSA approach).151,210 Notably, the obtained data sets are amenable to automated analysis as demonstrated151 by the backbone resonance assignment of 371-residue maltose binding protein by FLYA.211
6.3. Assignment of Side-Chain Resonances
Access to side-chain 13C chemical shifts presents a great value to sequential resonance assignment since they reliably identify the amino acid types (note that such information is key in 13C-detection-based strategies, in which these chemical shifts are derived from, e.g., the (H)NCACX experiment). For perdeuterated proteins, back-exchanged at labile sites, identification of 13C shifts beyond 13Cα and 13Cβ presents a challenge due to increased distance from the only available source of proton polarization (1HN). However, as demonstrated91 by Reif and co-workers even a tiny amount of residual protons (present due to incomplete deuteration of side-chains) can be exploited for detection of magnetization transferred from13Cα, 13Cβ or 13C′ spins by (H)CCH experiment employing rotor-synchronous TOBSY.167,212 Certain resonances of major importance, namely, methyls of Leu/Val/Ile residues pose a great challenge to this approach, despite the possibility of sparse protonation at these sites by either RAP92 or non-random protonation using α-keto acids as precursors.94 A peripheral position of I/L/V methyl 13C nuclei prohibits sensitive correlations to distant backbone 13C spins, and in this case, one can only resort to short-range (one- or two-bond) correlations obtained using RFDR-based213 or J-based8 3D CCH correlations. However, this implicitly requires a prior identification of all non-methyl 13C chemical shifts.
To address the issue of initial polarization of side-chain 13C spins, Linser proposed to combine long-range CP with a direct excitation, with 13C steady-state polarization enhanced by paramagnetic doping, an approached referred to as COPORADE.214 Additionally, a 13C mixing can be employed before13C chemical shift encoding to equalize polarization of distant side-chain 13C spins. A direct polarization of side-chain 13C from amide 15N via through-space transfer TEDOR was recently proposed; however, ambiguities due to inter-residue transfers may arise.158 TOBSY or rotor-asynchronous MOCCA171 were demonstrated as suitable schemes for 13C mixing before t1 or for a following transfer that ultimately connects the side-chain 13C to the backbone 13Cα–15N–1H moieties. The strategy, dubbed side-chain-to-backbone (S2B), proved instrumental in the assignment of medium-sized (260 aa) deuterated human carbonic anhydrase II.203
In nondeuterated proteins, either 13C and 1H chemical shifts are of high interest, since particularly the latter ones report on structure and protein interactions.10 For such samples a correlation of S2B resonances is greatly facilitated since all 13C aliphatic spins can be directly polarized from nearby (bonded) protons.199 Above mentioned S2B schemes can be used, however, inevitably low transfer efficiencies from 13C spins distant to 13Cα in multispin systems (e.g., Ile, Val, Leu, Arg, Lys) invalidate this approach for sensitivity-challenging samples. As mentioned above, certain 1H shifts (mostly 1Hα and some 1Hβ) can be accessed using a scheme which does not involve 13C nuclei but still exploits well-dispersed amide 15N and 1H shifts for detection.205 A more general route for complete side-chain 1H and 13C is a two-hop strategy, in which 1Hα and 13Cα spins are first correlated to backbone, and then to other side-chain resonances using sensitive (H)C(CC)CH and H(C)(CC)CH experiments62,111 based on WALTZ 13C mixing.
This approach proved effective for noncrystalline samples (as illustrated in Figure 35 for AP205 coat protein) including also amyloid fibrils.215 Complexity of 3D CCH-type spectra may be an issue for large proteins and/or heterogeneous samples, in which case a 4D HCCH variant may recover sufficient resolution as demonstrated recently59 for ribose spin systems in RNA-protein complex (Figure 36) and for a membrane protein.229
Figure 35.
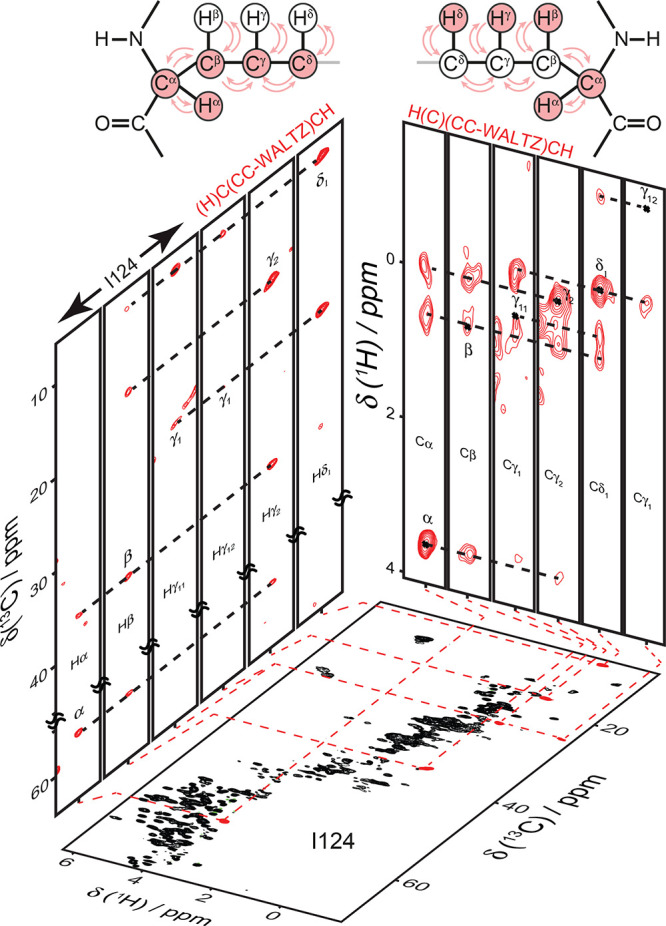
Representative 2D cross sections (strip plots) from two 3D experiments correlating 1H,13C shifts of bonded nuclei to either 13C or 1H chemical shifts of side-chain atoms within the same residue, recorded on a nondeuterated U-13C,15N-labeled sample of Acinetobacter phage 205 coat protein on a 23.5 T spectrometer at 100 kHz MAS. Cross-peaks of isoleucine-124 residue in 2D cross sections and in the 1H,13C CP-HSQC are highlighted in red. Adapted with permission from ref (62). Copyright 2016 John Wiley & Sons.
Figure 36.
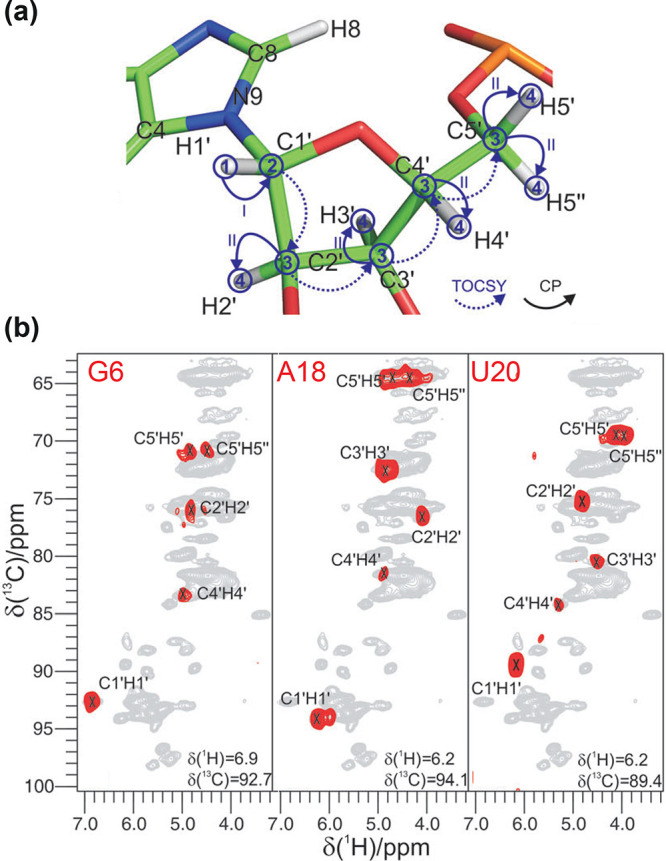
(a) Coherence transfer scheme of a 4D HCCH experiment for ribose resonances of RNAs. CP and TOCSY transfers are depicted as solid and dotted arrows, respectively. (b) Representative 13C,1H 2D planes from a 4D HCCH spectrum of a 13C,15N-labeled 26-nucleotide box C/D RNA complexed by L8Ae protein from Pyrococcus furiosus, recorded at 100 kHz MAS on a 18.8 T spectrometer. Intranucleotide correlations of G6, A18, and U20 detected on respective anomeric (H1′) protons (red contours) are overlaid on the 13C,1H CP-HSQC spectrum (gray contours). Adapted with permission from ref (59). Copyright 2018 Royal Society of Chemistry.
To summarize, various approaches have been proposed for backbone and side-chain resonance assignment based on 1H detection, and suitable experiment variants should be flexibly and often empirically selected according to sample properties (coherence lifetimes, extent of local dynamics, sample heterogeneity, feasibility of deuteration, residue count). As a guide, Table 2 showcases notable protein resonance assignments, including hybrid approaches with 13C detection.
Table 2. Representative Examples of Protein Resonance Assignment Using 1H Detection.
| protein | size | labeling | strategies | time (days) | B0 (T) | νR (kHz) | extent | ref |
|---|---|---|---|---|---|---|---|---|
| microcrystalline | ||||||||
| TS | 665 | 1HN, 2H, 13C, 15N | 4D C′αβNH,a 4D S2B,b 5D HNcCNH bwd/fwdc | 90 | 16.4 | 55 | bb (74.8%) | (204) |
| MBP | 371 | 13C, 15N | RAVASSAd, HCCH-TOCSY | 14 | 18.8, 23.5 | 107 | bb (90%), sc (partial) | (151), 57 |
| hCAII | 260 | 1HN, 2H, 13C, 15N | HNNH,e S2B,b C′αβNHa | 27.2 | 18.8 | 55 | bb (90%) | (203) |
| ϵ186 | 179 | 13C, 15N | C′αβNHa | 7.1 | 18.8 | 60 | bb (74%) | (120) |
| SOD | 153 | 1HN, 2H, 13C, 15N | C′αNHf | 5.6 | 23.5 | 60 | bb (95%) | (112) |
| β2m | 99 | 1HN, 2H, 13C, 15N | C′αβNHa | 3.0 | 23.5 | 60 | bb (76%) | (198) |
| membrane-embedded | ||||||||
| CorA | 5 × 351 | 13C, 15N | C′αβNH,a Hα det. | 28.3 | 18.8, 23.5 | 107 | bb (35%, 54% in TM) | (224) |
| hVDAC1 | 283 | 1HN, 2H, 13C, 15N | 3D/4D C′αβNH,a NNHe | 74.1 | 18.8, 22.3 | 55, 91 | bb (69%) | (225), 226 |
| OmpG | 281 | 1HN 70/100%, 2H, 13C, 15N | C′αβNHa | 13.1 | 23.5 | 60 | bb (60%), sc (51%) | (198), (227) |
| 13C-selective | 13C det. | 21.4 | 13 | |||||
| PR | 6 × 243 | 13C, 15N | C′αNH,f Hα-det., hCCH-TOCSY | 13.5 | 23.5 | 100 | bb (61%), sc (57%) | (228) |
| AlkL | 203 | 13C, 15N | C′αβNH,a Hα-det., HCCH-TOCSY | 31.7 | 23.5 | 111 | bb (84%), sc (partial) | (60), (229) |
| 1HN, 2H, 13C, 15N | 22.1 | 18.8 | 60 | |||||
| GlpG | 189 | 1HN, 2H, 13C, 15N | C′αβNHa | N/A | 14.1 | 40 | bb (60%) | (230) |
| KCsA | 166 | iFD, 13C, 15N | C′αβNH,a13C-det. | 20.4 | 18.8 | 60 | bb (21% of TM) | (101), (231) |
| M2 | 2 × 43 | 1HN, 2H, 13C, 15N | C′αβNHa | 13.7 | 23.5 | 60 | bb (51%) | (198) |
| aggregates/assemblies/precipitates | ||||||||
| FcRnECD | 373 | 13C, 15N | C′αNH,f CαCβNHg | N/A | 20 | 100 | bb (25 aa) | (232) |
| TET-2 | 12 × 353 | 1HN, 2H, 13C, 15N | C′αβNHa | 11.1 | 14.1 | 38, 53 | bb (85%), sc (70%) | (223) |
| 13C, 15N | 13C-det. | 42.4 | 14.1, 23.5 | 15, 18 | ||||
| aa. sel. 13C,15N | 13C-det. | 16.7 | 14.1 | 15 | ||||
| ILV-CH3 | solution HMQC (mutagenesis) | ILV-CH3 (94) | ||||||
| Cp149 | 149 | 13C, 15N | C′αβNHa | 15.5 | 20.0 | 100 | bb (85%) | (113) |
| AP205CP | 180 × 130 | 13C, 15N | Hα-det., HCCH-TOCSY | 6.9 | 23.5 | 100 | bb (78%), sc (74%) | (111), (62) |
| 1HN, 2H, 13C, 15N | C′αβNHa | 6.7 | 23.5 | 60 | bb (72%) | (198) | ||
| SSB | 110 | 13C, 15N | C′αβNHa | 7.1 | 18.8 | 60 | bb (75%) | (120) |
| amyloid fibrils | ||||||||
| BacA | 103 | 1HN, 2H, 13C, 15N | 3D C′αNHf | 8.0 | 21.2 | 40 | bb (93%) | (233) |
| β2m | 99 | 1HN, 2H, 13C, 15N | 5D hNCCNH bwd/fwdh | 4.8 | 23.5 | 55 | bb (77%) | (234), (68) |
| Tau | 96 | 13C, 15N | 4D C′αNH,f 3D CβNH, NNHe | 18.8 | 55 | bb (27%) | (199) | |
| HELL-F | 51 | 13C, 15N | C′αβNH,a Hα-det., hCCH-TOCSY | 13.5 | 23.5 | 100 | bb (92%), sc (91%) | (215) |
| Aβ1–42 | 42 | 13C, 15N | C′αβNHa | 3.5 | 23.5 | 100 | bb (100%), sc (100%) in 15–42 region | (61) |
| Aβ1–42 | 42 | 13C, 15N | 3D/4D C′αβNHa | 6.3 | 18.8 | 90 | bb (76%), sc (∼54%) | (126) |
| Val-rev. lab.13C, 15N | 17.6 | 80 | ||||||
C′αβNH = Cαi/i–1-Ni-Hi, C′i/i-1-Ni-Hi, Cβi/i–1-Ni-Hi.
S2B = side-chain to backbone correlations (CXi-Ni-Hi).
5D HNcCNH bwd/fwd = Hi–1-Ni–1-C′i–1-Ni-Hi + Hi+1-Ni+1-Cαi-Ni-Hi.
Simultaneous Ni–1-Ni-Hi, Cαi+1-Cαi- Hαi, Cαi/i–1-Ni-Hi, Ni/i+1-Cαi-Hαi correlations + Cβi-Cαi-Hαi + Cβi-Ni-Hi.
HNNH and NNH = (Hi±1-) Ni±1-Ni-Hi.
C′αNH = Cαi/i–1-Ni-Hi, C′i/i-1-Ni-Hi.
CαCβNH = Cβi/i–1Cαi/i–1-Ni-Hi.
5D hNCCNH bwd/fwd = APSY Ni–1-Cαi–1-C′i–1-Ni-Hi + Ni+1-C′i-Cαi-Ni-Hi.
One of the most promising tool which can aid the above-described strategies is protein cell-free expression, perfectly compatible with low demands on sample amount for ultrafast MAS.216 Not only does it address notorious issues with incomplete exchange of amide protons in otherwise deuterated proteins in membranes or viral assemblies107,108 but it allows selective amino acid 15N or 13C labeling which greatly simplifies spectra as well their analysis.109 Another increasingly popular, although by no means a general strategy to reduce complexity of resonance assignment is the segmental labeling217−221 or selective labeling/unlabeling.222 Further improvements in reliability and efficiency of resonance assignment in 1H detection are observed with the advent of even stronger magnetic fields (e.g., 1.2 GHz119), even faster MAS rates,115 and more widespread use of automated analysis.109,151,223
7. Structural Information
Structure determination protocols for solid-state NMR follow a similar simulated annealing approach as developed for solution NMR. These incorporate multiple restraint types, including prior knowledge of chemical bonding geometry, local angles often derived from chemical shifts, and, most importantly, measurement of spin–spin interaction through space. To determine these spatial proximities, a large variety of recoupling sequences have been developed. Here we describe some of the particular benefits as well as remaining challenges of using protons to measure internuclear distances.
The dense network of protons within structured proteins provides a rich set of sensitive NMR reporters. They are harnessed for structure determination via measurement of spin interactions that depend on internuclear distance. Primarily, dipolar couplings are measured via magnetization exchange, dephasing effects, or excitation of double quantum coherence, although other structural techniques that measure angles have also been reported. The angle-measurement approaches typically provide more local information, while in the following, our focus is on measurement of long-range information that defines the protein fold. For proteins, backbone geometry is defined by two torsion angles, φ and ψ, which if defined exactly could determine protein fold. Practically speaking, the accumulation of errors makes this approach infeasible. Alternatively, the various side-chains present different ways of indirectly determining the fold, i.e., by measuring long-range restraints. Long-range information is typically defined as distances among residues that are separated by at least five residues in the protein sequence. In other words, long-range information is anything that is not among amino acid neighbors, nor those that are close in regular helical geometries.
7.1. 1H–1H Distances in a Dense Network
When the objective is a structure elucidation, protons are ideal for several reasons. First, they are exposed on or near the surface of amino acid residues, such that the important inter-residue distances among protons are similar to the less informative intraresidue distances. Second, they have the highest gyromagnetic ratio available, which leads to substantial dipolar couplings even for longer distances. For example, a 5 Å distance results in a dipolar coupling constant of just under 1 kHz. For comparison, a carbon–nitrogen coupling at the same distance is only about 24 Hz. This leads to particularly short recoupling times for proton–proton interactions, which is technically advantageous since this leads to reduced losses due to experimental imperfections or spin relaxation properties.
More fundamentally, there is a higher abundance of protons in proteins than any other nucleus. This leads to a tapestry of close connections among protons which is fundamental to a reliable structure determination. The redundancy of information in the dense network of proton connections leads to high quality structure determination in the presence of limited precision in the measured distances as well as assignment ambiguity. This is available only from fully protonated samples, which as detailed in earlier sections, has motivated ever increasing MAS frequencies. With fewer protons available, structure determination is successful with a combination of restraint types, for example 13C–13C and 13C–15N restraints. In the case of 13C–13C restraints, the strong one-bond couplings are often removed via tailored labeling strategies. This reduces the problem of dipolar truncation,160 which occurs for popular first-order recoupling sequences such as RFDR and DREAM. In dipolar truncation, transfer to more remote spins is observed to be “quenched” by the presence of a nearby spin. For 1H–1H contacts, such dilution strategies are not strictly required, although clearly still of benefit, since the protons are more exposed, leading to more favorable long-range distances.
While the benefits of protons were highlighted above, protons also present particular challenges in structure determination. It has long been recognized that the protons form a network of spins with large dipolar couplings, and that the resulting proton spectra would only become resolvable with particularly fast MAS and high magnetic fields.29 The geometry of the proton, carbon, and nitrogen spins is depicted in Figure 37 in the structure of HELLF (PDB 6EKA), which is a β solenoid fibril.215
Figure 37.
Visualization of the spin density in a folded protein, PDB 6EKA, the β solenoid HELL-F. The first panel shows side-chains of a protein monomer (two layers in the β solenoid). The next panels depict spins within 4–10 Å of a β proton located in the core of the structure. Spins in b−f are colored white for protons, gray for carbon, blue for nitrogen, red for oxygen, and yellow for sulfur. Numbers in gray, black, and blue indicate the number of proton, carbon, and nitrogen spins, respectively, within the given distance.
As can be seen by counting the number of spins within a radius of 4–10 Å, the proton spin density is highest, at about 50 spins per cubic nanometer (nm3). Carbon spins are the next dense at about 35 per nm3, and nitrogen spins are most dilute at about 10 per nm3. (Oxygen was not considered since it is rarely labeled in NMR active form). For the purpose of magnetization transfer, the number of spins within a certain distance is important, since magnetization will tend to diffuse within these spins, which quickly reduces the efficiency of the transfer since the magnetization is divided. For protons, this effect already becomes severe at between 6 and 8 Å, where the transfer efficiency can be expected to be below 1 to 2%, considering the signal is diluted among ∼50–100 spins. This presents a problem for transfer of signal among the backbone nuclei (e.g., amide protons) of neighboring β-sheets or neighboring α-helices, both of which are separated by about 7–8 Å. As described above, this problem has been overcome by measuring the shorter side-chain contacts, for example between methyl protons of two α-helices which are in van der Waals contact (Figure 38a). In the important case of the antiparallel β sheets, the protein fold may be sufficiently defined by contacts only between amide protons, since the distance for these long-range structural restraints is below 3 Å (Figure 38b).
Figure 38.
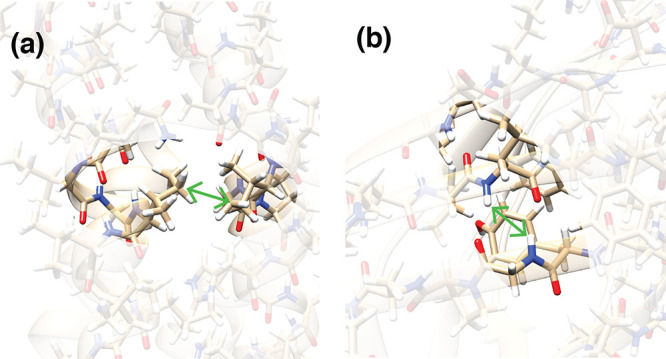
Two examples of 1H–1H contacts particularly useful to define a protein fold. Panel (a) shows an example of helix–helix contact among methyl groups. Panel (b) shows an example of amide–amide contact that indicates a β-sheet arrangement.
7.2. 1H–1H Distances in Partially Deuterated Samples
Alternatively, to acquire relatively long proton–proton distance information, high levels of deuteration on both nonexchangeable and to some extent even exchangeable sites were used together with MAS rates of 20–24 kHz.235 Distances of up to about 10 Å could be identified, using RFDR for proton–proton magnetization transfer (Figure 39a).
Figure 39.
Sequences employed to recouple 1H–1H dipolar interactions at the first (a,b) and second order of AHT (c,d). (a) Finite-pulse RFDR with xy8 phase cycling, a versatile scheme applied for a variety of conditions for broadband 1H–1H mixing, also in fully protonated samples. (b) DREAM mixing for selective recoupling within amide or methyl protons. (c,d) Sequences designed to enhance 1H spin-diffusion through (c) 1H spin-lock field (rotating-frame spin-diffusion) or (d) optimized RF irradiation of the X-nucleus (e.g., 15N), which affects (broadens) the ZQ linewidth of a coupled (bonded) proton. All schemes except AM-MIRROR use only 1H RF irradiation. The spin operator (either polarization 1Hz or transverse magnetization 1Hxy) at the start of the mixing period is indicated.
Without dilution, the volume represented by this distance would be filled by over 200 protons. However, amide protons make up only around 10 of these, which with the dilution strategy explains the particularly long-distance transfer. A schematic representation of the amide restraints used in this study are shown in Figure 40a–c.
Figure 40.
Magnetization transfer schemes for obtaining secondary, tertiary, and quaternary structure information. (a–c) Amide-based proton–proton correlation, encoded as 4D or 3D variants. (d–f) HC-based proton–proton correlations, encoded as 4D or 3D variants. Methyl contacts are shown; however, the general scheme also applies to methylene, aromatic, and other HC moieties. (g) Carbon–carbon contacts. Heteronuclear contacts: (h) carbonyl carbon–proton contacts and (i) proton–carbon contacts; more generally, other heteronuclear contacts, such as proton–nitrogen or nitrogen–carbon, are also possible.
With 55 kHz MAS and CHD2 labeling of V and L methyl groups, a related sequence was used to acquire methyl–methyl distance information.97,236 Other sites were deuterated, and exchangeable sites protonated at 20–30%. DREAM mixing (Figure 39b) was used and the structure of ubiquitin determined together with amide restraints. A schematic representation of the methyl restraints (C–H restraints more generally) is shown in Figure 40d–f.
While partial deuteration is still advantageous at spinning frequencies above 60 kHz, spin-diffusion is quenched under these conditions. This led to the development of alternative approaches that maintain the advantages of second-order recoupling. Using 100 kHz MAS, the structure of ubiquitin was determined based on 1H–1H transfers induced by rotating-frame spin-diffusion (Figure 39c).142 Since this transfer mechanism occurs during a spin lock, the signal is severely affected by a short 1H T1ρ. The search for a sequence that depends instead on the slower 1H longitudinal relaxation led to the development of AM-MIRROR, in which longitudinal proton–proton spin-diffusion is reactivated by an RF field applied on a heteronucleus, e.g., 15N (Figure 39d).237
7.3. 1H–1H Distances in Nondeuterated Samples
With the advent of probes capable of spinning beyond 100 kHz, such methods, most commonly RFDR, were applied to fully protonated proteins.111 Although the very high proton density limits the distance over which contacts can be acquired, this is compensated by measurement of many close distances which are available when there is a high assignment completeness in both backbone and side-chain resonances.
Selective recoupling methods have also been proposed in order to improve the transfer efficiency among amide protons, while limiting transfer to aliphatic spins. In principle this improvement would extend the upper distance limit, similar to the case for a perdeuterated protein. Some first examples of selective transfer are the band-selective spectral spin-diffusion (BASS-SD)238 (Figure 41a) in which distances of 5–6 Å could be observed in nondeuterated proteins.
Figure 41.
RF pulse schemes used for selective recoupling of 1H–1H interactions in fully protonated samples. (a) BASS-SD mixing with RF offset applied at the center of the amide proton frequency band (selection of other frequency bands, such as α or methyl protons is also possible). Panel (b) shows the SPR scheme, which is reminiscent of CN symmetry-based sequences, with a 90° pulse as a basic element (gray and black rectangles). SPR was further generalized for arbitrary phases (pSPR) and unrestricted phase incrementation, resulting in the identification of the MODIST sequence.
Another method, dubbed selective phase-optimized recoupling (SPR, Figure 41b)239 was demonstrated on the nondeuterated tripeptide MLF spun at 150 kHz to outperform broadband RFDR by up to a factor of 3. The pulse sequence is based on phase-alternated 90° pulses. Negative peaks suggest a double quantum mechanism when offsets are opposite in sign, or zero quantum when offsets have the same sign, with the zero-quantum mechanism much less significant at faster MAS rates. The SPR scheme was later generalized to arbitrary flip angle.240 A related selective double (or zero) quantum sequence, SERP, was demonstrated at 68 kHz MAS.241 These approaches mirror selective sequences demonstrated at lower MAS rates of below about 20–30 kHz.242−244 The SERP sequence was shown to encode quantitatively for relatively short distances (below about 4 Å). The authors concluded that the effects of remote (passive) 1H spins are responsible for the remaining 10–15% systematic underestimation of distance with respect to diffraction-based crystal structures.245 The bandwidth of SERP was reported to be about 20% of the relevant dipolar coupling. Selective recoupling was also explored within the framework of C-symmetry sequences246 by selection of particular C elements that allow DQ dipolar recoupling with RF amplitudes of 0.3 to 0.8 times the spinning frequency.247 Polarization transfer efficiency of 40–50% was reported for microcrystalline histidine.
Inspired by SPR, jump return pulses of varying pulse widths and phase were simulated for a four-proton spin system modeled after two amide protons and two α protons. The performance was evaluated according to preservation of total signal and selective transfer among the amide protons, which resulted in the selection of the pulse sequence dubbed modest offset difference internuclear selective transfer (MODIST, Figure 41b).248 The selectivity of the method was shown to be similar for both strong and weak couplings, with only a minor dependence on placement of the offset, such that both amide–amide and aliphatic-aliphatic transfers occur simultaneously.
The above homonuclear methods can suffer from the effects of strong diagonal signals that obscure relevant cross-peaks that lie close to the diagonal. By recording a diagonal-only spectrum, in which mixing is turned off, it was shown that better intensity information also led to a better structure determination for the SH3 protein, as indicated by a reduction in bias to the X-ray structure.249 An alternative diagonal suppression method uses an orphan spin operator to suppress diagonal peaks, which in practice resulted in about 50% suppression with no loss in sensitivity of the structurally relevant cross-peaks.250 While not yet demonstrated, the two methods could logically be combined.
Obtaining exact distances for homonuclear zero-quantum mixing is particularly challenging due to spin-diffusion. Analogous to the eNOE251 approach used in solution NMR, recording multiple mixing times, together with an iterative fitting approach improved the precision of the measured distances.252
7.4. 13C–13C and 15N–15N Distances
Homonuclear carbon–carbon transfer has also been explored for conditions amenable to narrow proton resonances: the fast MAS regime and sample deuteration. First-order recoupling sequences DREAM and RFDR were compared for a deuterated protein at spinning frequencies of 20 kHz.253 While first-order sequences are affected by dipolar truncation, second-order sequences such as spin-diffusion254 can be used to acquire structurally important contacts, but become inefficient for fast MAS and for deuterated samples. To address this, methods such as MIRROR,255 PARIS,256 PAR257−259 (Figure 42a), SHANGHAI,260 or CORD173 (Figure 42b) have been developed.
Figure 42.
Selection of RF schemes used to recouple homonuclear (13C–13C or 15N–15N) dipolar interactions via second-order mechanisms involving a 1H proxy spin. Panel (a) shows proton-assisted recoupling (PAR), which has been applied to monitor 13C–13C or 15N–15N distances. RF field strengths need to be empirically found with guidance from spin dynamics simulations but generally avoiding CP conditions. Panel (b) shows a CORD recoupling scheme, which has been used to record 13C–13C proximities, also in combination with RFDR (CORD-RFDR).174
Nitrogen–nitrogen transfer was also demonstrated using PAR.261,262 While these sequences are typically acquired using carbon (or nitrogen) detection (Figure 40g), they could also be extended for proton detection simply by addition of a cross-polarization step at the end of the sequence.
7.5. 1H–13C, 1H–15N, and 13C–15N Distances
Heteronuclear long-range transfers can also be recorded together with proton detection. This has the advantage that there are only around 70% as many carbon spins and 20% as many nitrogen spins as compared with proton spins (Figure 37). For example, hydrogen bonding geometries place amide proton–carbonyl carbon spin pairs (Figure 40h) within the range of efficient cross-polarization transfer (Figure 43a).263
Figure 43.
RF schemes employed for the detection of heteronuclear proximities. Panel (a) shows long-range cross-polarization, e.g., between remote 1H and 13C′ spins. Panel (b) shows the basic element of REDOR, TEDOR, and TREDOR used for nitrogen–carbon and proton–carbon recoupling. This element is shown on a single channel, preferably the one of the rare (least abundant) nucleus, i.e., 15N, to avoid recoupling of homonuclear interactions. Additional pulses can be incorporated on the other channel to compensate for RF pulse imperfections.
Proton-carbon transfer has been implemented by REDOR,264 nitrogen–carbon transfer with TEDOR158 and either nitrogen–carbon or proton-carbon transfer demonstrated with the recently described combination of REDOR and TEDOR, named TREDOR (Figure 43b).265 In TREDOR, coacquisition of both REDOR and TEDOR compensates for relaxation, reducing the number of fit parameters compared with TEDOR, which improves the precision of the measured couplings. The proton-carbon version of the above heteronuclear recoupling sequences is represented in Figure 40I. The use of selective pulses in REDOR and TEDOR-based recoupling results in a selective version of the measurement, for example, selectively recoupling the carbonyl or aliphatic carbon spins.
7.6. Long-Range Paramagnetic Effects
Long-range structural information across the size of protein domains can be accessed when the target biomolecule contains radicals or paramagnetic metal ions. In these samples, the hyperfine coupling between the unpaired electrons and the surrounding nuclei causes paramagnetic relaxation enhancements (“PREs”) and paramagnetic shifts (contact or “pseudocontact” shifts, “PCS”) that, on account of the large electron magnetic moment, provide structural information over larger distances than those characteristic of internuclear interactions. Jaroniec and co-workers tagged solvent-accessible cysteine residues in GB1 with a thiol-specific paramagnetic nitroxide (TEMPO)266 or a thiol-specific EDTA–metal reagent bound to Cu2+ and Mn2+ ions77 and showed that significant 13C and 15N longitudinal (R1) PREs can be measured for nuclei up to 120 Å away from the paramagnetic center. Similarly, PCS were first measured with 13C detection on microcrystalline Co-MMP12 up to ≃20–22 Å from the metal ion.267,268
2D and 3D 1H-detected correlations at fast MAS provide an ideal platform to overcome the sensitivity problems encountered in these first determinations, and allow the easy quantitative measurement of long-range paramagnetic effects. In deuterated proteins at 60 kHz, the measurement of 15N R1 relaxation rates can be based upon the 1H–15N CP-HSQC experiment combined with a 15N inversion–recovery block, and the measurement of 13C R1 rates can be based on the 2D (H)(CO)NH dipolar correlation module incorporating a 13C inversion–recovery period. This results in highly sensitive experiments, which for example were used to provide more than one hundred PREs between 10 and 24 Å of the Cu2+ ion in Cu,Zn-SOD, with a few milligrams of sample and a couple of days of experimental acquisitions (Figure 44a).177 Similarly, 3D (H)CONH and (H)CANH correlations were used to obtain several hundred PCS, including 1H PCS, in Co2+-SOD.269 From these correlations, PCS were measured as characteristic shifts along parallel lines between the chemical shifts of Co-SOD and the isostructural diamagnetic analogue Zn-SOD (Figure 44b). The implementation of these sequences at 60 kHz MAS further reduced the blind sphere around the metal center, and PCS could be obtained for spins down to 5 Å from the Co2+ ion, in contrast to 12 Å for previous studies at slower MAS.
Figure 44.
(a) 1H-detected measurement of 15N PREs from the comparison of 1H,15N CP-HSQC spectra of Cu2+,Zn2+-SOD and Cu+,Zn2+-SOD. (b) 1H-detected measurement of 1H and 15N PCS from the comparison of 1H,15N CP-HSQC spectra of Co2+-SOD and Zn2+-SOD (“E” - empty at the second binding site). Reproduced from ref (6). Copyright 2013 American Chemical Society.
7.7. Resolution Considerations
The information content available from the recoupling methods discussed above critically depends on resolution of the spectra by which they are recorded. In 13C- and 15N-enriched samples, the interacting spins can be identified by the evolution of one or two chemical shifts before and one or two after the recoupling period, leading to three- to four-dimensional correlations. As summarized in Figure 45, a number of solutions exist, and a particular choice depends mostly on (i) the protein size which determines the number of observed contacts, (ii) the linewidth of spins whose shifts are evolved, and (iii) the inherent (available) sample sensitivity.
Figure 45.
Schematic RF irradiation schemes employed to record 1H–1H (a–c) or 13C–13C proximities (d) with 1H detection. The asymmetric schemes (a) and (b) employ a heteronuclear (X) chemical shift evolution period before and after 1H recoupling, respectively. Panel (c) shows an extended version with two heteronuclear (X) indirect dimensions, optionally augmented to a 4D experiment with a supplementary indirect 1H evolution of the spin of origin. The RF diagram (d) is used to record heteronuclear distances via second-order recoupling.
In practice, resolution of a 2D 1H–1H spectrum is, somewhat different from solution NMR, insufficient even in the simplest systems and one or two indirect heteronuclear dimensions (13C or 15N) are employed.
If the recoupling acts on 1H magnetization/coherence (Figure 45a–c), each heteronuclear dimension entails two magnetization transfers (usually CP), from and to the 1H spins, so that the entire RF scheme benefits from highly sensitive 1H excitation and 1H detection.
Figure 45a shows a general scheme for experiments with broadband 1H mixing, e.g., (H)NHH or (H)CHH. These sequences feature moderate resolution with a pair of heteronuclear and 1H shifts to identify the spin of origin but only a single 1H chemical shift for the spin of destination. They correspond to the earliest schemes used to interpret 1H proximities, namely, 3D HN(H)H and (H)CON(H)H-RFDR experiments,270 and have been employed in structure determination of relatively small proteins such as GB1111,270 and ubiquitin97,142 but also a number of more challenging targets: HELL-F fibrils,215 SOD,112 M2,140 AP205CP,111 and OmpG.227
The scheme shown in Figure 45b implements the heteronuclear evolution after1H recoupling, resulting in either H(H)CH or H(H)NH experiments.235,271 They require extensive evolution of 1H in t1, i.e., the only shift identifying the spin of origin, to match the resolution offered by scheme (a). However, this scheme is often more sensitive for the observation of aliphatic-to-aromatic111 and aliphatic-to-amide spectra, which contain asymmetric 1H–1H correlations (result of the fact that the two correlated spins receive different starting polarization from CP.
Finally, 1H recoupling can be sandwiched symmetrically by heteronuclear and proton dimensions for both the spin of origin and of destination (Figure 45c). The resulting experiment, e.g., 4D (H)NH(H)NH235 or 4D methyl (H)CH(H)CH,97,140 provides ultimate resolution and lowest spectral ambiguity for identifying a contact. For simplicity, the indirect 1H evolution may be skipped leading to the somewhat more conventional 3D (H)N(HH)NH variant.235 Either way, the extra resolution comes at the cost of two additional CP or INEPT transfers, which may compromise sensitivity. Successful applications of this editing scheme were reported for crystalline samples of ubiquitin97 and SH3235 but also for far more challenging membrane-embedded proteins M2,140 OmpG,227 and AlkL60 and cytoskeletal bactofilin A.233 A partial remedy to the sensitivity issue is the concurrent acquisition of up to four spectra if simultaneous transfers to and from 13C and 15N spins are implemented.235,271
Interestingly, second-order recoupling simplifies the scheme of Figure 45c by removing the need for an extra heteronuclear transfer (Figure 45d). The observation of distances between pairs of heteronuclei presents therefore, in principle, a sensitivity advantage, which is, however, offset by the generally degraded efficiency of second-order sequences with increasing MAS frequency.
8. Structure Calculations Based on 1H–1H Contacts
In the previous section, we discussed the spectroscopic methods to yield structural information under fast MAS. Here, we present the evolution of increasingly ambitious structure determinations, which stimulated the continuous development of spectroscopic and tailored isotope labeling methods for structure determination.
The Protein Data Bank currently contains 142 structures determined from solid-state NMR data, of which 12 were calculated using 1H–1H contacts as input (Figure 46).
Figure 46.
Protein structures determined using proton-detected solid-state NMR (with corresponding PDB IDs in parentheses, if available), in the chronological order: GB1, SH3, ubiquitin (2L3Z), SOD (2LU5), M2 (2N70), bactofilin BacA (2N3D), AP205CP (5JZR), OmpG (5MWV), hCAII (6QEB), AlkL (6QWR), HELL-F amyloid (6EKA), and hVDAC1 (7QI2). Coordinates for GB1 and SH3 protein models were obtained from authors of respective publications.270,235
The structures include microcrystalline preparations of small protein domains (ubiquitin142 and GB1111), enzyme complexes (Cu(I),Zn(II)-loaded superoxide dismutase (SOD),177 human carbonic anhydrase II-acetazolamide complex (hCAII),271 and dodecameric aminopeptidase TET2223), viral assemblies (Acinetobacter phage 205 coat protein (AP205CP)111 and bacteriophage SPP1 tail tube272), membrane proteins in lipids (Influenza A proton channel M2,140 outer membrane protein G (OmpG),227 outer membrane protein AlkL60) as well as fibrillar assemblies (bactofilin BacA233 and functional amyloid HELL-F215). Structurally, the proteins represent different fold classes, although “all-beta” (all-β) and “alpha and beta” (α + β) protein folds comprising mainly antiparallel β-sheets are dominant. The methodologies used to determine these structures are quite diverse and were adapted for each particular case by taking into consideration the maximum achievable MAS frequency at the time, employed sample labeling scheme as well as possibility to measure other restraints (e.g., paramagnetic relaxation enhancements (PREs), cryo-EM density maps).
8.1. Structures from Dilute Proton Networks
The original motivation for protein structure determination by MAS solid-state NMR was that, contrary to solution NMR, it is, in principle, not limited by molecular size. Hence, the early development of 13C-detected solid-state NMR methods for protein structure determination273 opened way for obtaining structures of some very challenging high-molecular-weight systems including protein assemblies,274 protein aggregates (amyloids),275,276 as well as membrane proteins.277 However, the approach suffered from low sensitivity and dipolar truncation imposed by strong one-bond dipolar couplings, requiring large sample amounts and use of complex labeling schemes to allow measurement of longer distances. To enable high-sensitivity detection in solid-state NMR, several strategies (mainly using proton spin dilution and faster MAS) were put forward for measurement of resolved proton resonances and long-range 1H–1H contacts. The potential of using 1H–1H contacts for protein structure determination by magic-angle spinning solid-state NMR was first investigated by Rienstra and co-workers.270 The authors combined spin dilution (perdeuteration with back-exchange of labile protons), high field (750 MHz), fast MAS (39 kHz), and triple-resonance experiments to measure hundreds of 15N- and 13C-resolved 1HN–1HN distance restraints and demonstrate the feasibility of a high-resolution structure with the GB1 model protein. A similar approach, but exploiting higher magnetic field and faster MAS, was used for fast resonance assignment and fold determination of the larger human superoxide dismutase.112 Reif and Meier with co-workers extended the strategy to additionally measure highly unambiguous amide-methyl and methyl–methyl correlations in microcrystalline samples of the α-spectrin SH3 domain and ubiquitin, respectively.97,235 These pioneering studies showed that protein assignment and collection of distance restraints by 1H-detected solid-state NMR has potential for determination of de novo protein structures.
SOD, M2, BacA, and OmpG are other structures obtained via these first approaches, relying on extensive protein deuteration to achieve sufficient resolution for the measurement of resolved 1H–1H contacts at 40–60 kHz MAS. Thus, the studied proteins were perdeuterated and either reprotonated at exchangeable sites or with 13CHD2 labeling of ILV methyl groups, allowing the observation of amide–amide (more generally NH–NH) or ILV methyl–methyl contacts only. For the determination of protein structures with high precision, the 1H–1H contacts were in most cases complemented by other structural constraints, such as 13C-detected 13C–15N contacts (from TEDOR, N(HH)C experiments) and 13C–13C contacts (from PDSD, DARR, PAR, RFDR, C(HH)C experiments) as well as hydrogen-bond and paramagnetic restraints.
8.2. Incorporation of Paramagnetic Restraints
In paramagnetic samples, data such as PREs and PCSs can be easily implemented as restraints in combination with internuclear distances and dihedral angles in structure determination protocols, thus complementing the sparse network of amide–amide contacts that can be accessed in deuterated samples reprotonated at exchangeable sites. Also in this case, several established protocols designed in the context of solution NMR278 can be extended to the solid state. In the case of PREs,177,279 quantitative 15N and 13C R1 enhancements are first converted into distances using the Solomon equations in the point-dipole approximation, and then used as NOE-type distance restraints with appropriate upper and lower limits (typically 3 Å greater and lower than the calculated values respectively). Larger PREs, corresponding to residues whose HN–NH cross-peaks are not observable in the paramagnetic form, are included using exclusively an upper limit from the paramagnetic center (typically of 10 Å in the case of Cu2+), and conversely, a purely repulsive term can be used for residues with R1 below of a 0.1 s–1 cutoff. For the implementation of PCSs as structure restraints,268,269 the susceptibility χ tensor needs to be first established. This includes determining the metal ion position (3 coordinates), the anisotropy of the χ tensor (two parameters), and the orientation of its principal axes with respect to the protein frame (three Euler angles). Once reference shifts and an approximate structure model for a diamagnetic analogue are available, the determination of the χ tensor is implemented in iterative way together with the assignment of the PCSs and the refinement of the protein structure.
1H-detected 13C and 15N longitudinal (R1) PREs177 as well as 1H, 13C, and 15N PCSs269 from endogenous Cu2+ and Co2+ ions were used to refine the structure of the protein SOD. The addition of these paramagnetic restraints largely improved the quality of the NMR structures (Figure 47), reducing the rmsd of the resulting ensembles from 3.1 Å without any paramagnetic restraints down to 1.6 Å (PREs), 1.7 Å (PCSs), or 1.4 Å (simultaneous use of both PREs and PCSs). Notably, paramagnetic data lead to dramatic improvements in backbone geometry in the proximity of the Cu2+ and Co2+ binding sites. Differently from solution, in solids, depending on the paramagnetic center used and the location of the binding/tagging site, neighbor effects may become non-negligible, and dilution methods should be applied to distinguish inter- and intramolecular contributions, both in the case of PREs280 and PCSs.268,281
Figure 47.
1H-detected long-range paramagnetic restraints used in the calculation of the solid-state NMR structure of SOD. In the different panel, bundles were calculated (a) without paramagnetic restraints, (b) with 15N and 13C PREs, (c) with 1H, 15N, and 13C PCSs, and (d) with both PREs and PCSs. The Cu and Co ions are represented by violet and pink spheres, and the mean NMR structure is depicted as an aquamarine ribbon. Reproduced from ref (6). Copyright 2013 American Chemical Society.
The use of paramagnetic data is of crucial importance for the calculation of structure models with sparse internuclear proximities, and is likely to become an asset for the generation of highly accurate structural model with the development of new integrating computational tools, such as those involving physics-based atomistic simulations.282
8.3. Structures from Dense Proton Networks
The later development of ultrafast MAS (>100 kHz) providing a significant narrowing of spectral resonances, reduced the need for protein deuteration to resolve 1H–1H contacts. This paved the way for the first structure determinations of fully protonated proteins with 1H detection, the 6.2 kDa GB1 domain and the 28 kDa AP205CP dimer within a 2.5 MDa viral nucleocapsid assembly.111 A pivotal change was the abundance of 1H–1H contacts between the side-chains that could be interpreted site-specifically and with reasonably low ambiguity (Figure 48). For the first time, a structure calculation convergence was obtained without additional constraints from 13C-detected experiments.
Figure 48.
Structural bundles of 10 lowest-energy conformers of fully protonated GB1 (a–d) and AP205CP (e–h) with specific long-range 1H–1H contacts indicated by purple lines: (b,f) between backbone amide protons; (c,g) between backbone amide and methyl protons of ILV residues, (d,h) between all protons. For AP205CP the symmetry-equivalent monomers are depicted in tan and cyan. Reproduced with permission from ref (111). Copyright 2016 National Academy of Sciences of the USA.
The same approach was later used to determine the structures of the more complex AlkL, hCAII and HELL-F. In the case of the AlkL β-barrel, the authors noted a clear pattern of proton–proton cross-strand contacts in 4D RFDR or NOE spectra, which were essential for the structure calculation. These contacts are due to the characteristic short HN–HN distances between hydrogen-bonded residues in antiparallel β-sheets and their ease of measurement could explain the dominance of all-β and α + β proteins among solid-state structures determined using 1H–1H contacts. In the case of the HELL-F amyloid, a distinction between intra- and intermolecular contacts was necessary. Therefore, the approach was extended for measurement of intermolecular 1H–1H contacts using an asymmetric mixed labeling strategy based on an equimolar mixture of fully protonated proteins at natural abundance and deuterated, amide-reprotonated uniformly 15N-labeled proteins (Figure 49).
Figure 49.
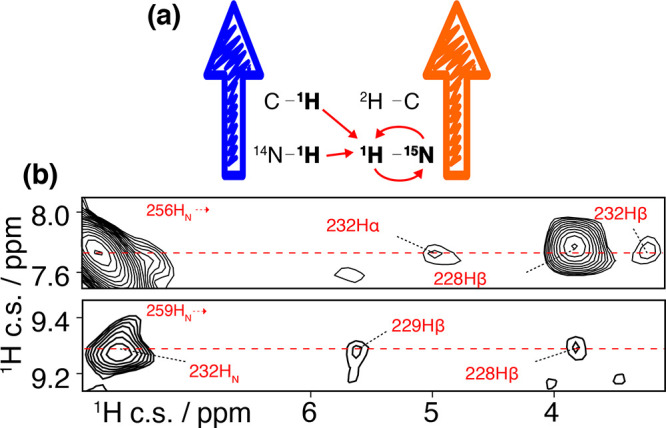
(a) Mixed labeling strategy used to detect intermolecular interactions in HELL-F amyloid based on a (1/1) [(U-1H/14N)/(U-1HN/2H/15N)]-labeled sample. (b) Intermolecular distances based on a H···(H)NH experiment on (1/1) [(U-1H/14N)/(U-1HN/2H/15N)]-labeled HELL-F. Adapted with permission from ref (215). Copyright 2021 National Academy of Sciences of the USA.
8.4. Computational Aspects
One of the advantages of using 1H–1H contacts (as upper distance limits) for solid-state NMR structure determination is that the computational methods and software developed for protein structure determination in solution (such as CYANA,283 UNIO,284 ARIA,285 XPLOR-NIH;286 see Table 3) can be used with only minor adjustments of a few parameters.
Table 3. Details of Solid-State NMR Structure Calculations Based on 1H–1H Contacts and Structural Statistics.
| protein and labeling | software | input peak lists from 1H-detected experiments | distance restraints (of which long-range) | distance restraints per residue | torsion angle restraints | other restraints | backbone rmsd, Å (heavy-atom rmsd, Å) | PDB ID | ref |
|---|---|---|---|---|---|---|---|---|---|
| GB1 | |||||||||
| U-1HN, 2H, 13C, 15N | XPLOR-NIH | CON(H)H, HN(H)H, N(H)H | 517 (142) | 9.2 | 94 | 0.82 (1.71) | (270) | ||
| U-13C, 15N | UNIO/CYANA | (H)NHH, (H)CHH, arom. H(H)CH | 766 (236) | 13.7 | 108 | 0.48 (1.04) | 5JXV | (111) | |
| SH3 | |||||||||
| U-(25%)1HN, 2H, 13C, 15N | ARIA | H(H)NH, H(H)CH | 294 (148) | 4.7 | 70 | 1.16 (2.09) | (235) | ||
| U-(25%)1HN, 2H, 13C, 15N | ARIA | HN(H)(H)NH | 99 (45) | 1.6 | N/A | 1.28 (2.05) | (249) | ||
| U-1HN, 2H, 13C, 15N | eNORA2 | H(H)NH | 112 | 1.8 | N/A | 0.56 | (252) | ||
| Ubiquitin | |||||||||
| U-2H, 15N, LV-13CHD2 | CYANA | HN(H)H, (H)CH(H)CH | 110 (60) | 1.4 | N/A | 0.72 | 2L3Z | (97) | |
| (1) U-1HN, 2H, 13C, 15N; (2) U-2H, 15N, ILV-13CHD2 | CYANA | (1): HN(H)H; (2): (H)CH(H)CH | 212 (104) | 2.8 | 120 | 0.55 (1.06) | (142) | ||
| SOD | |||||||||
| U-1HN, 2H, 13C, 15N | UNIO/CYANA | (H)NHH | 192 (120) | 1.3 | 182 | 1.64 | (112) | ||
| U-1HN, 2H, 13C, 15N | UNIO/CYANA | (H)NHH | 257 | 1.7 | 182 | 175 PRE | 1.66 | 2LU5 | (177) |
| U-1HN, 2H, 13C, 15N | CYANA | (H)NHH | 297 | 1.9 | 182 | 445 PCS | 1.71 | (269) | |
| M2 | |||||||||
| U-1HN, 2H, 13C, 15N, ILV-13CHD2 | XPLOR-NIH | (H)CHH, (H)NHH | 191 | 4.4 | 92 | 13C-det. TEDOR, PDSD, PAR, RFDR | 0.7 (1.1) | 2N70 | (140) |
| BacA | |||||||||
| U-1HN, 2H, 13C, 15N | XPLOR-NIH | HN(H)(H)NH | 1932 (488) | 18.8 | 172 | 116 H-bond, 13C-det. PDSD, N(HH)C | 0.4 (1.0) | 2N3D | (233) |
| AP205CP | |||||||||
| U-13C, 15N | UNIO/CYANA | (H)NHH, (H)CHH | 1376 (410) | 5.3 | 352 | 27 H-bond | 1.23 (1.84) | 5JZR | (111) |
| OmpG | |||||||||
| U-1HN, 2H, 13C, 15N | ARIA | (H)NHH, (H)N(HH)NH | 1847 (435) | 6.6 | 256 | 184 H-bond, 13C-det. DARR | 1.19 | 5MWV | (227) |
| hCAII | |||||||||
| U-13C, 15N | ARIA | H(H)NH, H(H)CH | 1583 (376) | 5.9 | 302 | 2.2 (2.8) | 6QEB | (271) | |
| AlkL | |||||||||
| (1) U-1HN, 2H, 13C, 15N; (2) U-13C, 15N | CYANA | (1) (H)NH(H)NH; (2): H(H)NH, H(H)CH, (H)N(HH)NH, (H)C(HH)CH (H)NH(H)NH | 769 (323) | 3.1 | 303 | 94 H-bond | 0.66 (1.40) | 6QWR | (60) |
| HELLF | |||||||||
| (1) U-13C, 15N; (2) 1/1 U-1H, 14N/U-1HN, 2H, 15N | ARIA | (1): H(H)NH, H(H)CH; (2) H(H)NH | 211 (143) | 4.5 | 68 | 26 H-bond | 0.73 (1.18) | 6EKA | (215) |
| mixed labeling: H(H)NH | |||||||||
| VDAC1 | |||||||||
| U-1HN, 2H, 13C, 15N | CYANA | HN(H)(H)NH | 97 (60) | 0.34 | 292 | 76 H-bond, 5 PRE, 38 AFMa | 2.2 (2.8) | 7QI2 | (225) |
13Cα–13Cα distance restraints based on AFM-determined barrel shape.
Furthermore, specific routines for preparation of input data and structural analysis are applicable without modification. Figure 50 illustrates the approach used for calculating the structures of GB1 and AP205CP based on proton-detected solid-state NMR experiments.
Figure 50.
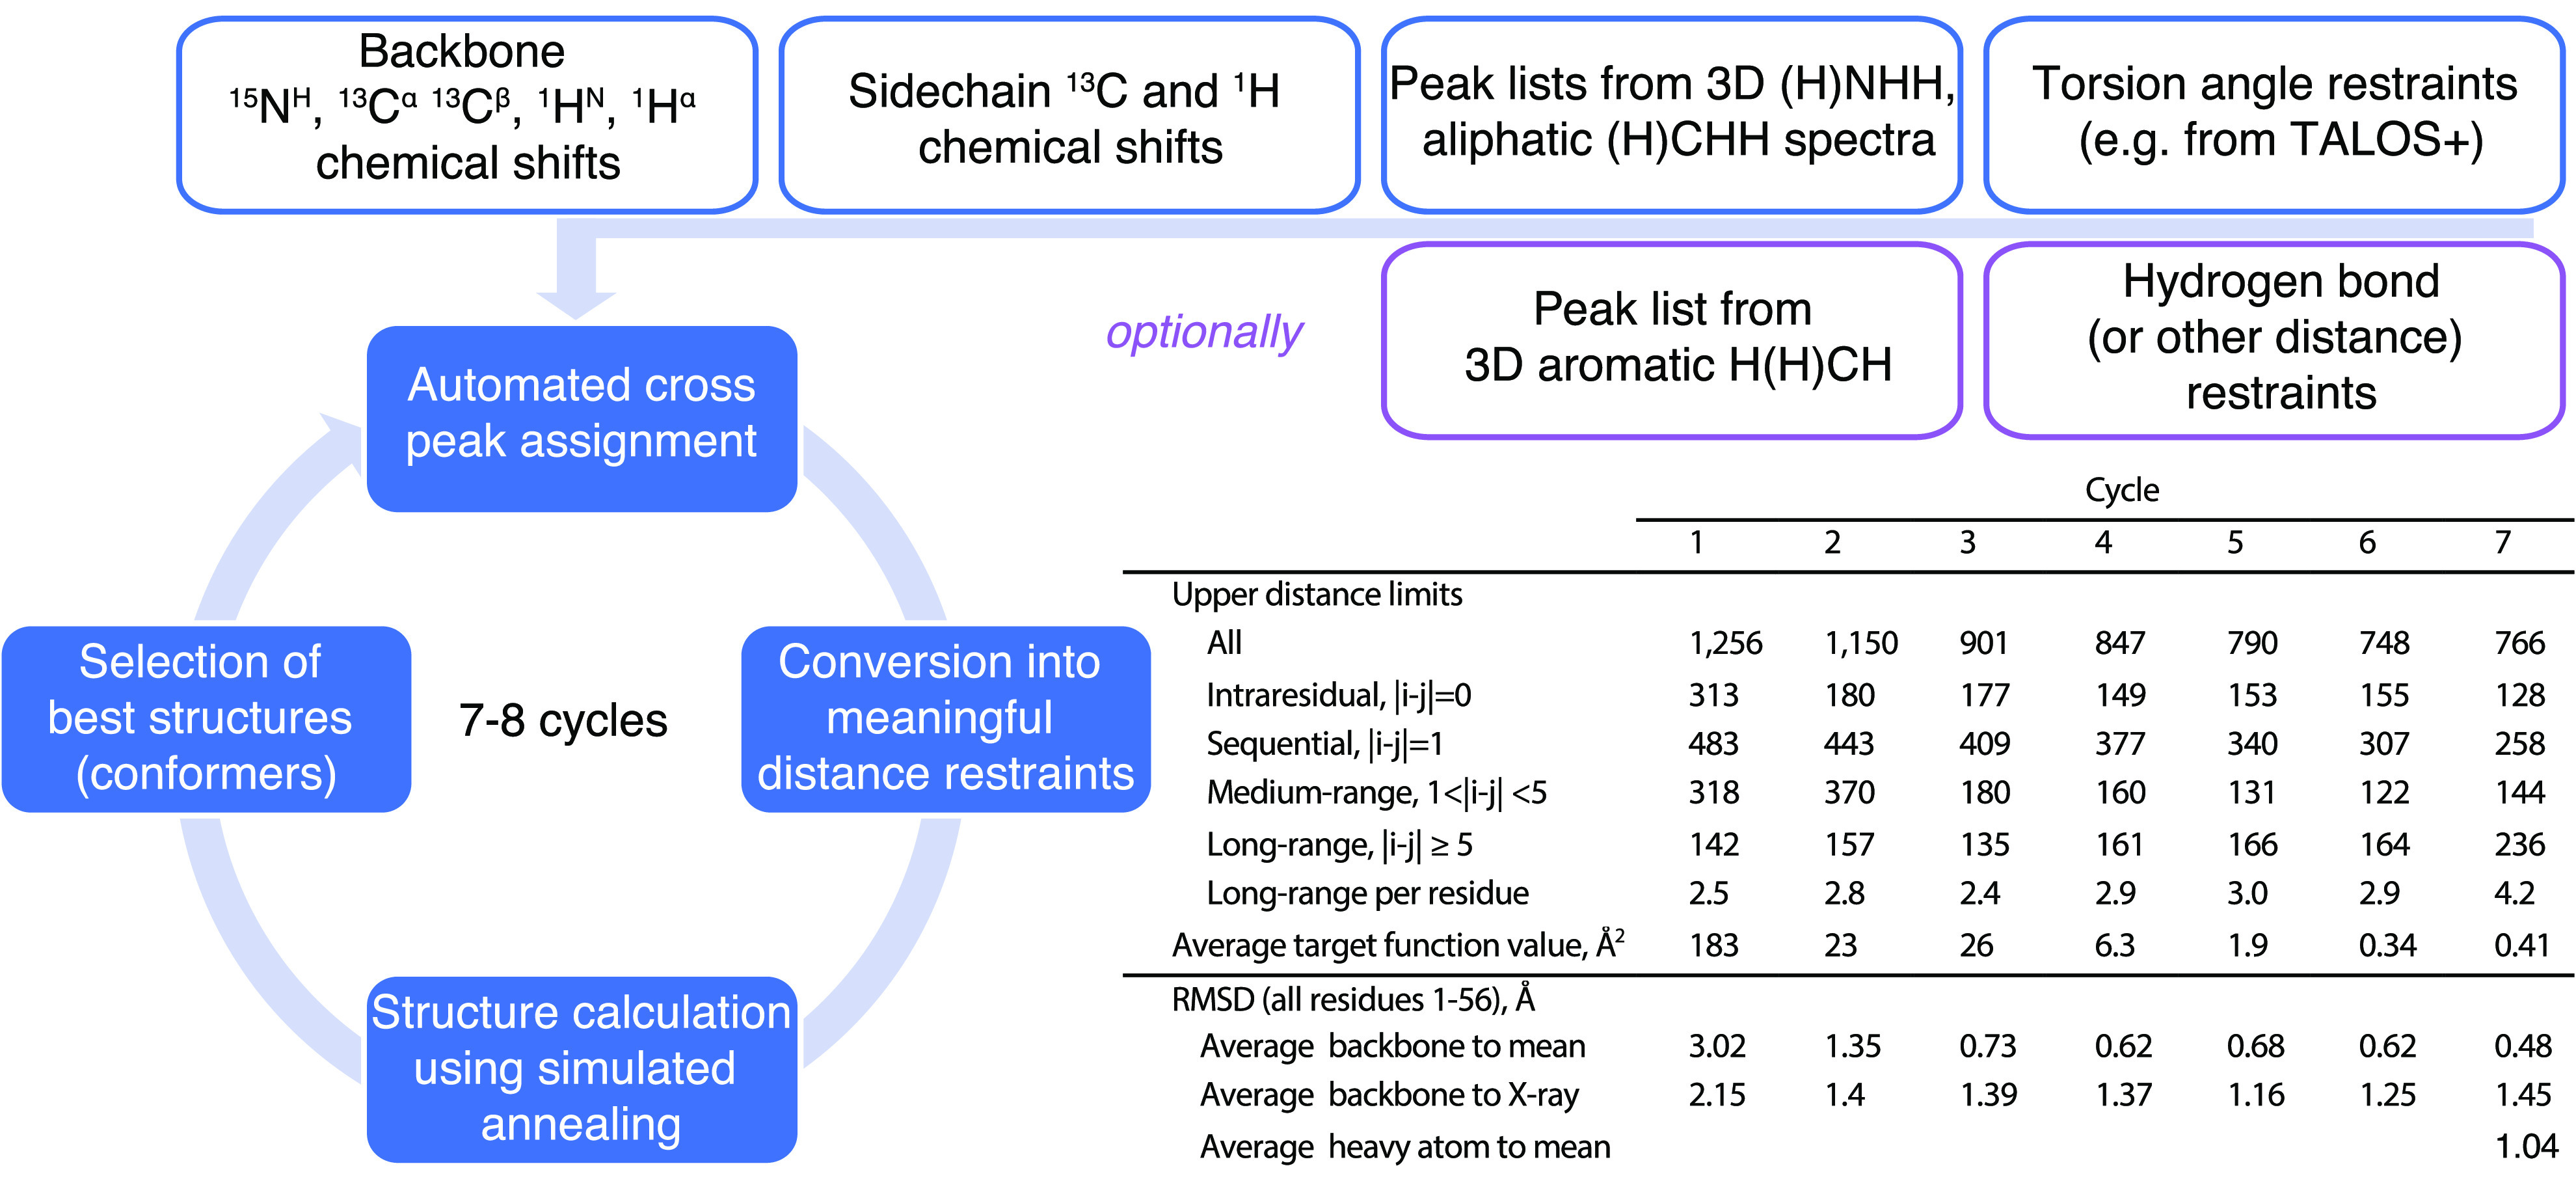
Flowchart of protein structure calculation based on proton-detected solid-state NMR experimental input. At the bottom, statistics of the GB1 structure calculation using UNIO-CANDID/CYANA are shown, illustrating the convergence of the calculation from cycles 1 to 7.111
The structures were calculated with the UNIO software package, by taking as inputs the backbone chemical shifts, the side-chain chemical shifts, TALOS+287 backbone dihedral angle restraints (based on 13C′, 13Cα, 13Cβ, 1HN, and 1Hα chemical shifts), two to three 3D peak lists from (H)NHH, aliphatic (H)CHH, and aromatic H(H)CH spectra (for GB1 only), and manually defined hydrogen bond (or other distance) restraints (for AP205CP only). The three peak lists were obtained by manual peak picking of the corresponding 3D RFDR spectra. The standard unsupervised UNIO-CANDID protocol was used, consisting of seven cycles of cross-peak assignment, conversion into meaningful distance restraints, and structure calculation using simulated annealing in CYANA. The only modifications to default parameters were larger chemical shift tolerances for cross-peak assignment corresponding to the experimental linewidths, namely 0.15 and 0.4 ppm for proton and heavy-atom dimensions. Default calibration of peak intensities (not volumes, to prevent integration errors due to signal overlap), assuming a median of deduced distances of 4 Å, was used with r–6 scaling of peak intensities. In addition to the torsion angle restraints from TALOS+, UNIO-generated torsion angle restraints for the backbone dihedral angles φ and ψ were added to the input for each cycle of structure calculation. 80 structures were calculated in each cycle, and the 20 conformers with the lowest CYANA target function values were selected and passed to the subsequent cycle. The statistics of the GB1 structure calculation shown in Figure 50 illustrate the convergence of the structure calculation of GB1 from the first to last cycle. An important aspect of the iterative approach to interpretation of the initially ambiguous 1H–1H contacts is that in subsequent cycles, most of erroneous cross-peak assignments are discarded based on the approximate (interim) structure. This was clearly illustrated during structure determination of AlkL, where a clear pattern of contacts between residues in antiparallel β-sheets appeared in the course of calculation, but was initially obscured by spectral ambiguities (Figure 51).
Figure 51.
Proton–proton contact maps measured for AlkL. In (a), automatically generated contacts from peaks picked from the (H)NH(H)NH spectra. Contacts arising from one side of the spectrum diagonal are shown in red, whereas those from the other are shown in blue. In (b), the contact map of the final structure is shown, after resolution of ambiguities using CYANA, and including contacts from all spectra. Adapted with permission from ref (60). Copyright 2020 National Academy of Sciences of the USA.
Table 3 lists the input data for solid-state NMR protein structure calculations with 1H–1H upper distance limits and structural statistics. In contrast to the common approach used for interpretation of 13C–13C contacts, 1H–1H cross-peaks were in nearly all cases interpreted quantitatively (and not grouped qualitatively). This is because of the rather uniform degree of (re)protonation across different protein residues. Furthermore, the conversion into distance restraints was mostly done using automated methods available in the used NMR structure calculation software assuming r–6 scaling of peak intensities.
The quality of experimental input data and reliability of the structure calculations is often characterized by the number of distance restraints per residue, which is in the range of 1.7–18.8. For some proteins such as GB1 and BacA this number is approaching a value characteristic for solution NMR structure determinations (>10). However, in most cases the structures were calculated based on approximately 4–6 distance restraints per residue. Therefore, to obtain structures with high precision (i.e., with backbone rmsd < 2 Å), the distance restraints were complemented with other types of experimental restraints, mostly torsion angle restraints determined from backbone chemical shifts using TALOS+, hydrogen bond restraints from characteristic contact patterns or initial structure calculations, or even paramagnetic relaxation enhancements (PREs) as in the case of SOD.
8.5. Integrative Approaches
The 1H–1H contacts obtained from solid-state NMR have also been combined with structural data obtained using other methods such as cryo-EM and solution NMR for calculation of hybrid structures of TET2 aminopeptidase and SPP1 tail tube (Figure 52).
Figure 52.
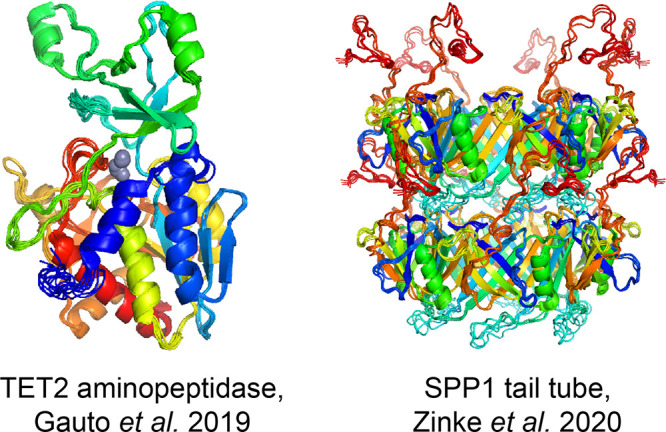
“Hybrid” structures of TET2 aminopeptidase (PDB ID 6F3K) and bacteriophage SPP1 tail tube (PDB ID 6YQ5) determined using solid-state NMR 1H–1H contacts together with other structural methods (solution NMR and/or cryo-EM).
In the case of TET2, 1H–1H distances between backbone amide sites and between amides and methyls of ILV side-chains as well as contacts between such methyls were measured in a single time-shared 13C/15N 3D RFDR experiment. 13C–13C distances were additionally measured on a selectively LKP-labeled sample. However, attempts to calculate the structure from the NMR data (471 spectrally unambiguous and 45 spectrally ambiguous distance restraints, 544 backbone dihedral angle restraints) failed in achieving convergence. Therefore, an approach was developed for the combined use of EM and NMR data, which is applicable to cases where only medium-resolution cryo-EM maps (between 6 and 10 Å) are available. In this approach, certain structural elements (e.g., α-helices) and their relative arrangement in 3D space is identified in the medium-resolution EM maps and included as distance restraints in the NMR-based structure calculation driving the convergence toward the correct fold.223
In the case of SPP1 tail tube, highly unambiguous long-range 1H–1H distance restraints between amides, methyl groups, methyl, and amide sites (both globally and at protein–protein interfaces) were measured using 4D and 3D RFDR experiments with several differently labeled samples. Combination of the local information provided by the NMR restraints with the global shape information encoded in the cryo-EM map allowed the authors to compute a near-atomic structure of the tail tube, which was not possible based only on the NMR restraints and homology information with literature values for the symmetry parameters.272
These two examples illustrate the power of an integrated approach, where NMR provides structural information on a shorter and cryo-EM on a longer length scales.
9. 1H Detection and Protein Dynamics
Protein function tightly depends on a hierarchy of local and collective conformational transitions, which encompasses over 15 orders of magnitude in time.288,289 One of the long recognized advantages of NMR is to measure molecular motions with both time and space resolution. The measurement of dynamics is of particular interest in solid samples such as microcrystals, hydrated sediments and transmembrane proteins, where functionally relevant internal motions are present, while the overall rotational tumbling, which often dominates solution NMR studies, is abrogated. In powdered solids under MAS, information on the motional process is obtained either by measuring site-specifically anisotropic spin interaction tensors (recoupling) or by measuring spin relaxation and chemical exchange, which detect the fluctuations of the interaction tensor within observable-specific “time windows”.
1H-detected NMR spectroscopy at fast MAS has developed as an asset in this context. Relaxation/recoupling modules can be combined with 2D 1H,15N and 1H,13C correlation sequences (typically “CP-HSQC” or “J-HSQC”) into schemes that possess the resolution required for the efficient determination of multiple site-specific parameters in large proteins, as sketched in Figure 53. A general scheme is presented in Figure 53b, where 2D sequences can be used as read-out modules combined with a third relaxation/recoupling pseudodimension. Depending on the nucleus of interest (X or 1H, respectively), the relaxation/recoupling block can be inserted before or after the second polarization transfer. As recalled in section 5, at fast MAS rates these experiments employ only low-power RF fields, thus removing the danger associated with prolonged high-power irradiations. In parallel, the leap forward in sensitivity offered by 1H detection introduces a drastic reduction in the experimental times. As an example, the measurement of 15N T1 in microcrystalline Crh, a dimeric protein of 85 residues, reported by Giraud et al. required 540 h of signal averaging,290 whereas less than 12 h are necessary today with 1H detection and fast MAS for targets of equivalent molecular complexity. Further addition of a heat-compensation block after the detection of the FID assures constant irradiation conditions for the sample throughout the whole experiment and is often necessary to eliminate small inconsistencies between different time points of the pseudodimension. Overall, this reduces the vulnerability of the experiment to machine or sample instabilities and yields reliable and consistent datasets. For proteins of medium size (up to 150 residues), the resolution provided by 2D 1H,15N correlations at high magnetic fields with 60 kHz MAS (in deuterated samples) or 100 kHz MAS (in fully protonated samples) is typically sufficient to resolve more than 50% of sites. This guarantees that the pseudo-3D schemes described above yield a sufficient number of site-specific probes for dynamics distributed across the primary sequence. In the case of larger molecules, these schemes can be further extended including an additional chemical shift-encoding dimension for improved resolution.60,203,291 In fully protonated molecules, the coupling to many different protons prevents the accurate interpretation of anisotropic lineshapes, and coherent contributions interfere with the measurement of relaxation parameters. As we will see below and shown in Table 4, the very same approaches developed in the last decades and based on proton dilution by deuteration and/or faster MAS to favor 1H detection, alleviate these problems and have transformed our practice for detecting and quantifying motions in biomolecules.
Figure 53.
(a–c) Schematic representation of (b) spin relaxation caused by fluctuations of the anisotropic interactions and (c) direct measurement of scaled (motion-averaged) anisotropic interaction tensors, encoded in two chemical shift dimensions (a). Reproduced with permission from ref (27). Copyright 2021 Elsevier. (d) General block scheme of a 1H-detected NMR experiment for site-specific measurement of heteronuclear spin relaxation, exchange, and/or anisotropic interaction recoupling for which the “relaxation/recoupling“ block is detailed in (e).
Table 4. Summary of the Minimal MAS Frequency Required to Make the Coherent Effects on the Dynamic Observables Discussed in the Text Negligible under Different Protonation Conditions.
| observable | proton content | min MAS rate (kHz) | ref |
|---|---|---|---|
| 15N R1 | ≪100% HN | 13 | (292) |
| 100% HN | 50 | (177) | |
| 100% H | 50 | (293) | |
| 13C′ R1 | 100% H | 60 | (184) |
| 13Cα R1 | sel. lab.a | 50 | (294) |
| 100% H | >100 | (295) | |
| 13Cs R1b | sel. lab.a | 24 | (294) |
| 100% H | >100 | (295) | |
| NOE | ≪100% H | 20 | (296) |
| 15N R1ρc | ≪100% HN | 20 | (297) |
| 100% HN | 27 | (298) | |
| 100% H | 45 | (298) | |
| 13C′ R1ρc | 100% H | 45 | (55) |
| 13Cα R1ρc | 100% H | 45 | (55) |
| 1H R1ρ | 100% HN | >150 | (50) |
| 100% H | >150 | (50) | |
| 15N RDd | ≪100% HN | 39.5 | (38) |
| 100% HN | 60 | (299) | |
| 13C RDd | sel. lab.a | 55 | (294) |
| 1H RDd | ≪100% HN | 40 | (300) |
| 100% HN | >150 | (50) | |
| 1H CSA | 100% H | 100 | (58) |
| D(1H–15N)e | ≪100% HN | 20 | (301) |
| 100% HN | 40 | (302) | |
| 100% H | 40 | (303) | |
| D(1H–13C)e | ≪100% H | 20 | (98) |
| 100% H | 40 | (303) |
Selective 13C labeling.
Side-chain 13C R1.
Spin lock fields amplitudes >10 kHz.
Relaxation dispersion.
Dipolar coupling.
9.1. Recoupling of Anisotropic Interactions
One of the most direct ways to quantify dynamical processes by solid-state NMR is to measure anisotropic interaction tensors. If motional modes with frequencies larger than the strength of an NMR interaction happen, dynamics partially average the observed components of the corresponding tensor. The measurement of the motionally scaled anisotropy and asymmetry thus brings direct information on the spatial sampling of the molecule. One-bond 1H–X (X = 13C, 15N) dipolar couplings give a straightforward access to order parameters S = δD/δD,rigid, as the rigid-limit reference δD,rigid corresponds to the bond distance. Many techniques exist to selectively reintroduce these interactions under slow MAS, but their precision is typically affected by the prolonged high-power RF irradiations necessary to eliminate the parasite contributions from 1H–1H couplings (see ref (304)). Reif’s group was the first to demonstrate that high proton dilution (perdeuteration and 10% back-exchange) removes the requirement for homonuclear decoupling in these sequences, allowing the measurement of backbone 1H–15N dipolar couplings with high accuracy.301,305 In these early implementations, 15N coherences were dephased by a phase-inverted CP (CPPI), in which Hartmann–Hahn matching alternates between the +1 and −1 rotary resonance condition.301 Provided highly deuterated samples are used, rotational-echo double resonance (REDOR),306 which makes use of a train of rotor-synchronized π pulses, was subsequently shown to be more robust toward RF mis-setting and offset position.307 With perdeuterated and 10–30% back-exchanged proteins in the 40–60 kHz MAS regime, REDOR guarantees an elevated precision for the determination of backbone order parameters308−310 and provides information also on the asymmetry of the dipolar interaction tensor, a relevant information for the description of side-chain rotameric motions.98 The main limitation in the application of REDOR is its sensitivity to the presence of neighboring protons, which introduces an additional dephasing contribution. Higher MAS rates make the method compatible with less stringent proton dilution, and for example numerical simulations have shown that REDOR can be applied to perdeuterated proteins with 100% back-exchange when MAS frequencies exceed 100 kHz.311 The variable contact time cross-polarization (CPVC)303,312 is an alternative approach that determines the dipolar couplings directly by registering the dipolar modulation active during the polarization transfer step. This method is particularly suitable in fast MAS conditions and elevated proton contents, as the decoupling of 1H homonuclear dipolar interactions does not depend on rotor synchronization but is guaranteed by MAS frequencies above 40 kHz. The CPVC pulse sequence has been implemented for 1H detection313 in a pseudo-3D and, recently, pseudo-4D manner291 and proven to be suitable even on unlabeled molecules.314 Reif and co-workers have also recently presented a completely different approach, based on the measurement of the dipolar dephasing during a spin–echo at off-magic-angle conditions in highly deuterated samples. A small magic-angle misadjustment (on the order of 0.0388°) does not degrade significantly the quality of the 1H–15N and 1H–13C correlation spectra but is sufficient for the quantification of the heteronuclear dipolar coupling constants.315,316 This method can be applied at arbitrarily high MAS frequencies, as neither rotor synchronization nor particularly high radio frequency field strengths are required.
9.2. Spin Relaxation Rates
While averaged anisotropies are mainly reporting on geometric details of the dynamics, nuclear spin relaxation gives more specific access to motional time scales. Figure 54 shows the sensitivity of the most notable relaxation rates to motional time scales, as derived from Redfield theory.317
Figure 54.
15N (a) and 13C (b) R1 and R1ρ relaxation rates calculated for variable correlation times and variable Larmor frequency (for R1) or MAS frequency (for R1ρ). Relaxation rates are calculated using the expressions derived from Redfield theory in ref (317) by assuming that 15N relaxation is driven by the dipolar interaction with a 1H spin 1.02 Å away and by its CSA (170 ppm). For 13C relaxation, we considered a dipolar interaction with a 1H spin 1.1 Å away and a CSA of 40 ppm. The density functions are assumed to follow the model-free formalism, with only the “internal” part of the Lipari–Szabo function34 and the order parameter S2 fixed to 0.85.
On the fastest edge, longitudinal relaxation rates report on motions in the picosecond–nanosecond window, that is on fast backbone and side-chain fluctuations.184 In the solid state, however, proton-driven spin-diffusion during the longitudinal relaxation period promotes magnetization transfer between spins. This introduces a coupling to fast relaxing sites (relaxation “sinks”) which flattens the measured R1 rates of different sites into average values which are no longer reporting on internal dynamics.
This effect is smallest on 15N, which has a lower gyromagnetic ratio and is sparsely distributed in a protein. 15N PDSD is present but small in protonated samples at 10–20 kHz MAS and on 500–700 MHz spectrometers.292,318 As PDSD scales inversely with the magnetic field strength and MAS frequency, its effect is completely suppressed with 60 kHz MAS on a 1 GHz machine177 and 15N R1 rates can be quantified reliably.
The situation is more complex for 13C spins, which have larger gyromagnetic ratios and are present in a much denser network in proteins. This makes 13C PDSD much more efficient to the point that it dominates the measurement of longitudinal relaxation rates for Cα and side-chain carbons184 and is not abrogated even at the fastest MAS available today. Longitudinal relaxation of aliphatic 13C spins, which encodes information about side-chain motions, can be retrieved by combining fast (>50 kHz) MAS with a particular labeling scheme where both 1H and 13C spins are diluted via deuteration and sparse 13C labeling.294 The case of carbonyl 13C is different by virtue of their distinct chemical shifts which slows down PDSD, so that at 60 kHz MAS site-specific relaxation rates can be measured even in fully protonated proteins.18413C′ R1 rates represent a complementary probe of fast (picosecond–nanosecond) backbone fluctuations,55 and today they can be measured simultaneously with 15N R1 rates, in a strategy which optimizes the experimental time.295
Earlier attempts to enrich the picture of protein dynamics provided by longitudinal relaxation rates focused, in analogy with the solution NMR approaches, on the measurement of heteronuclear NOEs under MAS.319 Only high deuteration and selective labeling, however, were shown to yield NOE values free from coherent contributions.296 Another strategy to refine the determination of motional time scales consists in exploiting the dominant contribution of terms depending on Larmor frequency in the expression of R1 relaxation rates via the measurement of 15N and 13C R1 rates at variable magnetic fields.320,321
In principle, transverse relaxation rates represent a more complementary piece of information to reconstruct the protein dynamics landscape, as they are sensitive to motions on a slower time scale. While in solution the most used parameters in this case is 15N R2, the particular sensitivity of this observable to coherent dephasing triggered the investigation of alternative parameters with equivalent sensitivity to slower motional time scales. CSA/dipolar cross-correlated relaxation rates have been first used as probes of ns-ms motions of perdeuterated proteins.322−324 These parameters are calculated as the difference of decay rates for two doublet components, so to cancel the impact coherent dephasing, which affects both lines identically. The most accessible parameters in this context are 15N and 13C′ spin–lattice relaxation rates in the presence of a spin-lock field (15N and 13C′ R1ρ). Also in these cases, the measurements are susceptible to residual coherent effects in fully protonated samples. For example, MAS frequencies >40 kHz and a spin-lock nutation frequency >15 kHz are required to accurately measure 15N R1ρ(298) and 13C′ R1ρ(55) in fully protonated solids. On deuterated samples, the requirement on the spin-lock nutation frequency is further weakened, with the possibility of observing 15N R1ρ relaxation in the window below 10 kHz spin-lock fields.38,297
9.3. Modeling Protein Dynamics
The combination of data sets for different observables represents the most efficient route to approach the complexity of protein motions. The combined analysis of different relaxation rates (typically 15N R1 and R1ρ) models dynamics with discrete time distributions.177,325 This can be carried out using the Lipari and Szabo’s model-free approach (with a single time scale of motion, simple model free or SMF; with multiple independent time scales, extended model free or EMF), or by explicitly taking into account the spatial sampling of the motions (as restricted rotational diffusion of unit bond vectors (e.g., amide NH) in a cone,34 discrete jumps,326 or 3D anisotropic Gaussian axial fluctuations (GAF) of the amide NH bond orientations.327 All of these analyses gain robustness when additionally complemented with global order parameters from averaged dipolar couplings.308,328 As an alternative, a model-independent approach has been recently proposed which considers the existence of a continuous rather than discrete distribution of motions.329 This analysis is based on the use of “dynamic detectors”, reporters which are obtained as linear combination of relaxation rates and can be optimized so to cover more uniformly the range of correlation times.330Table 5 reports an overview of MAS NMR studies where backbone motions were analyzed quantitatively using motional models.
Table 5. Published Quantitative Analysis of Backbone Dynamics with Spin Relaxation.
| protein (form) | proton content | MAS (kHz) | method of analysisa | ref |
|---|---|---|---|---|
| Crh (microcrystalline)b | 100% H | 10 | C-EAS | (290) |
| 100% H | 10 | 3D-GAF-EAS | (325) | |
| thioredoxin (precipitate)b | 100% H | 10 | (331) | |
| SH3 (microcrystalline) | 10% HN | 20 | EMF, C | (320) |
| 30% HN | 27.7, 40, 55.5 | SMF, BMRD, NERRD | (332) | |
| ubiquitin (microcrystalline) | 30% HN | 45 | EMF | (308) |
| 50% HN | 39.4 | EMF | (293) | |
| GB1 (microcrystalline) | 100% H | 60 | C-EAS, 1D-GAF-EAS | (298) |
| 100% H | 60 | EMF | (55) | |
| 100% H | 60 | SMF, BMRD | (333) | |
| GB1 (in complex with IgG, precipitate) | 100% H | 45/52/60 | 3D-GAF, BMRD | (299) |
| 100% H | 60 | SMF, RD | (333) | |
| ubiquitin (microcrystalline) | 20% H | 50 | BMRD | (40) |
| 50% H | 39.5 | BMRD, NERRD | (38) | |
| 20% H | 44 | BMRD, NERRD | (334) | |
| SOD (microcrystalline) | 100% H | 60 | C-EAS, 1D-GAF-EAS, SMF | (177) |
| 100% HN | 60 | SMF, BMRD | (335) | |
| ASR (membrane-embedded)b | 100% H | 8/12/50 | SMF | (336) |
| 100% H | 20/60 | EMF, 3D-GAF | (337) | |
| HET-s (fibrils) | 100% HN/25% H (iFD) | 40/60 | EMF | (310) |
| OmpA (membrane-embedded) | 100% HN | 60 | 3D-GAF-EAS | (338) |
| β2m (microcrystalline) | 100% HN | 60 | SMF, BMRD | (234) |
| hCAII (microcrystalline) | 100% HN | 55.5 | BMRD, NERRD | (339) |
| rhomboid protease (membrane embedded) | 100% HN | 60 | BMRD | (230) |
| huPrP23–144 (fibrils) | 50% HN | 40 | BMRD, NERRD | (340) |
GAF = Gaussian axial fluctuations; SMF = simple model free; EMF = extended model free; C = diffusion in a cone; EAS = explicit averaged sums;290 BMRD = Bloch–McConnell relaxation–dispersion; NERRD = near-rotary resonance relaxation–dispersion.
Studies based on 13C detection.
9.4. Exchange Spectroscopy
As in solution NMR, relaxation rates may have contributions arising from chemical shift fluctuations occurring during conformational exchange. This phenomenon is the basis for another class of experiments, classically grouped under the name ”exchange spectroscopy”.3411H-detected methods at fast MAS have fueled the development of these techniques, which reveal “invisible” excited states of proteins involved in crucial phenomena such as transport, signaling, folding, and misfolding. Slow (microsecond–millisecond) processes can be unveiled by measuring 15N R1ρ at variable spin-lock fields, the commonly named relaxation–dispersion (RD) experiment (Table 5). In solids, this experiment can be implemented by either measuring on-resonance 15N R1ρ with relatively low-power irradiations (3–20 kHz)298 or by sampling spin-lock fields approaching the MAS frequency,38,342 a method dubbed near rotary resonance RD (NERRD) that relies on the interference between sample rotation and RF irradiation (Figure 55).
Figure 55.
15N R1ρ relaxation–dispersion profiles for motions occurring at a typical time scale τ of 1 ms (blue) or 10 ns (red). The profiles are the sum of the rates calculated with Bloch–McConnell equations for a two-site exchange (with τ defined as 1/kex)343 and R1ρ expression derived from Redfield theory for 40 kHz MAS (with τ being the correlation time).317
A fit of the resulting profile R1ρ versus RF strength with the Bloch–McConnell equations returns parameters such as the populations of the exchanging conformational states, their chemical shifts and their exchange rate. These parameters are often highly correlated if only the low-power irradiation window is measured, as it is the case in solution NMR studies. Under MAS, joint analysis with the NERRD data permits to disentangle the fit parameters and to derive additional structure information. RD methodology requires the acquisition of a relatively large number of relaxation experiments, but can be accelerated significantly via paramagnetic doping, which reduces 1H T1 times but does not affect the exchange contribution to the measured 15N R1ρ rates.333 Coherent effects are even more detrimental for the 13C R1ρ relaxation–dispersion experiments, where additionally 13C–13C dipolar and scalar couplings further complicate quantitative interpretations. The only successful 13C R1ρ RD study made use of selective 13C–1H labeling and fast MAS rates for the characterization of slow aromatic ring flips.344 For the slow (microsecond–millisecond) processes, Rovó and Linser recently showed that a more accurate description, including quantification of the relative populations of exchanging states, can be obtained if off-resonance 15N R1ρ data are combined with chemical exchange saturation transfer (CEST) profiles.345 CEST relies on a RF irradiation period with varying offset which produces a saturation profile dependent on the chemical shift of the (invisible) alternative conformer.346 Only in the case where extensive deuteration is combined with fast MAS rates, the investigation of conformational exchange can be extended to slower millisecond time scales by CPMG relaxation–dispersion40 and to the millisecond–second range by dipolar- or CSA-based exchange spectroscopy.347
9.5. 1H-Based Dynamics
By efficiently averaging strong 1H–1H couplings, fast MAS paves the way to CSA recoupling, spin relaxation and RD experiments on 1H, removing the need for 1H-decoupling via Lee–Goldberg irradiations, used in early implementations.348
1H CSA is a small effect but extremely diagnostic of dynamics and hydrogen bonding interactions. A particularly adapted solution for its measurement is provided by symmetry-based recoupling sequences of the RNnν family,246 consisting of trains of rotor-synchronized π pulses applied with a specific phase increment. Polenova’s laboratory has presented in-depth analysis of the performance of such experiments and validated their site-specific application to various protein assemblies.349 2D and 3D 1H-detected implementations have been demonstrated at 100 kHz MAS on organic powders,350,351 in a peptide at natural isotopic abundance352 and on tubular assemblies of fully protonated HIV-CA protein.58 A scheme based on Cn1 symmetry was more recently used to selectively recouple 1H CSA in strongly coupled 1H networks for application to fully protonated samples under fast MAS.353
The palette of observables for protein dynamics has been further extended with preliminary investigations of 1H R1ρ RD. 1H R1ρ relaxation is of particular interest, as it is driven by dipolar couplings with several protons from neighboring residues, and could therefore, in principle, report on large-scale structural rearrangements and on translations of the amide vector. Analyses of R1ρ RD have been reported for amide protons in highly deuterated proteins at MAS rates in the 30–60 kHz regime, showing that even under these conditions these rates are affected by coherent effects and are only compatible with a qualitative picture of protein motions.300,332
10. Structural and Dynamical Biology by 1H-Detected MAS NMR
Given their peripheral location, protons are very sensitive probes of any structural and/or environmental changes of proteins. Direct observation of proton nuclei allows monitoring of the 1H NMR resonances and their relaxation properties with high sensitivity (per unit sample), and therefore 1H-detected solid-state NMR is an excellent technique for studying protein interactions in systems available in limited quantities. In this section, we review the plethora of recent examples leveraging the advantages of 1H-detected solid-state NMR for the study of protein interactions, dynamics, protonation states, hydrogen bonding, water exposure, and environmental effects, which all are important indicators of protein function.
10.1. Protein–Protein and Protein–Nucleic Acid Interactions: NMR beyond 1 MDa
For large molecules, fast MAS averages anisotropic interactions more efficiently than Brownian motions in solution, and MAS NMR thus provides site-resolved pictures of structure and internal dynamics independently from the molecular size. In addition, crystallinity is not a prerequisite for obtaining resolved spectra with MAS NMR, making this technique particularly suitable to investigate precipitates of binary protein–protein or protein–DNA complexes, large modular molecular machines and periodic assemblies such as viral capsids.
In one of the first applications of this concept, sedimentation and 1H-detected NMR were employed to investigate the 20S proteasome degradation machinery of Thermoplasma acidophilum.354 The modular architecture of this particle followed the spectral fingerprint of the α-subunit (26 kDa) inside assemblies, whose size was progressively increased from 360 kDa to 1.1 MDa by the addition of β-subunit and 11S activator (Figure 56). Samples were perdeuterated, and only the α subunit was 13C- and 15N-labeled and sparsely protonated (∼20%) at amide sites. This approach allowed the extraction of secondary structure information and the observation of intersubunit contacts within the assembly.
Figure 56.
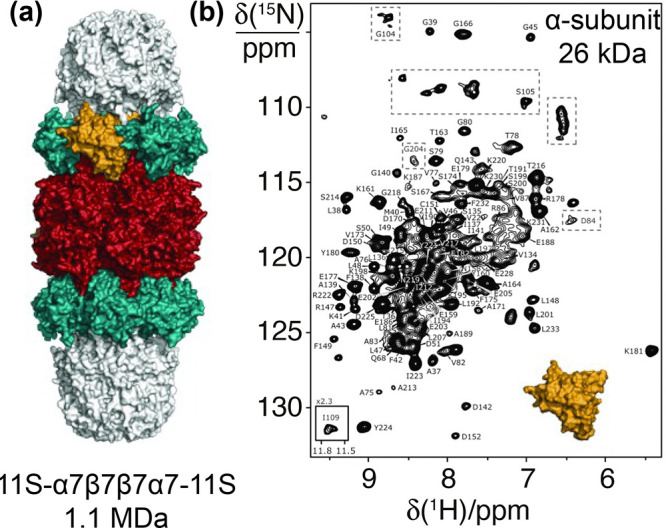
(a) Side view of the proteasome assembly of Thermoplasma acidophilum with its molecular weight. The heptameric rings of the α-, β-, and 11S-subunits are colored in green, red, and white, respectively. One α-subunit is highlighted in orange. (b) Resonance assignment of the proteasome α-subunit within the 1.1 MDa 11S-α7β7β7α7-11S complex. Reprinted with permission from ref (354). Copyright 2013 John Wiley & Sons.
At the same time, Reif’s group studied the human small heat-shock protein αB-crystallin in concentrated solutions by 1H-detected MAS NMR spectroscopy. αB is an ATP-independent chaperone that inhibits uncontrolled protein aggregation. A comparison between spectra of oligomeric αB and dimeric αB10m revealed the interaction sites between neighboring dimers in the oligomer. NMR was then used to study the interaction of αB with fibril-forming Alzheimer’s disease Aβ1–40 peptide and lysozyme.355
Faster MAS rates allowed the extension of this methodology to samples prepared with lower proton dilution. In another milestone work, Reif and co-workers identified residues of a 48 kDa trigger factor (TF) chaperone which are involved in binding to the ribosome. TF stabilizes nascent chains (NCs) emerging from the ribosomal tunnel and plays a crucial role in the cotranslational folding. The 2H,13C,15N-labeled ribosome binding domain of the trigger factor in complex with deuterated 50S ribosomal subunit was sedimented into a 1.3 mm NMR rotor. Well-resolved 15N–1H CP-HSQC spectra were obtained at a MAS frequency of 60 kHz, and the comparison with solution NMR spectroscopic data of free TF allowed the residues which are involved in binding to 50S subunit to be identified.356
In Pintacuda’s laboratory, the same procedure was applied to study weak and transient interactions in the bacterial replisome.357 Chemical shift and relaxation mapping were notably used for the structural and dynamical characterization of the transient association between two regions in a noncrystalline, 80 kDa protein assembly. This lead to a direct verification of a mechanism of regulation of E. coli DNA metabolism.
In another work from the same group, high-resolution 1H-detected NMR fingerprints were used to probe the degree of molecular order and flexibility of individual capsid proteins in both intact and trypsin-digested sedimented measles nucleocapsids.358 Later, Polenova and co-workers presented the first 1H-detected spectra of tubular assemblies of HIV-1 capsid protein. High-resolution 2D and 3D spectra permitted the assignment of many residues, but several stretches of residues were missing in the spectra due to exchange broadening at high temperature.58
Böckmann and co-workers expanded their work on hepatitis B virus capsids, previously studied by 13C-detected methods, with proton-detected solid-state NMR at 100 kHz MAS. The authors compared the completeness of assignments, discussed the use of protonated versus deuterated samples for this protein, and compared spectra recorded on the deuterated protein at 60 and 100 kHz.113
Lewandowski and co-workers employed this methodology with 100 kHz MAS to characterize the sedimented complex of a fully protonated GB1 with a full-length human immunoglobulin which has a molecular weight exceeding 300 kDa. Given the sensitivity boost provided by 1H detection, acquisition of spectra suitable for the quantitative analysis of the complex was feasible in a matter of minutes to hours using quantities as small as a few nanomoles.359
Protein–protein interactions not only induce structural changes but can also impact protein dynamics. In a follow-up study,299 these authors compared the backbone dynamics for protein GB1 in the crystalline form and the precipitated GB1–antibody complex. 15N R1 and R1ρ relaxation rate measurements were performed on a 100% proton back-exchanged 2H,13C,15N-labeled GB1 samples on a 850 MHz spectrometer and at 60 kHz MAS frequency, providing a picture of protein dynamics at time scales spanning 9 orders of magnitude. The data revealed that the crystal packing and protein–antibody interactions in the pure crystalline and IgG-bound forms mainly influence slow molecular motions in the microsecond–millisecond (>500 ns) range, which are more prevalent in the complex, whereas dynamics in the picosecond–nanosecond time scale were generally conserved.
More recently, the same authors used sedimentation and 100 kHz MAS NMR to map interaction surfaces and structural rearrangements in the 70 kDa complex between two nonribosomal peptide synthetase subunits responsible for chain release from the enacyloxin polyketide synthase, which binds an antibiotic with promising activity against the pathogen Acinetobacter baumannii.360
Recently, Schanda and co-workers presented new results on TET2. The 0.5 MDa aminopeptidase, a prototypical protease important for cellular homeostasis, degrades peptides within a ∼60 Å wide tetrahedral chamber with four lateral openings. MAS NMR revealed that a loop in the catalytic chamber is a key element for enzymatic function. REDOR and NERRD measurements on specifically methyl-labeled samples showed that the loop samples a wide conformational space within the cavity and is able to stabilize ligands in the active site, whereby a conserved histidine plays a key role. The data provided strong evidence for the functional importance of highly dynamic parts of enzymes and the potential of MAS NMR to investigate their dynamics at atomic resolution.361
Using the same model system, Schanda and co-workers demonstrated that 1H-detected fast MAS NMR combined with a tailored isotope labeling scheme can provide insight into central functional and structural role of aromatic residues. A particular difficulty in observing their resonances in large proteins is dynamics and limited spectral dispersion. In their unique study, the authors quantified the ring-flip motions in phenyloalanine residues as a function of temperature by MAS NMR measurements down to 100 K. Furthermore, 13C R1ρ relaxation–dispersion measurements were used to detect structural excursions occurring on a microsecond time scale in the entry pore to the catalytic chamber and at a trimer interface that was proposed as the exit pore.344
The influence of the environment on protein structures is of high relevance in the field of vaccines, where chemically coupled or cocrystallized adjuvants may alter the properties of antigens in pharmaceutical formulations. MAS NMR was recently applied to assess the structure of the influenza virus hemagglutinin antigen, both in its free form and chemically coupled to the surface of large (2.5 MDa) virus-like particles. The sensitivity boost provided by high magnetic fields and proton detection at fast MAS rates allowed the signal reduction associated with the antigen dilution in the formulation to be overcome. Comparison of the MAS NMR fingerprints between the free and coupled forms provided the structural evidence of the conservation of its native fold upon bioconjugation.362
Protein–DNA complexes were recently studied by Wiegand and co-workers. NMR experiments focusing on the detection of protein side-chains from lysine, arginine, and aromatic amino acids were employed to study an archaeal pRN1 primase-DNA complex and characterize protein–DNA contacts in the presence and absence of bound ATP molecules.363 In another work, DnaB helicase, an ATP-fueled catalyst responsible for the unwinding of DNA, was sedimented in complexes with nucleotides and single-stranded DNA. The transition state of ATP hydrolysis, which is part of the catalytic cycle, was captured and characterized by EPR and MAS NMR of different nuclei (31P, 19F, 27Al).
Figure 57 shows a 1H–31P correlation spectrum probing the protein–DNA interface. Furthermore, 1H-detected experiments at fast MAS allowed to access 1H chemical shifts, whose temperature dependence was used to determine the presence of H-bonds in the nucleotide binding site.364 The Carlomagno and Marchanka lab has pioneered various solid-state NMR applications for RNA, most commonly within the microcrystalline L7Ae box C/D RNA complex from Pyrococcus furiosus. First 1H-detected spectra of the complex were obtained using 20 kHz MAS and 90% deuteration. The protein–RNA interface was identified from a comparison of protonated and 2H-labeled RNA samples, based on the fact that in the protonated RNA sample, protein regions in close proximity to RNA protons show reduced signal intensities because of dipole-mediated line broadening.365 The first set of experiments developed at 100 kHz MAS were used to correlate resonances of close proximity and assign the intranucleotide correlations.59 These methods were recently extended by through-space connectivities to accomplish the rapid identification of RNA base pair patterns, assignment of all nucleobase spin systems, and the assignment of the base pairs to individual spin systems.366
Figure 57.
CP (H)PH correlation spectrum recorded on a sedimented complex of DnaB with ADP:AlF4– and DNA at 105 kHz MAS. Correlations between the phosphate groups and ADP or DNA are highlighted in green and light red/purple, respectively. Reproduced with permission from ref (364). Copyright 2021 Springer Nature.
10.2. Ligand, Drug, or Cofactor Binding
A few studies have employed 1H-detected solid-state NMR to characterize small molecule binding to various protein targets including a sedimented soluble protein and oligomeric complex, a crystalline globular enzyme and membrane proteins in lipids.
To design an allosteric modulator of the neonatal Fc receptor (FcRn)-immunoglobulin G interaction, 1H-detected solid-state NMR was used alongside X-ray crystallography to detect allosteric effects of compound binding.232 The authors recorded resolved proton-detected 2D and 3D spectra of a sedimented fully protonated 13C,15N-labeled extracellular domain of the neonatal Fc receptor (FcRnECD) at 850 MHz with 100 kHz MAS (Figure 58). Ligand-induced chemical shift perturbations were observed for residues in the binding pocket as well as for distant residues due to allosteric effects at the interface of the two receptor heterodimers present in the asymmetric unit, as well as potentially in the albumin interaction site. The study established a method to structurally characterize small molecule binding to nondeuterated large proteins by NMR, facilitating the detection of allosteric effects in support of structure-based drug design campaigns.
Figure 58.
(a) Soluble FcRnECD (42 kDa) was sedimented by ultracentrifugation directly into a 0.7 mm MAS NMR rotor. (b) CSPs upon UCB-FcRn-303 binding to FcRnECD as observed in 2D planes of 3D (H)CANH spectra with (black) and without (blue) the ligand. (c) CSPs are mapped on the FcRnECD diprotomer structure in complex with UCB-FcRn-303 (red). In (d), the FcRnECD crystal structure is shown in cartoon representation with β2m in green and dark gray and the α-chain molecules in blue and light gray. Reprinted with permission from ref (232). Copyright 2018 PLoS.
Using a similar approach and integrating a number of other biophysical techniques, Schanda and co-workers investigated the inhibition and activation of the drug target caseinolytic protease ClpP from Thermus thermophilus induced by bortezomib. The assembly forms a double-ring structure of a total molecular weight of 300 kDa, composed of 14 identical 21 kDa subunits. 4D 1H-detected MAS NMR spectra were employed to tackle the complexity of resonance assignments.367 Site-specific chemical shift perturbations and relaxation rates modulation contributed to unveil that the binding of this inhibitor promotes concerted allosteric conformational changes which stabilize the active state and therefore increase the catalytic activity.368
Linser and co-workers studied human carbonic anhydrase II in complex with acetazolamide at 111 kHz MAS. Ligand-binding-induced chemical shift perturbations were used as restraints to correctly position the ligand during structure calculation.271
Working on proteorhodopsin (PR), Lalli and co-workers detected cross-peaks between protein and the retinal cofactor (Figure 59). Such signals are valuable to establish the location, orientation, and configuration of the chromophore in the transmembrane region of the protein, which is directly related to the protein functionality. The detection of such signals was only possible in fully protonated samples with 100 kHz MAS, as hydrogen bonding and solvent inaccessibility severely limit reprotonation at labile amide sites and thus application of deuteration schemes in PR.228
Figure 59.
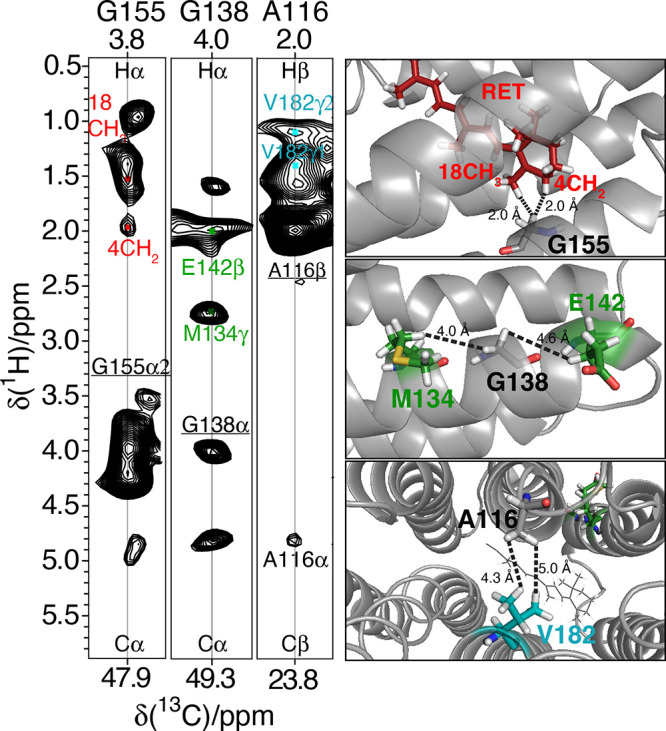
2D cross sections (left) of a 3D H(H)CH-RFDR spectrum acquired on U-[15N, 13C] proteorhodopsin in lipids at 100 kHz MAS at 305 K and 23.5 T, with 1H–1H correlations assigned to intra/interhelical and helix-retinal contact cofactor, as depicted in the schematic 3D structure of the protein (right). Reprinted from ref (228). Copyright 2017 American Chemical Society.
Andreas and Pintacuda’s group investigated β-barrel AlkL protein involved in the uptake of hydrophobic molecules by bacteria. Its long extracellular extensions facilitate compound crossing of the polysaccharide layer at the outer membrane. NMR measurements were used to detect structural variations and motional processes relevant to hydrophobic substrate permeation.60 High chemical shift perturbations highlighted significant changes in the barrel extension in the presence of either carvone and octane. The presence of substrate manifested also in R1ρ rates, an indicator of transient chemical shift changes and microsecond–millisecond motions.
10.3. Amyloid Fibrils
The use of 1H detection and fast MAS for the investigation of amyloid samples is not obvious because spectra of amyloids are known to be broad for a variety of reasons, such as sample purity and polymorphism. Proof-of-concept studies employed deuteration with partial reprotonation of the amide,157 Hα,192 or methyl sites369 in model amyloid preparations. These pioneering examples showed that also in these cases, despite a larger contribution of inhomogeneous broadening as compared to microcrystalline samples, 1H linewidths are sufficiently narrow to guarantee a significant spectral dispersion and non-negligible sensitivity enhancements as compared to the more traditional 13C-based strategies.
The first biologically relevant applications concerned the structural characterization of assembled hydrophobin rodlets249,370 and of β2-microglobulin fibrils249 and were developed on samples deuterated and 100% 1H back-exchanged at labile sites with 55–60 kHz MAS.
Hydrophobins are amphiphilic proteins secreted by filamentous fungi in a soluble form, which can self-assemble at hydrophilic/hydrophobic or water/air interfaces to form amphiphilic layers with a rodlet morphology.3701H–1H correlation spectra were acquired on EASΔ15 rodlets in order to elucidate the conformational changes that occur upon self-assembly. The spectra included proximity peaks that were expected based on the monomer structure as well as peaks that could not be explained by the monomer fold.249 These observations hinted to major structural rearrangements of the hydrophobin monomer upon rodlet assembly.
The D76N mutant of β-2 microglobulin (β2m) was reported to be responsible for an aggressive form of systemic amyloidosis with large fibrillar deposits in internal organs. 1H-detected correlation experiments were used on in vitro generated fibrils and established the important rearrangements of the monomer (β2m structure upon fibril formation and to characterize the tertiary/quaternary structure of the aggregate.234 Notably, a contact pattern between residues spaced in sequence by less than five residues was revealed, strongly indicative of a parallel, in register β-sheet intermolecular arrangement, where each residue faces its homologous residue in a neighboring molecule. Common structural and dynamical features are disclosed for both WT and D76N fibrils, but also differences in the fine details of the secondary structures. These findings support a picture where different aggregation pathways converge toward comparable fibril architectures.
More recently, a growing number of examples has illustrated the broader applicability of the technique on fully protonated amyloid samples. Linser and co-workers used 1H-detected solid-state NMR strategies to elucidate the determinants of polymorphism in fibrillar aggregates of Tau, one of the hallmarks of Alzheimer’s disease (Figure 60).63 In contrast to the general approach to characterize the most homogeneous preparations by construct truncation or intricate seeding protocols, the authors targeted nonseeded samples of the three-repeat-domain Tau3RD, and the modest requirements in terms of sample amounts were leveraged to fingerprint a large number of different preparations. Chemical shift assignments derived from 4D spectra showed that the paired helical filaments of the construct Tau3RD inherently exist as a heterogeneous ensemble of structures. However, while different geometries of H-bonding interactions were deduced for the N- and C-terminal regions, a strikingly low structural variability was observed for the hexapeptide motif in repeat R3, a crucial motif for fibril formation. These findings are an important step for understanding the processes of nucleation and fibril formation and for designing future pharmacological intervention.
Figure 60.
(a) Negative-stain electron microscopy images of heterogeneous paired helical filaments of protein Tau63 and (b) their assigned 1H,15N CP-HSQC spectrum showing significant inhomogeneous line broadening. (c,d) Pictorial interpretation of how the NMR shifts from invariant and variable residues may originate in the fibril building block: (c) secondary structure (β-strand or loop/kink, as derived from 13C secondary chemical shifts) is comparable among different batches of samples; however, 15N chemical shifts of many regions (“non-blue”) vary between different fibrils; (d) variability of the local chemical environment, including H-bond architecture, including shearing (top), twisting (middle), and bending of β-sheets (bottom). Reprinted from ref (63). Copyright 2017 American Chemical Society.
1H-detected solid-state NMR experiments were also used to investigate the possible modulation of α-synuclein amyloid structure by cyclophilin A (CypA) activity.371 The authors recorded (H)CANH and (H)CCH spectra at 800 MHz and 55 kHz MAS frequency of two 13C,15N-labeled α-synuclein fibril samples prepared in the absence and presence of a substoichiometric amount of CypA and compared the respective 2D N–Cα and C–C projections, which showed changes in position and intensity of some resonances. The structural differences could be mapped to the residues G41, S42, T59, G68, and T81, suggesting that CypA activity modulates the structure of α-synuclein fibrils at specific sites.
The advent of 0.7 mm MAS rotors that achieve νr = 110 kHz has increased the insight provided by 1H-detected NMR for this class of samples. Loquet and co-workers recently recorded 1H–1H restraints and used them for a full determination of the amyloid prion structure of HELLF, a distant homologue of the model prion HET-s, sharing only 17% sequence identity but a nearly identical β-solenoid fold (Figure 61). The authors engineered the HELL-F sequence to explore the limits of the sequence-to-fold conservation and to pinpoint determinants of cross-seeding and prion specificity. A designed protein from a HELL-F-based sequence was able to break the cross-seeding barrier in vivo between HELL-F and HET-s, unveiling determinants controlling cross-seeding at residue level. Chemical shifts obtained by solid-state NMR reporting on secondary structure elements were used to validate the structure conservation of HELL-F sequence variants.215
Figure 61.
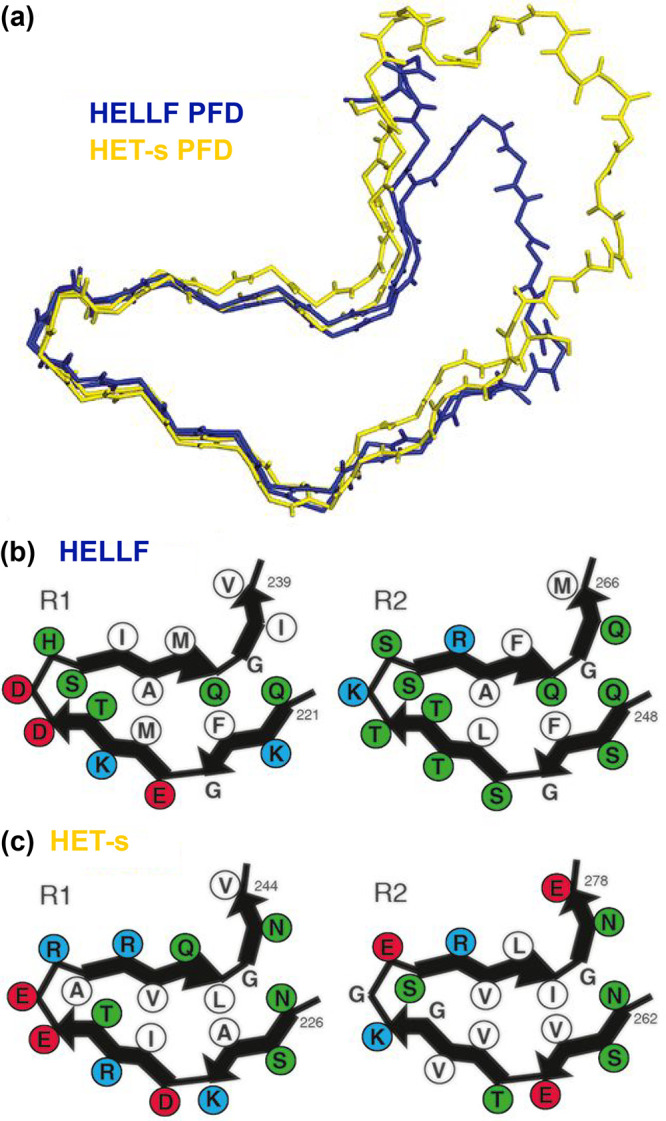
HELL-F(209–277) amyloid fold presents strong similarity with HET-s (218–289), while the two prion domains lack in vivo cross-seeding. (a) Backbone structural alignment of the MAS NMR structures of the HELL-F (in blue) and HET-s (in yellow) prion-forming domains. (b,c) Four cartoons representing the hydrophobic triangular core of amyloid fibrils formed by the successively stacked pseudorepeats—R1 (left) and R2 (right)—of HELL-F (b) and HET-s (c). Hydrophobic residues are shown in white, acidic residues in red, basic residues in blue, and others in green. Reprinted with permission from ref (215). Copyright 2021 National Academy of Sciences of the USA.
Griffin and co-workers recently expanded their ongoing work on in vitro preparations of Aβ42 fibrils to higher fields and fast MAS rates. Good spectral dispersion, limited overlap and most importantly very long coherence lifetimes allowed the assignment of backbone and side-chain signals (≃92% completeness) within the fibril core by the use of a small set of three-dimensional experiments, recorded within a few days on 0.5 mg of sample.61 In parallel, Ishii and co-workers explored the feasibility to characterize the structure of synthetic Aβ42 amyloids seeded with trace amounts of brain-extracted fibrils by 1H-detected solid-state NMR at 80–90 kHz MAS frequency.126 The comparison with unseeded fibrils revealed marked structural differences as manifested by different chemical shifts and peak doubling, indicating two or more different structures in the brain-derived sample. The authors also performed spectral assignments of a synthetic fully protonated 13C,15N-labeled Aβ42 fibril by 1H-detected 3D and 4D experiments. Identification of locations of secondary structural elements from the chemical shifts clearly indicated that the examined Aβ42 fibril is a new polymorph with a different structure from those reported previously.
10.4. Solvent and Lipid Accessibility
Protein–water and protein–lipid interactions are important factors for a mechanistic understanding of protein function as they play key roles in stabilization of particular structural (and functional) states of the protein.
In an early application of 1H-detected NMR with proton dilution by deuteration, Reif and co-workers engineered a conceptually clever experiment to quantify equilibrium protein backbone hydrogen–deuterium exchange rates in microcrystalline SH3. The experiments relied on a 15N-detected HETCOR experiment in which a mixing period was introduced after the 1H,15N CP step and made use of the deuterium isotope effect that splits the amide nitrogen line if the time required for exchange is shorter than the individual 15N longitudinal relaxation times.372 Later on, Linser and co-workers measured nonequilibrium backbone amide exchange rates in the same protein by tracking the reduction of 15N–1H peak intensities upon exchange of a supernatant buffer with D2O. H/D exchange could be directly determined for hydrogen-bonded amides using 1H detection under fast MAS. These changes were shown to be related to site-specific hydrogen bond strength and are likely to reflect water accessibility in a qualitative manner.373
Ladizhansky and co-workers have exploited the fact that extensive hydrophobic transmembrane regions are shielded by the lipid bilayers to study the solvent-exposed regions of PR. The protein was produced in fully deuterated medium and protons reintroduced to solvent-accessible sites through exchange with a 40% H2O/D2O mixture. Only the residues susceptible to H/D exchange were observed by 1H-detected spectroscopy. Beside those located at the membrane interface, most of the observed resonances clustered within a particular transmembrane helix. This result was used to prove transient exposition of a hydrophilic cavity in the extracellular half of the protein, an aspect related to proton conduction.100
In another recent example, incomplete H/D exchange in the transmembrane region was used as a tool for improved 1H resolution of water-inaccessible protein regions (Figure 62a). Incubation in D2O of the K+ channel KcsA led to the complete disappearance of the water-exposed residues, with a substantial enhancement in spectral quality at 60 kHz MAS. Additionally, the D2O wash removed any residual dipolar couplings to water protons from large internal water-filled cavities and buried water molecules, further narrowing the 1H linewidths.374
Figure 62.
Measurement of site-specific proximity to mobile small molecules, water, lipids, and cholesterol. (a) Water-exposed residues in KcsA are highlighted based on a (H)NH spectrum after the sample is washed in acidic buffer. Proximity to water was recorded in the same study via H(H)N and H(H)CC spectra. Reprinted from ref (374). Copyright 2014 American Chemical Society. (b) Selected strips from a 4D H(H)(N)CANH spectrum highlighting cross-peaks to water and lipid moieties. Reprinted with permission from ref (375). Copyright 2019 John Wiley & Sons. Panel (c) shows cholesterol docked to the structure of VDAC, in agreement with the measured proximity to nearby residues as determined by transfer from the protons of cholesterol in a H(H)NH spectrum. Adjacent hydrophobic side-chains that form grooves on the outside of the protein are labeled. Reprinted with permission from ref (376). Copyright 2021 Springer Nature. (d) Sites of water exposure are mapped onto the structure of GLPG, based on a H(H)NH spectrum, shown in red. Reproduced from ref (230). Copyright 2019 American Chemical Society.
1H-detected solid-state NMR with fast MAS can also be used to determine directly the exposure of proteins to lipids and water site-specifically, as demonstrated by Andreas and co-workers on two membrane proteins, the human voltage dependent anion channel VDAC and the alkane transporter AlkL from Pseudomonas putida (Figure 62b). Using 55 kHz MAS, high magnetic field, and sample deuteration to reduce spin-diffusion, the authors measured longitudinal magnetization transfer from lipids to protein amide sites selectively in the membrane spanning region.375 The same method was later used to investigate interactions of α-synuclein fibrils with negatively charged phospholipids. The authors identified two lipid-binding domains at both the N- and C-terminal parts of the fibril core. In combination with other data from solution and 13C-detected solid-state NMR experiments, this allowed establishing the mechanism of α-synuclein folding on lipid membranes.377 In the case of VDAC, the comparison of spectra acquired on samples reconstituted in DMPC-only, DMPC with cholesterol, and near-native lipids established that the protein structure remains unchanged in different membrane compositions and to locate cholesterol on the outside of the β-barrel (Figure 62c).376 A similar approach was used by Lange and co-workers to confirm the presence of water molecules in the catalytic cavity in the bacterial intramembrane protease GlpG (Figure 62d).374
Solvent accessibility can also be monitored indirectly by the addition of a paramagnetic relaxation agent, CuEDTA or Gd(DTPA-BMA), which induces site-specific 1H T1 relaxation enhancements of the NMR signals of the protein backbone HN close to the surface. Reif and co-workers showed that this technique (“solvent paramagnetic relaxation enhancement”, solvent PRE),378,379 today popular in solution NMR, can be adapted to solid samples using perdeuteration (which abolishes spin-diffusion and thus provides a clear picture of the specific sites accessible to the paramagnetic agent).380 While a variant of this approach can be designed using 15N T1 relaxation enhancements under slow MAS,381 recently, Lewandowski and co-workers demonstrated that the method can be implemented on fully protonated samples using 1H T1 enhancements under very fast MAS conditions which sufficiently slow down spin-diffusion among protons. The method was again benchmarked on the GB1 complex with immunoglobulin G. From the knowledge of the 3D structure of the protein, the water accessibility of the amide protons (and thus the relaxation enhancement) was calculated based on a monomeric model. Deviations between experimental and calculated values indicated protection of certain residues in the complex, and therefore provide a way to identify the interaction surface.382
A slightly different strategy was recently employed by Jirasko and co-workers who used Gd3+-loaded molecular cages chelated to lipid headgroups to map the interaction interface of NS5A with the lipid membrane. Nonstructural protein 5A (NS5A) from the hepatitis C virus is a membrane-associated protein involved in multiple steps of the viral life cycle and a target for antivirals. PRE effects revealed a clear pattern and classified regions according to their distance from the lipid membrane (Figure 63). It is noteworthy that the authors used cell-free expression and a combinatorial labeling strategy to obtain resonance assignments of NS5A.109
Figure 63.
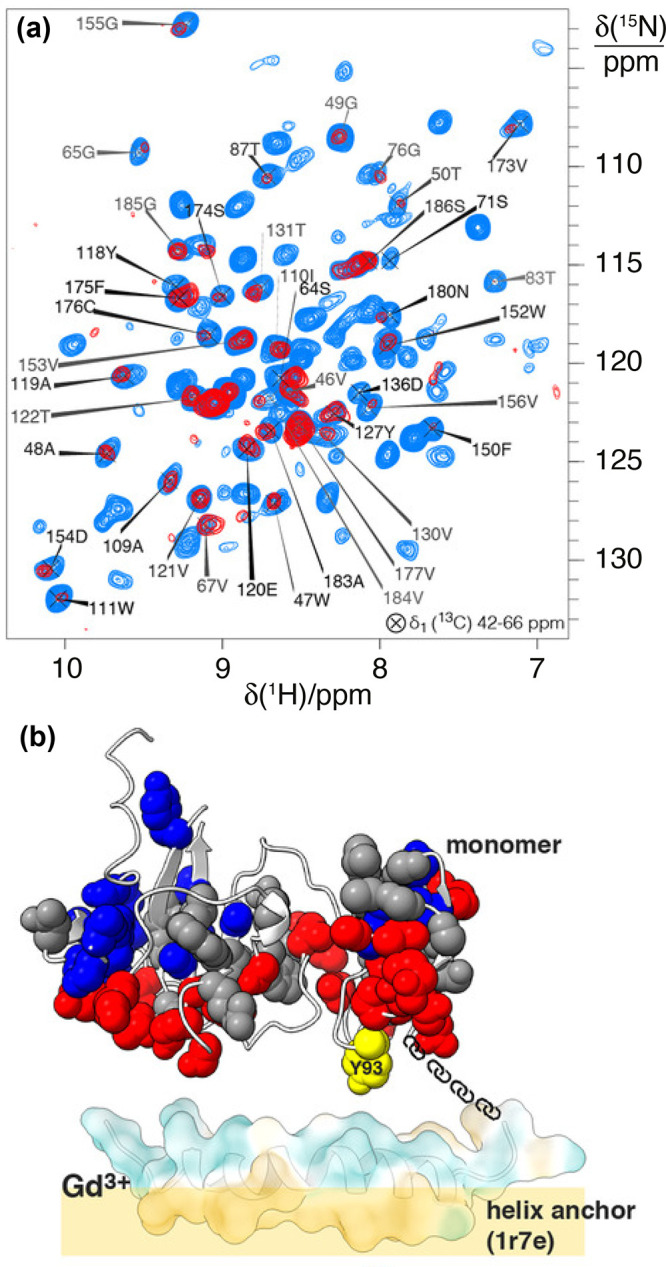
(a) Overlaid 2D 15N–1H projections of 3D (H)CANH spectrum of the NS5A-AHD1 protein in the presence of Lu3+-DPPE (blue) or Gd3+-DPPE lipids (red) mixed with PC/Chol lipids. (b) Membrane orientation of NS5A-AHD1. PREs are color-coded on the homology models based on X-ray structure of D1 and HA. Blue-gray-red qualification shows increasing PRE. Reprinted with permission from ref (109). Copyright 2021 John Wiley & Sons.
10.5. Protein NMR Crystallography
Crystals and microcrystals have been extensively used as model systems for the development of biomolecular MAS NMR, because the high homogeneity of crystalline preparations guarantees high spectral resolution. Despite the higher order present in these preparations, a growing body of evidence indicates protein functional dynamics are conserved in hydrated crystals.383,384 As we saw in section 9, NMR with fast MAS can access these phenomena over a range of time scales, which is even larger than its solution counterpart as MAS NMR measurements are not affected by molecular tumbling. Moreover, in the case of proteins containing a transition metal ion, NMR is a direct probe of the most interesting aspects of metallic activity which are linked to the electronic structure at the active site, and which can only be inferred indirectly from the coordinates of the constituent atoms in diffraction studies.
Microcrystals have developed therefore today into an ideal platform for the biophysical characterization of protein geometries, multi-timescale dynamic processes, electronic structures and reactivity by 1H-detected solid-state NMR. In recent applications, the investigation of proteins in microcrystalline preparations has shed new unforeseen light on the activity of enzymes and on the unfolding properties of pathologic mutants.
SOD is a metalloenzyme (Cu, Zn-SOD) involved in the regulation of cellular oxidative stress. While Cu depletion does not have a significant effect on the protein fold, we were able to show that it acts as a control element of internal dynamics. In particular, Cu acts as a switch, selectively promoting or deactivating motions over multiple time scales. The combined characterization of backbone and Cu-coordinating side-chain motions revealed a coupling between the active site and remote backbone regions pivotal for SOD stability and efficient enzymatic activity.335
Human carbonic anhydrase is another well-known enzyme for which numerous crystal structures are available. An extended MAS NMR investigation of dynamics of the 29 kDa carbonic anhydrase/acetazolamide complex by Linser’s group revealed a that fast picosecond–nanosecond motions are not prominent in the active site of the enzyme, but instead processes of conformational exchange in the microsecond range are active.203 These motions are important for enzyme activity, as confirmed by their abrogation in the presence of the inhibitor acetazolamide.271 Importantly, a dynamic role of the solvent in catalysis was revealed by the presence of exchange on the same time scale for water molecules in the active site (Figure 64).339 These observations provided overall a more comprehensive picture of hCAII catalysis with respect to the one captured by X-ray structures only.
Figure 64.
(a) Representation of conformational dynamics in hCAII. The protein backbone is represented as a cylinder, where thickness and color (gray to red) highlight areas undergoing microsecond conformational exchange in the active site loop, assessed by 15N relaxation–dispersion experiments. (b–e) Effect of ligand binding on the exchange motions of hCAII sensed by T198 backbone and N67 side-chain 15N spin. The top row shows the free form, whereas the bottom row shows the dorzolamide-bound form. Reprinted with permission from ref (339) (copyright 2019 American Chemical Society) and from ref (27) (copyright 2021 Elsevier).
More recently, Linser, Mueller and co-workers extended the approach to access to the active-site chemistry in the 2 × 72 kDa enzyme tryptophan synthase (665 amino acids per asymmetric unit). Chemical-shift assignments were obtained for 498 residues (74.8% of the total), enabling downstream atom-specific characterization of chemical and motional properties of large portions of the enzyme, including residues important for the catalytic turnover. In particular, in combination with first-principles calculations, the analysis of the chemical shifts in the β-subunit active site suggested a connection between active-site chemistry, the electrostatic environment, and catalytically important dynamics of the region protecting the β-subunit from solution.204
If the catalytic center of a metalloprotein is a paramagnetic metal ion, the peak position and intensity in NMR spectra are altered by various effects that depend on the nature of the metal. These paramagnetic effects are highly sensitive reporters on the protein and the electronic structure of the metal center and can be exploited as structural restraints, or to study the catalytic mechanism of the protein. For example, SOD coordinates a Cu ion either in Cu+ (diamagnetic) or Cu2+ (paramagnetic) form, and a second metal ion, which can be (diamagnetic) Zn2+ or (paramagnetic) Co2+. When it is prepared without Cu at one site, and Co2+ instead of Zn2+ at the second site (Co-SOD), the situation changes drastically. As discussed in section 8, long-range PREs and PCSs were employed as structural constraints for the determination of the protein structure.
Cu2+ and Co2+ additionally induce Fermi contact shifts to the coordinating Histidine residues along with an extreme reduction in T1 relaxation times, which results in the disappearance from NMR spectra of the resonances from all the nuclei within ∼5 Å from the metals. More recently, the combination of 100 kHz MAS with tailored radio frequency irradiation schemes obtained data from the “blind sphere” of Co-SOD. Fermi contacts shifts are proportional to the electron spin densities delocalized onto the nuclei and are extremely sensitive to the fine details of the coordination geometry at the metal center. By comparing the experimental paramagnetic NMR effects to those obtained with first-principles quantum chemical calculations, it was possible to refine a high-resolution structure of the metal coordination sphere with picometer precision in the bond lengths and 1° resolution in the bond angles around the metal center. The coordination geometry of the resulting structure was shown to be precise enough to explain the nonreactive nature of the CoII/ZnII centers (Figure 65).385
Figure 65.
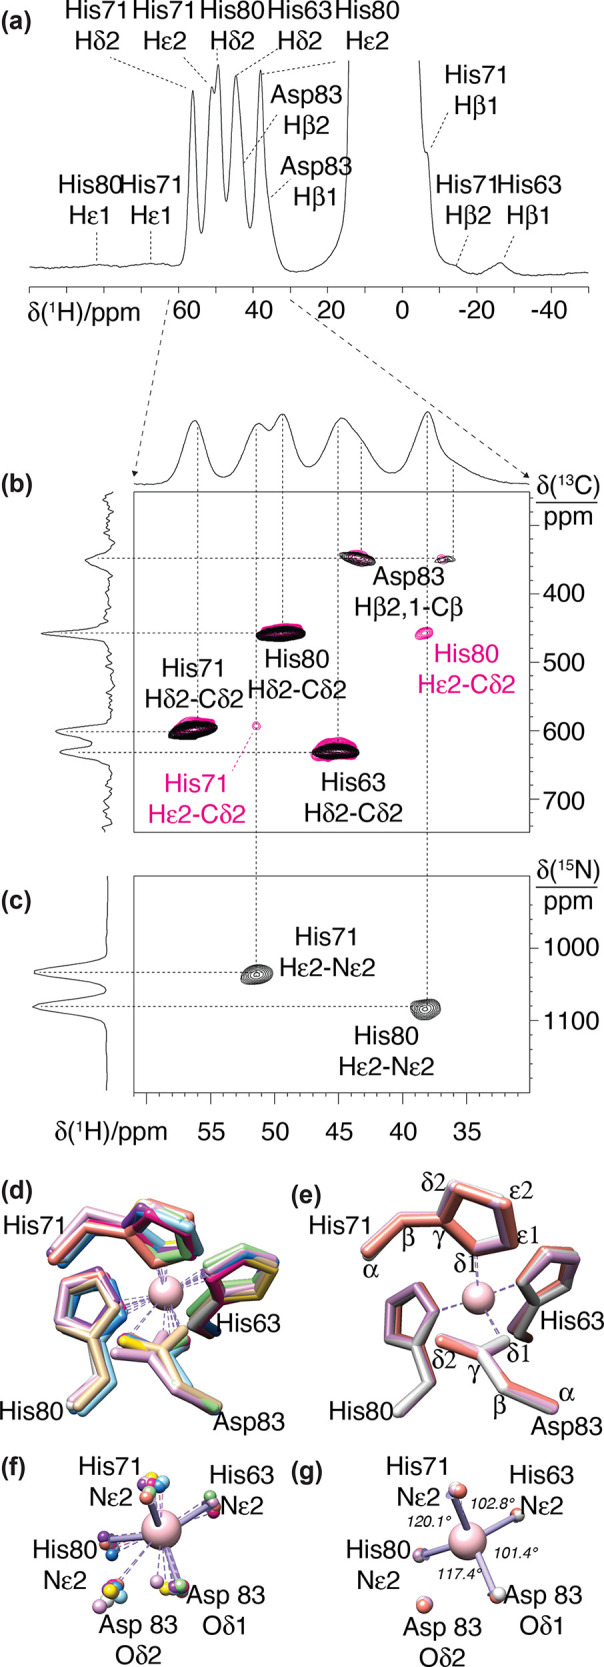
NMR spectra of Co-SOD acquired at 100 kHz MAS on a 500 MHz spectrometer. (a) 1H spectrum (1D spin–echo), (b,c) 2D 1H, 13C, and 1H, 15N TEDOR correlation spectra, acquired without (black) and with (magenta) spin magnetization exchange between 1H nuclei close in space. (d) Overlay of Zn2+ site in 10 protein chains of the single-crystal X-ray structure of SOD 1, illustrating the crystallographic uncertainty in the metal coordination geometry and (e) NMR ensemble of structures of the Co2+ complex of Co-SOD. Schematic representation of the metal site (f) in the X-ray diffraction ensemble and (g) in the NMR ensemble. Reprinted from ref (385). Copyright 2020 American Chemical Society.
In parallel, the high-potential iron–sulfur protein I from Ectothiorhodospira halophila (HiPIP) was characterized in a microcrystalline preparation. In HiPIP, a cubane Fe4S4 cluster is coordinated by the side-chains of four cysteine residues. NMR spectra recorded with 60 kHz MAS contained contact shifted resonances, up to 100 ppm in the 1H case and up to 400 ppm for 13C. The large chemical shift dispersion and sensitivity of paramagnetic NMR to local geometry captured distinct signatures from the two conformations present in the asymmetric unit.386
Another intriguing property of microcrystalline preparations is the fact that, when it comes to aggregation-prone proteins, the crystal lattice preserves the native conformation. Coupled to MAS NMR, this provides a perfect platform for the investigation of protein folding and misfolding. These concepts were exploited to explain the aggressive aggregation propensity of the pathological mutant D76N of β-2 microglobulin involved in systemic amyloidosis. A comparative study of the intrinsic dynamics of WT and mutant protein in microcrystals revealed in D76N the existence of exchange with a less structured high-energy state. These data provide a molecular explanation for the reactivity of the pathological mutant at the earliest steps of fibrillization.234,387
In hydrated microcrystalline solids, beside internal local dynamics, proteins conserve collective motions, either in the form of small-amplitude overall reorientation or as other anisotropic motions that are likely to be pertinent to function. Following the first demonstration experiment by Emsley and co-workers,325 Schanda and co-workers used 1H-detected MAS NMR to study the three crystal forms of ubiquitin and observed multiple sets of resonances for some of the preparations. This peak multiplicity was in good agreement with the number of nonequivalent molecules in the asymmetric unit of the crystals. Relaxation experiments revealed the overall rocking motion in the different crystal preparations with possible correlation times of 0.1–100 μs. The amplitude of rocking varies from one crystal form to another and is correlated with the resolution obtainable in X-ray diffraction experiments.309 In a follow-up study, Schanda’s group revealed that the crystalline environment affects motions on slower time scales. In particular the crystal lattice affects both the amplitude and time scale of the protein collective motion.334
10.6. Protonation States
A critical aspect to consider in the investigation of protein behavior is the protonation state of the residues which have a role in protein function. With 1H-detected NMR, this aspect is directly accessible from the 1H chemical shifts and its changes can be easily monitored at variable pH.
This strategy was used to determine the protonation state of side-chains exposed in the conductive channel of the influenza M2 protein, which elucidated the proton conduction mechanism.388 Later, Andreas and co-workers studied hydrogen bonding between histidine side-chains in the apo and drug (rimantadine)-bound states of influenza A M2 tetramer at a pH of 7.8.389 An imidazole–imidazole 2HJNN coupling was measured on a fully protonated sample in lipid bilayers with 100 kHz MAS using a homonuclear J-transfer period on the nitrogen channel. The observed J coupling of 8.9 ± 0.3 Hz agreed with the value of 8.1 Hz 2HJNN coupling extracted from 1D 15N-detected spin–echo spectra for the more challenging sample condition of pH 6.2.390 No 2HJNN coupling could be detected in the drug-bound state (Figure 66a), indicating that rimantadine affects the structure of the M2 channel at the pH sensing residue H37.
Figure 66.
Revealing hydrogen bonding and protonation states. (a) N–H···N hydrogen bond is detected through measurement of a 2HJNN coupling (blue and green) for H37 of Influenza A M2. In black and red, this hydrogen bond is broken upon addition of the inhibitor rimantadine. Reproduced from ref (389). Copyright 2020 American Chemical Society. (b) Long-range CP transfers were used in the NH spectra to identify tautomer states of histidine, as well as a hydroxyl proton hydrogen bonded to a histidine side-chain nitrogen. These histidine residues are at the heart of active chemistry in carbonic anhydrase. Reprinted with permission from ref (271). Copyright 2019 John Wiley & Sons. (c) Low- and high-temperature spectra were used to identify the chemical shift of a water proton hydrogen-bonded to a histidine side-chain nitrogen in the M2 protein from Influenza A. Reproduced with permission from ref (391). Copyright 2021 John Wiley & Sons. (d) Selective TEDOR sequence was used to identify tautomer states in the C-terminal domain of the HIV capsid protein with SP1 using fractional deuteration. Reprinted with permission from ref (392). Copyright 2021 Frontiers Media SA.
In the case of crystalline human carbonic anhydrase II, 1H-detected NMR determined the protonation state for the core histidine side-chains which play a role in the enzyme catalysis function and could not be seen by X-ray crystallography (Figure 66b). Here, the protonation states were not influenced by ligand binding.271
Figure 66c shows the determination of water as another hydrogen bonding partner in M2. The measurement of a bound water chemical shift at 11 ppm at both ambient and cryogenic temperatures was complemented by density functional theory calculations. Figure 66d shows a spectral editing technique based on selective inversion of characteristic nitrogen frequency ranges associated with either protonated or deprotonated imidazole nitrogen resonances. The method was applied to both a model system (the amino acid histidine), as well as HIV-1 capsid protein, in order to determine the tautomeric state(s) of histidine residues.
Protonation states were also in the focus in a work by Oschkinat and co-workers. The protonation dynamics of the active site of bacteriorhodopsin was monitored by 1H chemical shift exchange experiments and revealed slow oscillatory motions of protons in the dark state. Such protonation dynamics is thought to be disrupted in the light-activated states, thus promoting the functional proton pumping.393
10.7. Transport Mechanisms
In cells, very few molecules enter or leave without the intervention of membrane proteins. Even the transport of small molecules which can diffuse across lipid bilayers is often accelerated by dedicated transport proteins. The investigation of structure and dynamic properties of these systems in a close-to-native environment is the key to understand the molecular basis for their function.
The advantages associated to 1H detection and fast MAS in spin relaxation studies of membrane proteins have been first applied to the precise determination of collective wobbling motions of individual helices in the seven-helical transmembrane protein, anabaena sensory rhodopsin (ASR)337 and of the β-barrel of the outer membrane protein A from K. pneumoniae (KpOmpA) in lipids.338
Following these studies, 1H-detected techniques have provided a deeper understanding of gating mechanisms in different classes of transporters. A notable example is the alkane transporter AlkL, a minimalistic outer membrane protein from oil-consuming bacteria.60 The complete 1H-detected MAS NMR structure determination of AlkL in lipid bilayers was combined with spin relaxation measurements and MD simulations, as well as with the determination of structure in micelles. These techniques revealed the fundamental role of lipid environment to stabilize functional extracellular loops. Site specific 15N relaxation rates and chemical shift perturbations, corroborated by MD simulations, highlighted functional dynamics in a region which appeared to be a lateral exit pore for alkane substrates. Overall, this work solved a controversy on the mechanism of permeation of the outer membrane of bacteria by hydrophobic molecules. Intriguingly, it also elucidated the subtle balance between the rigidity necessary to confine substrates at the pore entrance and the plasticity required for lateral exit toward the hydrophobic portion of the outer membrane.
Among the proteins involved in molecular transports, channels catalyze movement of specific ions down their electrochemical gradient. In particular K+ channels have been for many years interesting targets for MAS NMR investigations which can explore the conformational equilibria associated with their gating mechanism with a great level of spatial and temporal detail. For example, dynamics in the KcsA selectivity filter was revisited with comprehensive approach based on 1H detection by the Weingarth group. Using MAS at 60 kHz and deuterated KcsA, 15N R1ρ relaxation rates of the transmembrane region were measured site-specifically revealing for the first time the presence of slow collective nanosecond–microsecond motions in the selectivity filter, a feature connected to the gating mechanism.101 The investigation was brightly extended in a recent study, which elucidated the molecular determinants for modal gating switches. By rapidly scanning chemical shifts and relaxation properties of the wild type protein and of three mutants mimicking different naturally occurring gating states the authors revealed that the variations in conformational dynamics of the filter have a key role in promoting the modal gating (Figure 67).231
Figure 67.
(a) 15N rotating-frame ssNMR relaxation rates (R1ρ) that report on slow molecular motions in wild-type (WT) KcsA and mutants E71A, E71I, and E71Q; signal decay curves are shown for selected filter residues. The illustrations show the site-resolved selectivity filter dynamics. The size of the spheres corresponds to the R1ρ relaxation rates. (b) 2D 1H–15N spectra of E71A in protonated (red) and deuterated (gray) buffers showing the fast exchange of Y78, together with illustrations of the NMR-derived water cavity size in WT KcsA and mutants. Reprinted with permission from ref (231). Copyright 2019 Springer Nature.
Another fundamental ion involved in many biological processes is the divalent cation Mg2+. Due to the physicochemical characteristics of the ion, its transport is particularly difficult to predict and is still largely under debate. The major uptake system of Mg2+ in prokaryotes is CorA, a large pentameric divalent cation channel. Thanks to the first investigations of T. maritima CorA by 1H MAS NMR at 100 kHz MAS, site-specific information was gathered on backbone dynamics, which gave access to the description of conformational equilibria of the system. Combining NMR spectra with Small Angle Neutron Scattering data and MD simulations, previous structure-based models of transport regulation have been extended. In particular, the new findings support the presence of conformational equilibria between multiple states, regulated by variations in backbone dynamics induced by Mg2+ release.224
Rhomboid proteases are transmembrane proteins that hydrolyze substrate peptide bonds within a lipid bilayer. Crystal structures of these membrane-embedded enzymes suggest the existence of “open” and “closed” conformations, largely differing in the relative position of the lateral transmembrane helix TM5. However, the functional role of such large displacement remained ambiguous. In a recent work by Lange and co-workers, microsecond conformational exchanges were investigated in GlpC reconstituted in lipid bilayers. The presence of a well-defined conformation was observed to be promoted by the lipid environment with respect to detergent. However, 15N R1ρ relaxation–dispersion experiments revealed the presence of conformational changes in the orders of tens of microseconds in TM5, explaining the role of this region in the gating processes and proving the existence of equilibria between closed and open states.230
10.8. In-Membrane and Cell Wall Investigations
Cellular membranes are much more complex than reconstituted lipid bilayers in terms of the lipid and protein composition, and this can influence membrane protein function. Solid-state NMR can be used to analyze membrane proteins directly in E. coli membrane extract.394 However, adequate spectral quality is a challenge in cellular NMR studies owing to the low concentration of the target protein. Since many cellular components such as lipids and carbohydrates do not contain nitrogen, acquisition of 2D 1H–15N spectra offers a sensitive option to observe mainly the overexpressed protein in membrane extracts. Weingarth and co-workers showed a well-resolved spectrum of KcsA and were able to annotate the spectrum based on the in vitro assignments.101
In a different study Baldus and co-workers compared reconstituted membrane protein insertase YiDC with a membrane extract of YidC-expressing cells.395 Although the spectra agreed in many places, there were significant differences between the native and reconstituted samples. Changes in signal intensities and chemical shifts showed clearly that backbone dynamics and protein structure are sensitive to the environment and that solid-state NMR can be an avenue to understand membrane proteins in their native context. The Baldus group also recently published a detailed protocol on all aspects of sample preparation for studying a sample in whole cells, in cell envelopes or isolated membrane preparations.396
Weingarth and co-workers applied solid-state NMR to study nisin, the preeminent lantibiotic, binding to lipid II, directly in native bacterial membranes. The bacterial peptidoglycan precursor lipid II is a promising target for new antibiotics. The MAS NMR data conclusively showed that the conformation of lipid II-bound nisin is drastically different in membranes compared to the complex in DMSO in solution. De novo MAS NMR assignments demonstrated that the membrane environment markedly modulates the nisin:lipid II complex structure (Figure 68), which is because nisin forms a pore complex with lipid II in membranes, as opposed to a closed pore state in DMSO.397
Figure 68.
Lipid II–nisin complex in cellular membranes. (a) Comparison of 1H-detected 2D 1H–15N spectra of lipid II-bound nisin in native M. flavus membranes (magenta) and in DOPC (cyan). The gray spectrum shows nisin nonspecifically bound to DOPG/DOPC liposomes (7:3 ratio) in the absence of lipid II. (b) Membrane arrangement of the nisin/lipid II topology as seen by MAS NMR. Plastic residues that are required to adapt to the bacterial target membrane are highlighted with red circles. Residues that showed 1H/2H exchange are colored in blue and align the pore lumen. The C-terminus is dynamically disordered and resides at the water–membrane interface. Reprinted with permission from ref (397). Copyright 2018 Springer Nature.
The bacterial cell wall is composed of the peptidoglycan, a large polymer that maintains the integrity of the bacterial cell. Due to its multigigadalton size, heterogeneity, and dynamics, atomic-resolution studies are inherently complex. Using 100 kHz magic-angle spinning NMR, Bougault and co-workers showed that intact bacterial peptidoglycan yields highly resolved 1H-detected correlation spectra. Despite the very small amount of sample used (0.5 mg), it was possible to obtain site-specific resonance assignments and information about spatial proximities. 1H–1H correlation experiments demonstrated the feasibility to study cell walls of bacterial strains without isotopic enrichment through the use of minimal media, which are often incompatible with culture growth.398
10.9. Studies at Natural Abundance
Fast MAS and proton detection open an avenue to investigate peptides, proteins, and other biosolids from natural or synthetic sources without the need of expensive isotopic labeling. Multidimensional correlation spectra exploiting the natural isotopic abundance can be used as powerful reporters of folding, dynamics and interactions.
Already in 2009, Rienstra and co-workers mapped structural differences between lyophilized and fibrillar insulin samples using natural abundance 1H–15N correlation spectra with 40 kHz MAS.399 More recently, the Weingarth lab analyzed hydrogel-forming peptides with 60 kHz MAS and succeeded in assigning most resonances in a 2D 1H–13C spectrum and in determining structural and dynamical differences between preparations.400
With faster MAS rates, homonuclear 1H–1H correlations can be acquired at high resolution and serve as a sensitive detection window. 1H–1H through-space proximities were thus inferred between water and collagen in a bone sample spinning at 110 kHz MAS, demonstrating a new avenue to investigate such complex architectures.401 By acquiring 1H DQ–1H SQ spectra, Nishiyama and co-workers were able to identify the intermolecular packing of alanine peptides in microcrystalline preparations352 or to characterize pharmaceutical formulations.402 In these studies, the addition of a 14N dimension was instrumental to increase resolution and to assign the 1H resonances.
The same group developed 3D 1H SQ–1H DQ–1H SQ experiments to reveal 1H–1H proximities at high resolution at 100 kHz MAS.403 In combination with 2D 1H–13C experiments, this module was exploited to investigate the powder structure of a pharmaceutically relevant organic molecule consisting 51 carbon atoms at natural abundance.404 This experimental setup required 147 h on a 16.4 T spectrometer (1H 700 MHz), mainly due to the very long 1H T1 in this sample, requiring an interscan delay of 10 s.
The impact of this latter obstacle is mitigated in protein studies, where, due to substantial local dynamics, 1H T1 relaxation times are remarkably shorter (usually 0.5–1 s) and can be further reduced by paramagnetic doping. This directly translates to increased sensitivity and brings unlabeled protein samples within reach. Figure 69 shows the Hα–Cα region of a 2D 1H–13C spectrum of microcrystalline GB1 recorded in 8 h in our lab at 100 kHz MAS on a 23.5 T spectrometer. Considering the availability of higher fields and even faster MAS nowadays, high-resolution fingerprinting at 13C natural abundance should be possible also for proteins of higher complexity and would detect changes in structure and dynamics between different sample preparations or upon ligand binding.
Figure 69.
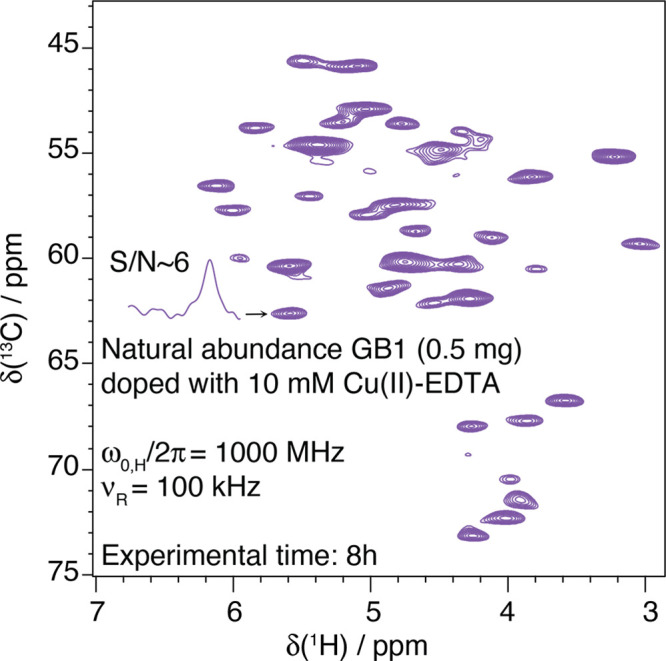
Region of α-resonances of 1H–13C CP-HSQC spectrum recorded on a sample of microcrystalline protein GB1 at natural abundance (implying also no deuteration), in a 0.7 mm rotor spun at 100 kHz on a 23.5 T spectrometer. Microcrystals were doped (impregnated) with paramagnetic Cu(II) ions to increase scan recycling and thus boost sensitivity. Note that no heteronuclear decoupling was needed during acquisition, and that 13C lines are free from homonuclear scalar couplings.
11. Outlook
We reviewed the advances in 1H-detected MAS NMR of approximately the last two decades, which have seen the technique progress from proof-of-principle studies of peptides and small crystalline proteins to tackle a wide range of applications. The steady progress over this time has been punctuated by the introduction of transformational instrumentation, such as ultrafast spinning probes, and ultra-high-field magnets. We have detailed how these capabilities led to a reexamination of acquisition and processing protocols, with the most striking transformation occurring for proton-detected methods, which these days allow atomic resolution investigation of structural dynamics, interactions, and tertiary/quaternary structure, for proteins up to several tens of kDa in size both as monomers and as oligomers. Recently introduced fast MAS probes for dynamic nuclear polarization NMR allow the combination of signal enhancement by DNP and 1H detection,405 demonstrating the possibility to employ it for the analysis of samples with extreme spin dilution.
Naturally, other techniques have also progressed within this time, such that the structural biologist has a better toolbox than ever before with which questions of molecular function and dysfunction are addressed with atomic resolution. For example, fibril structure determination, which is orthogonal to diffraction techniques, can now be performed by cryo-electron microscopy as well as MAS NMR. Yet important oligomeric species in the fibrillization cascade are still too small for single particle analysis, remaining a mainstay of MAS NMR. In addition, AlphaFold is now openly accessible,406 giving the structural biologist a new starting point for investigation of structure, function, dynamics, etc., as it can often infer the “ground-state” structure based on bioinformatics.
It is particularly interesting to anticipate how MAS NMR will dovetail with these other techniques in order to paint a rich picture of precise structure, dynamics and interaction. While global structure will often be filled in by cryo-EM or even AlphaFold, we expect that the access to atomic resolution chemical structure information as well as more flexible protein regions will remain uniquely accessible by NMR. These more plastic and chemically active protein regions are clearly at the heart of many biological processes whose function MAS NMR can reveal. Generally, understanding of functional mechanisms will increasingly require the combination of several experimental and computational techniques, in particular, for emerging research areas such as in-cell or in-membrane NMR, or interactions among complex samples containing small molecules, lipopolysaccharides, peptidoglycans, or misfolded protein states. 1H-detected solid-state NMR spectroscopy is now ready to provide atomic-scale structural, dynamical, and chemical information on a multitude of different systems and to play a major role in the growing field of integrated structural biology.
Acknowledgments
This review is the result of very productive exchanges which started almost a decade ago in Lyon, where all the authors have worked together, and has continued over the past few years, once most of them have established their research groups across Europe. We would like to say thanks to Lyndon Emsley (Lyon, then EPFL) and Anne Lesage (Lyon) for the continuous support and precious advice all along this period and the former and present CRMN lab members who have, year after year, taken part to this research area: Emeline Barbet-Massin, Alessandro Marchetti, Michael Knight, Amy Webber, Stefan Jehle, Hugh Dannatt, David Gajan, Lénaïc Leroux, Diane Cala-De Paëpe, Andrea Bertarello, Kevin Sanders, Andrea Pica, Dylan Foucaudeau, Claire Ollier, Giacomo Casale, Jan Blahut, Ladislav Benda, Arthur Lejeune, Adrian Draney, Judith Schlagnitweit, Loïc Salmon, Bénédicte Elena-Herrmann and Torsten Herrmann. We also acknowledge Werner Maas, Frank Engelke, Sebastian Wegner, Jochem Struppe, Wolfgang Bermel, E̅riks Kupče, Armin Purea, Benno Knot, Venita Decker, Alexander Krahn, Robert Schneider, Nicolas Mathieu, Fabien Aussenac, Eric Leonardis, and Alain Belguise at Bruker Biospin for the strong partnership which has kept the instrumentation in the laboratory at the forefront. The transformation of 1H-detected solid-state NMR with fast MAS and ultrahigh fields into a mature technique for biomolecular determinations has been the result of continuous exchanges, discussions and collaborations within a large community of scientists. Among those in close contact with our laboratories, we would like to mention Bob Griffin (MIT), Tatyana Polenova (Delaware), Hartmut Oschkinat (FMP Berlin), Ivano Bertini, Roberta Pierattelli, Isabella Felli, Claudio Luchinat, Moreno Lelli, Enrico Ravera, and Giacomo Parigi (Florence), Chad Rienstra (Wisconsin), Rob Tycko (NIH), Yoshitaka Ishii (Tokyo), Yusuke Nishiyama (RIKEN/JEOL), Ayyalusamy Ramamoorthy (U Michigan), Rasmus Linser (TU Dortmund), Bernd Reif (TU Munich), Chris Jaroniec (Ohio State), Brad Chmelka (UCSB), Markus Weingarth, and Marc Baldus (Utrecht), Beat Meier, Matthias Ernst, Alexander Barnes, and Peter Güntert (ETH), Anja Böckmann, Carole Gardiennet, and Lauriane Lecoq (Lyon), Ago Samoson (Tallin), Kurt Zilm (Yale), Vlad Ladizhansky (Guelph), Len Mueller (Riverside), Rachel Martin (Irvine), Vipin Agarwal and PK Madhu (Hyderabad), Józef R. Lewandowski and Steven Brown (Warwick), Amir Goldburt (Tel Aviv), Malene Ringkjøbing Jensen and Martin Blackledge (IBS Grenoble), Henry Orton and Gottfried Otting (Canberra), Nicholas Dixon (Wollongong), Kaspars Tars (Riga), Joseph R. Sachleben (Chicago), Henrike Heise (U Düsseldorf), Kendra Fredericks (Dallas), Kong Ooi Tang (ENS Paris), Delia Picone (Naples), Benjamin Bardiaux (Pasteur), Andy Nieuwkoop (Rutgers), Ümit Akbey (Nijmegen and Pittsburgh), Stan Opella (UCSD), Francesca Marassi (Sanford Burnham Prebys), Sebastian Hiller (Basel), Paul Schanda (Vienna), Adam Lange (Berlin), Antoine Loquet and Birgit Habenstein (Bordeaux), Teresa Carlomagno (Birmingham), Alexander Marchanka (Hannover), Göran Karlsson (Göteborg), Ann McDermott (Columbia), Mei Hong (MIT), and Tim Cross (Florida State). Special thanks to Rasmus Linser, Bernd Reif and, Chad Rienstra for sharing the coordinates of their first structures determined with 1H-detected MAS NMR and reported in Figure 46, and to Frank Engelke, Ago Samoson, and Mario Incitti for sharing with us the technical probe specifications reported in Table 1. The development of biomolecular 1H-detected NMR in Lyon has been funded over the past few years by the European Research Council (ERC) under the European Union’s Horizon 2020 research and innovation programme (ERC-2015-CoG GA 648974 to G.P.), by the European Union’s FP7 research and innovation programme (FP7-PEOPLE-2012-ITN GA 317127 to G.P.), by joint research activities and transnational access within the consortia (Infrastructure for NMR, EM, and X-rays for Translational Research, GA 653706) and iNext Discovery (Structural biology for Translational Research and Discovery, GA 871037), by the Institut de Chimie de Lyon (FR3023) and by the CNRS (IR-RMN-THC FR3050 and Infranalytics FR2054). The computational resources for the simulations reported in this work were provided by the Polish Infrastructure for Supporting Computational Science in the European Research Space (PLGRID, grant ID: plgnmrsi2). J.S. and P.P. are supported by the Polish National Agency for Academic Exchange in the framework of Polish Return programme (Contract No. PPN/PPO/2018/1/00098). K.J. is supported by Latvian Council of Science Grant No. lzp-2019/1-0244. L.B.A.’s research group is supported by the Deutsche Forschungsgemeinschaft (DFG, German Research Foundation) through the Emmy Noether Program (Grant AN1316/1-1) and project A04 of the SFB 803.
Biographies
Tanguy Le Marchand received his Ph.D. in Chemistry at the Ecole Normale Supérieure de Lyon (ENS Lyon) under the supervision of Guido Pintacuda. He was a postdoctoral fellow at the Gothenburg University with Göran Karlsson and Gunnar C. Hansson. Since 2018 he is a research engineer of the French National Center for Scientific Research (CNRS) at the high-field NMR center in Lyon (CRMN), France. His research is focused on developments and applications of fast MAS NMR for biomolecules.
Tobias Schubeis studied chemical biology at Technical University in Dortmund (Germany) and completed his doctoral work at the Helmholtz Center for Infection Research in Braunschweig (Germany) on the structural biology of functional amyloid biogenesis. He received his Ph.D. from Technical University in Braunschweig in 2013. He was then a MSCA fellow within the ITN on paramagnetic NMR, working at Giotto Biotech in Florence (Italy). Since 2015 he has been a postdoctoral fellow in the group of Guido Pintacuda at the CRMN in Lyon. His research interests are NMR based structural biology, protein dynamics and interactions as well as NMR method development for fast magic-angle spinning.
Marta Bonaccorsi received her Ph.D. in Chemistry from the Ecole Normale Supérieure de Lyon (France) in 2020, under the supervision of Guido Pintacuda. She developed and applied methods in 1H-detected MAS NMR for the investigation of dynamics in complex biomolecules, such as metalloenzymes and membrane proteins. Currently, she is a postdoctoral researcher at the Department of Biochemistry and Biophysics at Stockholm University and at the Science for Life Laboratory, Sweden with Dr. David Drew and Prof. Lucie Delemotte. Her research work focuses on the investigation of conformational dynamics of a sugar transporter by a combination of experimental methods and MD simulations.
Piotr Paluch graduated from Łódź University of Technology with M.Sc. in chemistry in 2011. He received his Ph.D. at Center of Molecular and Macromolecular Studies of Polish Academy of Science (CBMM PAS) in Łódź in 2017. In his thesis, supervised by prof. M.J. Potrzebowski, he proposed new solid-state NMR methods for inverse detection of insensitive nuclei and quantification of protein dynamics. For his postdoctoral fellowship (2018-19) he joined the group of prof. O. Lafon at Lille University, where he developed novel solid-state NMR methods for detection of nuclei experiencing large anisotropic interactions. Since mid-2019 he has been a postdoctoral fellow in J. Stanek’s group at University of Warsaw and Assistant Professor at CBMM PAS in Łódź. His primary scientific interests are development of new solid-state NMR methods for structural studies of active pharmaceutical ingredients, biomolecules and new materials of industrial importance.
Daniela Lalli received her Ph.D. in Chemical Science from the University of Florence in 2011, where she employed solution and solid-state NMR techniques to study high molecular weight paramagnetic metalloproteins in the group of Prof. Ivano Bertini at the Center of Magnetic Resonance. She took a 4-year postdoctoral fellowship in the team of Guido Pintacuda at the CRMN in Lyon, where she performed research on membrane proteins in their native and artificial membrane environments by magic-angle spinning solid-state NMR. Currently, she is Assistant Professor at the University of Eastern Piedmont where her research focuses on the structural and dynamic characterization of biomolecules and more recently, on the development of paramagnetic complexes as MRI contrast agents.
Andrew J. Pell received his B.A., M.Sc. (2005) and Ph.D. (2009) degrees in chemistry from the University of Cambridge. At Cambridge, he worked for Dr James Keeler on the development of what afterwards become known as pure shift NMR. He then spent four years (2009-2013) as a postdoctoral fellow at the CRMN Lyon with Prof. Lyndon Emsley and Dr Guido Pintacuda, where he developed new methods in solid-state NMR, with a particular focus on paramagnetic systems. He returned to Cambridge for a second postdoctoral position (2014-2016) with Prof. Clare P. Grey, where he worked on applying solid-state NMR to paramagnetic battery materials. He joined Stockholm University as Assistant Professor in 2016 and was promoted to Associate Professor in 2020. In 2021, he was appointed a Full Professor of Chemistry at the ENS Lyon and CRMN. He develops new solid-state NMR methods for studying materials, and applies them to materials with a wide range of a applications, such as in energy storage, solid-state lighting, and with exotic topological properties.
Loren Andreas was first introduced to solid-state NMR by Manish Mehta as an undergraduate student at Oberlin College. He received his Ph.D. degree from the Massachusetts Institute of Technology, USA, in 2014 under the supervision of Prof. Robert G. Griffin. He then moved to Lyon, France, where he worked as a Marie Skłodowska-Curie Postdoctoral fellow in the group of Guido Pintacuda at the CRMN. Since 2016, he has led an Emmy Noether research group in solid-state NMR at the Max Planck Institute for Biophysical Chemistry, where he is focused on revealing the structure of membrane proteins and mis-folded proteins in complex with small molecules.
Kristaps Jaudzems received his Ph.D. in chemistry from the Riga Technical University, having spent two years at the Scripps Research Institute as an external graduate student. Subsequently, he was senior researcher at the Latvian Institute of Organic Synthesis (LIOS). From 2015 to 2017 he was a Marie Skłodowska-Curie fellow at the CRMN in Lyon. Since 2017, he has been group leader at LIOS and professor at the University of Latvia. His work focuses on NMR-based structural biology and biophysical techniques for drug discovery.
Jan Stanek received his Ph.D. degree in Chemistry from University of Warsaw (Poland) in 2015. He received EMBO long-term and Marie Skłodowska-Curie postdoctoral fellowships to conduct research in CRMN in Lyon under supervision of G. Pintacuda. In 2018 he was awarded a return grant from Polish Agency for Academic Exchange and was appointed a permanent research associate position at Faculty of Chemistry of University of Warsaw. His main scientific interest are method development for ultrafast MAS, automated analysis, and novel approaches for data acquisition.
Guido Pintacuda studied Chemistry at the Scuola Normale Superiore in Pisa, where he graduated in 1997, and then completed his Ph.D. in 2002 under the direction of Prs. Lorenzo Di Bari and Piero Salvadori. After working at the Karolinska Institute in Stockholm and at the Australian National University in Canberra with Prof. Gottfried Otting, he moved to Lyon, where he first became a CNRS Researcher in 2005 with Prof. Lyndon Emsley, and in 2009 a Research Director. Since 2018, he is the head of the Lyon High-Field NMR center, where he leads a research team on the development of new methods and applications in biomolecular solid-state NMR. He has been Principal Investigator in several projects funded by French national and European agencies, coordinated an Initial Training Network, and in 2015 he was awarded an ERC consolidator grant on “Structure of paramagnetic integral membrane metalloproteins by MAS-NMR”.
The authors declare no competing financial interest.
References
- Hologne M.; Chevelkov V.; Reif B. Deuterated Peptides and Proteins in MAS Solid-State NMR. Prog. Nucl. Magn. Reson. Spectrosc. 2006, 48, 211–232. 10.1016/j.pnmrs.2006.05.004. [DOI] [Google Scholar]
- Reif B. In Protein NMR Techniques; Shekhtman A., Burz D. S., Eds.; Humana Press: Totowa, NJ, 2012; pp 279–301. [Google Scholar]
- Reif B. Ultra-High Resolution in MAS Solid-State NMR of Perdeuterated Proteins: Implications for Structure and Dynamics. J. Magn. Reson. 2012, 216, 1–12. 10.1016/j.jmr.2011.12.017. [DOI] [PubMed] [Google Scholar]
- Asami S.; Reif B. Proton-Detected Solid-State NMR Spectroscopy at Aliphatic Sites: Application to Crystalline Systems. Acc. Chem. Res. 2013, 46, 2089–2097. 10.1021/ar400063y. [DOI] [PubMed] [Google Scholar]
- Demers J.-P.; Chevelkov V.; Lange A. Progress in Correlation Spectroscopy at Ultra-Fast Magic-Angle Spinning: Basic Building Blocks and Complex Experiments for the Study of Protein Structure and Dynamics. Solid State Nucl. Magn. Reson. 2011, 40, 101–113. 10.1016/j.ssnmr.2011.07.002. [DOI] [PubMed] [Google Scholar]
- Knight M. J.; Felli I. C.; Pierattelli R.; Emsley L.; Pintacuda G. Magic Angle Spinning NMR of Paramagnetic Proteins. Acc. Chem. Res. 2013, 46, 2108–2116. 10.1021/ar300349y. [DOI] [PubMed] [Google Scholar]
- Su Y.; Andreas L.; Griffin R. G. Magic Angle Spinning NMR of Proteins: High-Frequency Dynamic Nuclear Polarization and 1H Detection. Annu. Rev. Biochem. 2015, 84, 465–497. 10.1146/annurev-biochem-060614-034206. [DOI] [PubMed] [Google Scholar]
- Andreas L. B.; Le Marchand T.; Jaudzems K.; Pintacuda G. High-Resolution Proton-Detected NMR of Proteins at Very Fast MAS. J. Magn. Reson. 2015, 253, 36–49. 10.1016/j.jmr.2015.01.003. [DOI] [PubMed] [Google Scholar]
- Böckmann A.; Ernst M.; Meier B. H. Spinning Proteins, the Faster, the Better?. J. Magn. Reson. 2015, 253, 71–79. 10.1016/j.jmr.2015.01.012. [DOI] [PubMed] [Google Scholar]
- Vasa S. K.; Rovó P.; Linser R. Protons as Versatile Reporters in Solid-State NMR Spectroscopy. Acc. Chem. Res. 2018, 51, 1386–1395. 10.1021/acs.accounts.8b00055. [DOI] [PubMed] [Google Scholar]
- Ishii Y.; Wickramasinghe A.; Matsuda I.; Endo Y.; Ishii Y.; Nishiyama Y.; Nemoto T.; Kamihara T. Progress in Proton-Detected Solid-State NMR (SSNMR): Super-Fast 2D SSNMR Collection for Nano-Mole-Scale Proteins. J. Magn. Reson. 2018, 286, 99–109. 10.1016/j.jmr.2017.11.011. [DOI] [PMC free article] [PubMed] [Google Scholar]
- Schubeis T.; Le Marchand T.; Andreas L. B.; Pintacuda G. 1H Magic-Angle Spinning NMR Evolves as a Powerful New Tool for Membrane Proteins. J. Magn. Reson. 2018, 287, 140–152. 10.1016/j.jmr.2017.11.014. [DOI] [PubMed] [Google Scholar]
- Xue K.; Movellan K. T.; Zhang X. C.; Najbauer E. E.; Forster M. C.; Becker S.; Andreas L. B. Towards a Native Environment: Structure and Function of Membrane Proteins in Lipid Bilayers by NMR. Chem. Sci. 2021, 12, 14332–14342. 10.1039/D1SC02813H. [DOI] [PMC free article] [PubMed] [Google Scholar]
- Mandala V. S.; Hong M. High-Sensitivity Protein Solid-State NMR Spectroscopy. Curr. Opin. Struct. Biol. 2019, 58, 183–190. 10.1016/j.sbi.2019.03.027. [DOI] [PMC free article] [PubMed] [Google Scholar]
- Nishiyama Y. Fast Magic-Angle Sample Spinning Solid-State NMR at 60–100kHz For Natural Abundance Samples. Solid State Nucl. Magn. Reson. 2016, 78, 24–36. 10.1016/j.ssnmr.2016.06.002. [DOI] [PubMed] [Google Scholar]
- Samoson A. H-MAS. J. Magn. Reson. 2019, 306, 167–172. 10.1016/j.jmr.2019.07.010. [DOI] [PubMed] [Google Scholar]
- Loquet A.; El Mammeri N.; Stanek J.; Berbon M.; Bardiaux B.; Pintacuda G.; Habenstein B. 3D Structure Determination of Amyloid Fibrils Using Solid-State NMR Spectroscopy. Methods 2018, 138, 26–38. 10.1016/j.ymeth.2018.03.014. [DOI] [PubMed] [Google Scholar]
- Kraus J.; Sarkar S.; Quinn C. M.; Polenova T. Solid-State NMR Spectroscopy of Microcrystalline Proteins 2021, 102, 81–151. 10.1016/bs.arnmr.2020.10.002. [DOI] [Google Scholar]
- Porat-Dahlerbruch G.; Goldbourt A.; Polenova T. Virus Structures and Dynamics by Magic-Angle Spinning NMR. Annu. Rev. of Virol. 2021, 8, 219–237. 10.1146/annurev-virology-011921-064653. [DOI] [PMC free article] [PubMed] [Google Scholar]
- Lecoq L.; Fogeron M.-L.; Meier B. H.; Nassal M.; Böckmann A. Solid-State NMR for Studying the Structure and Dynamics of Viral Assemblies. Viruses 2020, 12, 1069. 10.3390/v12101069. [DOI] [PMC free article] [PubMed] [Google Scholar]
- Pell A. J.; Pintacuda G.; Grey C. P. Paramagnetic NMR in Solution and the Solid State. Prog. Nucl. Magn. Reson. Spectrosc. 2019, 111, 1–271. 10.1016/j.pnmrs.2018.05.001. [DOI] [PubMed] [Google Scholar]
- Krushelnitsky A.; Reichert D.; Saalwächter K. Solid-State NMR Approaches to Internal Dynamics of Proteins: From Picoseconds to Microseconds and Seconds. Acc. Chem. Res. 2013, 46, 2028–2036. 10.1021/ar300292p. [DOI] [PubMed] [Google Scholar]
- Lewandowski J. R. Advances in Solid-State Relaxation Methodology for Probing Site-Specific Protein Dynamics. Acc. Chem. Res. 2013, 46, 2018–2027. 10.1021/ar300334g. [DOI] [PubMed] [Google Scholar]
- Linser R.; Sarkar R.; Krushelnitzky A.; Mainz A.; Reif B. Dynamics in the Solid-State: Perspectives for the Investigation of Amyloid Aggregates, Membrane Proteins and Soluble Protein Complexes. J. Biomol. NMR 2014, 59, 1–14. 10.1007/s10858-014-9822-6. [DOI] [PubMed] [Google Scholar]
- Schanda P.; Ernst M. Studying Dynamics by Magic-Angle Spinning Solid-State NMR Spectroscopy: Principles and Applications to Biomolecules. Prog. Nucl. Magn. Reson. Spectrosc. 2016, 96, 1–46. 10.1016/j.pnmrs.2016.02.001. [DOI] [PMC free article] [PubMed] [Google Scholar]
- Rovó P. Recent Advances in Solid-State Relaxation Dispersion Techniques. Solid State Nucl. Magn. Reson. 2020, 108, 101665. 10.1016/j.ssnmr.2020.101665. [DOI] [PubMed] [Google Scholar]
- Bonaccorsi M.; Le Marchand T.; Pintacuda G. Protein Structural Dynamics by Magic-Angle Spinning NMR. Curr. Opin. Struct. Biol. 2021, 70, 34–43. 10.1016/j.sbi.2021.02.008. [DOI] [PubMed] [Google Scholar]
- Reif B.; Ashbrook S. E.; Emsley L.; Hong M. Solid-State NMR Spectroscopy. Nat. Rev. Methods Primers 2021, 1, 2. 10.1038/s43586-020-00002-1. [DOI] [PMC free article] [PubMed] [Google Scholar]
- Maricq M. M.; Waugh J. S. NMR in Rotating Solids. J. Chem. Phys. 1979, 70, 3300–3316. 10.1063/1.437915. [DOI] [Google Scholar]
- Andrew E. R.; Bradbury A.; Eades R. G. Removal of Dipolar Broadening of Nuclear Magnetic Resonance Spectra of Solids by Specimen Rotation. Nature 1959, 183, 1802–1803. 10.1038/1831802a0. [DOI] [Google Scholar]
- Wangsness R. K.; Bloch F. The Dynamical Theory of Nuclear Induction. Phys. Rev. 1953, 89, 728–739. 10.1103/PhysRev.89.728. [DOI] [Google Scholar]
- Redfield A. G. On the Theory of Relaxation Processes. IBM J. Res. Dev. 1957, 1, 19–31. 10.1147/rd.11.0019. [DOI] [Google Scholar]
- Bengs C.; Levitt M. H. A Master Equation for Spin Systems Far From Equilibrium. J. Magn. Reson. 2020, 310, 106645. 10.1016/j.jmr.2019.106645. [DOI] [PubMed] [Google Scholar]
- Lipari G.; Szabo A. Model-Free Approach to the Interpretation of Nuclear Magnetic Resonance Relaxation in Macromolecules. 1. Theory and Range of Validity. J. Am. Chem. Soc. 1982, 104, 4546–4559. 10.1021/ja00381a009. [DOI] [Google Scholar]
- Lipari G.; Szabo A. Model-Free Approach to the Interpretation of Nuclear Magnetic Resonance Relaxation in Macromolecules. 2. Analysis of Experimental Results. J. Am. Chem. Soc. 1982, 104, 4559–4570. 10.1021/ja00381a010. [DOI] [Google Scholar]
- Abragam A.Principles of Nuclear Magnetism; Oxford University Press: Oxford, 1961. [Google Scholar]
- Haeberlen U.; Waugh J. S. Spin-Lattice Relaxation in Periodically Perturbed Systems. Phys. Rev. 1969, 185, 420–429. 10.1103/PhysRev.185.420. [DOI] [Google Scholar]
- Ma P.; Haller J. D.; Zajakala J.; Macek P.; Sivertsen A. C.; Willbold D.; Boisbouvier J.; Schanda P. Probing Transient Conformational States of Proteins by Solid-State R1ρ Relaxation-Dispersion NMR Spectroscopy. Angew. Chem., Int. Ed. 2014, 53, 4312–4317. 10.1002/anie.201311275. [DOI] [PMC free article] [PubMed] [Google Scholar]
- Palmer A. G. NMR Characterization of the Dynamics of Biomacromolecules. Chem. Rev. 2004, 104, 3623–3640. 10.1021/cr030413t. [DOI] [PubMed] [Google Scholar]
- Tollinger M.; Sivertsen A. C.; Meier B. H.; Ernst M.; Schanda P. Site-Resolved Measurement of Microsecond-to-Millisecond Conformational-Exchange Processes in Proteins by Solid-State NMR Spectroscopy. J. Am. Chem. Soc. 2012, 134, 14800–14807. 10.1021/ja303591y. [DOI] [PMC free article] [PubMed] [Google Scholar]
- Haeberlen U.; Waugh J. S. Coherent Averaging Effects in Magnetic Resonance. Phys. Rev. 1968, 175, 453–467. 10.1103/PhysRev.175.453. [DOI] [Google Scholar]
- Mehring M.Principles of High-Resolution NMR in Solids; Springer Verlag: Berlin, 1983. [Google Scholar]
- Van Vleck J. H. The Dipolar Broadening of Magnetic Resonance Lines in Crystals. Phys. Rev. 1948, 74, 1168–1183. 10.1103/PhysRev.74.1168. [DOI] [Google Scholar]
- Zorin V. E.; Brown S. P.; Hodgkinson P. Origins of Linewidth in 1H Magic-Angle Spinning NMR. J. Chem. Phys. 2006, 125, 144508. 10.1063/1.2357602. [DOI] [PubMed] [Google Scholar]
- Brunner E. Limitations of Resolution in the 1H Magic-Angle-Spinning Nuclear Magnetic Resonance Spectroscopy of Zeolites. J. Chem. Soc. Faraday Trans. 1990, 86, 3957–3960. 10.1039/ft9908603957. [DOI] [Google Scholar]
- Brunner E.; Freude D.; Gerstein B. C.; Pfeifer H. Residual linewidths of NMR spectra of spin-1/2 systems under magic-angle spinning. J. Magn. Reson. 1990, 90, 90–99. 10.1016/0022-2364(90)90367-I. [DOI] [Google Scholar]
- Brunner E. Limitations of Resolution in the 1H Magic-Angle-Spinning Nuclear Magnetic Resonance Spectroscopy of Zeolite. Further Results. J. Chem. Soc. Faraday Trans. 1993, 89, 165–169. 10.1039/ft9938900165. [DOI] [Google Scholar]
- Schnell I.; Spiess H. W. High-Resolution 1H NMR Spectroscopy in the Solid State: Very Fast Sample Rotation and Multiple-Quantum Coherences. J. Magn. Reson. 2001, 151, 153–227. 10.1006/jmre.2001.2336. [DOI] [PubMed] [Google Scholar]
- Andrew E. R.; Bradbury A.; Eades R. G. Nuclear Magnetic Resonance Spectra from a Crystal rotated at High Speed. Nature 1958, 182, 1659. 10.1038/1821659a0. [DOI] [Google Scholar]
- Penzel S.; Oss A.; Org M.-L.; Samoson A.; Böckmann A.; Ernst M.; Meier B. H. Spinning Faster: Protein NMR at MAS Frequencies Up to 126 kHz. J. Biomol. NMR 2019, 73, 19–29. 10.1007/s10858-018-0219-9. [DOI] [PMC free article] [PubMed] [Google Scholar]
- Drain L. E. The Broadening of Magnetic Resonance Lines Due to Field Inhomogeneities in Powdered Samples. Proc. Phys. Soc. 1962, 80, 1380–1382. 10.1088/0370-1328/80/6/119. [DOI] [Google Scholar]
- Vanderhart D.L; Earl W. L; Garroway A.N Resolution in 13C NMR of Organic Solids Using High-Power Proton Decoupling and Magic-Angle Sample Spinning. J. Magn. Reson. 1981, 44, 361–401. 10.1016/0022-2364(81)90178-5. [DOI] [Google Scholar]
- Alla M.; Lippmaa E. Resolution Limits in Magic-Angle Rotation NMR Spectra of Polycrystalline Solids. Chem. Phys. Lett. 1982, 87, 30–33. 10.1016/0009-2614(82)83547-1. [DOI] [Google Scholar]
- Zhou D. H.; Shah G.; Cormos M.; Mullen C.; Sandoz D.; Rienstra C. M. Proton-Detected Solid-State NMR Spectroscopy of Fully Protonated Proteins at 40 kHz Magic-Angle Spinning. J. Am. Chem. Soc. 2007, 129, 11791–11801. 10.1021/ja073462m. [DOI] [PubMed] [Google Scholar]
- Lamley J. M.; Lougher M. J.; Sass H. J.; Rogowski M.; Grzesiek S.; Lewandowski J. R. Unraveling the Complexity of Protein Backbone Dynamics With Combined 13C and 15N Solid-State NMR Relaxation Measurements. Phys. Chem. Chem. Phys. 2015, 17, 21997–22008. 10.1039/C5CP03484A. [DOI] [PubMed] [Google Scholar]
- Sternberg U.; Witter R.; Kuprov I.; Lamley J. M.; Oss A.; Lewandowski J. R.; Samoson A. 1H Line Width Dependence on MAS Speed in Solid State NMR - Comparison of Experiment and Simulation. J. Magn. Reson. 2018, 291, 32–39. 10.1016/j.jmr.2018.04.003. [DOI] [PubMed] [Google Scholar]
- Schubeis T.; Stanek J.; Pintacuda G. Backbone Assignment of Crystalline E. Coli Maltose Binding Protein. Biomol. NMR Assign. 2021, 15, 317–322. 10.1007/s12104-021-10023-w. [DOI] [PubMed] [Google Scholar]
- Struppe J.; Quinn C. M.; Lu M.; Wang M.; Hou G.; Lu X.; Kraus J.; Andreas L. B.; Stanek J.; Lalli D.; et al. Expanding the Horizons for Structural Analysis of Fully Protonated Protein Assemblies by NMR Spectroscopy at MAS Frequencies Above 100 kHz. Solid State Nucl. Magn. Reson. 2017, 87, 117–125. 10.1016/j.ssnmr.2017.07.001. [DOI] [PMC free article] [PubMed] [Google Scholar]
- Marchanka A.; Stanek J.; Pintacuda G.; Carlomagno T. Rapid Access to RNA Resonances by Proton-Detected Solid-State NMR at > 100 kHz MAS. Chem. Commun. 2018, 54, 8972–8975. 10.1039/C8CC04437F. [DOI] [PMC free article] [PubMed] [Google Scholar]
- Schubeis T.; Le Marchand T.; Daday C.; Kopec W.; Tekwani Movellan K.; Stanek J.; Schwarzer T. S.; Castiglione K.; de Groot B. L.; Pintacuda G.; et al. A β-Barrel for Oil Transport Through Lipid Membranes: Dynamic NMR Structures of AlkL. Proc. Natl. Acad. Sci. U.S.A. 2020, 117, 21014–21021. 10.1073/pnas.2002598117. [DOI] [PMC free article] [PubMed] [Google Scholar]
- Bahri S.; Silvers R.; Michael B.; Jaudzems K.; Lalli D.; Casano G.; Ouari O.; Lesage A.; Pintacuda G.; Linse S.; et al. 1H Detection and Dynamic Nuclear Polarization-enhanced NMR of Aβ1–42 Fibrils. Proc. Natl. Acad. Sci. U.S.A. 2022, 119, e2114413119 10.1073/pnas.2114413119. [DOI] [PMC free article] [PubMed] [Google Scholar]
- Stanek J.; Andreas L. B.; Jaudzems K.; Cala D.; Lalli D.; Bertarello A.; Schubeis T.; Akopjana I.; Kotelovica S.; Tars K.; et al. NMR Spectroscopic Assignment of Backbone and Side-Chain Protons in Fully Protonated Proteins: Microcrystals, Sedimented Assemblies, and Amyloid Fibrils. Angew. Chem., Int. Ed. 2016, 55, 15504–15509. 10.1002/anie.201607084. [DOI] [PubMed] [Google Scholar]
- Xiang S.; Kulminskaya N.; Habenstein B.; Biernat J.; Tepper K.; Paulat M.; Griesinger C.; Becker S.; Lange A.; Mandelkow E.; et al. A Two-Component Adhesive: Tau Fibrils Arise From a Combination of a Well-Defined Motif and Conformationally Flexible Interactions. J. Am. Chem. Soc. 2017, 139, 2639–2646. 10.1021/jacs.6b09619. [DOI] [PubMed] [Google Scholar]
- Ernst R. R.; Bodenhausen G.; Wokaun A.. Principles of Nuclear Magnetic Resonance in One and Two Dimensions; Oxford University Press: Oxford, 1987. [Google Scholar]
- Ishii Y.; Tycko R. Sensitivity Enhancement in Solid State 15N NMR by Indirect Detection With High-Speed Magic Angle Spinning. J. Magn. Reson. 2000, 142, 199–204. 10.1006/jmre.1999.1976. [DOI] [PubMed] [Google Scholar]
- Ishii Y.; Yesinowski J. P.; Tycko R. Sensitivity Enhancement in Solid-State 13C NMR of Synthetic Polymers and Biopolymers by 1H NMR Detection With High-Speed Magic Angle Spinning. J. Am. Chem. Soc. 2001, 123, 2921–2922. 10.1021/ja015505j. [DOI] [PubMed] [Google Scholar]
- Chen P.-H.; Gao C.; Price L. E.; Urban M. A.; Popp T. M. O.; Barnes A. B. Two Millimeter Diameter Spherical Rotors Spinning at 68 kHz for MAS NMR. J. Magn. Reson. Open 2021, 8–9, 100015. 10.1016/j.jmro.2021.100015. [DOI] [Google Scholar]
- Orton H. W.; Stanek J.; Schubeis T.; Foucaudeau D.; Ollier C.; Draney A. W.; Le Marchand T.; Cala-De Paepe D.; Felli I. C.; Pierattelli R.; et al. Protein NMR Resonance Assignment Without Spectral Analysis: 5D SOlid-State Automated Projection SpectroscopY (SO-APSY). Angew. Chem., Int. Ed. 2020, 59, 2380–2384. 10.1002/anie.201912211. [DOI] [PubMed] [Google Scholar]
- Ishii Y.; Wickramasinghe N. P.; Chimon S. A New Approach in 1D and 2D 13C High-Resolution Solid-State NMR Spectroscopy of Paramagnetic Organometallic Complexes by Very Fast Magic-Angle Spinning. J. Am. Chem. Soc. 2003, 125, 3438–9. 10.1021/ja0291742. [DOI] [PubMed] [Google Scholar]
- Wickramasinghe N. P.; Shaibat M.; Ishii Y. Enhanced Sensitivity and Resolution in 1H Solid-State NMR Spectroscopy of Paramagnetic Complexes Under Very Fast Magic Angle Spinning. J. Am. Chem. Soc. 2005, 127, 5796–7. 10.1021/ja042188i. [DOI] [PubMed] [Google Scholar]
- Kervern G.; Pintacuda G.; Zhang Y.; Oldfield E.; Roukoss C.; Kuntz E.; Herdtweck E.; Basset J.-M.; Cadars S.; Lesage A.; et al. Solid-State NMR of a Paramagnetic DIAD-FeII Catalyst: Sensitivity, Resolution Enhancement, and Structure-Based Assignments. J. Am. Chem. Soc. 2006, 128, 13545–13552. 10.1021/ja063510n. [DOI] [PubMed] [Google Scholar]
- Wickramasinghe N. P.; Kotecha M.; Samoson A.; Past J.; Ishii Y. Sensitivity Enhancement in 13C Solid-State NMR of Protein Microcrystals by Use of Paramagnetic Metal Ions for Optimizing 1H T1 Relaxation. J. Magn. Reson. 2007, 184, 350–356. 10.1016/j.jmr.2006.10.012. [DOI] [PMC free article] [PubMed] [Google Scholar]
- Linser R.; Chevelkov V.; Diehl A.; Reif B. Sensitivity Enhancement Using Paramagnetic Relaxation in MAS Solid-State NMR of Perdeuterated Proteins. J. Magn. Reson. 2007, 189, 209–216. 10.1016/j.jmr.2007.09.007. [DOI] [PubMed] [Google Scholar]
- Wickramasinghe N. P.; Parthasarathy S.; Jones C. R.; Bhardwaj C.; Long F.; Kotecha M.; Mehboob S.; Fung L. W.-M.; Past J.; Samoson A.; et al. Nanomole-Scale Protein Solid-State NMR by Breaking Intrinsic 1H T1 Boundaries. Nat. Methods 2009, 6, 215–218. 10.1038/nmeth.1300. [DOI] [PMC free article] [PubMed] [Google Scholar]
- Mroue K. H.; Zhang R.; Zhu P.; McNerny E.; Kohn D. H.; Morris M. D.; Ramamoorthy A. Acceleration of Natural-Abundance Solid-State MAS NMR Measurements on Bone by Paramagnetic Relaxation From Gadolinium-DTPA. J. Magn. Reson. 2014, 244, 90–97. 10.1016/j.jmr.2014.04.020. [DOI] [PMC free article] [PubMed] [Google Scholar]
- Ullrich S. J.; Hölper S.; Glaubitz C. Paramagnetic Doping of a 7TM Membrane Protein in Lipid Bilayers by Gd3+-Complexes for Solid-State NMR Spectroscopy. J. Biomol. NMR 2014, 58, 27–35. 10.1007/s10858-013-9800-4. [DOI] [PubMed] [Google Scholar]
- Nadaud P. S.; Helmus J. J.; Kall S. L.; Jaroniec C. P. Paramagnetic Ions Enable Tuning of Nuclear Relaxation Rates and Provide Long-Range Structural Restraints in Solid-State NMR of Proteins. J. Am. Chem. Soc. 2009, 131, 8108–8120. 10.1021/ja900224z. [DOI] [PubMed] [Google Scholar]
- Nadaud P. S.; Helmus J. J.; Sengupta I.; Jaroniec C. P. Rapid Acquisition of Multidimensional Solid-State NMR Spectra of Proteins Facilitated by Covalently Bound Paramagnetic Tags. J. Am. Chem. Soc. 2010, 132, 9561–9563. 10.1021/ja103545e. [DOI] [PubMed] [Google Scholar]
- McDermott A.; Creuzet F.; Kolbert A.; Griffin R. High-Resolution Magic-Angle-Spinning NMR Spectra of Protons in Deuterated Solids. J. Magn. Reson. 1992, 98, 408–413. 10.1016/0022-2364(92)90141-S. [DOI] [Google Scholar]
- Reif B.; Jaroniec C. P.; Rienstra C. M.; Hohwy M.; Griffin R. G. 1H-1H MAS Correlation Spectroscopy and Distance Measurements in a Deuterated Peptide. J. Magn. Reson. 2001, 151, 320–327. 10.1006/jmre.2001.2354. [DOI] [PubMed] [Google Scholar]
- Reif B.; Griffin R. G. 1H-Detected 1H,15N Correlation Spectroscopy in Rotating Solids. J. Magn. Reson. 2003, 160, 78–83. 10.1016/S1090-7807(02)00035-6. [DOI] [PubMed] [Google Scholar]
- Chevelkov V.; van Rossum B. J.; Castellani F.; Rehbein K.; Diehl A.; Hohwy M.; Steuernagel S.; Engelke F.; Oschkinat H.; Reif B. 1H Detection in MAS Solid-State NMR Spectroscopy of Biomacromolecules Employing Pulsed Field Gradients for Residual Solvent Suppression. J. Am. Chem. Soc. 2003, 125, 7788–7789. 10.1021/ja029354b. [DOI] [PubMed] [Google Scholar]
- Paulson E. K.; Morcombe C. R.; Gaponenko V.; Dancheck B.; Byrd R. A.; Zilm K. W. Sensitive High Resolution Inverse Detection NMR Spectroscopy of Proteins in the Solid State. J. Am. Chem. Soc. 2003, 125, 15831–15836. 10.1021/ja037315+. [DOI] [PubMed] [Google Scholar]
- Morcombe C. R.; Paulson E. K.; Gaponenko V.; Byrd R. A.; Zilm K. W. 1H-15N Correlation Spectroscopy of Nanocrystalline Proteins. J. Biomol. NMR 2005, 31, 217–30. 10.1007/s10858-005-0527-8. [DOI] [PubMed] [Google Scholar]
- Chevelkov V.; Rehbein K.; Diehl A.; Reif B. Ultrahigh Resolution in Proton Solid-State NMR Spectroscopy at High Levels of Deuteration. Angew. Chem., Int. Ed. 2006, 45, 3878–3881. 10.1002/anie.200600328. [DOI] [PubMed] [Google Scholar]
- Lewandowski J. R.; Dumez J.-N.; Akbey Ü.; Lange S.; Emsley L.; Oschkinat H. Enhanced Resolution and Coherence Lifetimes in the Solid-State NMR Spectroscopy of Perdeuterated Proteins Under Ultrafast Magic-Angle Spinning. J. Phys. Chem. Lett. 2011, 2, 2205–2211. 10.1021/jz200844n. [DOI] [Google Scholar]
- Asami S.; Szekely K.; Schanda P.; Meier B. H.; Reif B. Optimal Degree of Protonation for 1H Detection of Aliphatic Sites in Randomly Deuterated Proteins as a Function of the MAS Frequency. J. Biomol. NMR 2012, 54, 155–168. 10.1007/s10858-012-9659-9. [DOI] [PubMed] [Google Scholar]
- Zhou D. H.; Graesser D. T.; Franks W. T.; Rienstra C. M. Sensitivity and Resolution in Proton Solid-State NMR at Intermediate Deuteration Levels: Quantitative Linewidth Characterization and Applications to Correlation Spectroscopy. J. Magn. Reson. 2006, 178, 297–307. 10.1016/j.jmr.2005.10.008. [DOI] [PubMed] [Google Scholar]
- Akbey U.; Lange S.; Trent Franks W.; Linser R.; Rehbein K.; Diehl A.; van Rossum B.-J.; Reif B.; Oschkinat H. Optimum Levels of Exchangeable Protons in Perdeuterated Proteins for Proton Detection in MAS Solid-State NMR Spectroscopy. J. Biomol. NMR 2010, 46, 67–73. 10.1007/s10858-009-9369-0. [DOI] [PubMed] [Google Scholar]
- Cala-De Paepe D.; Stanek J.; Jaudzems K.; Tars K.; Andreas L. B.; Pintacuda G. Is Protein Deuteration Beneficial for Proton Detected Solid-State NMR at and Above 100 kHz Magic-Angle Spinning?. Solid State Nucl. Magn. Reson. 2017, 87, 126–136. 10.1016/j.ssnmr.2017.07.004. [DOI] [PubMed] [Google Scholar]
- Agarwal V.; Reif B. Residual Methyl Protonation in Perdeuterated Proteins for Multi-Dimensional Correlation Experiments in MAS Solid-State NMR Spectroscopy. J. Magn. Reson. 2008, 194, 16–24. 10.1016/j.jmr.2008.05.021. [DOI] [PubMed] [Google Scholar]
- Asami S.; Schmieder P.; Reif B. High Resolution 1H-Detected Solid-State NMR Spectroscopy of Protein Aliphatic Resonances: Access to Tertiary Structure Information. J. Am. Chem. Soc. 2010, 132, 15133–15135. 10.1021/ja106170h. [DOI] [PubMed] [Google Scholar]
- Nand D.; Cukkemane A.; Becker S.; Baldus M. Fractional Deuteration Applied to Biomolecular Solid-State NMR Spectroscopy. J. Biomol. NMR 2012, 52, 91–101. 10.1007/s10858-011-9585-2. [DOI] [PMC free article] [PubMed] [Google Scholar]
- Agarwal V.; Diehl A.; Skrynnikov N.; Reif B. High Resolution 1H-Detected 1H,13C Correlation Spectra in MAS Solid-State NMR Using Deuterated Proteins With Selective 1H,2H Isotopic Labeling of Methyl Groups. J. Am. Chem. Soc. 2006, 128, 12620–12621. 10.1021/ja064379m. [DOI] [PubMed] [Google Scholar]
- Gans P.; Hamelin O.; Sounier R.; Ayala I.; Durá M. A.; Amero C. D.; Noirclerc-Savoye M.; Franzetti B.; Plevin M. J.; Boisbouvier J. Stereospecific Isotopic Labeling of Methyl Groups for NMR Spectroscopic Studies of High-Molecular-Weight Proteins. Angew. Chem., Int. Ed. 2010, 49, 1958–1962. 10.1002/anie.200905660. [DOI] [PubMed] [Google Scholar]
- Kerfah R.; Plevin M. J.; Sounier R.; Gans P.; Boisbouvier J. Methyl-Specific Isotopic Labeling: A Molecular Tool Box for Solution NMR Studies of Large Proteins. Curr. Opin. Struct. Biol. 2015, 32, 113–122. 10.1016/j.sbi.2015.03.009. [DOI] [PubMed] [Google Scholar]
- Huber M.; Hiller S.; Schanda P.; Ernst M.; Böckmann A.; Verel R.; Meier B. H. A Proton-Detected 4D Solid-State NMR Experiment for Protein Structure Determination. ChemPhysChem 2011, 12, 915–918. 10.1002/cphc.201100062. [DOI] [PubMed] [Google Scholar]
- Schanda P.; Huber M.; Boisbouvier J.; Meier B. H.; Ernst M. Solid-State NMR Measurements of Asymmetric Dipolar Couplings Provide Insight Into Protein Side-Chain Motion. Angew. Chem., Int. Ed. 2011, 50, 11005–11009. 10.1002/anie.201103944. [DOI] [PubMed] [Google Scholar]
- Sinnige T.; Daniëls M.; Baldus M.; Weingarth M. Proton Clouds to Measure Long-Range Contacts Between Nonexchangeable Side Chain Protons in Solid-State NMR. J. Am. Chem. Soc. 2014, 136, 4452–4455. 10.1021/ja412870m. [DOI] [PubMed] [Google Scholar]
- Ward M. E.; Shi L.; Lake E.; Krishnamurthy S.; Hutchins H.; Brown L. S.; Ladizhansky V. Proton-Detected Solid-State NMR Reveals Intramembrane Polar Networks in a Seven-Helical Transmembrane Protein Proteorhodopsin. J. Am. Chem. Soc. 2011, 133, 17434–17443. 10.1021/ja207137h. [DOI] [PubMed] [Google Scholar]
- Medeiros-Silva J.; Mance D.; Daniëls M.; Jekhmane S.; Houben K.; Baldus M.; Weingarth M. 1H-Detected Solid-State NMR Studies of Water-Inaccessible Proteins in Vitro and in Situ. Angew. Chem., Int. Ed. 2016, 55, 13606–13610. 10.1002/anie.201606594. [DOI] [PMC free article] [PubMed] [Google Scholar]
- Movellan K. T.; Najbauer E. E.; Pratihar S.; Salvi M.; Giller K.; Becker S.; Andreas L. B. Alpha Protons as NMR Probes in Deuterated Proteins. J. Biomol. NMR 2019, 73, 81–91. 10.1007/s10858-019-00230-y. [DOI] [PMC free article] [PubMed] [Google Scholar]
- Kainosho M.; Torizawa T.; Iwashita Y.; Terauchi T.; Mei Ono A.; Güntert P. Optimal Isotope Labelling for NMR Protein Structure Determinations. Nature 2006, 440, 52–57. 10.1038/nature04525. [DOI] [PubMed] [Google Scholar]
- Takahashi H.; Kainosho M.; Akutsu H.; Fujiwara T. 1H -Detected 1H-1H Correlation Spectroscopy of a Stereo-Array Isotope Labeled Amino Acid Under Fast Magic-Angle Spinning. J. Magn. Reson. 2010, 203, 253–256. 10.1016/j.jmr.2010.01.005. [DOI] [PubMed] [Google Scholar]
- Wang S.; Parthasarathy S.; Nishiyama Y.; Endo Y.; Nemoto T.; Yamauchi K.; Asakura T.; Takeda M.; Terauchi T.; Kainosho M.; et al. Nano-Mole Scale Side-Chain Signal Assignment by 1H-Detected Protein Solid-State NMR by Ultra-Fast Magic-Angle Spinning and Stereo-Array Isotope Labeling. PLoS One 2015, 10, e0122714 10.1371/journal.pone.0122714. [DOI] [PMC free article] [PubMed] [Google Scholar]
- Takeda M.; Kainosho M. Cell-Free Protein Production for NMR Studies. Methods Mol. Biol. 2012, 831, 71–84. 10.1007/978-1-61779-480-3_5. [DOI] [PubMed] [Google Scholar]
- David G.; Fogeron M.-L.; Schledorn M.; Montserret R.; Haselmann U.; Penzel S.; Badillo A.; Lecoq L.; André P.; Nassal M.; et al. Structural Studies of Self-Assembled Subviral Particles: Combining Cell-Free Expression With 110 kHz MAS NMR Spectroscopy. Angew. Chem., Int. Ed. 2018, 57, 4787–4791. 10.1002/anie.201712091. [DOI] [PubMed] [Google Scholar]
- Jirasko V.; Lakomek N.-A.; Penzel S.; Fogeron M.-L.; Bartenschlager R.; Meier B. H.; Böckmann A. Proton-Detected Solid-State NMR of the Cell-Free Synthesized α-Helical Transmembrane Protein NS4B From Hepatitis C Virus. ChemBioChem. 2020, 21, 1453–1460. 10.1002/cbic.201900765. [DOI] [PMC free article] [PubMed] [Google Scholar]
- Jirasko V.; Lends A.; Lakomek N.-A.; Fogeron M.-L.; Weber M. E.; Malär A. A.; Penzel S.; Bartenschlager R.; Meier B. H.; Böckmann A. Dimer Organization of Membrane-Associated NS5A of Hepatitis C Virus as Determined by Highly Sensitive 1H-Detected Solid-State NMR. Angew. Chem., Int. Ed. 2021, 60, 5339–5347. 10.1002/anie.202013296. [DOI] [PMC free article] [PubMed] [Google Scholar]
- Xue K.; Sarkar R.; Motz C.; Asami S.; Camargo D. C. R.; Decker V.; Wegner S.; Tosner Z.; Reif B. Limits of Resolution and Sensitivity of Proton Detected MAS Solid-State NMR Experiments at 111 kHz in Deuterated and Protonated Proteins. Sci. Rep. 2017, 7, 7444. 10.1038/s41598-017-07253-1. [DOI] [PMC free article] [PubMed] [Google Scholar]
- Andreas L. B.; Jaudzems K.; Stanek J.; Lalli D.; Bertarello A.; Le Marchand T.; Cala-De Paepe D.; Kotelovica S.; Akopjana I.; Knott B.; et al. Structure of Fully Protonated Proteins by Proton-Detected Magic-Angle Spinning NMR. Proc. Natl. Acad. Sci. U.S.A. 2016, 113, 9187–9192. 10.1073/pnas.1602248113. [DOI] [PMC free article] [PubMed] [Google Scholar]
- Knight M. J.; Webber A. L.; Pell A. J.; Guerry P.; Barbet-Massin E.; Bertini I.; Felli I. C.; Gonnelli L.; Pierattelli R.; Emsley L.; et al. Fast Resonance Assignment and Fold Determination of Human Superoxide Dismutase by High-Resolution Proton-Detected Solid-State MAS NMR Spectroscopy. Angew. Chem., Int. Ed. 2011, 50, 11697–11701. 10.1002/anie.201106340. [DOI] [PubMed] [Google Scholar]
- Lecoq L.; Schledorn M.; Wang S.; Smith-Penzel S.; Malär A. A.; Callon M.; Nassal M.; Meier B. H.; Böckmann A. 100 kHz MAS Proton-Detected NMR Spectroscopy of Hepatitis B Virus Capsids. Front. Mol. Biosci. 2019, 6, 58. 10.3389/fmolb.2019.00058. [DOI] [PMC free article] [PubMed] [Google Scholar]
- Penzel S.; Smith A. A.; Agarwal V.; Hunkeler A.; Org M.-L.; Samoson A.; Böckmann A.; Ernst M.; Meier B. H. Protein Resonance Assignment at MAS Frequencies Approaching 100 kHz: A Quantitative Comparison of J-Coupling and Dipolar-Coupling-Based Transfer Methods. J. Biomol. NMR 2015, 63, 165–186. 10.1007/s10858-015-9975-y. [DOI] [PubMed] [Google Scholar]
- Schledorn M.; Malär A.; Torosyan A.; Penzel S.; Klose D.; Oss A.; Org M.-L.; Wang S.; Lecoq L.; Cadalbert R.; et al. Protein NMR Spectroscopy at 150 kHz Magic-angle Spinning Continues to Improve Resolution and Mass Sensitivity. ChemBioChem. 2020, 21, 2540. 10.1002/cbic.202000341. [DOI] [PMC free article] [PubMed] [Google Scholar]
- Malär A. A.; Smith-Penzel S.; Camenisch G.-M.; Wiegand T.; Samoson A.; Böckmann A.; Ernst M.; Meier B. Quantifying Proton NMR Coherent Linewidth in Proteins Under Fast MAS Conditions: A Second Moment Approach. Phys. Chem. Chem. Phys. 2019, 21, 18850–18865. 10.1039/C9CP03414E. [DOI] [PubMed] [Google Scholar]
- Xue K.; Sarkar R.; Motz C.; Asami S.; Decker V.; Wegner S.; Tosner Z.; Reif B. Magic-Angle Spinning Frequencies Beyond 300 kHz Are Necessary to Yield Maximum Sensitivity in Selectively Methyl Protonated Protein Samples in Solid-State NMR. J. Phys. Chem. C 2018, 122, 16437–16442. 10.1021/acs.jpcc.8b05600. [DOI] [Google Scholar]
- Nimerovsky E.; Movellan K. T.; Zhang X. C.; Forster M. C.; Najbauer E.; Xue K.; Dervişoǧlu R.; Giller K.; Griesinger C.; Becker S.; et al. Proton Detected Solid-State NMR of Membrane Proteins at 28 T (1.2 GHz) and 100 kHz Magic-Angle Spinning. Biomolecules 2021, 11, 752. 10.3390/biom11050752. [DOI] [PMC free article] [PubMed] [Google Scholar]
- Callon M.; Malär A. A.; Pfister S.; Římal V.; Weber M. E.; Wiegand T.; Zehnder J.; Chávez M.; Cadalbert R.; Deb R.; et al. Biomolecular Solid-State NMR Spectroscopy at 1200 MHz: The Gain in Resolution. J. Biomol. NMR 2021, 75, 255–272. 10.1007/s10858-021-00373-x. [DOI] [PMC free article] [PubMed] [Google Scholar]
- Marchetti A.; Jehle S.; Felletti M.; Knight M. J.; Wang Y.; Xu Z.-Q.; Park A. Y.; Otting G.; Lesage A.; Emsley L.; et al. Backbone Assignment of Fully Protonated Solid Proteins by 1H Detection and Ultrafast Magic-Angle-Spinning NMR Spectroscopy. Angew. Chem., Int. Ed. 2012, 51, 10756–10759. 10.1002/anie.201203124. [DOI] [PubMed] [Google Scholar]
- Xue K.; Sarkar R.; Lalli D.; Koch B.; Pintacuda G.; Tosner Z.; Reif B. Impact of Magnetic Field Strength on Resolution and Sensitivity of Proton Resonances in Biological Solids. J. Phys. Chem. C 2020, 124, 22631–22637. 10.1021/acs.jpcc.0c05407. [DOI] [Google Scholar]
- Martin R. W.; Zilm K. W. Preparation of Protein Nanocrystals and Their Characterization by Solid State NMR. J. Magn. Reson. 2003, 165, 162–174. 10.1016/S1090-7807(03)00253-2. [DOI] [PubMed] [Google Scholar]
- Das N.; Murray D. T.; Cross T. A. Lipid Bilayer Preparations of Membrane Proteins for Oriented and Magic-Angle Spinning Solid-State NMR Samples. Nat. Protoc. 2013, 8, 2256–2270. 10.1038/nprot.2013.129. [DOI] [PMC free article] [PubMed] [Google Scholar]
- Lacabanne D.; Kunert B.; Gardiennet C.; Meier B.; Bökmann A.. Sample Preparation for Membrane Protein Structural Studies by Solid-State NMR Methods in Molecular Biology; Springer: New York, 2017; Vol. 1635, pp 345–358. [DOI] [PubMed] [Google Scholar]
- Jaroniec C. P. Two Decades of Progress in Structural and Dynamic Studies of Amyloids by Solid-State NMR. J. Magn. Reson. 2019, 306, 42–47. 10.1016/j.jmr.2019.07.015. [DOI] [PMC free article] [PubMed] [Google Scholar]
- Wickramasinghe A.; Xiao Y.; Kobayashi N.; Wang S.; Scherpelz K. P.; Yamazaki T.; Meredith S. C.; Ishii Y. Sensitivity-Enhanced Solid-State NMR Detection of Structural Differences and Unique Polymorphs in Pico- to Nanomolar Amounts of Brain-Derived and Synthetic 42-Residue Amyloid-β Fibrils. J. Am. Chem. Soc. 2021, 143, 11462–11472. 10.1021/jacs.1c03346. [DOI] [PMC free article] [PubMed] [Google Scholar]
- Wiegand T.; Lacabanne D.; Torosyan A.; Boudet J.; Cadalbert R.; Allain F. H.-T.; Meier B. H.; Böckmann A. Sedimentation Yields Long-Term Stable Protein Samples as Shown by Solid-State NMR. Front. Mol. Biosci. 2020, 7, 17. 10.3389/fmolb.2020.00017. [DOI] [PMC free article] [PubMed] [Google Scholar]
- Fragai M.; Luchinat C.; Martelli T.; Ravera E.; Sagi I.; Solomonov I.; Udi Y. SSNMR of Biosilica-Entrapped Enzymes Permits an Easy Assessment of Preservation of Native Conformation in Atomic Detail. Chem. Commun. 2014, 50, 421–423. 10.1039/C3CC46896H. [DOI] [PubMed] [Google Scholar]
- Mandal A.; Boatz J. C.; Wheeler T. B.; van der Wel P. C. A. On the Use of Ultracentrifugal Devices for Routine Sample Preparation in Biomolecular Magic-Angle-Spinning NMR. J. Biomol. NMR 2017, 67, 165–178. 10.1007/s10858-017-0089-6. [DOI] [PMC free article] [PubMed] [Google Scholar]
- Böckmann A.; Gardiennet C.; Verel R.; Hunkeler A.; Loquet A.; Pintacuda G.; Emsley L.; Meier B. H.; Lesage A. Characterization of Different Water Pools in Solid-State NMR Protein Samples. J. Biomol. NMR 2009, 45, 319–327. 10.1007/s10858-009-9374-3. [DOI] [PubMed] [Google Scholar]
- Bertini I.; Engelke F.; Gonnelli L.; Knott B.; Luchinat C.; Osen D.; Ravera E. On the Use of Ultracentrifugal Devices for Sedimented Solute NMR. J. Biomol. NMR 2012, 54, 123–127. 10.1007/s10858-012-9657-y. [DOI] [PubMed] [Google Scholar]
- Gardiennet C.; Schütz A. K.; Hunkeler A.; Kunert B.; Terradot L.; Böckmann A.; Meier B. H. A Sedimented Sample of a 59 kDa Dodecameric Helicase Yields High-Resolution Solid-State NMR Spectra. Angew. Chem., Int. Ed. 2012, 51, 7855–7858. 10.1002/anie.201200779. [DOI] [PubMed] [Google Scholar]
- Lacabanne D.; Fogeron M.-L.; Wiegand T.; Cadalbert R.; Meier B. H.; Böckmann A. Protein sample preparation for solid-state NMR investigations. Prog. Nucl. Magn. Reson. Spectrosc. 2019, 110, 20–33. 10.1016/j.pnmrs.2019.01.001. [DOI] [PubMed] [Google Scholar]
- Bernard G. M.; Goyal A.; Miskolzie M.; McKay R.; Wu Q.; Wasylishen R. E.; Michaelis V. K. Methylammonium Lead Chloride: A Sensitive Sample for an Accurate NMR Thermometer. J. Magn. Reson. 2017, 283, 14–21. 10.1016/j.jmr.2017.08.002. [DOI] [PubMed] [Google Scholar]
- Thurber K. R.; Tycko R. Measurement of Sample Temperatures under Magic-angle Spinning from the Chemical Shift and Spin-lattice Relaxation Rate of 79Br in KBr Powder. J. Magn. Reson. 2009, 196, 84–87. 10.1016/j.jmr.2008.09.019. [DOI] [PMC free article] [PubMed] [Google Scholar]
- Zhang D.; Itin B.; McDermott A. E. TmDOTP: An NMR-based Thermometer for Magic Angle Spinning NMR Experiments. J. Magn. Reson. 2019, 308, 106574. 10.1016/j.jmr.2019.106574. [DOI] [PMC free article] [PubMed] [Google Scholar]
- Frye J. S.; Maciel G. E. Setting the Magic Angle Using a Quadrupolar Nuclide. J. Magn. Reson. 1982, 48, 125–131. 10.1016/0022-2364(82)90243-8. [DOI] [Google Scholar]
- Penzel S.; Smith A. A.; Ernst M.; Meier B. H. Setting the Magic Angle for Fast Magic-Angle Spinning Probes. J. Magn. Reson. 2018, 293, 115–122. 10.1016/j.jmr.2018.06.002. [DOI] [PubMed] [Google Scholar]
- Linser R.; Fink U.; Reif B. Proton-Detected Scalar Coupling Based Assignment Strategies in MAS Solid-State NMR Spectroscopy Applied to Perdeuterated Proteins. J. Magn. Reson. 2008, 193, 89–93. 10.1016/j.jmr.2008.04.021. [DOI] [PubMed] [Google Scholar]
- Andreas L. B.; Reese M.; Eddy M. T.; Gelev V.; Ni Q. Z.; Miller E. A.; Emsley L.; Pintacuda G.; Chou J. J.; Griffin R. G. Structure and Mechanism of the Influenza A M218––60 Dimer of Dimers. J. Am. Chem. Soc. 2015, 137, 14877–14886. 10.1021/jacs.5b04802. [DOI] [PMC free article] [PubMed] [Google Scholar]
- Kurauskas V.; Crublet E.; Macek P.; Kerfah R.; Gauto D. F.; Boisbouvier J.; Schanda P. Sensitive proton-detected solid-state NMR spectroscopy of large proteins with selective CH3 labelling: application to the 50S ribosome subunit. Chem. Commun. 2016, 52, 9558–9561. 10.1039/C6CC04484K. [DOI] [PMC free article] [PubMed] [Google Scholar]
- Agarwal V.; Penzel S.; Szekely K.; Cadalbert R.; Testori E.; Oss A.; Past J.; Samoson A.; Ernst M.; Böckmann A.; et al. De Novo 3D Structure Determination From Sub-Milligram Protein Samples by Solid-State 100 kHz MAS NMR Spectroscopy. Angew. Chem., Int. Ed. 2014, 53, 12253–12256. 10.1002/anie.201405730. [DOI] [PubMed] [Google Scholar]
- Stejskal E.; Schaefer J.; Waugh J. Magic-Angle Spinning and Polarization Transfer in Proton-Enhanced NMR. J. Magn. Reson. 1977, 28, 105–112. 10.1016/0022-2364(77)90260-8. [DOI] [Google Scholar]
- Meier B. Cross Polarization Under Fast Magic Angle Spinning: Thermodynamical Considerations. Chem. Phys. Lett. 1992, 188, 201–207. 10.1016/0009-2614(92)90009-C. [DOI] [Google Scholar]
- Laage S.; Marchetti A.; Sein J.; Pierattelli R.; Sass H. J.; Grzesiek S.; Lesage A.; Pintacuda G.; Emsley L. Band-Selective 1H-13C Cross-Polarization in Fast Magic Angle Spinning Solid-State NMR Spectroscopy. J. Am. Chem. Soc. 2008, 130, 17216–17217. 10.1021/ja805926d. [DOI] [PubMed] [Google Scholar]
- Laage S.; Sachleben J. R.; Steuernagel S.; Pierattelli R.; Pintacuda G.; Emsley L. Fast Acquisition of Multi-Dimensional Spectra in Solid-State NMR Enabled by Ultra-Fast MAS. J. Magn. Reson. 2009, 196, 133–141. 10.1016/j.jmr.2008.10.019. [DOI] [PubMed] [Google Scholar]
- Bak M.; Rasmussen J. T.; Nielsen N. C. SIMPSON: A General Simulation Program for Solid-State NMR Spectroscopy. J. Magn. Reson. 2011, 213, 366–400. 10.1016/j.jmr.2011.09.008. [DOI] [PubMed] [Google Scholar]
- Tošner Z.; Sarkar R.; Becker-Baldus J.; Glaubitz C.; Wegner S.; Engelke F.; Glaser S. J.; Reif B. Overcoming Volume Selectivity of Dipolar Recoupling in Biological Solid-State NMR Spectroscopy. Angew. Chem., Int. Ed. 2018, 57, 14514–14518. 10.1002/anie.201805002. [DOI] [PubMed] [Google Scholar]
- Hediger S.; Meier B.; Kurur N. D.; Bodenhausen G.; Ernst R. NMR Cross Polarization by Adiabatic Passage Through the Hartmann-Hahn Condition (APHH). Chem. Phys. Lett. 1994, 223, 283–288. 10.1016/0009-2614(94)00470-6. [DOI] [Google Scholar]
- Tošner Z.; Brandl M. J.; Blahut J.; Glaser S. J.; Reif B. Maximizing Efficiency of Dipolar Recoupling in Solid-State NMR using Optimal Control Sequences. Sci. Adv. 2021, 7, eabj5913 10.1126/sciadv.abj5913. [DOI] [PMC free article] [PubMed] [Google Scholar]
- Stanek J.; Schubeis T.; Paluch P.; Güntert P.; Andreas L. B.; Pintacuda G. Automated Backbone NMR Resonance Assignment of Large Proteins Using Redundant Linking From a Single Simultaneous Acquisition. J. Am. Chem. Soc. 2020, 142, 5793–5799. 10.1021/jacs.0c00251. [DOI] [PubMed] [Google Scholar]
- Wu X.; Zilm K. Cross Polarization With High-Speed Magic-Angle Spinning. J. Magn. Reson. A 1993, 104, 154–165. 10.1006/jmra.1993.1203. [DOI] [Google Scholar]
- Marica F.; Snider R. An Analytical Formulation of CPMAS. Solid State Nucl. Magn. Reson. 2003, 23, 28–49. 10.1016/S0926-2040(02)00013-9. [DOI] [PubMed] [Google Scholar]
- Pauli J.; van Rossum B.; Förster H.; de Groot H. J.; Oschkinat H. Sample Optimization and Identification of Signal Patterns of Amino Acid Side Chains in 2D RFDR Spectra of the α-Spectrin SH3 Domain. J. Magn. Reson. 2000, 143, 411–416. 10.1006/jmre.2000.2029. [DOI] [PubMed] [Google Scholar]
- Zhou D. H.; Rienstra C. M. High-Performance Solvent Suppression for Proton Detected Solid-State NMR. J. Magn. Reson. 2008, 192, 167–172. 10.1016/j.jmr.2008.01.012. [DOI] [PMC free article] [PubMed] [Google Scholar]
- Matsunaga T.; Okabe R.; Ishii Y. Efficient Solvent Suppression With Adiabatic Inversion for 1H-Detected Solid-State NMR. J. Biomol. NMR 2021, 75, 365–370. 10.1007/s10858-021-00384-8. [DOI] [PubMed] [Google Scholar]
- Linser R.; Dasari M.; Hiller M.; Higman V.; Fink U.; Lopez del Amo J.-M.; Markovic S.; Handel L.; Kessler B.; Schmieder P.; et al. Proton-Detected Solid-State NMR Spectroscopy of Fibrillar and Membrane Proteins. Angew. Chem., Int. Ed. 2011, 50, 4508–4512. 10.1002/anie.201008244. [DOI] [PubMed] [Google Scholar]
- Lends A.; Ravotti F.; Zandomeneghi G.; Böckmann A.; Ernst M.; Meier B. H. Direct Amide 15N to 13C Transfers for Solid-State Assignment Experiments in Deuterated Proteins. J. Biomol. NMR 2018, 72, 69–78. 10.1007/s10858-018-0207-0. [DOI] [PubMed] [Google Scholar]
- Barbet-Massin E.; Pell A. J.; Jaudzems K.; Franks W. T.; Retel J. S.; Kotelovica S.; Akopjana I.; Tars K.; Emsley L.; Oschkinat H.; et al. Out-and-Back 13C–13C Scalar Transfers in Protein Resonance Assignment by Proton-Detected Solid-State NMR Under Ultra-Fast MAS. J. Biomol. NMR 2013, 56, 379–386. 10.1007/s10858-013-9757-3. [DOI] [PubMed] [Google Scholar]
- Griffin R. Dipolar Recoupling in MAS Spectra of Biological Solids. Nat. Struct. Biol. 1998, 5, 508–512. 10.1038/749. [DOI] [PubMed] [Google Scholar]
- Vijayan V.; Demers J.-P.; Biernat J.; Mandelkow E.; Becker S.; Lange A. Low-Power Solid-State NMR Experiments for Resonance Assignment Under Fast Magic-Angle Spinning. ChemPhysChem 2009, 10, 2205–2208. 10.1002/cphc.200900439. [DOI] [PubMed] [Google Scholar]
- Baldus M.; Petkova A. T.; Herzfeld J.; Griffin R. G. Cross Polarization in the Tilted Frame: Assignment and Spectral Simplification in Heteronuclear Spin Systems. Mol. Phys. 1998, 95, 1197–1207. 10.1080/00268979809483251. [DOI] [Google Scholar]
- Verel R.; Baldus M.; Ernst M.; Meier B. H. A Homonuclear Spin-Pair Filter for Solid-State NMR Based on Adiabatic-Passage Techniques. Chem. Phys. Lett. 1998, 287, 421–428. 10.1016/S0009-2614(98)00172-9. [DOI] [Google Scholar]
- Verel R.; Ernst M.; Meier B. H. Adiabatic Dipolar Recoupling in Solid-State NMR: The DREAM Scheme. J. Magn. Reson. 2001, 150, 81–99. 10.1006/jmre.2001.2310. [DOI] [PubMed] [Google Scholar]
- Chevelkov V.; Giller K.; Becker S.; Lange A. Efficient CO–CA Transfer in Highly Deuterated Proteins by Band-Selective Homonuclear Cross-Polarization. J. Magn. Reson. 2013, 230, 205–211. 10.1016/j.jmr.2013.02.021. [DOI] [PubMed] [Google Scholar]
- Westfeld T.; Verel R.; Ernst M.; Böckmann A.; Meier B. H. Properties of the DREAM Scheme and Its Optimization for Application to Proteins. J. Biomol. NMR 2012, 53, 103–112. 10.1007/s10858-012-9627-4. [DOI] [PubMed] [Google Scholar]
- Baldus M.; Meier B. Total Correlation Spectroscopy in the Solid State. The Use of Scalar Couplings to Determine the Through-Bond Connectivity. J. Magn. Reson. 1996, 121, 65–69. 10.1006/jmra.1996.0137. [DOI] [Google Scholar]
- Tan K. O.; Agarwal V.; Lakomek N.-A.; Penzel S.; Meier B. H.; Ernst M. Efficient Low-Power TOBSY Sequences for Fast MAS. Solid State Nucl. Magn. Reson. 2018, 89, 27–34. 10.1016/j.ssnmr.2017.11.003. [DOI] [PubMed] [Google Scholar]
- Carravetta M.; Edén M.; Zhao X.; Brinkmann A.; Levitt M. H. Symmetry Principles for the Design of Radiofrequency Pulse Sequences in the Nuclear Magnetic Resonance of Rotating Solids. Chem. Phys. Lett. 2000, 321, 205–215. 10.1016/S0009-2614(00)00340-7. [DOI] [Google Scholar]
- Shaka A.; Keeler J.; Frenkiel T.; Freeman R. An Improved Sequence for Broadband Decoupling: WALTZ-16. J. Magn. Reson. 1983, 52, 335–338. 10.1016/0022-2364(83)90207-X. [DOI] [Google Scholar]
- Kulminskaya N.; Vasa S. K.; Giller K.; Becker S.; Kwan A.; Sunde M.; Linser R. Access to Side-Chain Carbon Information in Deuterated Solids Under Fast MAS Through Non-Rotor-Synchronized Mixing. Chem. Commun. 2016, 52, 268–271. 10.1039/C5CC07345F. [DOI] [PubMed] [Google Scholar]
- Bennett A. E.; Rienstra C. M.; Griffiths J. M.; Zhen W.; Lansbury P. T.; Griffin R. G. Homonuclear Radio Frequency-Driven Recoupling in Rotating Solids. J. Chem. Phys. 1998, 108, 9463–9479. 10.1063/1.476420. [DOI] [Google Scholar]
- Hou G.; Yan S.; Trébosc J.; Amoureux J.-P.; Polenova T. Broadband Homonuclear Correlation Spectroscopy Driven by Combined R2nu Sequences Under Fast Magic Angle Spinning for NMR Structural Analysis of Organic and Biological Solids. J. Magn. Reson. 2013, 232, 18–30. 10.1016/j.jmr.2013.04.009. [DOI] [PMC free article] [PubMed] [Google Scholar]
- Lu X.; Guo C.; Hou G.; Polenova T. Combined Zero-Quantum and Spin-Diffusion Mixing for Efficient Homonuclear Correlation Spectroscopy Under Fast MAS: Broadband Recoupling and Detection of Long-Range Correlations. J. Biomol. NMR 2015, 61, 7–20. 10.1007/s10858-014-9875-6. [DOI] [PMC free article] [PubMed] [Google Scholar]
- Emsley L.; Bodenhausen G. Optimization of Shaped Selective Pulses for NMR Using a Quaternion Description of Their Overall Propagators. J. Magn. Reson. 1992, 97, 135–148. 10.1016/0022-2364(92)90242-Y. [DOI] [Google Scholar]
- Geen H.; Freeman R. Band-Selective Radiofrequency Pulses. J. Magn. Reson. 1991, 93, 93–141. 10.1016/0022-2364(91)90034-Q. [DOI] [Google Scholar]
- Knight M. J.; Pell A. J.; Bertini I.; Felli I. C.; Gonnelli L.; Pierattelli R.; Herrmann T.; Emsley L.; Pintacuda G. Structure and Backbone Dynamics of a Microcrystalline Metalloprotein by Solid-State NMR. Proc. Natl. Acad. Sci. U.S.A. 2012, 109, 11095–11100. 10.1073/pnas.1204515109. [DOI] [PMC free article] [PubMed] [Google Scholar]
- Vallet A.; Favier A.; Brutscher B.; Schanda P. ssNMRlib: A Comprehensive Library and Tool Box for Acquisition of Solid-State Nuclear Magnetic Resonance Experiments on Bruker Spectrometers. Magn. Reson. 2020, 1, 331–345. 10.5194/mr-1-331-2020. [DOI] [PMC free article] [PubMed] [Google Scholar]
- Shaka A.; Lee C.; Pines A. Iterative Schemes for Bilinear Operators; Application to Spin Decoupling. J. Magn. Reson. 1988, 77, 274–293. 10.1016/0022-2364(88)90178-3. [DOI] [Google Scholar]
- Lesage A.; Bardet M.; Emsley L. Through-Bond Carbon-Carbon Connectivities in Disordered Solids by NMR. J. Am. Chem. Soc. 1999, 121, 10987–10993. 10.1021/ja992272b. [DOI] [Google Scholar]
- Bertini I.; Emsley L.; Felli I. C.; Laage S.; Lesage A.; Lewandowski J. R.; Marchetti A.; Pierattelli R.; Pintacuda G. High-resolution and sensitivity through-bond correlations in ultra-fast magic angle spinning (MAS) solid-state NMR. Chem. Sci. 2011, 2, 345–348. 10.1039/C0SC00397B. [DOI] [Google Scholar]
- Equbal A.; Madhu P. K.; Meier B. H.; Nielsen N. C.; Ernst M.; Agarwal V. Parameter Independent Low-Power Heteronuclear Decoupling for Fast Magic-Angle Spinning Solid-State NMR. J. Chem. Phys. 2017, 146, 084202. 10.1063/1.4976997. [DOI] [PubMed] [Google Scholar]
- Ernst M.; Samoson A.; Meier B. H. Decoupling and Recoupling Using Continuous-Wave Irradiation in Magic-Angle-Spinning Solid-State NMR: A Unified Description Using Bimodal Floquet Theory. J. Chem. Phys. 2005, 123, 064102. 10.1063/1.1944291. [DOI] [PubMed] [Google Scholar]
- Lewandowski J. R.; Sein J.; Sass H. J.; Grzesiek S.; Blackledge M.; Emsley L. Measurement of Site-Specific 13C Spin-Lattice Relaxation in a Crystalline Protein. J. Am. Chem. Soc. 2010, 132, 8252–8254. 10.1021/ja102744b. [DOI] [PubMed] [Google Scholar]
- Thakur R. S.; Kurur N. D.; Madhu P. Swept-Frequency Two-Pulse Phase Modulation for Heteronuclear Dipolar Decoupling in Solid-State NMR. Chem. Phys. Lett. 2006, 426, 459–463. 10.1016/j.cplett.2006.06.007. [DOI] [Google Scholar]
- Vinod Chandran C.; Madhu P. K.; Kurur N. D.; Bräuniger T. Swept-Frequency Two-Pulse Phase Modulation (SWf-TPPM) Sequences With Linear Sweep Profile for Heteronuclear Decoupling in Solid-State NMR. Magn. Reson. Chem. 2008, 46, 943–947. 10.1002/mrc.2285. [DOI] [PubMed] [Google Scholar]
- Bennett A. E.; Rienstra C. M.; Auger M.; Lakshmi K. V.; Griffin R. G. Heteronuclear Decoupling in Rotating Solids. J. Chem. Phys. 1995, 103, 6951–6958. 10.1063/1.470372. [DOI] [Google Scholar]
- Ernst M.; Samoson A.; Meier B. H. Low-Power XiX Decoupling in MAS NMR Experiments. J. Magn. Reson. 2003, 163, 332–339. 10.1016/S1090-7807(03)00155-1. [DOI] [PubMed] [Google Scholar]
- Agarwal V.; Tuherm T.; Reinhold A.; Past J.; Samoson A.; Ernst M.; Meier B. H. Amplitude-Modulated Low-Power Decoupling Sequences for Fast Magic-Angle Spinning NMR. Chem. Phys. Lett. 2013, 583, 1–7. 10.1016/j.cplett.2013.07.073. [DOI] [Google Scholar]
- Weingarth M.; Tekely P.; Bodenhausen G. Efficient Heteronuclear Decoupling by Quenching Rotary Resonance in Solid-State NMR. Chem. Phys. Lett. 2008, 466, 247–251. 10.1016/j.cplett.2008.10.041. [DOI] [Google Scholar]
- Vinther J. M.; Nielsen A. B.; Bjerring M.; van Eck E. R. H.; Kentgens A. P. M.; Khaneja N.; Nielsen N. C. Refocused Continuous-Wave Decoupling: A New Approach to Heteronuclear Dipolar Decoupling in Solid-State NMR Spectroscopy. J. Chem. Phys. 2012, 137, 214202. 10.1063/1.4768953. [DOI] [PubMed] [Google Scholar]
- Smith A. A.; Ravotti F.; Testori E.; Cadalbert R.; Ernst M.; Böckmann A.; Meier B. H. Partially-Deuterated Samples of HET-s(218–289) Fibrils: Assignment and Deuterium Isotope Effect. J. Biomol. NMR 2017, 67, 109–119. 10.1007/s10858-016-0087-0. [DOI] [PubMed] [Google Scholar]
- Huber M.; With O.; Schanda P.; Verel R.; Ernst M.; Meier B. H. A Supplementary Coil for 2H Decoupling With Commercial HCN MAS Probes. J. Magn. Reson. 2012, 214, 76–80. 10.1016/j.jmr.2011.10.010. [DOI] [PubMed] [Google Scholar]
- Kay L. E.; Ikura M.; Tschudin R.; Bax A. Three-Dimensional Triple-Resonance NMR Spectroscopy of Isotopically Enriched Proteins. J. Magn. Reson. 1990, 89, 496–514. 10.1016/0022-2364(90)90333-5. [DOI] [PubMed] [Google Scholar]
- Grzesiek S.; Bax A. Improved 3D Triple-Resonance NMR Techniques Applied to a 31 kDa Protein. J. Magn. Reson. 1992, 96, 432–440. 10.1016/0022-2364(92)90099-S. [DOI] [Google Scholar]
- Wittekind M.; Mueller L. HNCACB, a High-Sensitivity 3D NMR Experiment to Correlate Amide-Proton and Nitrogen Resonances With the Alpha- And Beta-Carbon Resonances in Proteins. J. Magn. Reson. B 1993, 101, 201–205. 10.1006/jmrb.1993.1033. [DOI] [Google Scholar]
- Linser R.; Fink U.; Reif B. Narrow Carbonyl Resonances in Proton-Diluted Proteins Facilitate NMR Assignments in the Solid-State. J. Biomol. NMR 2010, 47, 1–6. 10.1007/s10858-010-9404-1. [DOI] [PubMed] [Google Scholar]
- Barbet-Massin E.; Pell A. J.; Retel J. S.; Andreas L. B.; Jaudzems K.; Franks W. T.; Nieuwkoop A. J.; Hiller M.; Higman V.; Guerry P.; et al. Rapid Proton-Detected NMR Assignment for Proteins With Fast Magic Angle Spinning. J. Am. Chem. Soc. 2014, 136, 12489–12497. 10.1021/ja507382j. [DOI] [PMC free article] [PubMed] [Google Scholar]
- Xiang S.; Biernat J.; Mandelkow E.; Becker S.; Linser R. Backbone assignment for minimal protein amounts of low structural homogeneity in the absence of deuteration. Chem. Commun. 2016, 52, 4002–4005. 10.1039/C5CC09160H. [DOI] [PubMed] [Google Scholar]
- Andreas L. B.; Stanek J.; Le Marchand T.; Bertarello A.; Paepe D. C.-D.; Lalli D.; Krejčíková M.; Doyen C.; Öster C.; Knott B.; et al. Protein Residue Linking in a Single Spectrum for Magic-Angle Spinning NMR Assignment. J. Biomol. NMR 2015, 62, 253–261. 10.1007/s10858-015-9956-1. [DOI] [PubMed] [Google Scholar]
- Xiang S.; Grohe K.; Rovó P.; Vasa S. K.; Giller K.; Becker S.; Linser R. Sequential Backbone Assignment Based on Dipolar Amide-to-Amide Correlation Experiments. J. Biomol. NMR 2015, 62, 303–311. 10.1007/s10858-015-9945-4. [DOI] [PubMed] [Google Scholar]
- Xiang S.; Chevelkov V.; Becker S.; Lange A. Towards Automatic Protein Backbone Assignment Using Proton-Detected 4D Solid-State NMR Data. J. Biomol. NMR 2014, 60, 85–90. 10.1007/s10858-014-9859-6. [DOI] [PubMed] [Google Scholar]
- Vasa S. K.; Singh H.; Rovó P.; Linser R. Dynamics and Interactions of a 29 kDa Human Enzyme Studied by Solid-State NMR. J. Phys. Chem. Lett. 2018, 9, 1307–1311. 10.1021/acs.jpclett.8b00110. [DOI] [PubMed] [Google Scholar]
- Klein A.; Rovó P.; Sakhrani V. V.; Wang Y.; Holmes J. B.; Liu V.; Skowronek P.; Kukuk L.; Vasa S. K.; Güntert P.; et al. Atomic-Resolution Chemical Characterization of (2×)72-kDa Tryptophan Synthase via Four- and Five-dimensional 1H-detected Solid-State NMR. Proc. Natl. Acad. Sci. U. S. A. 2022, 119, e2114690119. 10.1073/pnas.2114690119. [DOI] [PMC free article] [PubMed] [Google Scholar]
- Vasa S. K.; Rovó P.; Giller K.; Becker S.; Linser R. Access to aliphatic protons as reporters in non-deuterated proteins by solid-state NMR. Phys. Chem. Chem. Phys. 2016, 18, 8359–8363. 10.1039/C5CP06601H. [DOI] [PubMed] [Google Scholar]
- Najbauer E. E.; Andreas L. B. Correcting for Magnetic Field Drift in Magic-Angle Spinning NMR Datasets. J. Magn. Reson. 2019, 305, 1–4. 10.1016/j.jmr.2019.05.005. [DOI] [PubMed] [Google Scholar]
- Římal V.; Callon M.; Malär A. A.; Cadalbert R.; Torosyan A.; Wiegand T.; Ernst M.; Böckmann A.; Meier B. H. Correction of Field Instabilities in Biomolecular Solid-State NMR by Simultaneous Acquisition of a Frequency Reference. Magn. Reson. 2022, 3, 15–26. 10.5194/mr-3-15-2022. [DOI] [PMC free article] [PubMed] [Google Scholar]
- Malär A. A.; Völker L. A.; Cadalbert R.; Lecoq L.; Ernst M.; Böckmann A.; Meier B. H.; Wiegand T. Temperature-Dependent Solid-State NMR Proton Chemical-Shift Values and Hydrogen Bonding. J. Phys. Chem. B 2021, 125, 6222–6230. 10.1021/acs.jpcb.1c04061. [DOI] [PMC free article] [PubMed] [Google Scholar]
- Sharma K.; Madhu P. K.; Mote K. R. A Suite of Pulse Sequences Based on Multiple Sequential Acquisitions at One and Two Radiofrequency Channels for Solid-State Magic-Angle Spinning NMR Studies of Proteins. J. Biomol. NMR 2016, 65, 127–141. 10.1007/s10858-016-0043-z. [DOI] [PubMed] [Google Scholar]
- Sharma K.; Madhu P. K.; Agarwal V.; Mote K. R. Simultaneous Recording of Intra- And Inter-Residue Linking Experiments for Backbone Assignments in Proteins at MAS Frequencies Higher Than 60 kHz. J. Biomol. NMR 2020, 74, 229–237. 10.1007/s10858-019-00292-y. [DOI] [PubMed] [Google Scholar]
- Schmidt E.; Güntert P. A New Algorithm for Reliable and General NMR Resonance Assignment. J. Am. Chem. Soc. 2012, 134, 12817–12829. 10.1021/ja305091n. [DOI] [PubMed] [Google Scholar]
- Hardy E. H.; Verel R.; Meier B. H. Fast MAS Total Through-Bond Correlation Spectroscopy. J. Magn. Reson. 2001, 148, 459–464. 10.1006/jmre.2000.2258. [DOI] [PubMed] [Google Scholar]
- Asami S.; Reif B. Assignment Strategies for Aliphatic Protons in the Solid-State in Randomly Protonated Proteins. J. Biomol. NMR 2012, 52, 31–39. 10.1007/s10858-011-9591-4. [DOI] [PubMed] [Google Scholar]
- Linser R. Side-Chain to Backbone Correlations From Solid-State NMR of Perdeuterated Proteins Through Combined Excitation and Long-Range Magnetization Transfers. J. Biomol. NMR 2011, 51, 221–226. 10.1007/s10858-011-9531-3. [DOI] [PubMed] [Google Scholar]
- Daskalov A.; Martinez D.; Coustou V.; El Mammeri N.; Berbon M.; Andreas L. B.; Bardiaux B.; Stanek J.; Noubhani A.; Kauffmann B.; et al. Structural and Molecular Basis of Cross-Seeding Barriers in Amyloids. Proc. Natl. Acad. Sci. U.S.A. 2021, 118, e2014085118 10.1073/pnas.2014085118. [DOI] [PMC free article] [PubMed] [Google Scholar]
- Wang S.; Fogeron M.-L.; Schledorn M.; Dujardin M.; Penzel S.; Burdette D.; Berke J. M.; Nassal M.; Lecoq L.; Meier B. H.; et al. Combining Cell-Free Protein Synthesis and NMR Into a Tool to Study Capsid Assembly Modulation. Front. Mol. Biosci. 2019, 6, 67. 10.3389/fmolb.2019.00067. [DOI] [PMC free article] [PubMed] [Google Scholar]
- Schubeis T.; Yuan P.; Ahmed M.; Nagaraj M.; van Rossum B.-J.; Ritter C. Untangling a Repetitive Amyloid Sequence: Correlating Biofilm-Derived and Segmentally Labeled Curli Fimbriae by Solid-State NMR Spectroscopy. Angew. Chem., Int. Ed. 2015, 54, 14669–14672. 10.1002/anie.201506772. [DOI] [PubMed] [Google Scholar]
- Schubeis T.; Lührs T.; Ritter C. Unambiguous Assignment of Short- And Long-Range Structural Restraints by Solid-State NMR Spectroscopy With Segmental Isotope Labeling. ChemBioChem. 2015, 16, 51–54. 10.1002/cbic.201402446. [DOI] [PubMed] [Google Scholar]
- Gupta S.; Tycko R. Segmental Isotopic Labeling of HIV-1 Capsid Protein Assemblies for Solid State NMR. J. Biomol. NMR 2018, 70, 103–114. 10.1007/s10858-017-0162-1. [DOI] [PMC free article] [PubMed] [Google Scholar]
- Wiegand T.; Cadalbert R.; von Schroetter C.; Allain F. H.-T.; Meier B. H. Segmental Isotope Labelling and Solid-State NMR of a 12 × 59 kDa Motor Protein: Identification of Structural Variability. J. Biomol. NMR 2018, 71, 237–245. 10.1007/s10858-018-0196-z. [DOI] [PubMed] [Google Scholar]
- Frederick K. K.; Michaelis V. K.; Caporini M. A.; Andreas L. B.; Debelouchina G. T.; Griffin R. G.; Lindquist S. Combining DNP NMR With Segmental and Specific Labeling to Study a Yeast Prion Protein Strain That Is Not Parallel in-Register. Proc. Natl. Acad. Sci. U.S.A. 2017, 114, 3642–3647. 10.1073/pnas.1619051114. [DOI] [PMC free article] [PubMed] [Google Scholar]
- Lacabanne D.; Meier B. H.; Böckmann A. Selective Labeling and Unlabeling Strategies in Protein Solid-State NMR Spectroscopy. J. Biomol. NMR 2018, 71, 141–150. 10.1007/s10858-017-0156-z. [DOI] [PubMed] [Google Scholar]
- Gauto D. F.; Estrozi L. F.; Schwieters C. D.; Effantin G.; Macek P.; Sounier R.; Sivertsen A. C.; Schmidt E.; Kerfah R.; Mas G.; et al. Integrated NMR and Cryo-Em Atomic-Resolution Structure Determination of a Half-Megadalton Enzyme Complex. Nat. Commun. 2019, 10, 2697. 10.1038/s41467-019-10490-9. [DOI] [PMC free article] [PubMed] [Google Scholar]
- Johansen N. T.; Bonaccorsi M.; Bengtsen T.; Larsen A. H.; Tidemand F. G.; Pedersen M. C.; Huda P.; Berndtsson J.; Darwish T.; Yepuri N. R.; et al. Mg2+-dependent Conformational Equilibria in CorA and an Integrated View on Transport Regulation. eLife 2022, 11, e71887 10.7554/eLife.71887. [DOI] [PMC free article] [PubMed] [Google Scholar]
- Najbauer E. E.; Tekwani Movellan K.; Giller K.; Benz R.; Becker S.; Griesinger C.; Andreas L. B. Structure and Gating Behavior of the Human Integral Membrane Protein VDAC1 in a Lipid Bilayer. J. Am. Chem. Soc. 2022, 144, 2953. 10.1021/jacs.1c09848. [DOI] [PMC free article] [PubMed] [Google Scholar]
- Eddy M. T.; Su Y.; Silvers R.; Andreas L.; Clark L.; Wagner G.; Pintacuda G.; Emsley L.; Griffin R. G. Lipid Bilayer-Bound Conformation of an Integral Membrane Beta Barrel Protein by Multidimensional MAS NMR. J. Biomol. NMR 2015, 61, 299–310. 10.1007/s10858-015-9903-1. [DOI] [PMC free article] [PubMed] [Google Scholar]
- Retel J. S.; Nieuwkoop A. J.; Hiller M.; Higman V. A.; Barbet-Massin E.; Stanek J.; Andreas L. B.; Franks W. T.; van Rossum B.-J.; Vinothkumar K. R.; et al. Structure of Outer Membrane Protein G in Lipid Bilayers. Nat. Commun. 2017, 8, 2073. 10.1038/s41467-017-02228-2. [DOI] [PMC free article] [PubMed] [Google Scholar]
- Lalli D.; Idso M. N.; Andreas L. B.; Hussain S.; Baxter N.; Han S.; Chmelka B. F.; Pintacuda G. Proton-Based Structural Analysis of a Heptahelical Transmembrane Protein in Lipid Bilayers. J. Am. Chem. Soc. 2017, 139, 13006–13012. 10.1021/jacs.7b05269. [DOI] [PMC free article] [PubMed] [Google Scholar]
- Schubeis T.; Schwarzer T. S.; Le Marchand T.; Stanek J.; Movellan K. T.; Castiglione K.; Pintacuda G.; Andreas L. B. Resonance Assignment of the Outer Membrane Protein AlkL in Lipid Bilayers by Proton-Detected Solid-State NMR. Biomol. NMR Assign. 2020, 14, 295–300. 10.1007/s12104-020-09964-5. [DOI] [PubMed] [Google Scholar]
- Shi C.; Öster C.; Bohg C.; Li L.; Lange S.; Chevelkov V.; Lange A. Structure and Dynamics of the Rhomboid Protease GlpG in Liposomes Studied by Solid-State NMR. J. Am. Chem. Soc. 2019, 141, 17314–17321. 10.1021/jacs.9b08952. [DOI] [PubMed] [Google Scholar]
- Jekhmane S.; Medeiros-Silva J.; Li J.; Kümmerer F.; Müller-Hermes C.; Baldus M.; Roux B.; Weingarth M. Shifts in the Selectivity Filter Dynamics Cause Modal Gating in K+ Channels. Nat. Commun. 2019, 10, 123. 10.1038/s41467-018-07973-6. [DOI] [PMC free article] [PubMed] [Google Scholar]
- Stöppler D.; Macpherson A.; Smith-Penzel S.; Basse N.; Lecomte F.; Deboves H.; Taylor R. D.; Norman T.; Porter J.; Waters L. C.; et al. Insight Into Small Molecule Binding to the Neonatal Fc Receptor by X-Ray Crystallography and 100 kHz Magic-Angle-Spinning NMR. PLOS Biol. 2018, 16, e2006192. 10.1371/journal.pbio.2006192. [DOI] [PMC free article] [PubMed] [Google Scholar]
- Shi C.; Fricke P.; Lin L.; Chevelkov V.; Wegstroth M.; Giller K.; Becker S.; Thanbichler M.; Lange A. Atomic-Resolution Structure of Cytoskeletal Bactofilin by Solid-State NMR. Sci. Adv. 2015, 1, e1501087 10.1126/sciadv.1501087. [DOI] [PMC free article] [PubMed] [Google Scholar]
- Le Marchand T.; De Rosa M.; Salvi N.; Sala B. M.; Andreas L. B.; Barbet-Massin E.; Sormanni P.; Barbiroli A.; Porcari R.; Sousa Mota C.; et al. Conformational Dynamics in Crystals Reveal the Molecular Bases for D76N Beta-2 Microglobulin Aggregation Propensity. Nat. Commun. 2018, 9, 1658. 10.1038/s41467-018-04078-y. [DOI] [PMC free article] [PubMed] [Google Scholar]
- Linser R.; Bardiaux B.; Higman V.; Fink U.; Reif B. Structure Calculation From Unambiguous Long-Range Amide and Methyl 1H–1H Distance Restraints for a Microcrystalline Protein With MAS Solid-State NMR Spectroscopy. J. Am. Chem. Soc. 2011, 133, 5905–5912. 10.1021/ja110222h. [DOI] [PubMed] [Google Scholar]
- Huber M.; Böckmann A.; Hiller S.; Meier B. H. 4D Solid-State NMR for Protein Structure Determination. Phys. Chem. Chem. Phys. 2012, 14, 5239–5246. 10.1039/c2cp23872a. [DOI] [PubMed] [Google Scholar]
- Wittmann J. J.; Agarwal V.; Hellwagner J.; Lends A.; Cadalbert R.; Meier B. H.; Ernst M. Accelerating Proton Spin Diffusion in Perdeuterated Proteins at 100 kHz MAS. J. Biomol. NMR 2016, 66, 233–242. 10.1007/s10858-016-0071-8. [DOI] [PubMed] [Google Scholar]
- Jain M. G.; Lalli D.; Stanek J.; Gowda C.; Prakash S.; Schwarzer T. S.; Schubeis T.; Castiglione K.; Andreas L. B.; Madhu P. K.; et al. Selective 1H–1H Distance Restraints in Fully Protonated Proteins by Very Fast Magic-Angle Spinning Solid-State NMR. J. Phys. Chem. Lett. 2017, 8, 2399–2405. 10.1021/acs.jpclett.7b00983. [DOI] [PubMed] [Google Scholar]
- Zhang Z.; Oss A.; Org M.-L.; Samoson A.; Li M.; Tan H.; Su Y.; Yang J. Selectively Enhanced 1H–1H Correlations in Proton-Detected Solid-State NMR Under Ultrafast MAS Conditions. J. Phys. Chem. Lett. 2020, 11, 8077–8083. 10.1021/acs.jpclett.0c02412. [DOI] [PubMed] [Google Scholar]
- Xiao H.; Zhang Z.; Yang J. Theory of Frequency-Selective Homonuclear Dipolar Recoupling in Solid-State NMR. J. Chem. Phys. 2021, 155, 174105. 10.1063/5.0065396. [DOI] [PubMed] [Google Scholar]
- Duong N. T.; Raran-Kurussi S.; Nishiyama Y.; Agarwal V. Quantitative 1H–1H Distances in Protonated Solids by Frequency-Selective Recoupling at Fast Magic-Angle Spinning NMR. J. Phys. Chem. Lett. 2018, 9, 5948–5954. 10.1021/acs.jpclett.8b02189. [DOI] [PubMed] [Google Scholar]
- Paravastu A. K.; Tycko R. Frequency-Selective Homonuclear Dipolar Recoupling in Solid State NMR. J. Chem. Phys. 2006, 124, 194303. 10.1063/1.2192516. [DOI] [PMC free article] [PubMed] [Google Scholar]
- De Paëpe G.; Lewandowski J. R.; Griffin R. G. Spin Dynamics in the Modulation Frame: Application to Homonuclear Recoupling in Magic Angle Spinning Solid-State NMR. J. Chem. Phys. 2008, 128, 124503. 10.1063/1.2834732. [DOI] [PubMed] [Google Scholar]
- Bayro M. J.; Maly T.; Birkett N. R.; Dobson C. M.; Griffin R. G. Long-Range Correlations Between Aliphatic 13C Nuclei in Protein MAS NMR Spectroscopy. Angew. Chem., Int. Ed. 2009, 48, 5708–5710. 10.1002/anie.200901520. [DOI] [PMC free article] [PubMed] [Google Scholar]
- Potnuru L. R.; Duong N. T.; Ahlawat S.; Raran-Kurussi S.; Ernst M.; Nishiyama Y.; Agarwal V. Accuracy of 1H–1H Distances Measured using Frequency Selective Recoupling and Fast Magic-Angle Spinning. J. Chem. Phys. 2020, 153, 084202. 10.1063/5.0019717. [DOI] [PubMed] [Google Scholar]
- Levitt M. H.Symmetry-Based Pulse Sequences in Magic-Angle Spinning Solid-State NMR. In Encyclopedia of Nuclear Magnetic Resonance; Harris R. K., Wasylishen R. L., Eds.; John Wiley & Sons, Ltd.: Chichester, UK, 2007; Vol. 9; pp 165–196. [Google Scholar]
- Potnuru L. R.; Duong N. T.; Sasank B.; Raran-Kurussi S.; Nishiyama Y.; Agarwal V. Selective 1H–1H Recoupling via Symmetry Sequences in Fully Protonated Samples at Fast Magic Angle Spinning. J. Magn. Reson. 2021, 328, 107004. 10.1016/j.jmr.2021.107004. [DOI] [PubMed] [Google Scholar]
- Nimerovsky E.; Najbauer E. E.; Movellan K. T.; Xue K.; Becker S.; Andreas L. B. Modest Offset Difference Internuclear Selective Transfer via Homonuclear Dipolar Coupling. J. Phys. Chem. Lett. 2022, 13, 1540–1546. 10.1021/acs.jpclett.1c03871. [DOI] [PMC free article] [PubMed] [Google Scholar]
- Linser R.; Bardiaux B.; Andreas L. B.; Hyberts S. G.; Morris V. K.; Pintacuda G.; Sunde M.; Kwan A. H.; Wagner G. Solid-State NMR Structure Determination From Diagonal-Compensated, Sparsely Nonuniform-Sampled 4D Proton-Proton Restraints. J. Am. Chem. Soc. 2014, 136, 11002–11010. 10.1021/ja504603g. [DOI] [PMC free article] [PubMed] [Google Scholar]
- Xue K.; Tekwani Movellan K.; Andreas L. B. Orphan Spin Operator Diagonal Suppression. J. Magn. Reson. Open 2022, 10–11, 100025. 10.1016/j.jmro.2021.100025. [DOI] [Google Scholar]
- Vögeli B.; Segawa T. F.; Leitz D.; Sobol A.; Choutko A.; Trzesniak D.; van Gunsteren W.; Riek R. Exact Distances and Internal Dynamics of Perdeuterated Ubiquitin From NOE Buildups. J. Am. Chem. Soc. 2009, 131, 17215–17225. 10.1021/ja905366h. [DOI] [PubMed] [Google Scholar]
- Grohe K.; Nimerovsky E.; Singh H.; Vasa S. K.; Söldner B.; Vögeli B.; Rienstra C. M.; Linser R. Exact distance measurements for structure and dynamics in solid proteins by fast-magic-angle-spinning NMR. Chem. Commun. 2019, 55, 7899–7902. 10.1039/C9CC02317H. [DOI] [PMC free article] [PubMed] [Google Scholar]
- Huang K.-Y.; Siemer A. B.; McDermott A. E. Homonuclear Mixing Sequences for Perdeuterated Proteins. J. Magn. Reson. 2011, 208, 122–127. 10.1016/j.jmr.2010.10.015. [DOI] [PMC free article] [PubMed] [Google Scholar]
- Szeverenyi N. M.; Sullivan M. J.; Maciel G. E. Observation of Spin Exchange by Two-Dimensional Fourier Transform 13C Cross Polarization-Magic-Angle Spinning. J. Magn. Reson. 1982, 47, 462–475. 10.1016/0022-2364(82)90213-X. [DOI] [Google Scholar]
- Scholz I.; Huber M.; Manolikas T.; Meier B. H.; Ernst M. MIRROR Recoupling and Its Application to Spin Diffusion Under Fast Magic-Angle Spinning. Chem. Phys. Lett. 2008, 460, 278–283. 10.1016/j.cplett.2008.05.058. [DOI] [Google Scholar]
- Weingarth M.; Demco D. E.; Bodenhausen G.; Tekely P. Improved Magnetization Transfer in Solid-State NMR With Fast Magic Angle Spinning. Chem. Phys. Lett. 2009, 469, 342–348. 10.1016/j.cplett.2008.12.084. [DOI] [Google Scholar]
- Lewandowski J. R.; De Paëpe G.; Eddy M. T.; Struppe J.; Maas W.; Griffin R. G. Proton Assisted Recoupling at High Spinning Frequencies. J. Phys. Chem. B 2009, 113, 9062–9069. 10.1021/jp810280t. [DOI] [PMC free article] [PubMed] [Google Scholar]
- Giffard M.; Hediger S.; Lewandowski J. R.; Bardet M.; Simorre J.-P.; Griffin R. G.; De Paëpe G. Compensated second-order recoupling: application to third spin assisted recoupling. Phys. Chem. Chem. Phys. 2012, 14, 7246–7255. 10.1039/c2cp40406k. [DOI] [PMC free article] [PubMed] [Google Scholar]
- Donovan K. J.; Jain S. K.; Silvers R.; Linse S.; Griffin R. G. Proton-Assisted Recoupling (PAR) in Peptides and Proteins. J. Phys. Chem. B 2017, 121, 10804–10817. 10.1021/acs.jpcb.7b08934. [DOI] [PMC free article] [PubMed] [Google Scholar]
- Hu B.; Lafon O.; Trébosc J.; Chen Q.; Amoureux J.-P. Broad-Band Homo-Nuclear Correlations Assisted by 1H Irradiation for Bio-Molecules in Very High Magnetic Field at Fast and Ultra-Fast MAS Frequencies. J. Magn. Reson. 2011, 212, 320–329. 10.1016/j.jmr.2011.07.011. [DOI] [PubMed] [Google Scholar]
- Lewandowski J. R.; Paëpe G. D.; Eddy M. T.; Griffin R. G. 15N–15N Proton Assisted Recoupling in Magic Angle Spinning NMR. J. Am. Chem. Soc. 2009, 131, 5769–5776. 10.1021/ja806578y. [DOI] [PMC free article] [PubMed] [Google Scholar]
- Donovan K. J.; Silvers R.; Linse S.; Griffin R. G. 3D MAS NMR Experiment Utilizing Through-Space 15N–15N Correlations. J. Am. Chem. Soc. 2017, 139, 6518–6521. 10.1021/jacs.7b01159. [DOI] [PMC free article] [PubMed] [Google Scholar]
- Friedrich D.; Perodeau J.; Nieuwkoop A. J.; Oschkinat H. MAS NMR Detection of Hydrogen Bonds for Protein Secondary Structure Characterization. J. Biomol. NMR 2020, 74, 247–256. 10.1007/s10858-020-00307-z. [DOI] [PMC free article] [PubMed] [Google Scholar]
- Ghosh M.; Rienstra C. M. 1H-Detected REDOR With Fast Magic-Angle Spinning of a Deuterated Protein. J. Phys. Chem. B 2017, 121, 8503–8511. 10.1021/acs.jpcb.7b07313. [DOI] [PMC free article] [PubMed] [Google Scholar]
- Zhang X. C.; Forster M. C.; Nimerovsky E.; Movellan K. T.; Andreas L. B. Transferred-Rotational-Echo Double Resonance. J. Phys. Chem. A 2021, 125, 754–769. 10.1021/acs.jpca.0c09033. [DOI] [PMC free article] [PubMed] [Google Scholar]
- Nadaud P. S.; Helmus J. J.; Höfer N.; Jaroniec C. P. Long-Range Structural Restraints in Spin-Labeled Proteins Probed by Solid-State Nuclear Magnetic Resonance Spectroscopy. J. Am. Chem. Soc. 2007, 129, 7502–7503. 10.1021/ja072349t. [DOI] [PubMed] [Google Scholar]
- Balayssac S.; Bertini I.; Lelli M.; Luchinat C.; Maletta M. Paramagnetic Ions Provide Structural Restraints in Solid-State NMR of Proteins. J. Am. Chem. Soc. 2007, 129, 2218–2219. 10.1021/ja068105a. [DOI] [PubMed] [Google Scholar]
- Balayssac S.; Bertini I.; Bhaumik A.; Lelli M.; Luchinat C. Paramagnetic Shifts in Solid-State NMR of Proteins to Elicit Structural Information. Proc. Natl. Acad. Sci. U. S. A. 2008, 105, 17284–17289. 10.1073/pnas.0708460105. [DOI] [PMC free article] [PubMed] [Google Scholar]
- Knight M. J.; Felli I. C.; Pierattelli R.; Bertini I.; Emsley L.; Herrmann T.; Pintacuda G. Rapid Measurement of Pseudocontact Shifts in Metalloproteins by Proton-Detected Solid-State NMR Spectroscopy. J. Am. Chem. Soc. 2012, 134, 14730–14733. 10.1021/ja306813j. [DOI] [PubMed] [Google Scholar]
- Zhou D. H.; Shea J. J.; Nieuwkoop A. J.; Franks W. T.; Wylie B. J.; Mullen C.; Sandoz D.; Rienstra C. M. Solid-State Protein-Structure Determination With Proton-Detected Triple-Resonance 3D Magic-Angle-Spinning NMR Spectroscopy. Angew. Chem., Int. Ed. 2007, 46, 8380–8383. 10.1002/anie.200702905. [DOI] [PMC free article] [PubMed] [Google Scholar]
- Vasa S. K.; Singh H.; Grohe K.; Linser R. Assessment of a Large Enzyme–Drug Complex by Proton-Detected Solid-State NMR Spectroscopy Without Deuteration. Angew. Chem., Int. Ed. 2019, 58, 5758–5762. 10.1002/anie.201811714. [DOI] [PubMed] [Google Scholar]
- Zinke M.; Sachowsky K. A. A.; Öster C.; Zinn-Justin S.; Ravelli R.; Schröder G. F.; Habeck M.; Lange A. Architecture of the Flexible Tail Tube of Bacteriophage SPP1. Nat. Commun. 2020, 11, 5759. 10.1038/s41467-020-19611-1. [DOI] [PMC free article] [PubMed] [Google Scholar]
- Castellani F.; van Rossum B.; Diehl A.; Schubert M.; Rehbein K.; Oschkinat H. Structure of a Protein Determined by Solid-State Magic-Angle-Spinning NMR Spectroscopy. Nature 2002, 420, 99–102. 10.1038/nature01070. [DOI] [PubMed] [Google Scholar]
- Loquet A.; Sgourakis N. G.; Gupta R.; Giller K.; Riedel D.; Goosmann C.; Griesinger C.; Kolbe M.; Baker D.; Becker S.; et al. Atomic Model of the Type III Secretion System Needle. Nature 2012, 486, 276–279. 10.1038/nature11079. [DOI] [PMC free article] [PubMed] [Google Scholar]
- Wasmer C.; Lange A.; Van Melckebeke H.; Siemer A. B.; Riek R.; Meier B. H. Amyloid Fibrils of the HET-s(218–289) Prion Form a β-Solenoid With a Triangular Hydrophobic Core. Science 2008, 319, 1523–1526. 10.1126/science.1151839. [DOI] [PubMed] [Google Scholar]
- Paravastu A. K.; Leapman R. D.; Yau W.-M.; Tycko R. Molecular Structural Basis for Polymorphism in Alzheimer’s β-Amyloid Fibrils. Proc. Natl. Acad. Sci. U.S.A. 2008, 105, 18349–18354. 10.1073/pnas.0806270105. [DOI] [PMC free article] [PubMed] [Google Scholar]
- Wang S.; Munro R. A.; Shi L.; Kawamura I.; Okitsu T.; Wada A.; Kim S.-Y.; Jung K.-H.; Brown L. S.; Ladizhansky V. Solid-State NMR Spectroscopy Structure Determination of a Lipid-Embedded Heptahelical Membrane Protein. Nat. Methods 2013, 10, 1007–1012. 10.1038/nmeth.2635. [DOI] [PubMed] [Google Scholar]
- Koehler J.; Meiler J. Expanding the Utility of NMR Restraints with Paramagnetic Compounds: Background and Practical Aspects. Prog. Nucl. Magn. Reson. Spectrosc. 2011, 59, 360–389. 10.1016/j.pnmrs.2011.05.001. [DOI] [PMC free article] [PubMed] [Google Scholar]
- Sengupta I.; Nadaud P. S.; Helmus J. J.; Schwieters C. D.; Jaroniec C. P. Protein Fold Determined by Paramagnetic Magic-Angle Spinning Solid-State NMR Spectroscopy. Nat. Chem. 2012, 4, 410–417. 10.1038/nchem.1299. [DOI] [PMC free article] [PubMed] [Google Scholar]
- Nadaud P. S.; Sengupta I.; Helmus J. J.; Jaroniec C. P. Evaluation of the Influence of Intermolecular Electron-Nucleus Couplings and Intrinsic Metal Binding Sites on the Measurement of 15N Longitudinal Paramagnetic Relaxation Enhancements in Proteins by Solid-State NMR. J. Biomol. NMR 2011, 51, 293. 10.1007/s10858-011-9536-y. [DOI] [PubMed] [Google Scholar]
- Luchinat C.; Parigi G.; Ravera E.; Rinaldelli M. Solid-State NMR Crystallography through Paramagnetic Restraints. J. Am. Chem. Soc. 2012, 134, 5006–5009. 10.1021/ja210079n. [DOI] [PubMed] [Google Scholar]
- Perez A.; Gaalswyk K.; Jaroniec C. P.; MacCallum J. L. High Accuracy Protein Structures from Minimal Sparse Paramagnetic Solid-State NMR Restraints. Angew. Chem., Int. Ed. 2019, 58, 6564–6568. 10.1002/anie.201811895. [DOI] [PubMed] [Google Scholar]
- Güntert P.; Mumenthaler C.; Wüthrich K. Torsion Angle Dynamics for NMR Structure Calculation With the New Program Dyana. J. Mol. Biol. 1997, 273, 283–298. 10.1006/jmbi.1997.1284. [DOI] [PubMed] [Google Scholar]
- Herrmann T.; Güntert P.; Wüthrich K. Protein NMR Structure Determination With Automated NOE Assignment Using the New Software CANDID and the Torsion Angle Dynamics Algorithm DYANA. J. Mol. Biol. 2002, 319, 209–227. 10.1016/S0022-2836(02)00241-3. [DOI] [PubMed] [Google Scholar]
- Rieping W.; Habeck M.; Bardiaux B.; Bernard A.; Malliavin T. E.; Nilges M. ARIA2: Automated NOE Assignment and Data Integration in NMR Structure Calculation. Bioinformatics 2007, 23, 381–382. 10.1093/bioinformatics/btl589. [DOI] [PubMed] [Google Scholar]
- Schwieters C. D.; Kuszewski J. J.; Tjandra N.; Marius Clore G. The XPLOR-NIH NMR Molecular Structure Determination Package. J. Magn. Reson. 2003, 160, 65–73. 10.1016/S1090-7807(02)00014-9. [DOI] [PubMed] [Google Scholar]
- Shen Y.; Delaglio F.; Cornilescu G.; Bax A. TALOS+: A Hybrid Method for Predicting Protein Backbone Torsion Angles From NMR Chemical Shifts. J. Biomol. NMR 2009, 44, 213–223. 10.1007/s10858-009-9333-z. [DOI] [PMC free article] [PubMed] [Google Scholar]
- Henzler-Wildman K.; Kern D. Dynamic Personalities of Proteins. Nature 2007, 450, 964–972. 10.1038/nature06522. [DOI] [PubMed] [Google Scholar]
- Lewandowski J. R.; Halse M. E.; Blackledge M.; Emsley L. Direct Observation of Hierarchical Protein Dynamics. Science 2015, 348, 578–581. 10.1126/science.aaa6111. [DOI] [PubMed] [Google Scholar]
- Giraud N.; Blackledge M.; Goldman M.; Böckmann A.; Lesage A.; Penin F.; Emsley L. Quantitative Analysis of Backbone Dynamics in a Crystalline Protein From Nitrogen-15 Spin-Lattice Relaxation. J. Am. Chem. Soc. 2005, 127, 18190–18201. 10.1021/ja055182h. [DOI] [PubMed] [Google Scholar]
- Paluch P.; Pawlak T.; Ławniczak K.; Trébosc J.; Lafon O.; Amoureux J.-P.; Potrzebowski M. J. Simple and Robust Study of Backbone Dynamics of Crystalline Proteins Employing 1H–15N Dipolar Coupling Dispersion. J. Phys. Chem. B 2018, 122, 8146–8156. 10.1021/acs.jpcb.8b04557. [DOI] [PubMed] [Google Scholar]
- Chevelkov V.; Diehl A.; Reif B. Measurement of 15N T1 Relaxation Rates in a Perdeuterated Protein by Magic Angle Spinning Solid-State Nuclear Magnetic Resonance Spectroscopy. J. Chem. Phys. 2008, 128, 052316. 10.1063/1.2819311. [DOI] [PubMed] [Google Scholar]
- Haller J. D.; Schanda P. Amplitudes and Time Scales of Picosecond-to-Microsecond Motion in Proteins Studied by Solid-State NMR: A Critical Evaluation of Experimental Approaches and Application to Crystalline Ubiquitin. J. Biomol. NMR 2013, 57, 263–280. 10.1007/s10858-013-9787-x. [DOI] [PMC free article] [PubMed] [Google Scholar]
- Asami S.; Porter J. R.; Lange O. F.; Reif B. Access to Cα Backbone Dynamics of Biological Solids by 13C T1 Relaxation and Molecular Dynamics Simulation. J. Am. Chem. Soc. 2015, 137, 1094–1100. 10.1021/ja509367q. [DOI] [PubMed] [Google Scholar]
- Tognetti J.; Trent Franks W.; Gallo A.; Lewandowski J. R. Accelerating 15N and 13C R1 and R1ρ Relaxation Measurements by Multiple Pathway Solid-State NMR Experiments. J. Magn. Reson. 2021, 331, 107049. 10.1016/j.jmr.2021.107049. [DOI] [PubMed] [Google Scholar]
- del Amo J. M. L.; Agarwal V.; Sarkar R.; Porter J.; Asami S.; Rübbelke M.; Fink U.; Xue Y.; Lange O. F.; Reif B. Site-Specific Analysis of Heteronuclear Overhauser Effects in Microcrystalline Proteins. J. Biomol. NMR 2014, 59, 241–249. 10.1007/s10858-014-9843-1. [DOI] [PubMed] [Google Scholar]
- Krushelnitsky A.; Zinkevich T.; Reichert D.; Chevelkov V.; Reif B. Microsecond Time Scale Mobility in a Solid Protein as Studied by the 15N R1ρ Site-Specific NMR Relaxation Rates. J. Am. Chem. Soc. 2010, 132, 11850–11853. 10.1021/ja103582n. [DOI] [PubMed] [Google Scholar]
- Lewandowski J. R.; Sass H. J.; Grzesiek S.; Blackledge M.; Emsley L. Site-Specific Measurement of Slow Motions in Proteins. J. Am. Chem. Soc. 2011, 133, 16762–16765. 10.1021/ja206815h. [DOI] [PubMed] [Google Scholar]
- Lamley J. M.; Öster C.; Stevens R. A.; Lewandowski J. R. Intermolecular Interactions and Protein Dynamics by Solid-State NMR Spectroscopy. Angew. Chem., Int. Ed. 2015, 54, 15374–15378. 10.1002/anie.201509168. [DOI] [PMC free article] [PubMed] [Google Scholar]
- Gauto D. F.; Hessel A.; Rovó P.; Kurauskas V.; Linser R.; Schanda P. Protein Conformational Dynamics Studied by 15N and 1H R1ρ Relaxation Dispersion: Application to Wild-Type and G53A Ubiquitin Crystals. Solid State Nucl. Magn. Reson. 2017, 87, 86–95. 10.1016/j.ssnmr.2017.04.002. [DOI] [PMC free article] [PubMed] [Google Scholar]
- Chevelkov V.; Fink U.; Reif B. Accurate Determination of Order Parameters From 1H, 15N Dipolar Couplings in MAS Solid-State NMR Experiments. J. Am. Chem. Soc. 2009, 131, 14018–14022. 10.1021/ja902649u. [DOI] [PubMed] [Google Scholar]
- Grohe K.; Patel S.; Hebrank C.; Medina S.; Klein A.; Rovó P.; Vasa S. K.; Singh H.; Vögeli B.; Schäfer L. V.; et al. Protein Motional Details Revealed by Complementary Structural Biology Techniques. Structure 2020, 28, 1024–1034. 10.1016/j.str.2020.06.001. [DOI] [PubMed] [Google Scholar]
- Paluch P.; Pawlak T.; Amoureux J.-P.; Potrzebowski M. J. Simple and Accurate Determination of X–H Distances Under Ultra-Fast MAS NMR. J. Magn. Reson. 2013, 233, 56–63. 10.1016/j.jmr.2013.05.005. [DOI] [PubMed] [Google Scholar]
- Lorieau J.; McDermott A. E. Order Parameters Based on 13C1H, 13C1H2 and 13C1H3 Heteronuclear Dipolar Powder Patterns: A Comparison of MAS-based Solid-State NMR Sequences. Magn. Reson. Chem. 2006, 44, 334–347. 10.1002/mrc.1773. [DOI] [PubMed] [Google Scholar]
- Chevelkov V.; Xue Y.; Linser R.; Skrynnikov N. R.; Reif B. Comparison of Solid-State Dipolar Couplings and Solution Relaxation Data Provides Insight Into Protein Backbone Dynamics. J. Am. Chem. Soc. 2010, 132, 5015–5017. 10.1021/ja100645k. [DOI] [PubMed] [Google Scholar]
- Gullion T.; Schaefer J. Rotational-Echo Double-Resonance NMR. J. Magn. Reson. 1989, 81, 196–200. 10.1016/0022-2364(89)90280-1. [DOI] [PubMed] [Google Scholar]
- Schanda P.; Meier B. H.; Ernst M. Accurate Measurement of One-Bond H-X Heteronuclear Dipolar Couplings in MAS Solid-State NMR. J. Magn. Reson. 2011, 210, 246–259. 10.1016/j.jmr.2011.03.015. [DOI] [PubMed] [Google Scholar]
- Schanda P.; Meier B. H.; Ernst M. Quantitative Analysis of Protein Backbone Dynamics in Microcrystalline Ubiquitin by Solid-State NMR Spectroscopy. J. Am. Chem. Soc. 2010, 132, 15957–15967. 10.1021/ja100726a. [DOI] [PubMed] [Google Scholar]
- Ma P.; Xue Y.; Coquelle N.; Haller J. D.; Yuwen T.; Ayala I.; Mikhailovskii O.; Willbold D.; Colletier J.-P.; Skrynnikov N. R.; et al. Observing the Overall Rocking Motion of a Protein in a Crystal. Nat. Commun. 2015, 6, 8361. 10.1038/ncomms9361. [DOI] [PMC free article] [PubMed] [Google Scholar]
- Smith A. A.; Testori E.; Cadalbert R.; Meier B. H.; Ernst M. Characterization of Fibril Dynamics on Three Timescales by Solid-State NMR. J. Biomol. NMR 2016, 65, 171–191. 10.1007/s10858-016-0047-8. [DOI] [PubMed] [Google Scholar]
- Asami S.; Reif B. Comparative Study of REDOR and CPPI Derived Order Parameters by 1H-Detected MAS NMR and MD Simulations. J. Phys. Chem. B 2017, 121, 8719–8730. 10.1021/acs.jpcb.7b06812. [DOI] [PubMed] [Google Scholar]
- Zhang R.; Damron J.; Vosegaard T.; Ramamoorthy A. A Cross-Polarization Based Rotating-Frame Separated-Local-Field NMR Experiment Under Ultrafast MAS Conditions. J. Magn. Reson. 2015, 250, 37–44. 10.1016/j.jmr.2014.10.013. [DOI] [PMC free article] [PubMed] [Google Scholar]
- Park S. H.; Yang C.; Opella S. J.; Mueller L. J. Resolution and Measurement of Heteronuclear Dipolar Couplings of a Noncrystalline Protein Immobilized in a Biological Supramolecular Assembly by Proton-Detected MAS Solid-State NMR Spectroscopy. J. Magn. Reson. 2013, 237, 164–168. 10.1016/j.jmr.2013.10.009. [DOI] [PMC free article] [PubMed] [Google Scholar]
- Nishiyama Y.; Malon M.; Potrzebowski M.; Paluch P.; Amoureux J. Accurate NMR Determination of C–H or N–H Distances for Unlabeled Molecules. Solid State Nucl. Magn. Reson. 2016, 73, 15–21. 10.1016/j.ssnmr.2015.06.005. [DOI] [PubMed] [Google Scholar]
- Xue K.; Mamone S.; Koch B.; Sarkar R.; Reif B. Determination of Methyl Order Parameters Using Solid State NMR Under Off Magic Angle Spinning. J. Biomol. NMR 2019, 73, 471–475. 10.1007/s10858-019-00253-5. [DOI] [PubMed] [Google Scholar]
- Xue K.; Mühlbauer M.; Mamone S.; Sarkar R.; Reif B. Accurate Determination of 1H–15N Dipolar Couplings Using Inaccurate Settings of the Magic Angle in Solid-State NMR Spectroscopy. Angew. Chem., Int. Ed. 2019, 58, 4286–4290. 10.1002/anie.201814314. [DOI] [PubMed] [Google Scholar]
- Kurbanov R.; Zinkevich T.; Krushelnitsky A. The Nuclear Magnetic Resonance Relaxation Data Analysis in Solids: General R1/R1ρ Equations and the Model-Free Approach. J. Chem. Phys. 2011, 135, 184104. 10.1063/1.3658383. [DOI] [PubMed] [Google Scholar]
- Giraud N.; Blackledge M.; Böckmann A.; Emsley L. The Influence of Nitrogen-15 Proton-Driven Spin Diffusion on the Measurement of Nitrogen-15 Longitudinal Relaxation Times. J. Magn. Reson. 2007, 184, 51–61. 10.1016/j.jmr.2006.09.015. [DOI] [PubMed] [Google Scholar]
- Giraud N.; Sein J.; Pintacuda G.; Böckmann A.; Lesage A.; Blackledge M.; Emsley L. Observation of Heteronuclear Overhauser Effects Confirms the 15N-1H Dipolar Relaxation Mechanism in a Crystalline Protein. J. Am. Chem. Soc. 2006, 128, 12398–12399. 10.1021/ja064037g. [DOI] [PubMed] [Google Scholar]
- Chevelkov V.; Fink U.; Reif B. Quantitative Analysis of Backbone Motion in Proteins Using MAS Solid-State NMR Spectroscopy. J. Biomol. NMR 2009, 45, 197–206. 10.1007/s10858-009-9348-5. [DOI] [PubMed] [Google Scholar]
- Busi B.; Yarava J. R.; Hofstetter A.; Salvi N.; Cala-De Paepe D.; Lewandowski J. R.; Blackledge M.; Emsley L. Probing Protein Dynamics Using Multifield Variable Temperature NMR Relaxation and Molecular Dynamics Simulation. J. Phys. Chem. B 2018, 122, 9697–9702. 10.1021/acs.jpcb.8b08578. [DOI] [PubMed] [Google Scholar]
- Chevelkov V.; Diehl A.; Reif B. Quantitative Measurement of Differential 15N Hα/β T2 Relaxation Rates in a Perdeuterated Protein by MAS Solid-State NMR Spectroscopy. Magn. Reson. Chem. 2007, 45, S156–S160. 10.1002/mrc.2129. [DOI] [PubMed] [Google Scholar]
- Linser R.; Fink U.; Reif B. Assignment of Dynamic Regions in Biological Solids Enabled by Spin-State Selective NMR Experiments. J. Am. Chem. Soc. 2010, 132, 8891–3. 10.1021/ja102612m. [DOI] [PubMed] [Google Scholar]
- Kurauskas V.; Weber E.; Hessel A.; Ayala I.; Marion D.; Schanda P. Cross-Correlated Relaxation of Dipolar Coupling and Chemical-Shift Anisotropy in Magic-Angle Spinning R1ρ NMR Measurements: Application to Protein Backbone Dynamics Measurements. J. Phys. Chem. B 2016, 120, 8905–8913. 10.1021/acs.jpcb.6b06129. [DOI] [PMC free article] [PubMed] [Google Scholar]
- Lewandowski J. R.; Sein J.; Blackledge M.; Emsley L. Anisotropic Collective Motion Contributes to Nuclear Spin Relaxation in Crystalline Proteins. J. Am. Chem. Soc. 2010, 132, 1246–1248. 10.1021/ja907067j. [DOI] [PubMed] [Google Scholar]
- Wittebort R. J.; Szabo A. Theory of NMR Relaxation in Macromolecules: Restricted Diffusion and Jump Models for Multiple Internal Rotations in Amino Acid Side Chains. J. Chem. Phys. 1978, 69, 1722–1736. 10.1063/1.436748. [DOI] [Google Scholar]
- Bremi T.; Brüschweiler R. Locally Anisotropic Internal Polypeptide Backbone Dynamics by NMR Relaxation. J. Am. Chem. Soc. 1997, 119, 6672–6673. 10.1021/ja9708676. [DOI] [Google Scholar]
- Zinkevich T.; Chevelkov V.; Reif B.; Saalwächter K.; Krushelnitsky A. Internal Protein Dynamics on ps to μs Timescales as Studied by Multi-Frequency 15N Solid-State NMR Relaxation. J. Biomol. NMR 2013, 57, 219–235. 10.1007/s10858-013-9782-2. [DOI] [PubMed] [Google Scholar]
- Smith A. A.; Ernst M.; Meier B. H. Optimized “Detectors” for Dynamics Analysis in Solid-State NMR. J. Chem. Phys. 2018, 148, 045104. 10.1063/1.5013316. [DOI] [PubMed] [Google Scholar]
- Smith A. A.; Ernst M.; Riniker S.; Meier B. H. Localized and Collective Motions in HET-s(218–289) Fibrils From Combined NMR Relaxation and MD Simulation. Angew. Chem., Int. Ed. 2019, 58, 9383–9388. 10.1002/anie.201901929. [DOI] [PMC free article] [PubMed] [Google Scholar]
- Yang J.; Tasayco M. L.; Polenova T. Dynamics of Reassembled Thioredoxin Studied by Magic Angle Spinning NMR: Snapshots From Different Time Scales. J. Am. Chem. Soc. 2009, 131, 13690–13702. 10.1021/ja9037802. [DOI] [PMC free article] [PubMed] [Google Scholar]
- Rovó P.; Smith C. A.; Gauto D.; de Groot B. L.; Schanda P.; Linser R. Mechanistic Insights Into Microsecond Time-Scale Motion of Solid Proteins Using Complementary 15N and 1H Relaxation Dispersion Techniques. J. Am. Chem. Soc. 2019, 141, 858–869. 10.1021/jacs.8b09258. [DOI] [PMC free article] [PubMed] [Google Scholar]
- Öster C.; Kosol S.; Lewandowski J. R. Quantifying Microsecond Exchange in Large Protein Complexes With Accelerated Relaxation Dispersion Experiments in the Solid State. Sci. Rep. 2019, 9, 11082. 10.1038/s41598-019-47507-8. [DOI] [PMC free article] [PubMed] [Google Scholar]
- Kurauskas V.; Izmailov S. A.; Rogacheva O. N.; Hessel A.; Ayala I.; Woodhouse J.; Shilova A.; Xue Y.; Yuwen T.; Coquelle N.; et al. Slow Conformational Exchange and Overall Rocking Motion in Ubiquitin Protein Crystals. Nat. Commun. 2017, 8, 145. 10.1038/s41467-017-00165-8. [DOI] [PMC free article] [PubMed] [Google Scholar]
- Bonaccorsi M.; Knight M. J.; Le Marchand T.; Dannatt H. R. W.; Schubeis T.; Salmon L.; Felli I. C.; Emsley L.; Pierattelli R.; Pintacuda G. Multimodal Response to Copper Binding in Superoxide Dismutase Dynamics. J. Am. Chem. Soc. 2020, 142, 19660–19667. 10.1021/jacs.0c09242. [DOI] [PubMed] [Google Scholar]
- Good D. B.; Wang S.; Ward M. E.; Struppe J.; Brown L. S.; Lewandowski J. R.; Ladizhansky V. Conformational Dynamics of a Seven Transmembrane Helical Protein Anabaena Sensory Rhodopsin Probed by Solid-State NMR. J. Am. Chem. Soc. 2014, 136, 2833–2842. 10.1021/ja411633w. [DOI] [PubMed] [Google Scholar]
- Good D.; Pham C.; Jagas J.; Lewandowski J. R.; Ladizhansky V. Solid-State NMR Provides Evidence for Small-Amplitude Slow Domain Motions in a Multispanning Transmembrane α-Helical Protein. J. Am. Chem. Soc. 2017, 139, 9246–9258. 10.1021/jacs.7b03974. [DOI] [PMC free article] [PubMed] [Google Scholar]
- Saurel O.; Iordanov I.; Nars G.; Demange P.; Le Marchand T.; Andreas L. B.; Pintacuda G.; Milon A. Local and Global Dynamics in Klebsiella Pneumoniae Outer Membrane Protein a in Lipid Bilayers Probed at Atomic Resolution. J. Am. Chem. Soc. 2017, 139, 1590–1597. 10.1021/jacs.6b11565. [DOI] [PubMed] [Google Scholar]
- Singh H.; Vasa S. K.; Jangra H.; Rovó P.; Päslack C.; Das C. K.; Zipse H.; Schäfer L. V.; Linser R. Fast Microsecond Dynamics of the Protein-Water Network in the Active Site of Human Carbonic Anhydrase II Studied by Solid-State NMR Spectroscopy. J. Am. Chem. Soc. 2019, 141, 19276–19288. 10.1021/jacs.9b05311. [DOI] [PubMed] [Google Scholar]
- Shannon M. D.; Theint T.; Mukhopadhyay D.; Surewicz K.; Surewicz W. K.; Marion D.; Schanda P.; Jaroniec C. P. Conformational Dynamics in the Core of Human Y145Stop Prion Protein Amyloid Probed by Relaxation Dispersion NMR. ChemPhysChem 2019, 20, 311–317. 10.1002/cphc.201800779. [DOI] [PMC free article] [PubMed] [Google Scholar]
- Palmer A. G.; Kroenke C. D.; Loria J. P.. Nuclear Magnetic Resonance Methods for Quantifying Microsecond-to-Millisecond Motions in Biological Macromolecules. Nuclear Magnetic Resonance of Biological Macromolecules, Part B; Methods in Enzymology; Elsevier, 2001; Vol. 339, pp 204–238. [DOI] [PubMed] [Google Scholar]
- Krushelnitsky A.; Zinkevich T.; Reif B.; Saalwächter K. Slow Motions in Microcrystalline Proteins as Observed by MAS-dependent 15N Rotating-Frame NMR Relaxation. J. Magn. Reson. 2014, 248, 8–12. 10.1016/j.jmr.2014.09.007. [DOI] [PubMed] [Google Scholar]
- Ishima R.; Torchia D. A. Estimating the Time Scale of Chemical Exchange of Proteins from Measurements of Transverse Relaxation Rates in Solution. J. Biomol. NMR 1999, 14, 369–372. 10.1023/A:1008324025406. [DOI] [PubMed] [Google Scholar]
- Gauto D. F.; Macek P.; Barducci A.; Fraga H.; Hessel A.; Terauchi T.; Gajan D.; Miyanoiri Y.; Boisbouvier J.; Lichtenecker R.; et al. Aromatic Ring Dynamics, Thermal Activation, and Transient Conformations of a 468 kDa Enzyme by Specific 1H-13C Labeling and Fast Magic-Angle Spinning NMR. J. Am. Chem. Soc. 2019, 141, 11183–11195. 10.1021/jacs.9b04219. [DOI] [PMC free article] [PubMed] [Google Scholar]
- Rovó P.; Linser R. Microsecond Timescale Protein Dynamics: A Combined Solid-State NMR Approach. ChemPhysChem 2018, 19, 34–39. 10.1002/cphc.201701238. [DOI] [PubMed] [Google Scholar]
- Vallurupalli P.; Sekhar A.; Yuwen T.; Kay L. E. Probing Conformational Dynamics in Biomolecules via Chemical Exchange Saturation Transfer: A Primer. J. Biomol. NMR 2017, 67, 243–271. 10.1007/s10858-017-0099-4. [DOI] [PubMed] [Google Scholar]
- Krushelnitsky A.; DeAzevedo E.; Linser R.; Reif B.; Saalwächter K.; Reichert D. Direct Observation of Millisecond to Second Motions in Proteins by Dipolar CODEX NMR Spectroscopy. J. Am. Chem. Soc. 2009, 131, 12097–12099. 10.1021/ja9038888. [DOI] [PubMed] [Google Scholar]
- Huster D.; Xiao L.; Hong M. Solid-State NMR Investigation of the Dynamics of the Soluble and Membrane-Bound Colicin Ia Channel-Forming Domain. Biochemistry 2001, 40, 7662–7674. 10.1021/bi0027231. [DOI] [PubMed] [Google Scholar]
- Hou G.; Paramasivam S.; Yan S.; Polenova T.; Vega A. J. Multidimensional Magic Angle Spinning NMR Spectroscopy for Site-Resolved Measurement of Proton Chemical Shift Anisotropy in Biological Solids. J. Am. Chem. Soc. 2013, 135, 1358–1368. 10.1021/ja3084972. [DOI] [PMC free article] [PubMed] [Google Scholar]
- Pandey M. K.; Malon M.; Ramamoorthy A.; Nishiyama Y. Composite-180° Pulse-Based Symmetry Sequences to Recouple Proton Chemical Shift Anisotropy Tensors Under Ultrafast MAS Solid-State NMR Spectroscopy. J. Magn. Reson. 2015, 250, 45–54. 10.1016/j.jmr.2014.11.002. [DOI] [PMC free article] [PubMed] [Google Scholar]
- Pandey M. K.; Yarava J. R.; Zhang R.; Ramamoorthy A.; Nishiyama Y. Proton-Detected 3D 15N/1H/1H Isotropic/Anisotropic/Isotropic Chemical Shift Correlation Solid-State NMR at 70 kHz MAS. Solid State Nucl. Magn. Reson. 2016, 76–77, 1–6. 10.1016/j.ssnmr.2016.03.001. [DOI] [PMC free article] [PubMed] [Google Scholar]
- Pandey M. K.; Damron J. T.; Ramamoorthy A.; Nishiyama Y. Proton-Detected 3D 1H Anisotropic/14N/1H Isotropic Chemical Shifts Correlation NMR Under Fast Magic Angle Spinning on Solid Samples Without Isotopic Enrichment. Solid State Nucl. Magn. Reson. 2019, 97, 40–45. 10.1016/j.ssnmr.2018.12.002. [DOI] [PubMed] [Google Scholar]
- Kobayashi T.; Perras F. A.; Nishiyama Y. Determination of the Chemical Shift Tensor Anisotropy and Asymmetry of Strongly Dipolar Coupled Protons Under Fast MAS. Solid State Nucl. Magn. Reson. 2021, 114, 101743. 10.1016/j.ssnmr.2021.101743. [DOI] [PubMed] [Google Scholar]
- Mainz A.; Religa T. L.; Sprangers R.; Linser R.; Kay L. E.; Reif B. NMR Spectroscopy of Soluble Protein Complexes at One Mega-Dalton and Beyond. Angew. Chem., Int. Ed. 2013, 52, 8746–8751. 10.1002/anie.201301215. [DOI] [PubMed] [Google Scholar]
- Mainz A.; Peschek J.; Stavropoulou M.; Back K. C.; Bardiaux B.; Asami S.; Prade E.; Peters C.; Weinkauf S.; Buchner J.; et al. The Chaperone αB-Crystallin Uses Different Interfaces to Capture an Amorphous and an Amyloid Client. Nat. Struct. Mol. Biol. 2015, 22, 898–905. 10.1038/nsmb.3108. [DOI] [PubMed] [Google Scholar]
- Barbet-Massin E.; Huang C. T.; Daebel V.; Hsu S. T. D.; Reif B. Site-Specific Solid-State NMR Studies of “Trigger Factor” in Complex With the Large Ribosomal Subunit 50S. Angew. Chem., Int. Ed. 2015, 54, 4367–4369. 10.1002/anie.201409393. [DOI] [PubMed] [Google Scholar]
- Dannatt H. R. W.; Felletti M.; Jehle S.; Wang Y.; Emsley L.; Dixon N. E.; Lesage A.; Pintacuda G. Weak and Transient Protein Interactions Determined by Solid-State NMR. Angew. Chem., Int. Ed. 2016, 55, 6638–6641. 10.1002/anie.201511609. [DOI] [PubMed] [Google Scholar]
- Barbet-Massin E.; Felletti M.; Schneider R.; Jehle S.; Communie G.; Martinez N.; Jensen M. R.; Ruigrok R. W. H.; Emsley L.; Lesage A.; et al. Insights Into the Structure and Dynamics of Measles Virus Nucleocapsids by 1H-Detected Solid-State NMR. Biophys. J. 2014, 107, 941–946. 10.1016/j.bpj.2014.05.048. [DOI] [PMC free article] [PubMed] [Google Scholar]
- Lamley J. M.; Iuga D.; Öster C.; Sass H.-J.; Rogowski M.; Oss A.; Past J.; Reinhold A.; Grzesiek S.; Samoson A.; et al. Solid-State NMR of a Protein in a Precipitated Complex With a Full-Length Antibody. J. Am. Chem. Soc. 2014, 136, 16800–16806. 10.1021/ja5069992. [DOI] [PubMed] [Google Scholar]
- Kosol S.; Gallo A.; Griffiths D.; Valentic T. R.; Masschelein J.; Jenner M.; de los Santos E. L. C.; Manzi L.; Sydor P. K.; Rea D.; et al. Structural Basis for Chain Release From the Enacyloxin Polyketide Synthase. Nat. Chem. 2019, 11, 913–923. 10.1038/s41557-019-0335-5. [DOI] [PMC free article] [PubMed] [Google Scholar]
- Gauto D. F.; Macek P.; Malinverni D.; Fraga H.; Paloni M.; Sucec I.; Hessel A.; Bustamante J. P.; Barducci A.; Schanda P. Functional Control of a 0.5 MDa TET Aminopeptidase by a Flexible Loop Revealed by MAS NMR. Nat. Commun. 2022, 13, 1927. 10.1038/s41467-022-29423-0. [DOI] [PMC free article] [PubMed] [Google Scholar]
- Jaudzems K.; Kirsteina A.; Schubeis T.; Casano G.; Ouari O.; Bogans J.; Kazaks A.; Tars K.; Lesage A.; Pintacuda G. Structural Analysis of an Antigen Chemically Coupled on Virus-Like Particles in Vaccine Formulation. Angew. Chem., Int. Ed. 2021, 60, 12847–12851. 10.1002/anie.202013189. [DOI] [PubMed] [Google Scholar]
- Lacabanne D.; Boudet J.; Malär A. A.; Wu P.; Cadalbert R.; Salmon L.; Allain F. H.; Meier B. H.; Wiegand T. Protein Side-Chain-Dna Contacts Probed by Fast Magic-Angle Spinning NMR. J. Phys. Chem. B 2020, 124, 11089–11097. 10.1021/acs.jpcb.0c08150. [DOI] [PMC free article] [PubMed] [Google Scholar]
- Malär A. A.; Wili N.; Völker L. A.; Kozlova M. I.; Cadalbert R.; Däpp A.; Weber M. E.; Zehnder J.; Jeschke G.; Eckert H.; et al. Spectroscopic Glimpses of the Transition State of ATP Hydrolysis Trapped in a Bacterial DnaB Helicase. Nat. Commun. 2021, 12, 5293. 10.1038/s41467-021-25599-z. [DOI] [PMC free article] [PubMed] [Google Scholar]
- Asami S.; Rakwalska-Bange M.; Carlomagno T.; Reif B. Protein-RNA Interfaces Probed by 1H-Detected MAS Solid-State NMR Spectroscopy. Angew. Chem., Int. Ed. 2013, 52, 2345–2349. 10.1002/anie.201208024. [DOI] [PubMed] [Google Scholar]
- Aguion P. I.; Kirkpatrick J.; Carlomagno T.; Marchanka A. Identification of RNA Base Pairs and Complete Assignment of Nucleobase Resonances by Proton-Detected Solid-State NMR Spectroscopy at 100 kHz MAS. Angew. Chem., Int. Ed. 2021, 60, 23903–23910. 10.1002/anie.202107263. [DOI] [PMC free article] [PubMed] [Google Scholar]
- Fraga H.; Arnaud C.-A.; Gauto D. F.; Audin M.; Kurauskas V.; Macek P.; Krichel C.; Guan J.-Y.; Boisbouvier J.; Sprangers R.; et al. Solid-State NMR H–N–(C)–H and H–N–C–C 3D/4D Correlation Experiments for Resonance Assignment of Large Proteins. ChemPhysChem 2017, 18, 2697–2703. 10.1002/cphc.201700572. [DOI] [PMC free article] [PubMed] [Google Scholar]
- Felix J.; Weinhäupl K.; Chipot C.; Dehez F.; Hessel A.; Gauto D. F.; Morlot C.; Abian O.; Gutsche I.; Velazquez-Campoy A.; et al. Mechanism of the Allosteric Activation of the ClpP Protease Machinery by Substrates and Active-Site Inhibitors. Sci. Adv. 2019, 5, eaaw3818 10.1126/sciadv.aaw3818. [DOI] [PMC free article] [PubMed] [Google Scholar]
- Asami S.; Reif B. Accessing Methyl Groups in Proteins via 1H-Detected MAS Solid-State NMR Spectroscopy Employing Random Protonation. Sci. Rep. 2019, 9, 15903. 10.1038/s41598-019-52383-3. [DOI] [PMC free article] [PubMed] [Google Scholar]
- Morris V.; Linser R.; Wilde K.; Duff A.; Sunde M.; Kwan A. Solid-State NMR Spectroscopy of Functional Amyloid From a Fungal Hydrophobin: A Well-Ordered β-Sheet Core Amidst Structural Heterogeneity. Angew. Chem., Int. Ed. 2012, 51, 12621–12625. 10.1002/anie.201205625. [DOI] [PubMed] [Google Scholar]
- Favretto F.; Flores D.; Baker J. D.; Strohäker T.; Andreas L. B.; Blair L. J.; Becker S.; Zweckstetter M. Catalysis of Proline Isomerization and Molecular Chaperone Activity in a Tug-of-War. Nat. Commun. 2020, 11, 6046. 10.1038/s41467-020-19844-0. [DOI] [PMC free article] [PubMed] [Google Scholar]
- del Amo J.-M. L.; Fink U.; Reif B. Quantification of Protein Backbone Hydrogen-Deuterium Exchange Rates by Solid State NMR Spectroscopy. J. Biomol. NMR 2010, 48, 203–212. 10.1007/s10858-010-9450-8. [DOI] [PubMed] [Google Scholar]
- Grohe K.; Movellan K. T.; Vasa S. K.; Giller K.; Becker S.; Linser R. Non-Equilibrium Hydrogen Exchange for Determination of H-Bond Strength and Water Accessibility in Solid Proteins. J. Biomol. NMR 2017, 68, 7–17. 10.1007/s10858-017-0110-0. [DOI] [PubMed] [Google Scholar]
- Weingarth M.; van der Cruijsen E. A. W.; Ostmeyer J.; Lievestro S.; Roux B.; Baldus M. Quantitative Analysis of the Water Occupancy Around the Selectivity Filter of a K+ Channel in Different Gating Modes. J. Am. Chem. Soc. 2014, 136, 2000–2007. 10.1021/ja411450y. [DOI] [PMC free article] [PubMed] [Google Scholar]
- Najbauer E. E.; Movellan K. T.; Schubeis T.; Schwarzer T.; Castiglione K.; Giller K.; Pintacuda G.; Becker S.; Andreas L. B. Probing Membrane Protein Insertion Into Lipid Bilayers by Solid-State NMR. ChemPhysChem 2018, 20, 302–310. 10.1002/cphc.201800793. [DOI] [PubMed] [Google Scholar]
- Najbauer E. E.; Becker S.; Giller K.; Zweckstetter M.; Lange A.; Steinem C.; de Groot B. L.; Griesinger C.; Andreas L. B. Structure, Gating and Interactions of the Voltage-Dependent Anion Channel. Eur. Biophys. J. 2021, 50, 159–172. 10.1007/s00249-021-01515-7. [DOI] [PMC free article] [PubMed] [Google Scholar]
- Antonschmidt L.; Dervisoglu R.; Sant V.; Tekwani Movellan K.; Mey I.; Riedel D.; Steinem C.; Becker S.; Andreas L. B.; Griesinger C. Insights Into the Molecular Mechanism of Amyloid Filament Formation: Segmental Folding of α-Synuclein on Lipid Membranes. Sci. Adv. 2021, 7, eabg2174. 10.1126/sciadv.abg2174. [DOI] [PMC free article] [PubMed] [Google Scholar]
- Pintacuda G.; Otting G. Identification of Protein Surfaces by NMR Measurements With a Pramagnetic Gd(III) Chelate. J. Am. Chem. Soc. 2002, 124, 372–373. 10.1021/ja016985h. [DOI] [PubMed] [Google Scholar]
- Madl T.; Güttler T.; Görlich D.; Sattler M. Structural Analysis of Large Protein Complexes Using Solvent Paramagnetic Relaxation Enhancements. Angew. Chem. int. Ed. 2011, 50, 3993–3997. 10.1002/anie.201007168. [DOI] [PubMed] [Google Scholar]
- Linser R.; Fink U.; Reif B. Probing Surface Accessibility of Proteins Using Paramagnetic Relaxation in Solid-State NMR Spectroscopy. J. Am. Chem. Soc. 2009, 131, 13703–8. 10.1021/ja903892j. [DOI] [PubMed] [Google Scholar]
- Aucoin D.; Xia Y.; Theint T.; Nadaud P. S.; Surewicz K.; Surewicz W. K.; Jaroniec C. P. Protein-Solvent Interfaces in Human Y145Stop Prion Protein Amyloid Fibrils Probed by Paramagnetic Solid-State NMR Spectroscopy. J. Struct. Biol. 2019, 206, 36–42. 10.1016/j.jsb.2018.04.002. [DOI] [PMC free article] [PubMed] [Google Scholar]
- Öster C.; Kosol S.; Hartlmüller C.; Lamley J. M.; Iuga D.; Oss A.; Org M.-L.; Vanatalu K.; Samoson A.; Madl T.; et al. Characterization of Protein–Protein Interfaces in Large Complexes by Solid-State NMR Solvent Paramagnetic Relaxation Enhancements. J. Am. Chem. Soc. 2017, 139, 12165–12174. 10.1021/jacs.7b03875. [DOI] [PMC free article] [PubMed] [Google Scholar]
- Agarwal V.; Xue Y.; Reif B.; Skrynnikov N. R. Protein Side-Chain Dynamics as Observed by Solution- And Solid-State NMR Spectroscopy: A Similarity Revealed. J. Am. Chem. Soc. 2008, 130, 16611–16621. 10.1021/ja804275p. [DOI] [PubMed] [Google Scholar]
- Mollica L.; Baias M.; Lewandowski J. R.; Wylie B. J.; Sperling L. J.; Rienstra C. M.; Emsley L.; Blackledge M. Atomic-Resolution Structural Dynamics in Crystalline Proteins From NMR and Molecular Simulation. J. Phys. Chem. Lett. 2012, 3, 3657–3662. 10.1021/jz3016233. [DOI] [PubMed] [Google Scholar]
- Bertarello A.; Benda L.; Sanders K. J.; Pell A. J.; Knight M. J.; Pelmenschikov V.; Gonnelli L.; Felli I. C.; Kaupp M.; Emsley L.; et al. Picometer Resolution Structure of the Coordination Sphere in the Metal-Binding Site in a Metalloprotein by NMR. J. Am. Chem. Soc. 2020, 142, 16757–16765. 10.1021/jacs.0c07339. [DOI] [PubMed] [Google Scholar]
- Bertarello A.; Schubeis T.; Fuccio C.; Ravera E.; Fragai M.; Parigi G.; Emsley L.; Pintacuda G.; Luchinat C. Paramagnetic Properties of a Crystalline Iron-Sulfur Protein by Magic-Angle Spinning NMR Spectroscopy. Inorg. Chem. 2017, 56, 6624–6629. 10.1021/acs.inorgchem.7b00674. [DOI] [PubMed] [Google Scholar]
- Sala B. M.; Le Marchand T.; Pintacuda G.; Camilloni C.; Natalello A.; Ricagno S. Conformational Stability and Dynamics in Crystals Recapitulate Protein Behavior in Solution. Biophys. J. 2020, 119, 978–988. 10.1016/j.bpj.2020.07.015. [DOI] [PMC free article] [PubMed] [Google Scholar]
- Colvin M. T.; Andreas L. B.; Chou J. J.; Griffin R. G. Proton Association Constants of His 37 in the Influenza-A M218–60 Dimer-of-Dimers. Biochemistry 2014, 53, 5987–5994. 10.1021/bi5005393. [DOI] [PMC free article] [PubMed] [Google Scholar]
- Movellan K. T.; Wegstroth M.; Overkamp K.; Leonov A.; Becker S.; Andreas L. B. Imidazole-Imidazole Hydrogen Bonding in the pH-Sensing Histidine Side Chains of Influenza A M2. J. Am. Chem. Soc. 2020, 142, 2704–2708. 10.1021/jacs.9b10984. [DOI] [PMC free article] [PubMed] [Google Scholar]
- Fu R.; Miao Y.; Qin H.; Cross T. A. Observation of the Imidazole-Imidazolium Hydrogen Bonds Responsible for Selective Proton Conductance in the Influenza A M2 Channel. J. Am. Chem. Soc. 2020, 142, 2115–2119. 10.1021/jacs.9b09985. [DOI] [PMC free article] [PubMed] [Google Scholar]
- Movellan K. T.; Dervişoğlu R.; Becker S.; Andreas L. B. Pore-Bound Water at the Key Residue Histidine 37 in Influenza A M2. Angew. Chem., Int. Ed. 2021, 60, 24075–24079. 10.1002/anie.202103955. [DOI] [PMC free article] [PubMed] [Google Scholar]
- Zadorozhnyi R.; Sarkar S.; Quinn C. M.; Zadrozny K. K.; Ganser-Pornillos B. K.; Pornillos O.; Gronenborn A. M.; Polenova T. Determination of Histidine Protonation States in Proteins by Fast Magic Angle Spinning NMR. Front. Mol. Biosci. 2021, 8, 767040. 10.3389/fmolb.2021.767040. [DOI] [PMC free article] [PubMed] [Google Scholar]
- Friedrich D.; Brünig F. N.; Nieuwkoop A. J.; Netz R. R.; Hegemann P.; Oschkinat H. Collective Exchange Processes Reveal an Active Site Proton Cage in Bacteriorhodopsin. Commun. Biol. 2020, 3, 4. 10.1038/s42003-019-0733-7. [DOI] [PMC free article] [PubMed] [Google Scholar]
- Renault M.; Tommassen-Van Boxtel R.; Bos M. P.; Post J. A.; Tommassen J.; Baldus M. Cellular Solid-State Nuclear Magnetic Resonance Spectroscopy. Proc. Natl. Acad. Sci. U.S.A. 2012, 109, 4863–4868. 10.1073/pnas.1116478109. [DOI] [PMC free article] [PubMed] [Google Scholar]
- Baker L. A.; Sinnige T.; Schellenberger P.; de Keyzer J.; Siebert C. A.; Driessen A. J.; Baldus M.; Grünewald K. Combined 1H-Detected Solid-State NMR Spectroscopy and Electron Cryotomography to Study Membrane Proteins Across Resolutions in Native Environments. Structure 2018, 26, 161–170. 10.1016/j.str.2017.11.011. [DOI] [PMC free article] [PubMed] [Google Scholar]
- Narasimhan S.; Pinto C.; Lucini Paioni A.; van der Zwan J.; Folkers G. E.; Baldus M. Characterizing Proteins in a Native Bacterial Environment Using Solid-State NMR Spectroscopy. Nat. Protoc. 2021, 16, 893–918. 10.1038/s41596-020-00439-4. [DOI] [PubMed] [Google Scholar]
- Medeiros-Silva J.; Jekhmane S.; Paioni A. L.; Gawarecka K.; Baldus M.; Swiezewska E.; Breukink E.; Weingarth M. High-Resolution NMR Studies of Antibiotics in Cellular Membranes. Nat. Commun. 2018, 9, 3963. 10.1038/s41467-018-06314-x. [DOI] [PMC free article] [PubMed] [Google Scholar]
- Bougault C.; Ayala I.; Vollmer W.; Simorre J.-P.; Schanda P. Studying Intact Bacterial Peptidoglycan by Proton-Detected NMR Spectroscopy at 100 kHz MAS Frequency. J. Struct. Biol. 2019, 206, 66–72. 10.1016/j.jsb.2018.07.009. [DOI] [PMC free article] [PubMed] [Google Scholar]
- Zhou D. H.; Shah G.; Mullen C.; Sandoz D.; Rienstra C. M. Proton-Detected Solid-State NMR Spectroscopy of Natural-Abundance Peptide and Protein Pharmaceuticals. Angew. Chem., Int. Ed. 2009, 48, 1253–1256. 10.1002/anie.200801029. [DOI] [PMC free article] [PubMed] [Google Scholar]
- Jekhmane S.; Prachar M.; Pugliese R.; Fontana F.; Medeiros-Silva J.; Gelain F.; Weingarth M. Design Parameters of Tissue-Engineering Scaffolds at the Atomic Scale. Angew. Chem., Int. Ed. 2019, 58, 16943–16951. 10.1002/anie.201907880. [DOI] [PMC free article] [PubMed] [Google Scholar]
- Mroue K. H.; Nishiyama Y.; Kumar Pandey M.; Gong B.; McNerny E.; Kohn D. H.; Morris M. D.; Ramamoorthy A. Proton-Detected Solid-State NMR Spectroscopy of Bone with Ultrafast Magic Angle Spinning. Sci. Rep. 2015, 5, 11991. 10.1038/srep11991. [DOI] [PMC free article] [PubMed] [Google Scholar]
- Hong Y.-l.; Manjunatha Reddy G. N.; Nishiyama Y. Selective Detection of Active Pharmaceutical Ingredients in Tablet Formulations Using Solid-State NMR Spectroscopy. Solid State Nucl. Magn. Reson. 2020, 106, 101651. 10.1016/j.ssnmr.2020.101651. [DOI] [PubMed] [Google Scholar]
- Zhang R.; Pandey M. K.; Nishiyama Y.; Ramamoorthy A. A Novel High-Resolution and Sensitivity-Enhanced Three-Dimensional Solid-State NMR Experiment Under Ultrafast Magic Angle Spinning Conditions. Sci. Rep. 2015, 5, 11810. 10.1038/srep11810. [DOI] [PMC free article] [PubMed] [Google Scholar]
- Struppe J.; Quinn C. M.; Sarkar S.; Gronenborn A. M.; Polenova T. Ultrafast 1H MAS NMR Crystallography for Natural Abundance Pharmaceutical Compounds. Mol. Pharmaceutics 2020, 17, 674–682. 10.1021/acs.molpharmaceut.9b01157. [DOI] [PMC free article] [PubMed] [Google Scholar]
- Berruyer P.; Björgvinsdóttir S.; Bertarello A.; Stevanato G.; Rao Y.; Karthikeyan G.; Casano G.; Ouari O.; Lelli M.; Reiter C.; et al. Dynamic Nuclear Polarization Enhancement of 200 at 21.15 T Enabled by 65 kHz Magic Angle Spinning. J. Phys. Chem. Lett. 2020, 11, 8386–8391. 10.1021/acs.jpclett.0c02493. [DOI] [PubMed] [Google Scholar]
- Jumper J.; Evans R.; Pritzel A.; Green T.; Figurnov M.; Ronneberger O.; Tunyasuvunakool K.; Bates R.; Žídek A.; Potapenko A.; et al. Highly Accurate Protein Structure Prediction with AlphaFold. Nature 2021, 596, 583–589. 10.1038/s41586-021-03819-2. [DOI] [PMC free article] [PubMed] [Google Scholar]


