

SUMMARY
Despite remarkable clinical efficacy of immune checkpoint blockade (ICB) in cancer treatment, ICB benefits in triple-negative breast cancer (TNBC) remain limited. Through pooled in vivo CRISPR knockout (KO) screens in syngeneic TNBC mouse models, we found that deletion of the E3 ubiquitin ligase Cop1 in cancer cells decreases the secretion of macrophage-associated chemokines, reduces tumor macrophage infiltration, enhances anti-tumor immunity, and strengthens ICB response. Transcriptomics, epigenomics, and proteomics analyses revealed that Cop1 functions through proteasomal degradation of the C/ebpδ protein. Cop1 substrate Trib2 functions as a scaffold linking Cop1 and C/ebpδ, which leads to polyubiquitination of C/ebpδ. In addition, deletion of the E3 ubiquitin ligase Cop1 in cancer cells stabilizes C/ebpδ to suppress the expression of macrophage chemoattractant genes. Our integrated approach implicates Cop1 as a target for improving cancer immunotherapy efficacy in TNBC by regulating chemokine secretion and macrophage infiltration in the tumor microenvironment.
Keywords: Triple-negative breast cancer, CRISPR screening, Immunotherapy, E3 ubiquitin ligase, Cop1, C/ebpδ
eTOC
Large-scale in vivo CRISPR screens reveal that Cop1 knockout in cancer cells stabilizes C/ebpδ protein, thereby suppressing macrophage infiltration and enhancing anti-tumor immunity.
Graphical Abstract

INTRODUCTION
Breast cancer is one of the leading causes of cancer-associated morbidity and mortality in the United States (Fallahpour et al., 2017; Waks and Winer, 2019). Triple-negative breast cancer (TNBC) constitutes 15% of breast cancer cases and has the worst prognosis among the molecular subtypes, motivating research efforts to find new treatment options in TNBC (Bianchini et al., 2016). Immune checkpoint blockade (ICB) has shown remarkable clinical benefits to skin, lung, and colorectal cancer patients (Halle et al., 2017), raising the possibility of effective ICB treatment of breast cancer. In 2019, the FDA approved the first ICB therapy for the treatment of metastatic TNBC. Atezolizumab, an anti-PD-L1 monoclonal antibody, was approved in combination with nab-paclitaxel (nanoparticle albumin-bound paclitaxel) based on prolonged progression-free survival (Schmid et al., 2018). While this advance demonstrates the promise of ICB in breast cancer treatment, the benefits were limited to a small subset of patients. A recent clinical trial reported that pembrolizumab, an anti-PD-1 monoclonal antibody, had an objective response rate of just 18% in PD-L1-expressing advanced TNBC (Nanda et al., 2016). This underscores the need for finding new immune targets to enhance ICB response and improve outcomes in TNBC.
The immune system is known to play important roles in cancer progression (Coussens et al., 2013; Hanahan and Weinberg, 2011), although the molecular mechanisms regulating tumor immunity and tumor microenvironment (TME) are not fully understood. Some cell types in the TME are proposed to promote tumor growth and metastasis, such as myeloid-derived suppressor cells (MDSC) (Grivennikov et al., 2010), fibroblasts (Landskron et al., 2014), and tumor-associated macrophages (TAMs) (Su et al., 2018). Among them, TAMs are major player and are thought to promote angiogenesis, cancer cell local invasion, and intravasation at primary tumor sites. At metastatic sites, TAMs can also facilitate cancer cell extravasation and block CD8+ T cell recruitment and functions (Cassetta and Pollard, 2018; Peranzoni et al., 2018). In patients, macrophage infiltration in tumors is strongly associated with poor clinical outcomes in numerous cancer types, including breast cancer (Cassetta et al., 2019; Zhang et al., 2016). In syngeneic mouse models, classical monocytes (Mouse CD11b+Ly6C+) are recruited to tumors and differentiate into TAMs as tumors progress (Ginhoux and Jung, 2014). This process often depends on macrophage chemoattractants secreted from cancer cells or activated macrophages, such as CCL2 (Nielsen and Schmid, 2017), CCL4 (Li et al., 2018), CCL5 (Walens et al., 2019), CXCL1 (Wang et al., 2017), and CXCL5 (Zhao et al., 2017). Accordingly, a monoclonal antibody was developed to inhibit CCL2 signaling pathway, which indeed attenuates TAM infiltration, suppresses tumor growth, and improves survival (Qian et al., 2011). However, pharmacological inhibition of chemokines is associated with chemokine overexpression due to homeostatic feedback, yielding adverse effects (Lim et al., 2016). These findings motivated us to discover novel targets to reprogram the TME for cancer treatment.
Functional genomic screening using CRISPR-Cas9 has shown promise as a robust and unbiased approach to discover novel cancer targets. It has also been adopted to find novel modulators of tumor immunity, discover novel immuno-oncology targets, and dissect their mechanisms. For instance, FACS-based genome-wide CRISPR screens in vitro have discovered multiple regulators of PD-L1 and/or MHC-I, which potentially facilitate combination immunotherapies for cancer (Burr et al., 2017; Dersh et al., 2021; Gu et al., 2021; Mezzadra et al., 2017). CRISPR screens in cancer cells co-cultured with T cells identified Pbrm1 loss as increasing the sensitivity of B16F10 melanoma cells to effector T cells (Pan et al., 2018). A separate screen in cancer cells co-cultured with T cells identified genes that when knocked out in cancer cells induce immune escape (Lawson et al., 2020). Pooled in vivo CRISPR screens in murine melanoma models revealed that loss of Ptpn2 (Manguso et al., 2017) and Adar1 (Ishizuka et al., 2019) could enhance tumor sensitivity to immunotherapy. While in vivo CRISPR screens effectively query broad aspects of tumor immunity, only a few hundred genes at a time can be screened. This has limited their application to a restricted set of tumor models. This encouraged us to test more genes in different syngeneic models using in vivo CRISPR screens, with the intention of identifying new regulators of tumor immunity.
In this study, we constructed custom murine CRISPR knockout libraries, and used them to conduct in vivo CRISPR screens in murine TNBC and colon cancer models under different levels of host immunity. Through two rounds of in vivo screens, we identified the E3 ubiquitin ligase Cop1 as an important regulator of tumor infiltrating M2 macrophages and anti-PD-1 response in vivo. To further characterize the function and mechanisms of Cop1 in cancer cells, we performed detailed RNA-seq, ATAC-seq, and proteomics analyses to identify Cop1’s substrate. Deletion of Cop1 in TNBC cells led to increased C/ebpδ protein stability and chromatin binding which suppresses the expression of key macrophage chemoattractants and cytokines involved in macrophage chemotaxis and activation. Detailed analysis of the substrates that were significantly altered upon Cop1 depletion revealed that Cop1 targets C/ebpδ for proteasome degradation via a scaffolding protein Trib2. Observations on clinical tumor immune infiltration and patient survival across many cancer types strongly support the clinical relevance of Cop1 as a tumor-immune modulator of C/ebpδ-regulated macrophage infiltration. More generally, our study demonstrates the power of systems biology approaches in identifying modulators of macrophage infiltration and cancer immunotherapy targets.
RESULTS
Large-scale in vivo CRISPR Screens Identify Regulators of Immune Evasion
To systematically discover gene targets in cancer cells whose loss enhances anti-tumor immunity, we first constructed a murine lentiviral CRISPR-Cas9 knockout (MusCK) library. This library includes 5 sgRNAs for each of over 4,500 genes implicated in tumor initiation, progression, and immune modulation (Figure S1A; Table S1) (see STAR Methods for further details). To validate the quality of the MusCK library, we transduced it into the mouse TNBC cell line 4T1 in vitro (Figure S1B) (see STAR Methods for further details). 4T1 cells closely resemble human TNBC cells (Figures S1C and S1D), are transplantable into the syngeneic BALB/c background mice, and have been extensively used in tumor immunology studies (Kim et al., 2014; Sagiv-Barfi et al., 2015). We compared sgRNA abundance distributions in freshly infected 4T1 cells to those in 4T1 cells cultured 10 passages after infection. Supporting the reliability of the MusCK library, cells harboring sgRNAs targeting known oncogenes and tumor suppressor genes were significantly depleted and enriched, respectively (Figure S1E and S1F; Table S2).
With the MusCK library validated, we next conducted in vivo CRISPR screens in the 4T1 cells in syngeneic BALB/c mice. To this end, we first artificially expressed membrane-bound ovalbumin (mOva) in 4T1 cells, an approach widely used to enhance cellular immune responses in syngeneic tumor models. As expected, 4T1 tumors overexpressing mOva had increased lymphocyte infiltration and slower tumor growth (Figures S1G–S1J) (see STAR Methods for further details). We then transduced the lentiviral MusCK library into mOva-expressing 4T1 cells and implanted infected cells into the mammary fat pads of BALB/c Foxn1nu/nu hosts (nude), immune competent BALB/c hosts, and BALB/c hosts vaccinated with ovalbumin prior to transplantation (Figure 1A; Figures S1K–S1L). We used 12 mice per arm and injected enough cells per mouse to achieve ~200-fold coverage for all the sgRNAs in the MusCK library. Sixteen days post transplantation, we harvested the engrafted cancer cells for analysis, and observed significantly different tumor growth in different hosts. While the T-cell deficient BALB/c Foxn1nu/nu hosts had the biggest tumors, the immune-competent hosts pre-vaccinated with ovalbumin had the smallest tumors (Figure 1B; Figure S1M).
Figure 1. In Vivo Screens with the MusCK Library Uncover Classic and Novel Regulators of Immune Evasion.
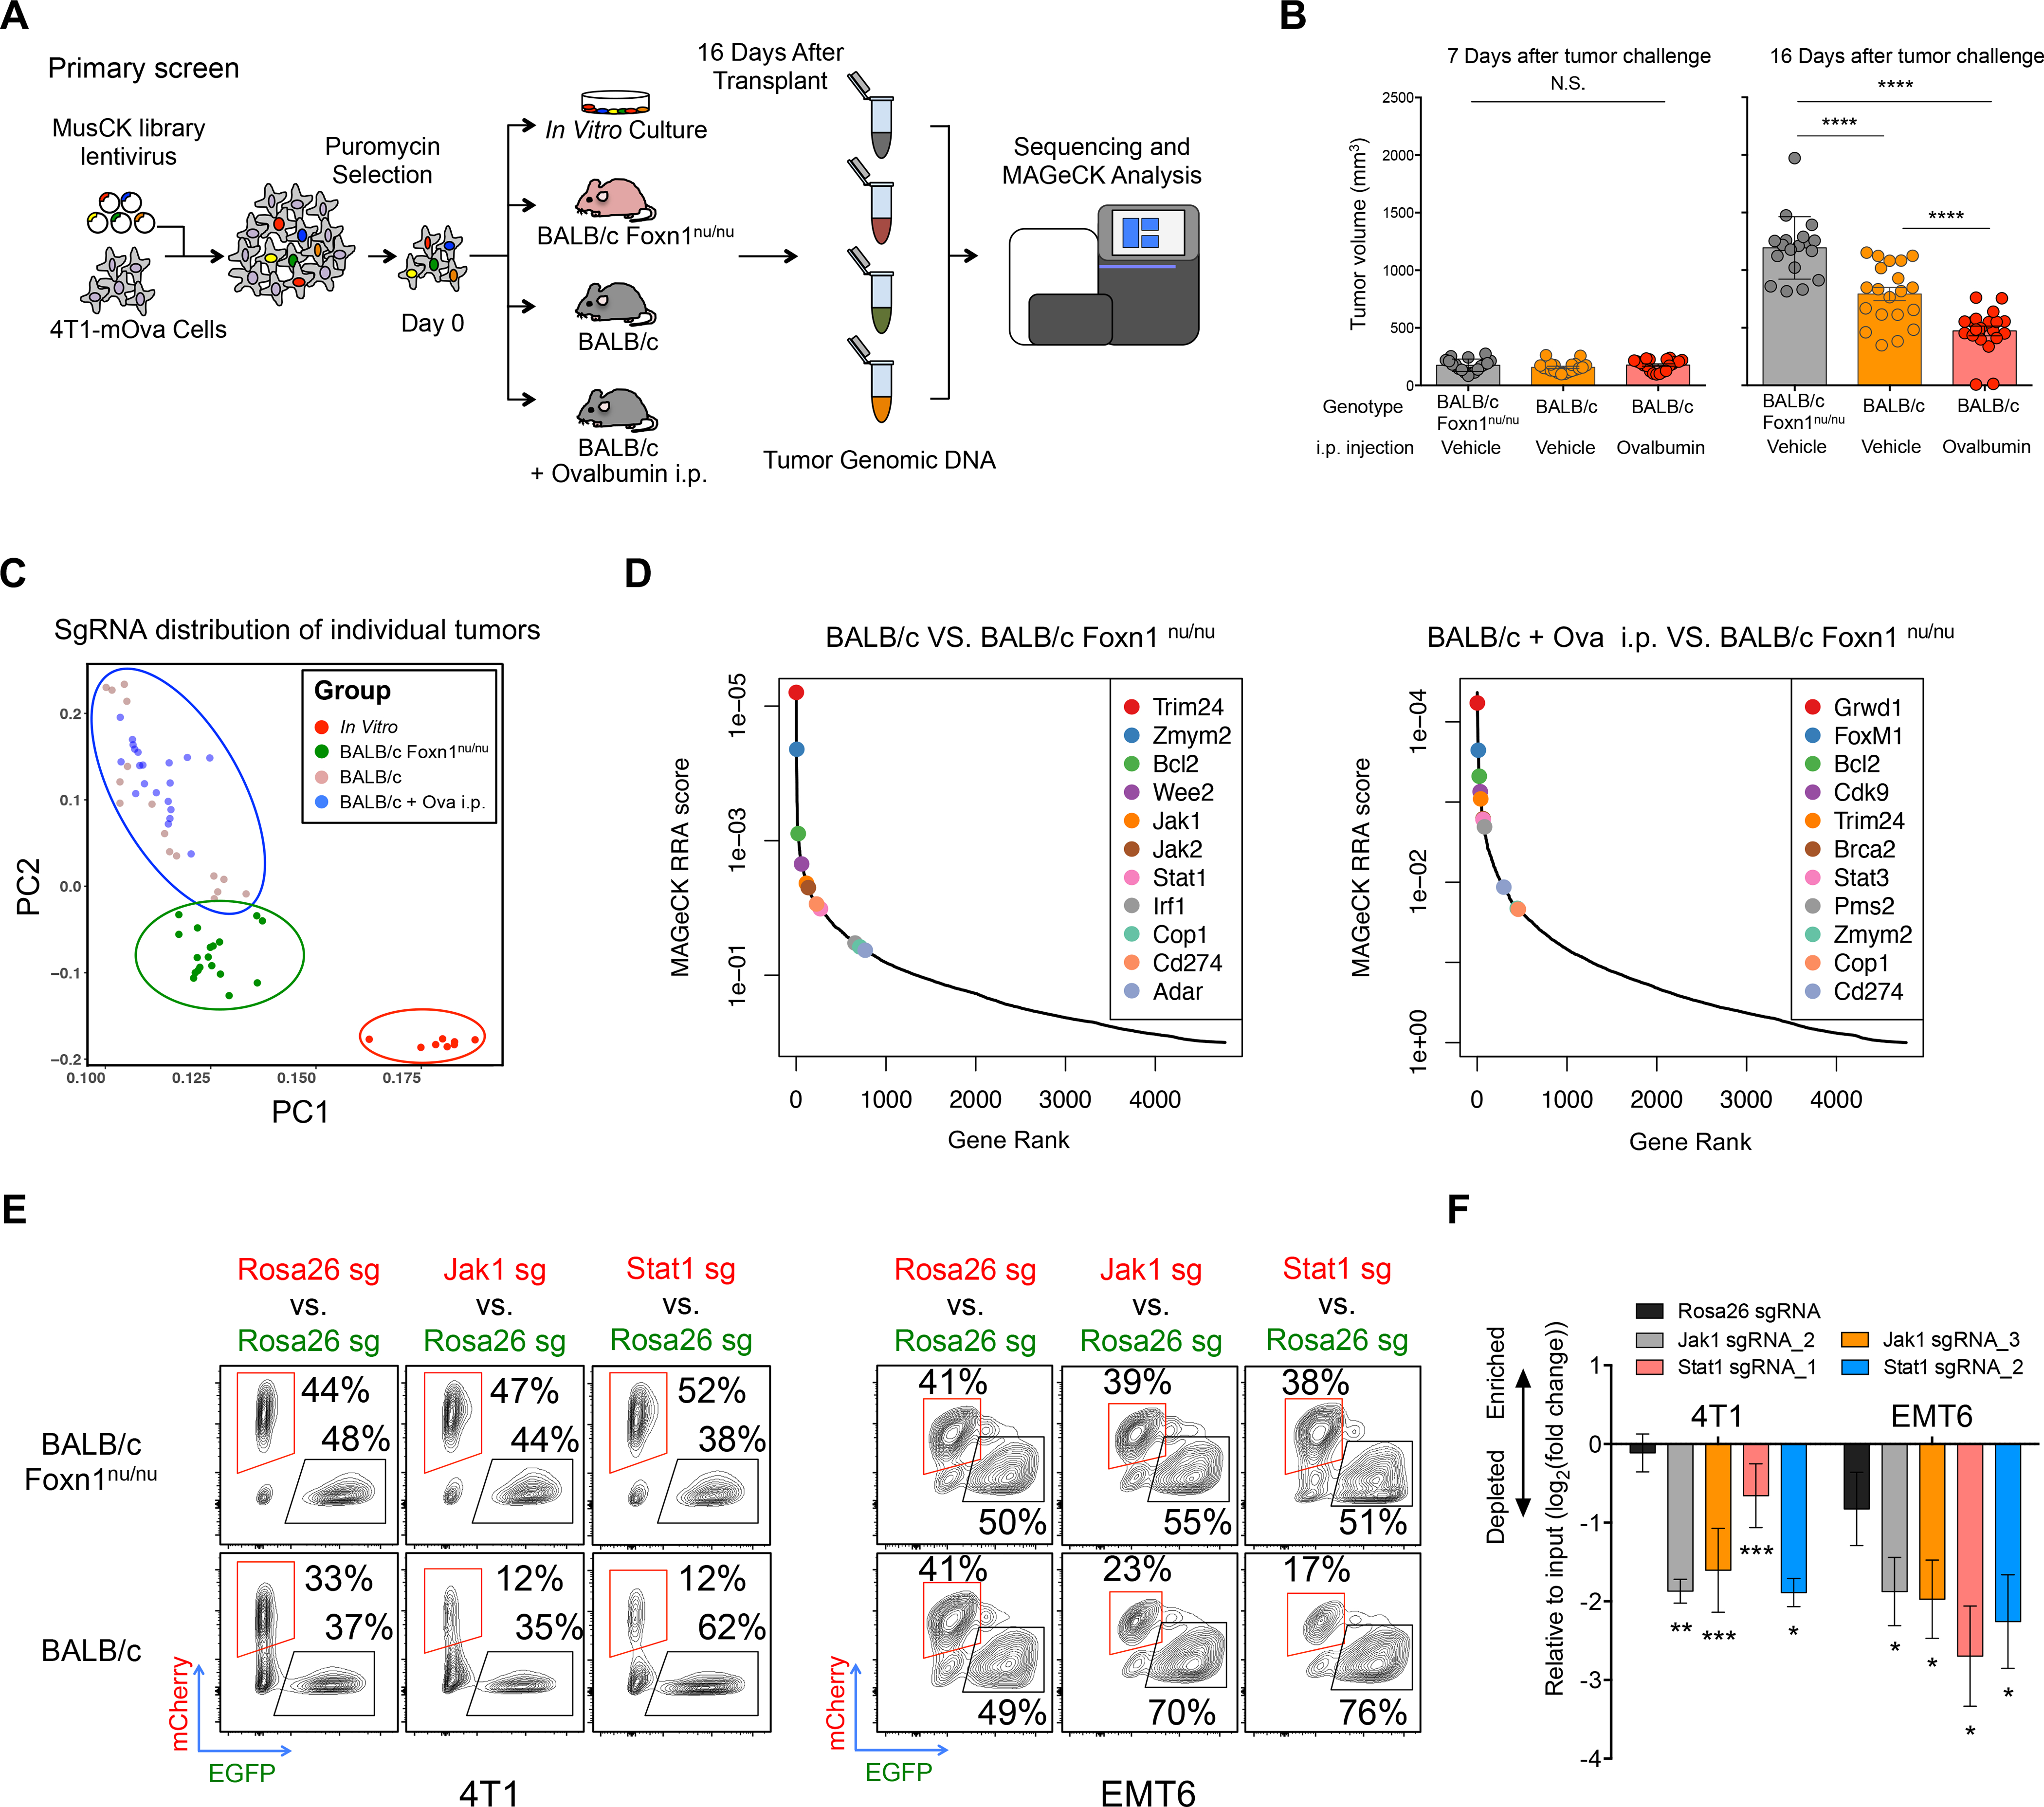
(A) Workflow of MusCK in vivo screens to identify the potential targets for immune evasion. i.p. = intraperitoneal.
(B) Tumor volume measured at 7 and 16 days post implantation in the MusCK screens. Data are shown as mean ± SEM, n = 10–12 mice per group, **** P < 0.0001, by one-way ANOVA with Benjamini-Hochberg multiple test correction.
(C) Principal component analysis of sgRNA abundance in each condition of the MusCK screens.
(D) Top depleted genes in immunocompetent versus immunodeficient (nude) hosts in the MusCK screens.
(E) Flow cytometry analysis of Jak1 (or Stat1) KO cells versus control Rosa26 KO mouse breast cancer cells in the resulting 4T1 and EMT6 tumors.
(F) Quantification of relative percentages calculated from flow cytometry analysis. Data are shown as mean ± SEM, n = 4–6 mice per group, *p < 0.05, **p < 0.01, ***p < 0.001, by one-way ANOVA with Benjamini-Hochberg multiple test correction.
To analyze the CRISPR screen results, we examined the sgRNA abundance distribution in the resulting 4T1 tumors grown in vivo. Reflective of different selection pressure in the hosts, principal component analysis showed that CRISPR screen samples separated first by in vitro versus in vivo conditions, then by nude mice versus immunocompetent mice (Figure 1C). Samples from the same condition cluster together, indicating similar library representations in biological replicates (Figure 1C). Inspection of the sgRNAs depleted from tumors in wild-type immunocompetent hosts compared to nude immunodeficient mice revealed key genes promoting immune evasion in 4T1 cancer cells (Figure 1D; Table S3) (see STAR Methods for further details). As positive controls, the sgRNAs targeting Cd274 (Pd-l1) were depleted in tumors engrafted in wild-type mice, consistent with the known function of Cd274 in immune suppression (Dong et al., 1999; Freeman et al., 2000). In addition, key components of DNA repair pathways, such as Brca2 and Pms2, were significantly negatively selected in wild-type mice (Figure 1D). This is also consistent with previous reports that cancer cells with greater genome instability or mutation burden were at risk of elimination by T-cell mediated killing (Mandal et al., 2019; Pearlman et al., 2017).
Interestingly, key components of the IFNγ pathway (Jak1, Jak2, Stat1 and Irf1) were significantly depleted in wild-type mice, but not nude mice (Figure 1D), suggesting that defects in the IFNγ pathway in cancer cells could suppress immune evasion. IFNγ is a cytokine secreted by tumor-infiltrating lymphocytes to elicit anti-tumor immune response (Alshaker and Matalka, 2011). This result is opposite to previously reported findings from CRISPR-mediated genetic KO screens in the murine B16F10 melanoma model (Manguso et al., 2017), but is consistent with the role of IFNγ in promoting tumor immune evasion in multiple cancer types (Beatty and Paterson, 2000; Benci et al., 2016, 2019). There have been reports that the duration of IFNγ signaling contributes to differential tumor response to ICB which may explain this apparent discrepancy (Minn, 2015). RNA-seq analysis revealed that IFNγ signaling was active in 4T1 tumors in vivo but not in 4T1 cells in vitro (Figure S1N). Thus, it is possible that prolonged IFNγ signaling in the tumors has immunosuppressive function, which would explain why KO of IFNγ pathway genes enhances immune-mediated killing of TNBC cells.
To confirm our findings, we conducted a competition assay to assess the in vivo growth of 4T1 TNBC cells deficient in IFNγ signaling (Figure S1O). Western blotting confirmed the protein abundance of Jak1 or Stat1 KO in TNBC cells (Figure S1P). Then, we mixed cancer cells (1:1 ratio, mCherry:eGFP) with Jak1 (or Stat1) KO and control Rosa26 KO (see STAR Methods for further details), and implanted the cell mixture into nude and wild-type mice. Flow cytometry analysis in the resulting tumors showed that the relative proportion of Jak1 or Stat1 KO cancer cells became consistently and significantly lower than those of control cells (Figures 1E and 1F) especially in the wild-type mice. The same result was observed in another TNBC syngeneic model EMT6 (Figures 1E and 1F), which not only supports the reliability of in vivo screens using our MusCK library, but also confirms the role of IFNγ signaling in suppressing an anti-tumor immune response in TNBC.
Loss of Cop1 Sensitizes Cancers to Immunotherapy
Achieving adequate statistical significance for discovery in large-scale CRISPR screens requires behavioral consistency of multiple sgRNAs, each with sufficient cell coverage, for each target gene, especially under negative selection. To improve the robustness of our in vivo CRISPR screens, we constructed a second library (MusCK 2.0) focused on 79 candidate genes identified in the primary screen, with 8 sgRNAs per gene (see STAR Methods for further details). We then conducted a validation screen using the MusCK 2.0 library in 4T1-mOva cells implanted into (1) BALB/c Foxn1nu/nu nude hosts; (2) wild-type BALB/c hosts; (3) wild-type BALB/c hosts with ovalbumin pre-vaccination; and (4) wild-type BALB/c hosts with both ovalbumin pre-vaccination and monoclonal anti-PD-1 treatment (Figure S2A). The additional fourth group facilitates the discovery of factors that affect antigen-specific T-cell immunity through the PD-1/PD-L1 axis. As expected, we observed statistically significant and progressively lower tumor volumes in groups (1) through (4) at 16 days after cancer cell implantation (Figure 2A; Figures S2A–S2C). We also observed progressively higher T-cell infiltration (detected by TCRβ+) relative to the total tumor immune infiltrates (marked by Cd45.2+) (Figure 2B; Figures S2D–S2F) in these four groups. In wild-type BALB/c hosts (groups 2–4), relative to Foxn1nu/nu hosts, one would expect depletion of genes required for an effective immune response. Indeed, we observed significant depletion of known mediators of immune evasion (Cd274/Pd-l1) and components of the IFNγ signaling pathway (Jak1, Jak2, Stat1 and Irf1). We also observed depletion of an oncogenic transcriptional activator previously identified by our laboratory in prostate cancer (Trim24) (Groner et al., 2016), an E3 ubiquitin ligase (Cop1), and others (Figure 2C; Table S4). The phenotype of these genes in 4T1 tumors were also observed in a second murine TNBC model (EMT6) (Figures S2G–S2J) and a murine colorectal cancer model (MC38) (Figures S3A–S3D), validating the robustness of our findings.
Figure 2. Second-Round MusCK Screens Identify Cop1 as a Regulator of TNBC Progression.
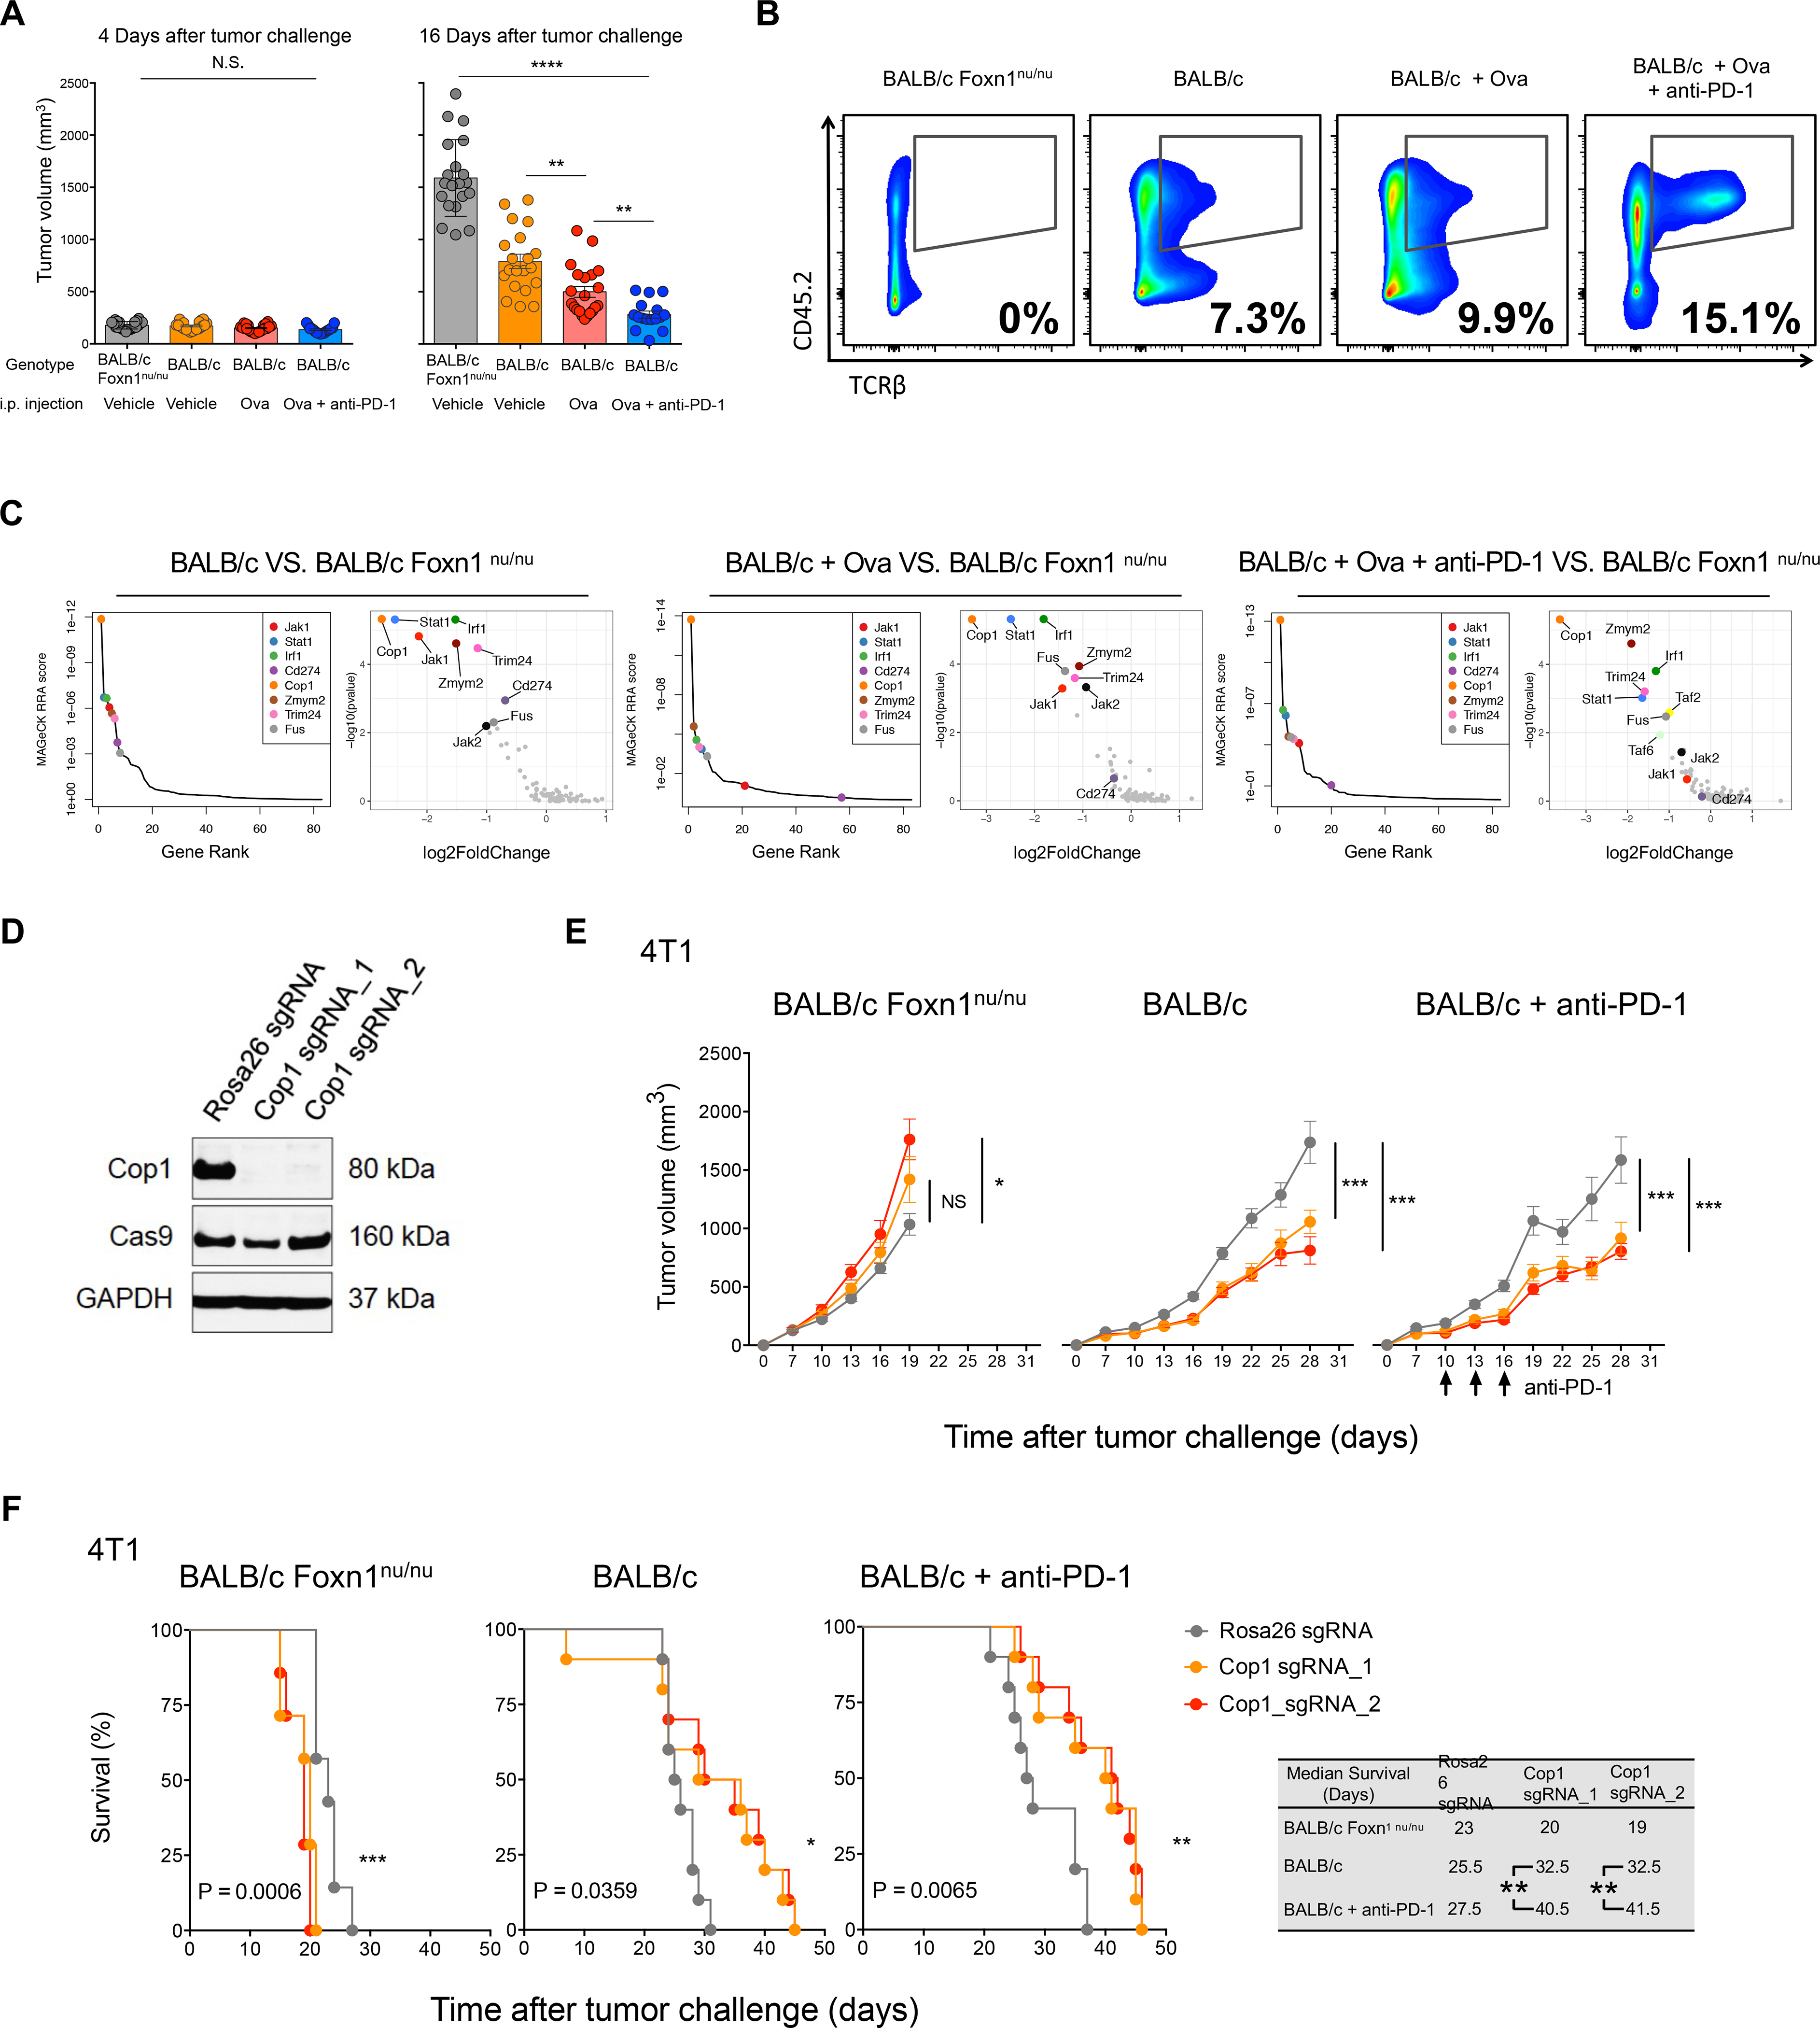
(A) Tumor volume measured at 4 and 16 days post implantation in the MusCK 2.0 screens. Data are shown as mean ± SEM, n = 7–12 mice per group, **p < 0.01, * * * * P < 0.0001, by one-way ANOVA with Benjamini-Hochberg multiple test correction.
(B) Flow cytometry analysis of tumor-infiltrating T cell population (TCRβ+) in the total immune cell population (Cd45.2+).
(C) MAGeCK analysis and RRA ranking of top depleted genes in the MusCK 2.0 screens. Ranked dot plots of depleted genes in immunocompetent hosts compared to immunodeficient nude hosts are shown.
(D) Western blot of Cop1 protein level in 4T1 mouse TNBC cells transduced with sgRNA targeting Cop1 and Rosa26.
(E) Tumor volume over time in host animals implanted with Rosa26 KO and Cop1 KO 4T1 mouse TNBC cells. Data are shown as mean ± SEM, n = 10 mice per group, *p < 0.05, ***p < 0.001, by one-way ANOVA with Benjamini-Hochberg post-test multiple comparison.
(F) Kaplan-Meier survival analysis of host animals bearing Rosa26 and Cop1 KO 4T1 tumors. The sgCop1 cohort with anti-PD-1 treatment survived significantly longer than the other groups. n = 10 mice per group, *p < 0.05, **p < 0.01, ***p < 0.001, by log-rank test.
After two rounds of in vivo screens, Cop1 emerged as the most significantly depleted gene in 4T1 tumors from immunocompetent mice, relative to nude mice (Figures S3E and S3F). While Cop1 KO cells did not decrease viability compared to control Rosa26 KO cells in vitro (Figure 2D; Figure S3G), we observed significantly slower tumor progression of Cop1 KO TNBC cells in vivo, in both wild-type BALB/c hosts with and without anti-PD-1 treatment (Figure 2E; Figure S3H). Kaplan-Meier survival analysis showed that mice with Cop1-deficient tumors had prolonged survival in wild-type mice, with or without anti-PD-1 treatment, compared to nude mice (Figure 2F). In the MC38 colorectal cancer model of immunocompetent C57BL/6 hosts, Cop1 KO in cells was also able to significantly decrease tumor growth and extend mouse survival (Figures S3I–S3K). Remarkably, in MC38 cells, Cop1 KO together with anti-PD-1 treatment in vivo was able to eradicate tumor growth and increase survival to 100% at 60 days post tumor implantation (Figure S3K). The effect of Cop1 KO in the MC38 colorectal cancer syngeneic model suggests that Cop1 inhibition enhances anti-tumor immunity through a mechanism that may be applicable to other cancer types beyond TNBC.
Cop1 Knockout Decreases Macrophage Infiltration by Regulating Macrophage-associated Chemokines
Cop1 was originally discovered in Arabidopsis to induce targeted protein degradation (Osterlund et al., 2000). Multiple substrates of Cop1-mediated protein degradation in mammals with cancer implications have been identified, including the classic tumor-suppressor Tp53 (Dornan et al., 2004a), transcriptional regulator c-Jun (Savio et al., 2008; Wertz et al., 2004), and metabolic regulator Torc2 (Dentin et al., 2007). In humans, COP1 is located in a region of chromosome 1 frequently amplified in breast cancer patients (Figure S4A) (Dornan et al., 2004b). To characterize the effects of Cop1 on anti-tumor immunity, we first performed RNA-seq analysis of Cop1 KO and control Rosa26 KO in 4T1 cells under IFNγ treatment (Figure 3A). Differential expression analysis showed that 754 genes were significantly up-regulated and 1,303 downregulated (q < 0.05) upon Cop1 KO (Figure 3B). Gene set enrichment analysis (GSEA) showed enrichment of down-regulated genes in immune-related pathways, including TNFα signaling, inflammatory responses, JAK-STAT signaling pathways, chemokine and cytokine signaling activities (Figure 3C). We also observed similar results in 4T1 cells without IFNγ stimulation (Figures S4B–S4D).
Figure 3. Cop1 Is a Key Mediator of Macrophage Chemotaxis in TNBC.
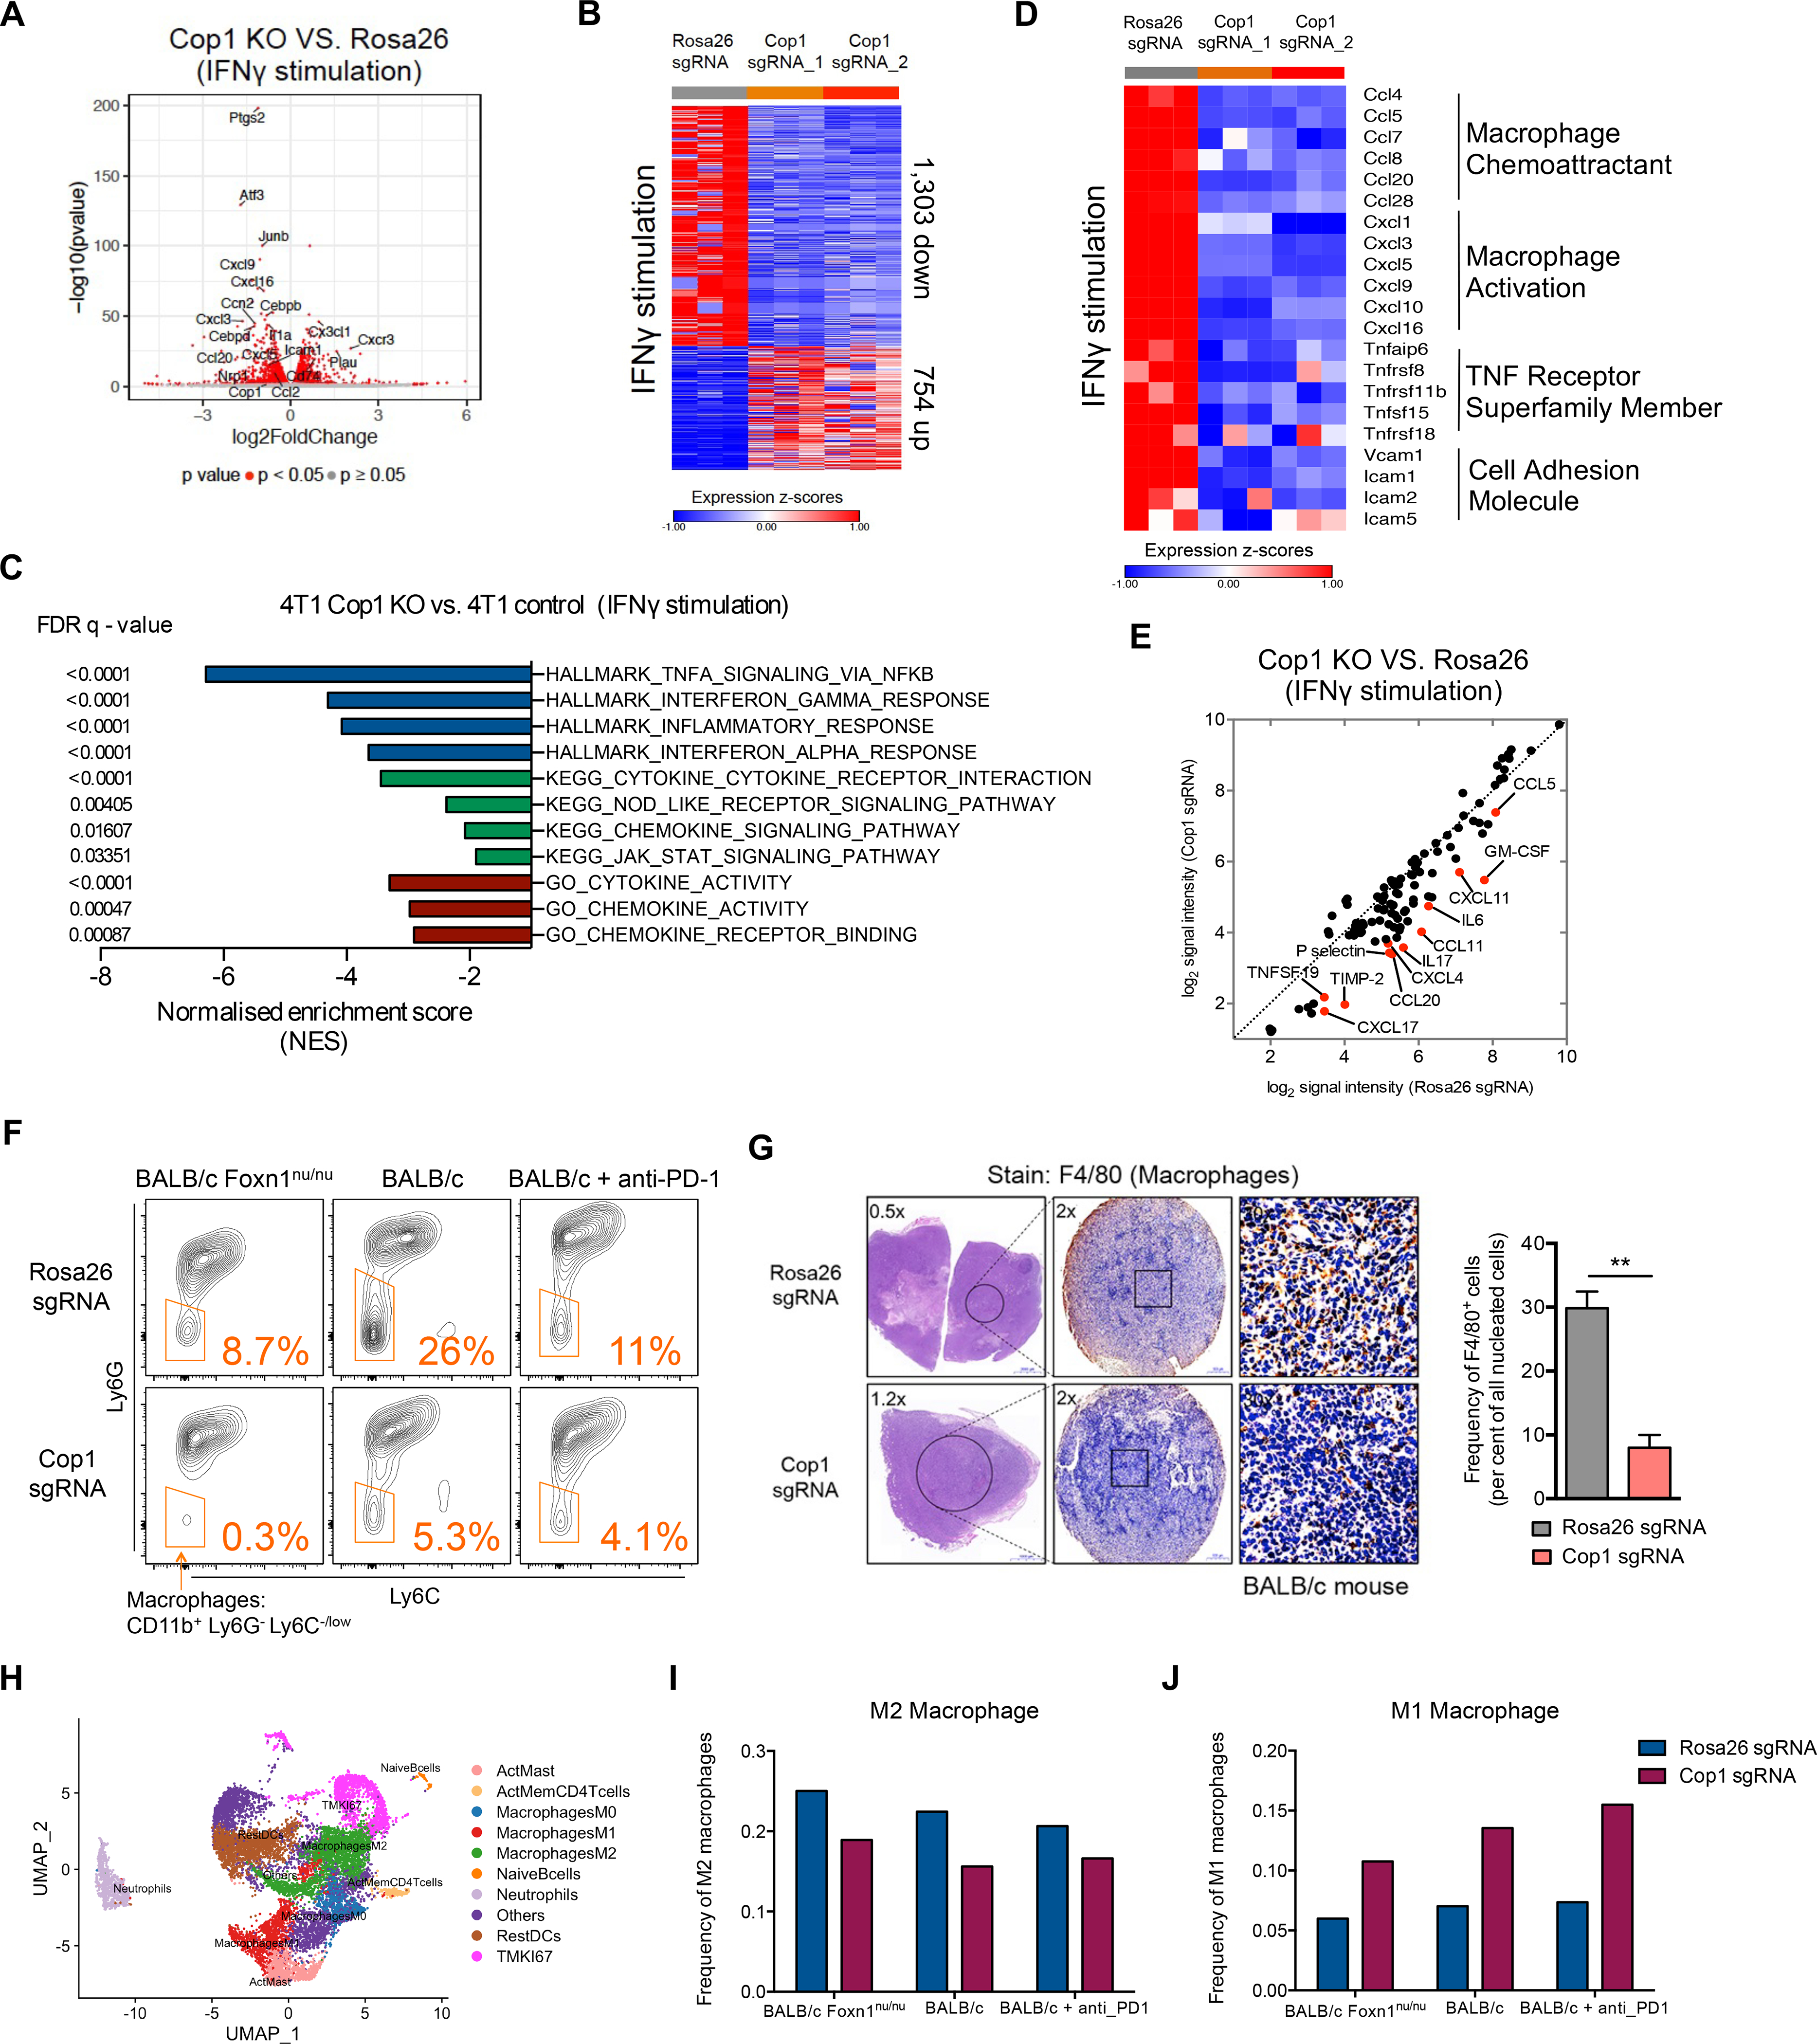
(A) Volcano plot of differentially expressed genes in Cop1 KO 4T1 mouse TNBC cells compared to Rosa26 KO control cells with IFNγ stimulation (at 20 ng/mL for 24 hours). Red dots denote genes significantly (p < 0.05) differentially expressed in compared conditions.
(B) Heatmap showing differential transcriptomic expression in Rosa26 KO and Cop1 KO 4T1 cells with IFNγ stimulation.
(C) Gene set enrichment analysis of downregulated genes in Cop1 KO 4T1 cancer cells compared to Rosa26 KO control cells with IFNγ stimulation. Top depleted pathways in Cop1 KO cells versus Rosa26 KO control cells are shown.
(D) Differential transcriptomic expression of macrophage-related genes in Rosa26 KO and Cop1 KO 4T1 cells with IFNγ stimulation.
(E) Quantification of differential protein expression by cytokine array in Rosa26 KO and Cop1 KO 4T1 cells with IFNγ stimulation.
(F) Flow cytometry analysis of macrophage populations in Rosa26 and Cop1 KO 4T1 tumors grown in different host conditions in vivo. The tumor-infiltrating macrophages were identified as Cd45.2+Cd11clowCd11bhighLy6ClowLy6Glow. The tumor-infiltrating myeloid cells were identified as Cd45.2+Cd11clowCd11bhigh.
(G) Immunohistochemistry of sections show different macrophage infiltration in Rosa26 and Cop1 KO 4T1 tumors. The tumor-infiltrating macrophages were stained by immunohistochemistry with F4/80 antibody, a widely-used monocyte-macrophage marker in mice. n = 5 mice per group. Data are mean ± SEM **p < 0.01, by two-sample t-test.
(H) UMAP plot of cells from the single cell RNA-seq samples profiled, with each cell color coded to indicate the associated cell types.
(I) Frequency of M2 macrophages in all tumor-infiltrating CD45+ cells from control and Cop1-null 4T1 tumors.
(J) Frequency of M1 macrophages in all tumor-infiltrating CD45+ cells from control and Cop1-null 4T1 tumors.
One intriguing result was that Cop1 KO in 4T1 cells, either with or without IFNγ stimulation, resulted in significant down-regulation of key macrophage chemoattractants, cytokines involved in macrophage activation, and members of the TNF receptor superfamily (Figure 3D; Figure S4E). Quantification of protein expression based on a cytokine array containing 96 cytokines confirmed significantly decreased levels of cytokines and chemokines known to recruit and activate macrophages, such as Ccl2, Ccl5, Ccl11, Ccl19, Ccl20, Cxcl4, Cxcl11, Gm-csf, and Il-6 (Figure 3E; Figures S4F and S4G). Consistent with a decrease in cytokines and chemokines, flow cytometry and immunohistochemistry found a significant decrease in macrophage infiltration in the Cop1 KO tumors (Figures 3F and 3G; Figures S4H and S4I). In contrast, no significant change was observed in the level of tumor-infiltrating CD8+ T cells, myeloid cells and monocytes (Figures S4J–S4L). Furthermore, we confirmed the effect of Cop1 KO in decreasing macrophage chemoattractants in the tumors grown in vivo using the same 96-cytokine array and bulk tumor RNA sequencing (Figure S4M and S4N).
To evaluate what macrophage subsets were altered, we performed single-cell transcriptomics (scRNA-seq) on triplicate tumors with Rosa26 gRNAs and Cop1 gRNAs. Analysis of scRNA-seq of the CD45+ immune cells from these KO tumors further revealed decreased M2 macrophage and increased M1 macrophage infiltration upon Cop1 knockout (Figures 3H–3J). Furthermore, in the 4T1 model, macrophage percentage in tumor-infiltrating Cd45+ leukocytes was positively correlated with tumor size, while T-cell percentage was negatively correlated (Figures S4O and S4P). Together, our results suggest that Cop1 in TNBC regulates macrophage chemotaxis in the TME. Inhibition of Cop1 decreases tumor macrophage infiltration, which in turn inhibits tumor progression and improves survival.
Integrated Analyses Identify C/ebpδ as a Specific Protein Substrate of Cop1
We next sought to identify the putative protein substrates of the E3 ubiquitin ligase Cop1. Since most of the known Cop1 substrates are transcription factors (TFs) (Dornan et al., 2004c; Janic et al., 2018; Migliorini et al., 2011a; Vitari et al., 2011), we reasoned that Cop1 KO might stabilize TFs that suppress the expression of macrophage cytokines. To infer the likely TFs underlying the genes that are differentially expressed upon Cop1 KO, we used a computational method that we developed previously called LISA (Qin et al., 2020). Given a list of differentially expressed genes, LISA first estimates the epigenetic model fitting these input genes from a large compendium of publicly available histone mark and chromatin accessibility profiles in the Cistrome database, then uses TF ChIP-seq results and known DNA-binding motifs to infer the driving regulators (Mei et al., 2017; Zheng et al., 2019). LISA analysis of the genes downregulated upon Cop1 KO implicated the CEBP and AP-1 families of TFs as putative regulators (Figure 4A). While a function in transcriptional repression has not yet been reported for the CEBP family, the AP-1 family is known to repress gene transcription (Eferl and Wagner, 2003; Miao and Ding, 2003).
Figure 4. Integrative Analysis Identifies C/ebpδ Activity Is Modulated Upon Cop1 KO.
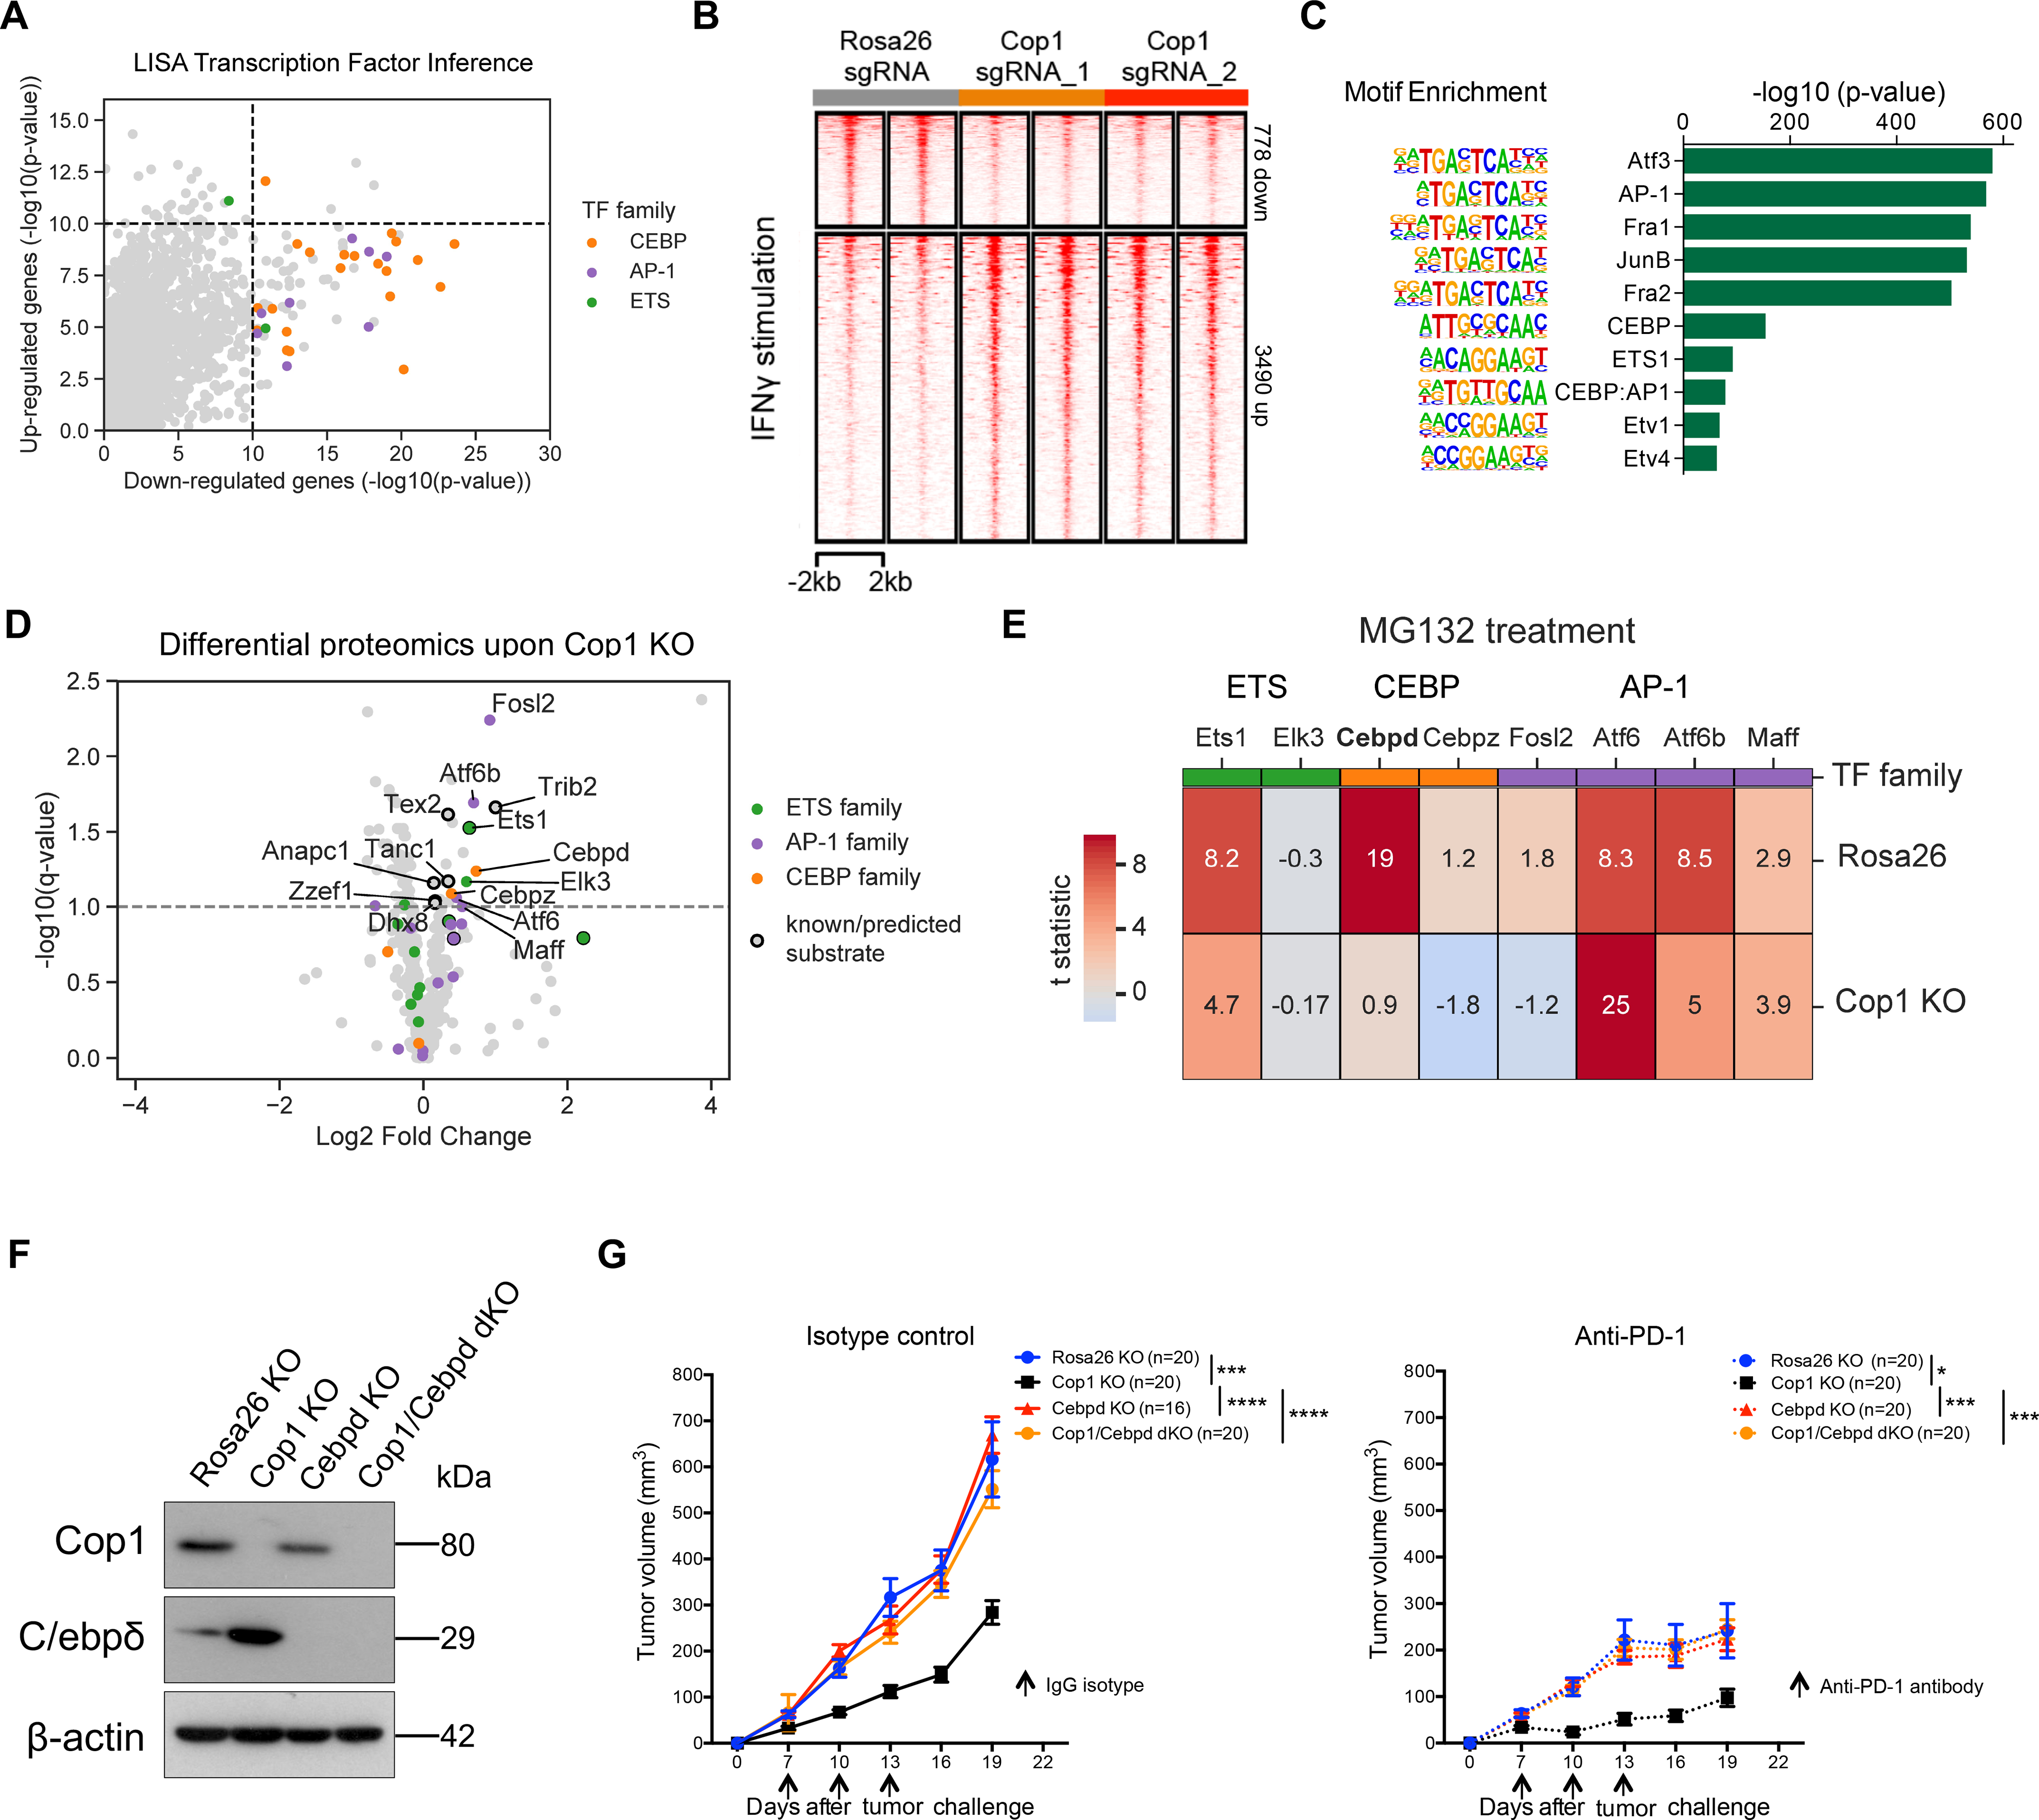
(A) LISA predicts CEBP and AP1 families of transcription factors in regulating Cop1 KO down-regulated genes.
(B) Heatmap showing changes in chromatin accessibility of Rosa26 and Cop1 KO 4T1 cancer cells with IFNγ stimulation (20 ng/mL for 24 hours).
(C) Enrichment of known transcription factor motifs in Cop1 KO/Rosa26 differential peaks.
(D) Proteomic analysis of Rosa26 and Cop1 KO 4T1 cancer cells. Points above the dashed line are statistically significant (q < 0.1).
(E) Heatmap displaying the protein abundance of genes in 4T1 cells with MG132 treatment (proteasome inhibitor). Each row is showing the comparison between proteasome inhibition versus vehicle. If a protein is not degraded by the proteasomal degradation pathway then it should show zero difference in protein expression.
(F) Western blot of Cop1 and C/ebpδ protein levels in 4T1 mouse TNBC cells transduced with sgRNA targeting Cop1, C/ebpδ and Rosa26.
(G) Tumor volume over time in host animals implanted with Rosa26 KO, Cop1 KO, C/ebpδ KO and Cop1/C/ebpδ double KO 4T1 mouse TNBC cells. Data are shown as mean ± SEM, n = 10 mice per group, *p < 0.05, ***p < 0.001, ****p < 0.001, by one-way ANOVA with Benjamini-Hochberg multiple test correction.
In parallel, we hypothesized that the TF substrates stabilized upon Cop1 KO would in turn increase the chromatin binding and the accessibility at these binding sites. We therefore performed ATAC-seq on Cop1 KO 4T1 cells and control Rosa26 KO 4T1 cells. Regardless of IFNγ treatment, Cop1 KO did not change the chromatin accessibility in the vast majority of the peaks (Figure 4B; Figure S5A), although there were more up-regulated ATAC-seq peaks. An analysis of motif enrichment and peak overlap with public ChIP-seq data found Cop1 KO-specific up-regulated peaks to be enriched for binding by the AP-1, CEBP, and ETS families of TFs (Figure 4C; Figure S5B; Table S5). Therefore, the ATAC-seq data support RNA-seq analysis in implicating the AP-1 and CEBP families of TFs as putative substrates of Cop1 in 4T1 cells.
To further validate the substrates of Cop1 protein degradation, we used mass spectrometry to identify proteins with increased abundance in Cop1 KO 4T1 cells compared to control cells (Figures S5C and S5D; Table S6). Among the over seven thousand detected proteins, several members of the ETS, AP-1, and CEBP TF families were significantly up-regulated (FDR <0.1), including known Cop1 substrates c-Jun, Ets1, Ets2, and Etv4 (Figure 4D; Figure S5E). To rule out the possibility of non-proteasomal degradation from secondary effects, we conducted additional proteomics analysis after treating the cells with the proteasome inhibitor MG132. Among the proteins in the CEBP TF family, only C/ebpδ showed Cop1-dependent protein degradation with MG132 treatment (Figure 4E). To further evaluate the effect of C/ebpδ on tumor progression following Cop1 loss function in mouse TNBC models, we implanted 4T1 cells with only Cop1 KO or 4T1 cells harboring both Cop1 and C/ebpδ KO into the mammary fat pads of BALB/c hosts (Figure 4F). We observed that tumor growth of Cop1 KO 4T1 cells is fully rescued by C/ebpδ KO (Figure 4G), indicating that C/ebpδ accumulation induced by Cop1 dysfunction is responsible for the suppression of 4T1 tumor growth. Together, these results provide evidence that in 4T1 cells, C/ebpδ is a specific protein substrate of Cop1, which mediates increased chromatin accessibility, decreased target gene expression and slower tumor growth upon Cop1 KO.
C/ebpδ Suppresses the Expression of Genes that Encode Macrophage-attracting Chemokines in Cancer Cells
To map C/ebpδ binding sites and target genes, we performed C/ebpδ ChIP-seq experiments in 4T1 cells with or without Cop1 KO. Consistent with the increased C/ebpδ protein abundance upon Cop1 KO, there was an overall larger number of up-regulated C/ebpδ binding peaks (Figure 5A) with corresponding greater chromatin accessibility (Figure 5B). Motif analysis found the CEBP motif to be the most enriched motif in up-regulated C/ebpδ peaks, and the AP-1 family member Fos motif to be most enriched in down-regulated C/ebpδ peaks (Figure 5C). This suggests that up-regulated C/ebpδ peaks are the primary effect of Cop1 KO on C/ebpδ.
Figure 5. The COP1-axis Is Associated with Macrophage Infiltration and Response to ICB for Cancer Patients.
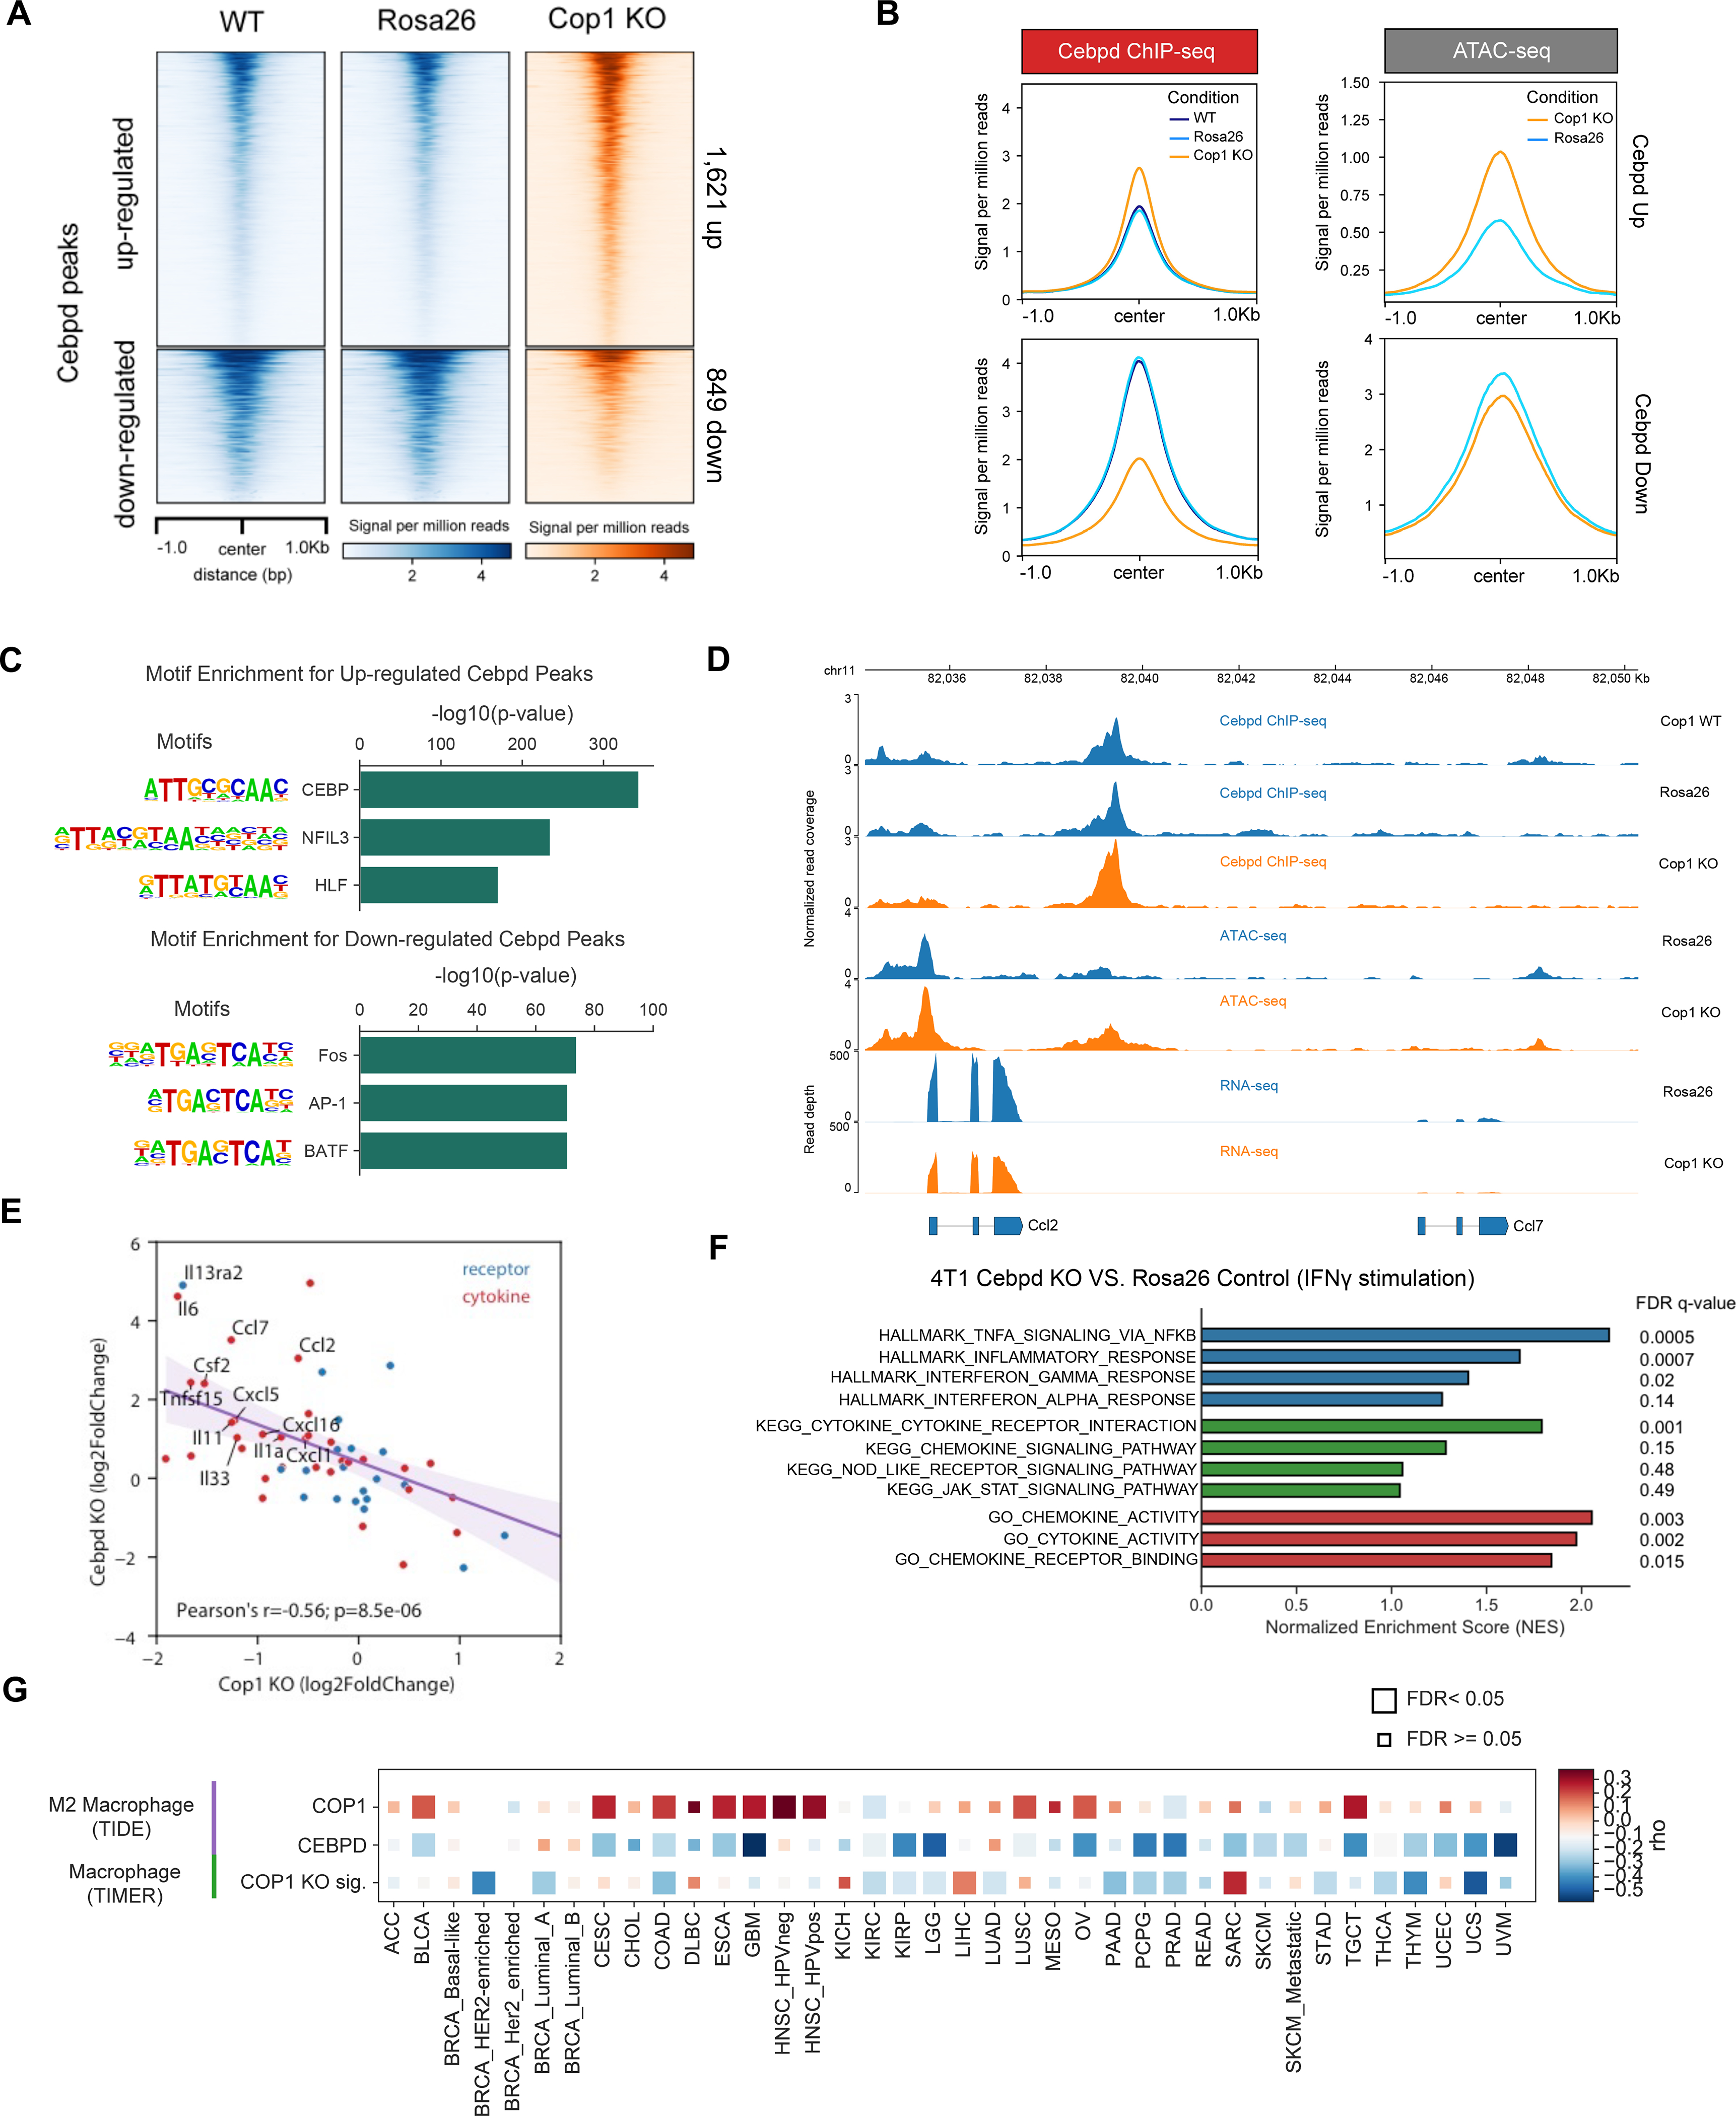
(A) Distribution of normalized read counts in a 2,000 bp window around Cop1 KO-specific C/ebpδ peaks.
(B) Distribution of gene-averaged read counts for the datasets of C/ebpδ ChIP-seq and ATAC-seq.
(C) Significant de novo motifs of Cop1 KO-specific C/ebpδ peaks. p values determined by hypergeometric test.
(D) Normalized signal tracks of ChIP-seq, ATAC-seq and RNA-seq at the Ccl2 and Ccl7 locus in 4T1 cancer cells.
(E) Correlation of differential expression (log fold change) of cytokines and cytokine receptors between Cop1 KO and C/ebpδ KO.
(F) Gene set enrichment analysis of upregulated genes in C/ebpδ KO 4T1 cancer cells compared to Rosa26 KO control cells with IFNγ stimulation.
(G) Heatmap showing the correlation between gene expression of COP1 or CEBPD with inferred macrophage infiltration in The Cancer Genome Atlas (TCGA). CEBPD expression was negatively correlated with M2 macrophages (TIDE). Correlations were obtained through the TIMER website and adjusted for tumor purity. Cancer types are labeled on the x-axis.
To assess what gene sets are regulated by C/ebpδ in 4T1 cancer cells, we evaluated the differentially expressed genes upon Cop1 KO near the C/ebpδ binding sites by Cistrome-GO, an algorithm we previously developed for integrated analysis of ChIP-seq and RNA-seq data (Li et al., 2019). We found that the downregulated genes are significantly associated with regulation of immune-response genes and macrophage chemokines (Figure S5F), such as Ccl2 and Ccl7 (Figure 5D). In contrast, C/ebpδ binding sites near genes that are up-regulated upon Cop1 KO are enriched in amino acid metabolism and peptide biosynthesis (Figure S5F). To further evaluate the transcriptional effects of immune-response genes and macrophage chemokines by C/ebpδ, we performed RNA-seq analysis of C/ebpδ KO. We confirmed that the KO of C/ebpδ has opposite effects compared to Cop1 KO on the regulation of cytokines and cytokine receptors, especially macrophage-related cytokines in 4T1 cells (Figure 5E; Figure S5G). Consistently, pathways down-regulated upon Cop1 KO (Figure 3C) were up-regulated in C/ebpδ KO also (Figure 5F). Taken together, our results indicate that Cop1 KO decreased the proteasomal degradation of C/ebpδ, and the stabilized C/ebpδ suppresses transcription of immune response genes and macrophage cytokines.
To evaluate whether the Cop1 effect on macrophage infiltration and tumor progression in mouse TNBC models (Figures 2E and 3G) is relevant in human tumors, we examined public tumor cohorts. COP1 is more highly expressed in tumor samples compared to adjacent normal samples across many cancer types in The Cancer Genome Atlas (TCGA) (Figure S5H), including breast and colon cancers. Furthermore, COP1 expression is positively correlated with M2 macrophage signature inferred from previous literaures (Jiang et al., 2018; Li et al., 2020), while CEBPD expression is negatively correlated M2 macrophage signature (Figure 5G). An in vitro Cop1 KO signature of differentially expressed genes (see STAR Methods), which may reflect C/ebpδ protein activity, was also negatively correlated with macrophage infiltration inferred from multiple algorithms (Li et al., 2019, 2017; Aran et al., 2017; Newman et al., 2019) (Figure 5G; Figures S5I–S5J). Moreover, by analyzing the proteomics profile of different human breast and colon cancer cell lines (Nusinow et al., 2020), we confirmed the positive association between COP1 protein and macrophage-associated cytokines in human cancer cell lines, including CCL2, CCL7, and other downregulated chemokines upon Cop1 KO in 4T1 cells (Figure S5K). We further evaluated the correlation between COP1 expression and patient survival in TCGA cohorts. Lower COP1 expression in tumors is associated with better outcomes in multiple cancer types, including breast cancer, ovarian cancer, and papillary kidney cancers (Figures S5L–S5N). Together, these data indicate a robust association of high Cop1 and low C/ebpδ expression with increased macrophage infiltration across human cancers.
Cop1 Targets C/ebpδ for Proteasome Degradation via the Scaffolding Protein Trib2
To elucidate how Cop1 degrades the C/ebpδ protein, we screened proteins that were up-regulated upon Cop1 KO for the presence of a predicted Cop1 degron motif (Figures S6A–S6C). To this end, we applied a machine learning approach (see STAR Methods for further details) that was predictive of previously reported degrons in known Cop1 substrates (Figure S6B). This analysis predicted several proteins as the most likely direct Cop1 substrates in 4T1, including Trib2 (Tribbles homolog 2), Tanc1 (Tetratricopeptide Repeat, Ankyrin Repeat And Coiled-Coil Containing 1), Tex2 (Testis Expressed 2), and the known substrate Ets1 (ETS Proto-Oncogene 1) (Figure 4D) (see STAR Methods for further details). Surprisingly, the predicted substrates did not include C/ebpδ or any CEBP family member, suggesting that C/ebpδ might be an indirect substrate of Cop1. We noted that Trib2, the protein with a Cop1 degron whose level is most elevated upon Cop1 KO, has been previously reported to serve as a substrate adaptor for Cop1 to modulate its specificity (Figure S6D) (Keeshan et al., 2006). TRIB family pseudokinases possess a C-terminal tail that serves as a peptide motif for MAPKK/MEK family members, and a second binding motif that facilitates direct association with E3 ubiquitin ligases (Eyers et al., 2017). In human or mouse acute myeloid leukemia (AML), TRIB pseudokinases are known to provide a unique molecular scaffold bound by both C/ebpα and Cop1 (Eyers et al., 2017; Jamieson et al., 2018; Murphy et al., 2015). Notably, C/ebpδ but not C/ebpα was detected at the protein level in 4T1 cells. Based on this, we hypothesized that Trib2 might serve as an adaptor to facilitate the interaction between C/ebpδ and Cop1, leading to Cop1-mediated proteasomal degradation of C/ebpδ (Figure 6A).
Figure 6. Identification of C/ebpδ As a Direct Target of Cop1 via Adaptor Trib2.
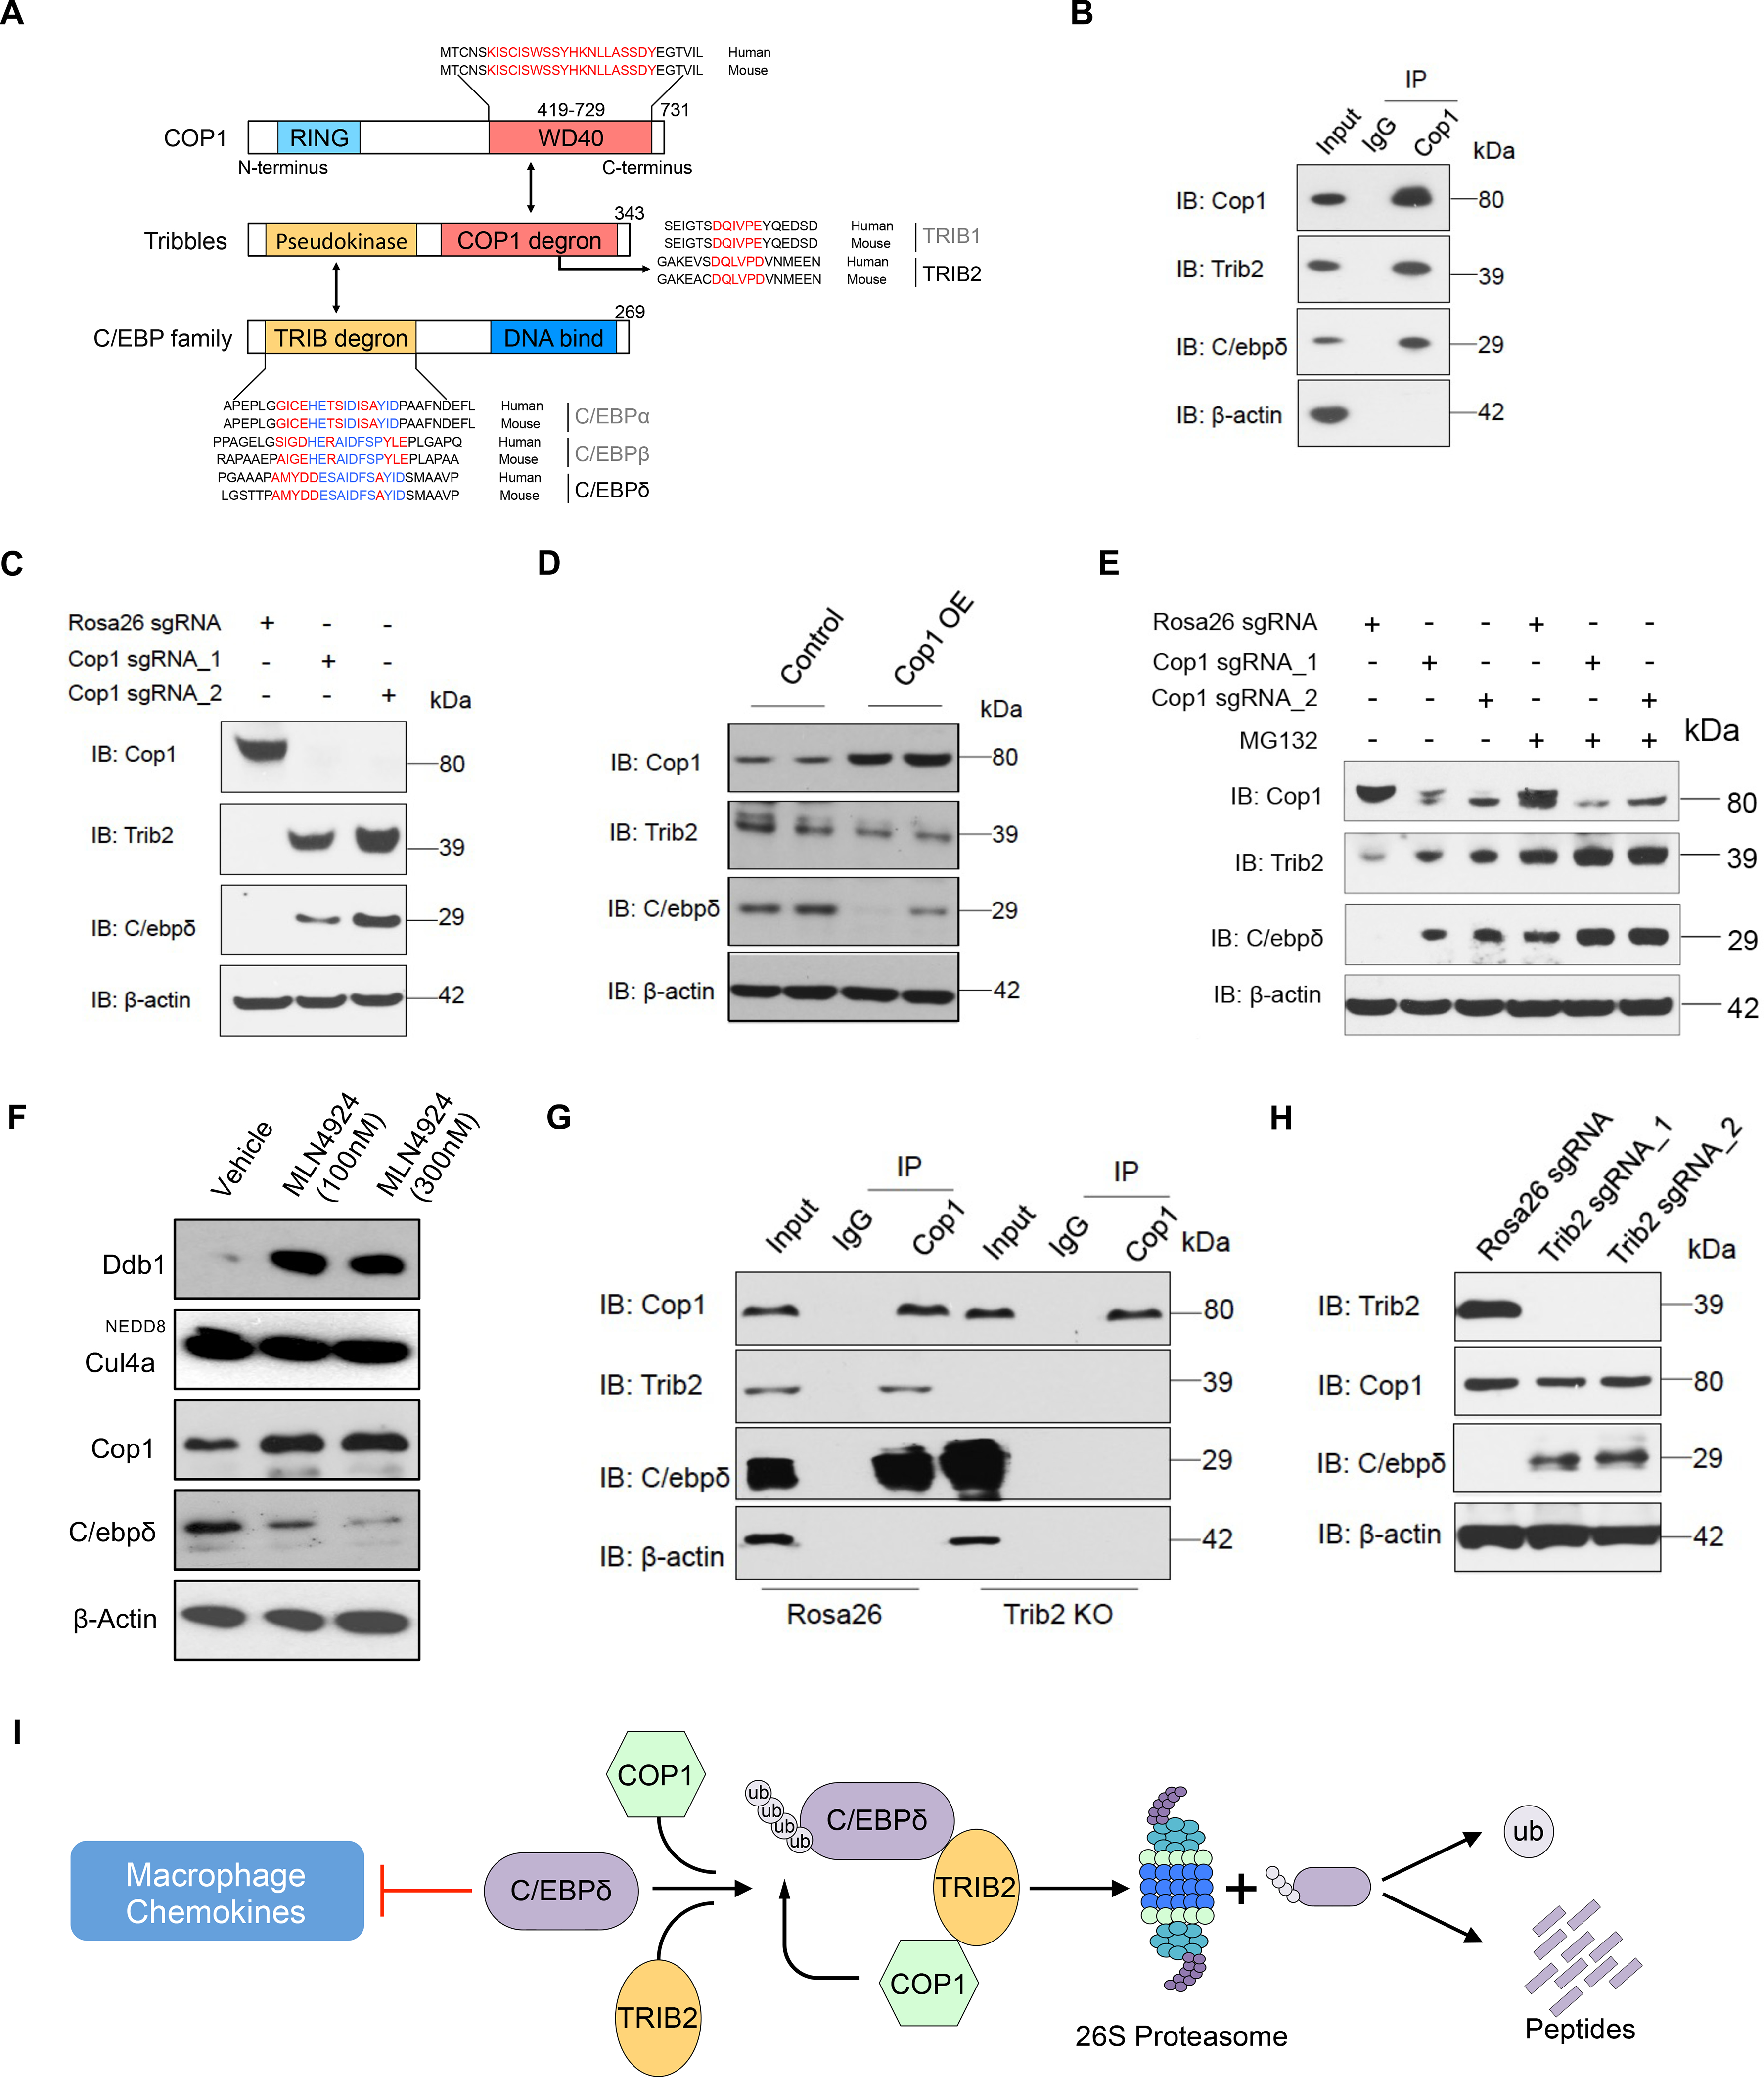
(A) Schematic illustrating motifs of CEBP family members bound by Tribbles-Cop1.
(B) The lysate from wild-type 4T1 cells was incubated with Cop1 antibody or control IgG, and the immunocomplexes were probed with the indicated antibodies.
(C) Western blot showing representative protein levels of Cop1, Trib2 and C/ebpδ in Rosa26 KO and Cop1 KO cancer cells.
(D) Western blot showing representative protein levels of Cop1, Trib2 and C/ebpδ in Cop1 overexpressing and control 4T1 cells.
(E) Western blot showing representative protein levels of Cop1, Trib2 and C/ebpδ in Cop1 KO and Rosa26 KO 4T1 cancer cells with or without MG132 treatment.
(F) Protein levels of Ddb1, Cul4a, Cop1 and C/ebpδ in 4T1 cancer cells under treatment of neddylation inhibitor MLN4924.
(G) Co-immunoprecipitation experiment with Cop1 antibody for Rosa26 KO and Trib2 KO 4T1 cells.
(H) Western blot comparing Trib2 KO and Rosa26 KO (control) 4T1 cancer cells for protein levels of Cop1, Trib2 and Cebpd.
(I) Schematic illustrating degradation of C/ebpδ by Trib2-Cop1.
To test this hypothesis, we first performed co-immunoprecipitation (Co-IP) in wild-type 4T1 cells. This confirmed the co-binding of endogenous Cop1, Trib2, and C/ebpδ (Figure 6B; Figures S6E and S6F). Furthermore, we found that, while Cop1 KO did not significantly increase Trib2 and C/ebpδ mRNA levels (Figure S6G), it significantly increased their protein levels (Figure 6C). In addition, forced overexpression of Cop1 led to a decreased C/ebpδ protein level without affecting its mRNA (Figure 6D; Figure S6H), supporting C/ebpδ post-translational regulation by Cop1.
To confirm that C/ebpδ degradation is mediated by the proteasome pathway, we treated 4T1 cells with selective proteasome inhibitor MG132. We observed that with proteasome inhibition, Trib2 and C/ebpδ proteins were significantly more abundant than in wild-type cells regardless of the Cop1 status (Figure 6E). Moreover, the polyubiquitination level of C/ebpδ was attenuated by Cop1 KO in the 4T1 cells and elevated with proteasome inhibition (Figure S6I). These results indicate that Cop1 can induce the degradation of C/ebpδ through a proteasomal degradation pathway.
Cop1-dependent proteasomal degradation is notoriously complex (Marine, 2012). It has been reported that Cop1 can directly induce the transfer of ubiquitin from E2 proteins to some of its substrates (Dornan et al., 2004c; Seo et al., 2003), or indirectly promote the degradation by linking some substrates to E3 ligase complex, such as CUL4A-DDB1 complex (Vitari et al., 2011; Wertz et al., 2004). We evaluated that whether Cop1 acts as an adaptor protein by bringing C/ebpδ to the Cul4a-Ddb1 E3 ubiquitin ligase complex for degradation. We treated 4T1 cells with the neddylation inhibitor MLN4924 and observed decreased C/ebpδ protein levels under neddylation inhibitor treatment (Figure 6F), suggesting C/ebpδ degradation by Cop1 works through a Cullin-independent mechanism.
Finally, to prove that Trib2 is important in mediating Cop1 degradation of C/ebpδ, we used CRISPR to KO Trib2. This not only disrupted the interaction between Cop1 and C/ebpδ (Figure 6G), but also increased the level of C/ebpδ protein (Figure 6H). Taken together, these results indicate that in 4T1 cancer cells, C/ebpδ is a substrate of Cop1 and the interaction between Cop1 and C/ebpδ is mediated by Trib2, which results in ubiquitination and proteasomal degradation of C/ebpδ (Figure 6I). Cop1 inhibition, which stabilizes C/ebpδ to suppress macrophage chemoattractant release, can increase tumor sensitivity to immunity and immunotherapy (Figure S6J).
DISCUSSION
Triple-negative breast cancers (TNBC) have immunosuppressive tumor microenvironments (TME), preventing an effective response to immune checkpoint blockade (ICB) therapies. There is an urgent need to identify new targets to reprogram the suppressive TNBC TME to enhance immunotherapy efficacy. In this study, we used large-scale CRISPR knockout screens to discover genes that sensitize TNBC to anti-tumor immunity in host mice that differ in microenvironmental competency. We found that the E3 ubiquitin ligase Cop1 regulates the protein abundance of the transcription factor C/ebpδ via an adaptor protein Trib2. C/ebpδ transcriptionally suppresses macrophage chemoattractant release from cancer cells. Cop1 inhibition in TNBCs leads to decreased macrophage infiltration, increased sensitivity to anti-PD-1 treatment, and better survival in mouse models. We also observed associations between COP1 expression, levels of macrophage infiltration, and clinical outcomes in many human cancer types. Our study establishes the role of Cop1 in modulating macrophage infiltration into tumors and in suppressing the effects of immunotherapies.
Activation of the IFNγ signaling pathway in cancer cells has long been considered to facilitate T-cell antigen recognition and activate T-cell cytotoxicity (Gao et al., 2016). Paradoxically, we found breast cancer cells to be sensitized to immunotherapy by loss-of-function of Jak1, Stat1, or Irf1, which are downstream effectors of the IFNγ signaling pathway. Supporting our observation, loss of Jak1 has been reported to prevent progression of breast cancer in mammary cancer models (Chen et al., 2018b; Wehde et al., 2018). Studies in breast cancer and melanoma models also found that sustained IFN-γ activation could have the opposite effect from short-term IFN-γ treatment, thus inducing resistance to immunotherapy (Benci et al., 2016; Jacquelot et al., 2019). This may explain why early phase clinical trials of IFN-γ in melanoma patients failed (Meyskens et al., 1990, 1995). Therefore, the anti- and pro-tumor functions of IFNγ might depend on the tumor context, microenvironmental factors, signaling intensity, and signaling duration.
Over the past decade, Cop1 has been found to play an important role in tumor growth and metastasis (Wei and Kaelin, 2011). A number of potential Cop1 degradation substrates have been identified, including Tp53, c-Jun, Cebpa, Mek1, p65/RelA, Mkk4, Acc1, Mta1, Foxo1, Torc2, and Pea3 (Dornan et al., 2004a; Janic et al., 2018; Migliorini et al., 2011b; Wei and Kaelin, 2011). With both oncogene and tumor suppressor proteins as putative Cop1 substrates, characterization of Cop1 as an oncogene or a tumor suppressor has been inconsistent. Analysis of COP1 essentiality based on CRISPR screens of hundreds of cancer cell lines in the Dependency Map project shows generally weak effects on cell growth in human cancer cell lines in vitro (Tsherniak et al., 2017). This is consistent with the Cop1 knockout phenotype we observed in mouse breast cancer (4T1) and colorectal cancer (MC38) cells grown in vitro. At the same time, Cop1 KO significantly suppressed tumor growth and prolonged survival in wild-type mice, especially mice treated with immune checkpoint blockade, compared to nude mice. This suggests that the effects of Cop1 on tumor progression act through TME reprogramming and immune response, thus implicating Cop1 as an immunotherapy target. In addition, our study revealed a possible mechanism for tumor growth suppression through decreased macrophage recruitment. However, cytokines and chemokines regulated by Cop1-C/ebpδ pathway may influence not only macrophages but also other immune cell types in the TME. For example, Ccl2 was discovered as a chemoattractant for macrophages, but it also attracts monocytes, MDSCs, lymphocytes and neutrophils under specific conditions (Gschwandtner et al., 2019). Therefore, it wii be important to explore the effects of cytokines regulated by Cop1-C/ebpδ on other immune cell types. At the same time, we note that Cop1 is not only expressed in cancer cells but also in immune cells and in normal tissues. Therefore, future studies must evaluate systemic effects of Cop1 inhibition in vivo or in human cancers, especially if a small molecule inhibitor of Cop1 is employed..
Our study found that in cancer cells, Cop1 affects cancer progression through its influence on C/ebpδ proteasomal degradation. The CEBP family of transcription factors are known to regulate many biological processes, including cell differentiation, motility, proliferation, cell death, metabolism and immune responses (Ko et al., 2015). A previous study reported that C/ebpα stability is required to prevent Trib1-Cop1 complex-driven acute myeloid leukemia (Nakamae et al., 2017). Another study found that an aberrant C/ebpα protein levels caused by Trib1 deficiency in hematopoietic cells results in severe reduction of M2-like macrophages in bone marrow, spleen, lung, and adipose tissues (Satoh et al., 2013). A more recent study in Alzheimer’s disease reported that C/EBPβ in microglia, which drives a potent proinflammatory program, is regulated at the protein level by COP1 (Ndoja et al., 2020). In this study, we further showed the effect of Cop1 on macrophage infiltration and tumor growth through Trib2 and C/ebpδ in solid tumors. In addition, COP1 expression is associated with high macrophage infiltration, and the Cop1 knockout signature is associated with low macrophage infiltration across many human cancer types.
We note that although the level of C/ebpδ protein is the most significantly changed CEBP family member upon Cop1 KO, it is not the only CEBP family member whose protein levels are affected. It is possible that in other cancer types or immune cells, Cop1 KO could stabilize other CEBP family members that function in suppressing macrophage infiltration and tumor growth. In addition, our RNA-seq, ATAC-seq and proteomics analyses suggest that the AP-1 family of transcription factors might interact with C/ebpδ, or mediate secondary effects, upon Cop1 KO. Further studies are needed to pinpoint the specific AP-1 family members involved, and to elucidate this interaction and its effect.
Currently available immune checkpoint blockade antibodies, such as anti-PD-1, anti-PD-L1, and anti-CTLA4, aim to facilitate cancer cell recognition by lymphocytes and increase T cell cytotoxicity. However, the majority of human tumors, especially from breast, prostate, colon, and lung cancers, are tumors with low levels of cytotoxic T lymphocytes (CTL), and most tumors generally elicit low immune activity. Therefore, recent cancer immunology research and immune-oncology drug development have been focused on reprogramming the TME by killing immunosuppressive fibroblasts (Noy and Pollard, 2014) or macrophages (Motz and Coukos, 2013) to help T-cell infiltration. The fact that different syngeneic tumor models have such different TMEs indicates that cancer-cell intrinsic mechanisms may determine whether a tumor supports an effective or ineffective immune response. Our study, together with previous work (Codina et al., 2019; Lawson et al., 2020; Li et al., 2020; Manguso et al., 2017), demonstrates the effectiveness of in vivo CRISPR screens in identifying such cancer-cell intrinsic TME regulators. However, in the TME, it is possible that the cytokine effects derived from cancer cells on immune cells are short-ranged, then heterogeneous distributions of cytokines are a potential reason influencing the cell extrinsic effects. These in vivo studies could only test a restricted set of genes in a limited number of syngeneic tumor models. Similar approaches applied to more genes in additional syngeneic models are likely to identify additional targets that can reprogram the TME to enhance immunotherapy response.
Limitations of the study
Our observation showed that loss of E3 ubiquitin ligase, Cop1, in TNBC cancer cells decreases the secretion of macrophage-associated chemokines, reduces tumor macrophage infiltration, enhances antitumor immunity, and strengthens ICB response. We found that the effects of Cop1 on gene expression is largely mediated by proteasomal degradation of the C/ebpδ protein, but the mechanisms of C/ebpδ’s regulation of downstream gene expression need better characterization. Our preliminary data showed that genes with highest C/ebpδ binding can be either up-regulated or down-regulated in C/ebpδ-KO cells, suggesting context-dependent gene expression regulation. Further studies are needed to elucidate the regulatory mechanisms. Furthermore, Cop1 has not been successfully targeted with effective therapeutic drugs, limiting the immediate translational value of targeting Cop1. However, recent studies have developed small molecule and/or PROTAC inhibitors for multiple other E3 ubiquitin ligases, such as MDM2 (Tisato et al., 2017; Wachter et al., 2017), cIAP (Sun et al., 2014), TRIM24 (Gechijian et al., 2018), and DCAF16 (Zhang et al., 2019). We expect that Cop1-targeting inhibitors can be developed in the near future to potentiate ICB therapy in TNBC.
STAR+METHODS
RESOURCE AVAILABILITY
Lead contact
Further information and requests for resources (including code) should be directed to and will be fulfilled by the Lead Contact, X. Shirley Liu (xsliu@ds.dfci.harvard.edu).
Materials availability
Further information and requests for reagents may be directed to, and will be fulfilled by Dr. Myles Brown (Myles_Brown@DFCI.harvard.edu). A list of critical reagents (key resources) is included in the Key Resources Table. Relevant plasmids are available to the academic community. For additional materials, please email the lead contact for requests. Some material may require requests to collaborators and/or agreements with various entities. Requests are reviewed by DFCI regarding intellectual property or confidentiality obligations. Material that can be shared will be released via a Material Transfer Agreement.
KEY RESOURCES TABLE.
| REAGENT or RESOURCE | SOURCE | IDENTIFIER |
|---|---|---|
| Antibodies | ||
| Rabbit monoclonal anti-mouse/human Cop1 | Bethyl | Cat# A300-894A, RRID:AB_625290 |
| Rabbit monoclonal anti-mouse/human PD-L1 | Thermo Fisher Scientific | Cat# PA5-20343, RRID:AB_11153819 |
| IgG2a Isotype control | Bio X Cell | Cat# BE0089, RRID:AB_1107769 |
| Rabbit monoclonal anti-mouse/human p53 | Cell Signaling Technology | Cat# 9282, RRID:AB_331476 |
| Mouse monoclonal anti-human ER | Cell Signaling Technology | Cat# 2512, RRID:AB_331291 |
| Rabbit monoclonal anti-human/mouse PR | Cell Signaling Technology | Cat# 3153, RRID:AB_1031219 |
| Mouse monoclonal anti-human HER2 | Santa Cruz Biotechnology | Cat# sc-33684, RRID:AB_627996 |
| Rabbit monoclonal anti-human/mouse GAPDH | Cell Signaling Technology | Cat# 5174, RRID:AB_10622025 |
| Rabbit monoclonal anti-human/mouse STAT1 | Cell Signaling Technology | Cat# 14994, RRID:AB_2737027 |
| Rabbit monoclonal anti-human/mouse JAK1 | Cell Signaling Technology | Cat# 3344, RRID:AB_2265054 |
| Rabbit monoclonal anti-human/mouse C/EBPδ | Abcam | Cat#ab245214 |
| Rabbit monoclonal anti-human/mouse TRIB2 | Cell Signaling Technology | Cat# 13533, RRID:AB_2798250 |
| Rabbit monoclonal anti-human/mouse C/EBPα | Cell Signaling Technology | Cat# 8178, RRID:AB_11178517 |
| Goat anti-Mouse IgG Secondary Antibody, HRP | Thermo Fisher Scientific | Cat# 31430, RRID:AB_228307 |
| Donkey anti-Rabbit IgG Secondary Antibody, HRP | Thermo Fisher Scientific | Cat# 31458, RRID:AB_228213 |
| Ly-6C antibody | BD Biosciences | Cat# 562727, RRID:AB_2737748 |
| FITC anti-mouse CD206 | BioLegend | Cat# 141703, RRID:AB_10900988 |
| PE anti-mouse/human CD11b antibody | BioLegend | Cat# 101207, RRID:AB_312790 |
| PE/Cyanine7 anti-mouse Ly-6G antibody | BioLegend | Cat# 127617, RRID:AB_1877262 |
| CD11c antibody | BD Biosciences | Cat# 561119, RRID:AB_10562405 |
| APC/Cyanine7 anti-mouse CD45.2 antibody | BioLegend | Cat# 109823, RRID:AB_830788 |
| Brilliant Violet 421 (TM) anti-mouse CD335 (NKp46) antibody | BioLegend | Cat# 137612, RRID:AB_2563104 |
| Brilliant Violet 510(TM) anti-mouse CD62L antibody | BioLegend | Cat# 104441, RRID:AB_2561537 |
| Brilliant Violet 605(TM) anti-mouse/human CD44 antibody | BioLegend | Cat# 103047, RRID:AB_2562451 |
| Brilliant Violet 711 (TM) anti-mouse CD8a antibody | BioLegend | Cat# 100747, RRID:AB_11219594 |
| Rat Anti-Mouse CD49b / Pan-NK Cells Monoclonal Antibody | BD Biosciences | Cat# 561067, RRID:AB_2034010 |
| PE anti-mouse CD45.2 antibody | BioLegend | Cat# 109807, RRID:AB_313444 |
| PE/Cyanine7 anti-mouse TCR beta chain antibody | BioLegend | Cat# 109221, RRID:AB_893627 |
| APC/Cyanine7 anti-mouse CD4 antibody | BioLegend | Cat# 100413, RRID:AB_312698 |
| I-A/I-E antibody | BD Biosciences | Cat# 563414, RRID:AB_2738191 |
| APC anti-mouse CD19 antibody | BioLegend | Cat# 115511, RRID:AB_313646 |
| Experimental Models: Cell Lines | ||
| Human: HEK293FT | Thermo Fisher Scientific | Cat#R70007 |
| Human: MCF-7 | American Type Culture Collection | Cat# HTB-22, RRID:CVCL_0031 |
| Human: T47D | American Type Culture Collection | Cat# HTB-133, RRID:CVCL_0553 |
| Mouse: 4T1 | American Type Culture Collection | Cat# CRL-2539, RRID:CVCL_0125 |
| Mouse: EMT6 | American Type Culture Collection | Cat# CRL-2755, RRID:CVCL_1923 |
| Mouse: 246 | Myles Brown Lab | N/A |
| Mouse: JC | American Type Culture Collection | Cat# CRL-2116, RRID:CVCL_3530 |
| Mouse: MC38 | Kai Wucherpfennig Lab | N/A |
| Experimental Models: Organisms/Strains | ||
| Mouse: BALB/c | IMSR | Cat# CRL:028, RRID:IMSR_CRL:028 |
| Mouse: BALB/c Foxn1nu/nu | IMSR | Cat# CRL:194, RRID:IMSR_CRL:194 |
| Mouse: C57BL/6 | IMSR | Cat# JAX:000664, RRID:IMSR_JAX:000664 |
| Mouse: C57BL/6 Foxn1nu/nu | IMSR | Cat# JAX:000819, RRID:IMSR_JAX:000819 |
| Bacterial and Virus Strains | ||
| XL10-Gold Ultracompetent Cells | Agilent | Cat# 200314 |
| Endura ElectroCompetent Cells | Lucigen | Cat# 60242-2 |
| Chemicals, Peptides, and Recombinant Proteins | ||
| PBS | GIBCO | Cat# 14190250 |
| DMEM, high glucose, pyruvate | GIBCO | Cat# 11995065 |
| Lonza BioWhittaker L-Glutamine (200mM) | Lonza | Cat# BW17605E |
| Fetal bovine serum | VWR | Cat# 9706 |
| Penicillin-Streptomycin | GIBCO | Cat# 15140122 |
| E-Gel Low Range Quantitative DNA Ladder | Invitrogen | Cat# NP0008 |
| E-Gel EX Agarose Gels, 2% | Life Technologies | Cat# G402002 |
| NuPAGE 3–8% Tris-Acetate Protein Gels, 1.5 mm, 10-well | Life Technologies | Cat# EA0378BOX |
| NuPAGE™ LDS Sample Buffer | Life Technologies | Cat# NP0008 |
| Pierce ECL Western Blotting Substrate | Thermo Fisher Scientific | Cat# 32106 |
| Precision Plus Protein™ Dual Color Standards | Bio-Rad Laboratories | Cat# 161-0394 |
| X-tremeGENE™ HP DNA Transfection Reagent | Sigma-Aldrich | Cat# 6366236001 |
| Polybrene | Sigma-Aldrich | Cat# 107689-10G |
| Puromycin dihydrochloride | Thermo Fisher Scientific | Cat# A1113803 |
| BamHI-HF | New England Biolabs | Cat# R3136S |
| EcoRI-HF | New England Biolabs | Cat# R3101S |
| FastDigest Esp3I | Thermo Fisher Scientific | Cat# FD0454 |
| Q5 DNA Polymerase | New England Biolabs | Cat# M0491L |
| Nuclease-Free Water | Ambion | Cat# AM9938 |
| Pierce™ Homobifunctional Cross Linkers | Life Technologies | Cat# 20593 |
| 2-Mercaptoethanol | Sigma Aldrich | Cat# M6250-10ML |
| Dynabeads™ Protein A | Thermo Fisher Scientific | Cat# 10004D |
| Dynabeads™ Protein G | Thermo Fisher Scientific | Cat# 10002D |
| EDTA | Sigma Aldrich | Cat# E8008-100ML |
| Protease/Phosphatase Inhibitor Cocktail (100X) | Cell Signaling Technology | Cat# 5872S |
| Quick-Load 1 kb Plus DNA Ladder | New England Biolabs | Cat# N0469S |
| LB Broth | Mp Biomedicals | Cat# 244610 |
| L-Broth Agar Large Capsules | Mp Biomedicals | Cat# MP 113001236 |
| RIPA buffer | Invitrogen | Cat# R0278 |
| Pierce 16% Formaldehyde (w/v), Methanol-free | Life Technologies | Cat# 28906 |
| Opti-MEM I Reduced Serum Medium, no phenol red | Thermo Fisher Scientific | Cat# 11058021 |
| Critical Commercial Assays | ||
| QIAprep Spin Miniprep Kit | QIAGEN | Cat# 27106 |
| RNeasy Plus Mini Kit | QIAGEN | Cat# 74134 |
| QIAquick PCR Purification Kit | QIAGEN | Cat# 28104 |
| QIAquick gel extraction kit | QIAGEN | Cat# 28704 |
| Gibson Assembly Master Mix | New England Biolabs | Cat# E2611L |
| iScript cDNA Synthesis Kit | Bio-Rad Laboratories | Cat# 1708891 |
| SsoAdvanced Univ SYBR Grn Suprmx | Bio-Rad Laboratories | Cat# 1725272 |
| Qubit dsDNA HS Assay Kit | Thermo Fisher Scientific | Cat# Q32854 |
| Qubit RNA HS Assay Kit | Thermo Fisher Scientific | Cat# Q32855 |
| GenElute™ HP Plasmid Maxiprep Kit | Sigma-Aldrich | Cat# NA0410-1KT |
| Ampure xp | Beckman Coulter | Cat# A63881 |
| Mouse Cytokine Array | RayBiotech | Cat# C1000 |
| BCA Assay Kit | Thermo Fisher Scientific | Cat# 23225 |
| SMARTer® ThruPLEX® DNA-Seq Kit | Takara Bio | Cat# R400675 |
| Oligonucleotides | ||
| MusCK oligo pool | Twist bioscience | N/A |
| MusCK2.0 oligo pool | Twist bioscience | N/A |
| Primers for knockout or real-time PCR, see Data and code availability | This paper | N/A |
| Recombinant DNA | ||
| lentiCRISPR v2 blast | Addgene | RRID:Addgene_83480 |
| lentiCRISPR v2 puro | Addgene | RRID:Addgene_98290 |
| pMD2.G | Addgene | RRID:Addgene_12259 |
| psPAX2 | Addgene | RRID:Addgene_12260 |
| pCI-neo-sOVA | Addgene | RRID:Addgene_25098 |
| pCI-neo-mOVA | Addgene | RRID:Addgene_25099 |
| pCI-neo-cOVA | Addgene | RRID:Addgene_25097 |
| pcDNA3-OVA | Addgene | RRID:Addgene_64599 |
| lentiV2-blast-sOva | This paper | N/A |
| lentiV2-blast-mOva | This paper | N/A |
| lentiV2-blast-cOva | This paper | N/A |
| lentiV2-blast-Ova | This paper | N/A |
| pLentiCRISPR-EGFP | Addgene | RRID:Addgene_75159 |
| pEF1A-puro | This paper | N/A |
| pLentiCRISPR-mCherry | Addgene | RRID:Addgene_75161 |
| Software and Algorithms | ||
| GraphPad Prism 7 | GraphPad Software | https://www.graphpad.com |
| GSEA | Mootha et al., 2003 | http://software.broadinstitute.org/gsea/msigdb/annotate.jsp |
| Flow Jo_v10 | FlowJo | http://www.flowjo.com/ |
| BWA | Li and Durbin, 2009 | https://github.com/lh3/bwa |
| CoolBox | Xu et al., 2021 | https://github.com/GangCaoLab/CoolBox |
| Bowtie2 | Langmead and Salzberg, 2012 | http://bowtie-bio.sourceforge.net/bowtie2/index.shtml |
| LISA | Qin et al., 2020 | http://cistrome.org |
| Cistrome-GO | Li et al., 2019 | http://go.cistrome.org |
| LIMMA | Ritchie et al., 2015 | https://bioconductor.org/packages/release/bioc/html/limma.html |
| Samtools | Li et al., 2009 | http://samtools.sourceforge.net/ |
| Deposited data | ||
| Data files for RNA-seq (processed data) | This paper | The NCBI GEO database (GSE171467, GSE173296) |
| Data files for ATAC-seq (processed data) | This paper | The NCBI GEO database (GSE174784) |
| Data files for ChIP-seq (processed data) | This paper | The NCBI GEO database (GSE175332) |
| Primer sequence | This paper | https://data.mendeley.com/datasets/9d5499gb8x/1 |
| Code | This paper | https://github.com/liulab-dfci/Cop1_Cell_2021 |
| Other | ||
| Corning Filter System (0.45um) | Corning Life Sciences | Cat# 431096 |
| milliTUBE 1 ml AFA Fiber | Covaris Inc. | Cat# 520130 |
| NITROCEL MEMB 0.45um | Bio-Rad Laboratories | Cat# 1620115 |
| Multiplate™ 96-Well PCR Plates | Bio-Rad Laboratories | Cat# MLL9601 |
| QUBIT ASSAY TUBES SET | Life Technologies | Cat# Q32856 |
| Microseal B Adhesive Seals | Bio-Rad Laboratories | Cat# MSB-1001 |
Data and code availability
The processed sequencing data in this paper have been deposited into the NCBI GEO database: GSE171467, GSE173296, GSE174784, GSE175332. Additional Supplemental Items are available at Mendeley Data: https://data.mendeley.com/datasets/9xkgn447vz/1; https://data.mendeley.com/datasets/9d5499gb8x/1. All the code are also available at GitHub: https://github.com/liulab-dfci/Cop1_Cell_2021.
EXPERIMENTAL MODEL AND SUBJECT DETAILS
Mice
All animal experiments were approved by the Institutional Animal Care and Use Committee (IACUC) of Dana Farber Cancer Institute (DFCI) and performed with approved protocol (16005). Six to eight week old female BALB/c (Stock# 028) and BALB/c Foxn1nu/nu (Stock# 194) were obtained from Charles River Laboratory (Wilmington, MA). Six to eight week old female C57BL/6 (Stock# 000664) and C57BL/6 Foxn1nu/nu (Stock# 000819) were obtained from Jackson Laboratory (Bar Harbor, ME). All animals were housed in standard individually ventilated, pathogen-free conditions, with 12h : 12h light cycle, room temperature (21–23°C) and 40%−60% relative humidity. When a cohort of animals were receiving multiple treatments, animals were randomized by 1) randomly assign animals to different groups using littermates, 2) random mixing of mice prior to treatment, maximizing the evenness or representation of mice from different cages in each group, and/or 3) random assignment of mice to each group, in order to minimize the effect of gender, litter, small difference in age, cage, housing position, where applicable. Average tumor sizes were consistent between treatment groups to account for selection bias.
Cell Lines
Murine 4T1, EMT6, JC breast cancer cells were obtained from American Type Culture Collection (ATCC) and cultured according to standard protocols. MCF7 and T47D human breast cancer cells were derived and cultured as previously described (Xiao et al., 2018). MC38 murine colon adenocarcinoma cells were obtained from Kai Wucherpfennig laboratory.
METHOD DETAILS
Large-scale mouse CRISPR library cloning
SgRNA design primarily targeted low G-C content regions of the genome. We assigned predicted performance scores to all possible sgRNAs targeting each gene, and selected top candidate sgRNAs with the highest predicted on-target KO efficiency and lowest off-target efficiency (Chen et al., 2018a; Xu et al., 2015). Customized single-stranded oligonucleotide pools of CRISPR guide RNA (sgRNA) libraries were synthesized by Twist Bioscience (South San Francisco, CA). The double-stranded oligonucleotides were generated by polymerase chain reaction and cloned into lentiviral CRISPR vector (lentiCRISPR-v2-puro) by Gibson assembly at estimated equal molar ratios to generate the large-scale mouse CRISPR library (MusCK and MusCK 2.0 libraries). The MusCK library consisted of 24,622 sgRNAs including 1,000 non-targeting controls (NTCs) and 23,622 unique sgRNAs targeting 4,787 gene locations in the genome. The MusCK 2.0 library consisted of 800 sgRNAs including 168 non-targeting controls (NTCs) and 632 unique sgRNAs targeting 79 gene locations in the genome. We were aware that in large-scale CRISPR screen efforts, the statistical power of discovery is particularly sensitive to the behavioral consistency of multiple sgRNAs for each target gene. “Outlier” behavior (extreme depletion or enrichment) of one sgRNA out of all sgRNAs targeting the same gene could result in a false positive result. We recognize that the CRISPR KO libraries designed by the Broad Institute are so far the most widely accepted in genomic screen studies; thus, we wanted to ensure that our findings by the MusCK library are reproducible when the Broad sgRNA design principles were applied. To this end, in the MusCK 2.0 library, eight sgRNAs (four designed by our group in MusCK, another four referenced from the Broad Institute’s Brie Mouse CRISPR Knockout Pool Library (Doench et al., 2016) were designated to each candidate gene. An estimated library coverage of ~300X (total colonies / sgRNAs) was achieved by electroporation. These libraries were subsequently sequence-verified by Illumina sequencing to ensure the high quality of sgRNA distribution.
Viral library production
The CRISPR library plasmids were transfected into HEK293FT cells at 90% confluence in 15cm tissue culture plates. Viral supernatant was collected at 48 hours and 72 hours post-transfection, filtered via a 0.45 μm filtration unit (Corning, Cat# 430770). The supernatant was subsequently aliquoted and stored in −80 °C freezer until use.
Viral transduction of cancer cells
Cancer cells were cultured according to standard protocols. Similar to our previous studies (Fei et al., 2017; Xiao et al., 2018), for the pooled large-scale CRISPR screen, a total of >1×10⁸ cancer cells were transduced with lentivirus containing the library described above at a multiplicity of infection (MOI) of ~0.3. After puromycin selection for 3 days, ~30% of the surviving cells were stored as Day-0-input samples at −80°C, and the rest of cells were cultured for in vitro or in vivo screenings. PCR of the regions targeted by the library was performed on genomic DNA to construct the sequencing library. Each library was sequenced at ~30 million reads to achieve ~300-fold coverage over the CRISPR library. Sequencing data were analyzed by using MAGeCK and MAGeCK-VISPR (Li et al., 2014, 2015; Wang et al., 2019).
Genomic DNA extraction
For genomic DNA extraction, two methods were used. Method 1: for cellular samples with a total number greater than 3 ×10⁷ cells, or tumor samples from mice, a custom DNA extraction protocol was used. Briefly, frozen tumors were disrupted on dry ice, then resuspended in 7 mL of Lysis Buffer (400 mM Sodium chloride 10 mM Tris, 2 mM EDTA, 0.5% SDS, pH 8) in a 15 ml conical tube, and 80 μL of 20 mg/ml Proteinase K (Invitrogen) were added to the tumor/cell samples and incubated at 55°C for at least 6 hours. The next day, 80 μl of 20 mg/ml RNase A (Invitrogen) was added to the lysed sample, which was then inverted 10 times and incubated at 65°C for 60 minutes. Samples were cooled on ice before addition of 7 mL of pre-chilled phenol/chloroform (Ambion) to precipitate proteins. The samples were vortexed at high speed for 20 seconds and then centrifuged at 14,000 rpm for 10 minutes. Then, the upper aqueous phase was carefully decanted into a new 15 mL conical tube. Then 7 ml freshly prepared 70% ethanol was added to the tube, vortexed at high speed for 20 second and centrifuged at 12,000 rpm for 10 minutes. Genomic DNA was visible as a small white pellet in each tube. The supernatant was discarded, 6 ml of 70% ethanol was added, the tube was inverted 10 times, and then centrifuged at 12,000 rpm for 5 minutes. The supernatant was discarded by pouring; the tube was briefly spun, and remaining ethanol was removed using a P200 pipette. After air-drying for more than 30 minutes, the DNA changed appearance from a milky white pellet to slightly translucent. Then, 500 μl of nuclease-free water was added, the tube was incubated at 4°C overnight to fully resuspend the DNA. The next day, the gDNA samples were vortexed briefly. The gDNA concentration was measured using a Nanodrop (Thermo Scientific). Method 2: for cellular samples with a total number < 1 ×10⁷ cells, samples were subjected to Allprep DNA/RNA Mini Kit (QIAGEN) following the manufacturer’s protocol.
sgRNA library readout by deep sequencing
The sgRNA library readout was performed using a two-steps PCR strategy, where the first PCR includes enough genomic DNA to preserve full library complexity and the second PCR adds appropriate sequencing adapters to the products from the first PCR.
For PCR#1, a region containing sgRNA cassette was amplified using primers specific to the lentiCRISPR-v2 vector (Primers for sequencing library construction, see Data and code availability). PCR was performed using Q5 High-Fidelity DNA Polymerase (NEB). For reactions using Q5 High-Fidelity DNA Polymerase, in PCR#1, the thermocycling parameters were:
| STEP | TEMP | TIME |
|---|---|---|
| Initial Denaturation | 98°C | 30 seconds |
| 18 Cycles | 98°C | 15 seconds |
| 68°C | 25 seconds | |
| 72°C | 25 seconds | |
| Final Extension | 72°C | 2 minutes |
| Hold | 4°C | |
In each PCR#1, we used a different amount of gDNA per sample to capture the full representation of the screen. For example, ~300X coverage of our genome-wide sgRNA library, gDNA from 3 × 10⁷ cells was used, assuming 6.6 μg of gDNA for 106 cells, 200 μg of gDNA was used per sample (6–8 μg of gDNA per reaction). PCR#1 products for each biological sample were pooled and used for amplification with barcoded second PCR primers (see Data and code availability). For each sample, we performed at least 3 PCR#2 reactions using 2 μL of the pooled PCR#1 product per PCR#2 reactions for 10 PCR cycles. Second PCR products were pooled and gel purified from a 2% agarose gel using the MinElute Gel Extraction kit (QIAGEN). Purified product concentration was measured using a Qubit (Thermo Scientific). All products were normalized for each biological sample before combining uniquely barcoded separate biological samples. The pooled products with 10–20% PhiX were sequenced on HiSeq 2500 system (Illumina).
Generation of artificial antigen expression lentiviral vectors
Plasmids (pCI-neo-sOVA, pCI-neo-mOVA, pCI-neo-cOVA, pcDNA3-OVA) were obtained from Addgene. Different forms of artificial tumor antigen ovalbumin sequence were subcloned into a lentiCRISPR-V2-blast vector via Gibson assembly to generate different Ova-expressing vectors (lentiV2-blast-sOva, lentiV2-blast-mOva, lentiV2-blast-cOva, lentiV2-blast-Ova).
Generation of artificial tumor antigen Ova-expressing cell lines
4T1, EMT6 and MC38 murine cancer cells were transduced with artificial tumor antigen Ova-expressing lentivirus for 24 hours. After blasticidin selection for 3 days, transduced cancer cells were cultured individually in 10 cm tissue culture plates. One week later, ovalbumin expression levels of transduced cancer cells were identified by immunoblotting.
In vivo CRISPR screening in murine cancer cells
Transduced murine cancer cells were expanded in vitro for 1 week to allow genome editing before being implanted into animals. Cancer cells were either injected into the mammary fat pads of mice or subcutaneously with Matrigel (1:1 dilution). Cancer cells were implanted into both flanks of 10–12 Foxn1nu/nu mice, 10–12 wild-type mice, 10–12 wild-type mice treated with ovalbumin, and 10–12 wild-type mice treated with ovalbumin and PD-1 blockade. Cancer cells transduced with libraries were also grown in vitro at approximately 1000X library coverage for the same time period as the animal experiment. Mice were vaccinated with ovalbumin twice (once a week) 14 days before cancer cell transplantation. Subsequently, mice were treated with 100 μg of rat monoclonal anti-PD-1 (clone: 29F.1A12) on days 9 and 12 via intraperitoneal injection. Mice were euthanized 16–19 days after tumor implantation and tumor genomic DNA was isolated from whole tumor tissue using a DNA extraction protocol (see above). PCR was used to amplify the sgRNA region and sequencing to determine sgRNA abundance was performed on an Illumina HiSeq. Significantly enriched or depleted sgRNAs from any comparison of conditions were identified using the MAGeCK algorithm.
Mouse validation assays
Ten thousand cancer cells (4T1, MC38) were either injected into the mammary fat pads of mice or subcutaneously with Matrigel (1:1 dilution). Tumors were measured every three days beginning on day 7 after challenge until time of death. Death was defined as the point at which a progressively growing tumor reached 2.0 cm in the longest dimension. Measurements were taken manually by collecting the longest dimension (length) and the longest perpendicular dimension (width). Tumor volume was estimated with the formula: (L × W2) / 2. CO2 inhalation was used to euthanize mice on the day of euthanasia. Optimal group sizes were determined empirically. Researchers were not blinded to group identity and randomization of animal groups was done when appropriate.
Cell viability assays
Cancer cells were seeded in 96-well plates (500 cells per well for short time proliferation or 100 cells per well for long time proliferation), cultured 4 or 8 days before cell counting, and biologically replicated three times. For cell counting, samples were subjected to Cell Counting Kit 8 (Dojindo) following the manufacturer’s protocol.
Western blot of protein expression in murine cancer cells
Pellets from 5 × 10⁶ cells were collected and digested by 500 μl RIPA Buffer (Invitrogen). Samples were incubated on ice for at least 15 minutes and centrifuged at 12,000 rpm for 10 minutes at 4 °C, then subjected to BCA analysis (Thermo scientific, Cat# 23228). Approximately 40 μg of total protein from each sample was loaded for western blot analysis.
Tissue processing and flow cytometry
Tumors for flow cytometry were broken down into smaller fragments, about the size of lentils, then dissociated with 1 mg/ml Collagenase IV for 30 minutes using GentleMacs Octo Dissociator from Miltenyi, and cell suspensions were passed through 70 μm filter twice before staining. Single cancer cells were washed with ice-cold PBS with 2% FBS and stained with antibodies at 4°C for 30 minutes. Cancer cells were then washed and resuspended in ice-cold PBS with 2% FBS for flow cytometry. All data acquisition was done using an LSR II (BD) or FACS Calibur (BD Biosiences) and analyzed using FlowJo software (TreeStar) for statistical computing.
In vivo competition assays
Cancer cells were engineered to express EGFP or mCherry by lentiviral transduction to different populations. Cas9-target sgRNA-transfected cells and Cas9-control sgRNA-transfected cells were mixed and then grown for at least two passages in vitro before implantation into mice. Mixes were analyzed by flow cytometry on the day of tumor inoculation. Tumors were harvested and incubated in Collagenase IV for at least 30 minutes. After incubation, cancer cells were passed through 70 μm filters to remove undigested tumors. Single cancer cells were washed with ice-cold PBS with 2% FBS and stained with Near-IR Live/Dead (BD Biosciences) on ice for 30 minutes. Cancer cells were then washed and resuspended in ice-cold PBS with 2% FBS. An LSR II (BD Biosciences) was used to analyze final EGFP/mCherry cancer cell ratios.
In vitro and in vivo chemokine measurement
Chemokine expression levels in the culture supernatants were measured using the Mouse Cytokine Array C1000 (Raybiotech). This assay was used to quantify the concentration of chemokines secreted by cancer cells, according to the manufacturer’s instructions. The results were further normalized with protein concentration of tumor cell lysates in the same experiment.
Generation of CRISPR/Cas9 Knockout cells
Construction of lenti-CRISPR/Cas9 vectors targeting Cop1 was performed following the protocol associated with the backbone vector lentiCRISPR V2 (Cat# 49535, Addgene). The sgRNA sequences used are listed in the Key resources table. 4T1 and MC38 cells were infected with lentivirus expressing sgRNAs targeting specific genes. After puromycin selection, cells were expanded and collected, and knockout was verified by western blot analyses.
RNA-seq
Total RNA was isolated and purified from the cells using Isol-RNA Lysis Reagent (Fisher) and treated with DNase I (Fisher). RNA-seq libraries were prepared using the TrueSeq Stranded Total RNA Library Prep Kit (Illumina) and sequenced on an Illumina HiSeq 2500 with 150 base paired end reads.
Real-time reverse transcription-PCR
RNA was extracted using RNeasy Plus Mini Kit (Qiagen) from cancer cells. Then, RNA was reverse transcribed into cDNA using iScript™ cDNA Synthesis Kit (Bio-Rad Laboratories). Approximately 50 ng cDNA from each sample was mixed with gene-specific primers (Supplementary Table 7) and SsoAdvanced™ universal SYBR® Green supermix (Bio-Rad Laboratories) following the manufacturer’s protocol. Reactions were performed on a CFX96 Touch Real-Time PCR Detection System (Bio-Rad Laboratories).
ATAC-seq
Mouse 4T1 cells were seeded onto 6-well plates for 3 days. Each sample of 1 × 10⁵ cells was trypsinized and resuspended in 50 uL cold ATAC-resuspension buffer (RSB) (10 mM Tris-HCl pH 7.4, 10 mM NaCl, and 3 mM MgCl2 in water) supplemented with 0.1% NP40, 0.1% Tween-20, and 0.01% digitonin. After 3 minute incubation on ice, 1 mL ATAC-RSB containing 0.1% Tween-20 was added, and centrifuged for 10 minutes at maximum speed at 4°C. Supernatant was removed and nuclei were resuspended in 50 μL of transposition mix: 2.5 μL transposase (100 nM final), 16.5 μL 1X PBS, 0.5 μL 1% digitonin, 0.5 μL 10% Tween-20, and 5 μL water. Transposition reactions were performed at 37 °C for 30 minutes in a thermomixer, while shaking at 1000 rpm. All samples were sequenced using an Illumina HiSeq 2500 with 150 base paired end reads.
ChIP-seq
4T1 cells were plated in 15 cm tissue culture plates and cultured for 3 days. For C/ebpδ ChIP-seq, approximately 1×10⁷ cells per condition were harvested and crosslinked by a two-step fixation, including 2m Mdisuccinimidyl glutarate (DSG, LifeTechnologies) treatment for 45 minutes and followed by 10 minutes fixation using 1% methanol-free formaldehyde at room temperature (Eeckhoute et al., 2007; Singh et al., 2018). Cells were lysed in 1% SDS lysis buffer and sheared to 200–700 bp in size using the Covaris E220 ultrasonicator (PIP 140, DF 5%, CPB 200). Approximately 50 mg of sheared chromatin per condition were diluted and then incubated over night with 5 ug C/ebpδ antibody (ab245214, Abcam). Precipitates were then washed with following buffers: RIPA 0 buffer (0.1% SDS, 10 mM Tris-HCl pH 7.4, 1% Triton X-100, 1 mM EDTA, 0.1% sodium deoxycholate), RIPA 0.3 buffer (0.1% SDS, 1% Triton X-100, 0.1% sodium deoxycholate, 10 mM Tris-HCl pH 7.4, 1 mM EDTA, 0.3 M NaCl) and LiCl buffer (250 mM LiCl, 1 mM EDTA, 5% NP-40, 0.5% sodium deoxycholate, 10 mM Tris-HCl). DNA sequencing libraries were prepared using the Smarter Thruplex DNaseq kit (Takara Bio Inc.) according to the manufacturer’s protocol. Libraries were sequenced on an Illumina HiSeq 2500 with 150 bp paired-end reads.
Co-immunoprecipitation
Mouse breast cancer cells were lysed in Tris buffer (50mM Tris pH 7.4, 150mM NaCl, 1mM EDTA, 0.5% NP-40, 5% glycerol, with protease and phosphatase inhibitors) for 30 minutes with gentle rocking at 4°C. Cell lysate was spun down by a centrifuge in cold room at 12,000 rpm for 10 minutes and then supernatant was collected and incubated with different antibodies coupled to Protein A/G agarose beads (Pierce Biotechnology) at 4°C overnight (12 hours). Beads were washed extensively in Tris lysis buffercontaining 0.5 M NaCl and then eluted in LDS-sample buffer (Invitrogen) containing 1% 2-mercaptoethanol. Cell lysate was supplemented with 4X SDS loading buffer (0.2 M Tris-HCl, 0.4 M DTT, 8.0% SDS, 6 mM Bromophenol blue, 4.3 M Glycerol) and heated at 95°C for 15 minutes before western blot analysis.
Single-cell RNA-seq of tumor infiltrating immune cells
Tumors grown in mice were harvested and broken down into smaller fragments, about the size of millet. Then, each sample was digested with reagents from Mouse Tumor Dissociation Kit (Miltenyi, Cat# 130–096-730) according to the manufacturer’s instructions using GentleMacs Octo Dissociator from Miltenyi, and cell suspensions were passed through a 70 μm filter twice before staining. Single tumor cells were washed with ice-cold PBS containing 2% FBS and stained with CD45.2-APC/Cy7 antibody (BioLegend, Cat#109823) at 4°C for 45 minutes. All cells were then washed and resuspended in ice-cold PBS with 2% FBS. Live CD45.2 positive cells were sorted with BD Aria after staining. Each tumor from the same group was processed individually and mixed together according to the same cell number. After cell collection, immune cells were resuspended at 1×10⁶ cells/mL in PBS-0.04% BSA (Thermo Fisher Scientific, Cat# AM2616). Single cell suspensions of all samples were then barcoded with a 10x Chromium Controller (10x Genomics). RNA from the barcoded cells for each sample was subsequently reverse-transcribed and sequencing libraries were constructed with reagents from a Chromium Single Cell 30 v2 reagent kit (10x Genomics, Cat#PN-120267) according to the manufacturer’s instructions. Sequencing was performed with Illumina HiSeq according to the manufacturer’s instructions (Illumina).
QUANTIFICATION AND STATISTICAL ANALYSIS
Software used in this study
Cutadapt v1.8.1, Bowtie2 v2.3.3, samtools v1.9, picard v1.123, MACS2, Tophat2 v2.0.11, STAR, HT-seq v0.6.1p1, DEseq2 1.22.2, BWA, GATK, MuTect v1.1.4, ROSE v0.1, Cell Ranger v2.0.2, Seurat v2, MAGeCK v0.5.7, LISA, Cistrome-GO, clusterProfiler, deeptools, salmon, LIMMA, FastQC, and bedtools.
CRISPR screen data analysis
CRISPR data were analyzed by MAGeCK and MAGeCK-VISPR essentially as described (Chen et al., 2018a; Jeselsohn et al., 2018; Li et al., 2014). Briefly, raw sequencing data are pre-processed by using MAGeCK to obtain the read counts for each sgRNA. Control sgRNAs are used to normalize the data. MAGeCK TEST algorithm is used to compare treatment with control samples to obtain the significantly enriched and depleted sgRNAs and genes. Genes with p value less than 0.001 are candidate hits. The MaGeCKFlute package was used to visualize the data (Wang et al., 2019).
Data analysis of RNA-seq
Read alignment was performed using STAR (v2.6.1) (Dobin et al., 2013). To quantify gene expression values, we used Salmon to calculate Transcripts Per Million (TPM) and read counts using the aligned reads from STAR as input (Patro et al., 2017). Differential gene expression analysis was then performed using DESeq2 with a FDR threshold of 0.05 (Love et al., 2014). Since the in vitro RNA-seq was performed in two batches, the batch of the sample was considered as a covariate in DESeq2. Similarly, log-transformed TPM values were batch-effect corrected using the remove Batch Effect function in LIMMA (Ritchie et al., 2015). Gene Set Enrichment Analysis (GSEA) was performed using the clusterProfiler R package with 100,000 permutations (Yu et al., 2012).
ATAC-seq analysis
ChiLin pipeline 2.0.0 is used for QC and preprocessing of the ATAC-seq (Qin et al., 2016). We use Burrows-Wheeler Aligner (BWA) as a read mapping tool (Li and Durbin, 2009; Qin et al., 2016), and Model-based Analysis of ChIP-Seq (MACS2) as a peak caller (Zhang et al., 2008), with a q-value (FDR) threshold of 0.01. Based on a dynamic poisson distribution, MACS2 can effectively capture local biases in the genome sequence, allowing for more sensitive and robust prediction of binding sites. Unique read for 48 a position for peak calling is used to reduce false positive peaks, statically significant peaks are finally selected by calculated false discovery rate of reported peaks. Deeptools is used for the heatmap plots (Ramírez et al., 2016; Zhang et al., 2008). ATAC-seq Peaks from all study samples were merged to create a union set of sites. Read densities were calculated for each peak for each sample, differential peaks between WT and KO were identified by DEseq2 with adjusted P ≤0.05, |log2fold change| ≥ 1.
Single cell RNA-seq data analysis
Cell Ranger (10x Genomics; v3.1.0) was used to align the reads to the mm10 genome and generate the count matrix with default settings. Low-quality cells containing less than 200 genes detected were removed. Genes that were present in less than 3 cells were excluded from the analysis. Seurat (v4.0.1) was used for integration (Stuart et al., 2019), normalization, dimensionality reduction, clustering, and UMAP visualization. Annotation for each cluster was performed by using MAESTRO with the “RNAAnnotateCelltype” function and “human.immune.CIBERSORT” gene signature (Wang et al., 2020). Other downstream analyses were performed with custom R (v 4.0.5) scripts.
Data analysis of ChIP-seq
The ChiLin pipeline was used to analyze Chromatin Immunoprecipitation sequencing (ChIP-seq) of C/ebpδ (Qin et al., 2016). Briefly, the bwa aligner was used to map reads to the mm10 reference genome. MACS2 (v2.1.4) was used to call ChIP-seq peaks using the command line parameters “-SPMR -B -q 0.01 –keep-dup 1” (Zhang et al., 2008). A random subsample of 4 million reads were used to assess quality control. Quality control consisted of five metrics: 1) the average read quality according to FastQC (de Sena Brandine and Smith, 2019); 2) the fraction of uniquely mapped reads; 3) a PCR bottleneck coefficient, which is the fraction of locations with one uniquely mapped read; 4) fraction of reads in peaks according to MACS2 (Zhang et al., 2008) (more, the better); 5) overlap of peaks with DNA hypersensitivity sites. All samples were of adequate quality. To provide a consistent peak set across multiple samples for downstream analysis, we merged overlapping peaks using bedtools v2.29.2 (Quinlan and Hall, 2010). Differential peak analysis between Rosa26 and Cop1 KO was then performed using DESeq2 with a False Discovery Rate threshold of 0.05 and |log2FC|>0.5 (Love et al., 2014). A heatmap visualizing the peaks was then generated using the deeptools package (v3.3.0) (Ramírez et al., 2016). KEGG pathway enrichment of the up-regulated C/ebpδ peaks was then conducted using Cistrome GO (Li et al., 2019).
Cop1 degron motif prioritization
Cop1 Degron Motif Search
A degron sequence motif for Cop1 was downloaded from the Eukaryotic Linear Motif Database (Gouw et al., 2018), which was represented by the regular expression “[STDE]{1,3}.{0,2}[TSDE].{2,3}VP[STDE]G{0,1}[FLIMVYPA]”. Protein sequences from the mouse and human proteome were downloaded (10/2/2019) from the Swiss-Prot reviewed sequences of the UniProt database (UniProt Consortium, 2019). The Cop1 degron sequence motif was then searched against Swiss-Prot sequences using the python “re” package. This resulted in 1,196 hits (1,067 genes) in mice and 1,328 (1,010 genes) in humans.
Machine learning prioritization
Not all instances of a sequence motif may be a biologically plausible degron. To further refine plausible candidates, we developed a model to predict the potential of a motif to be a degron. A Random Forest algorithm was trained (number of trees=1,000) on 83 features from the SNVBox database (UniProt Consortium, 2019; Wong et al., 2011) to distinguish previously reported degrons (n=186) (Mészáros et al., 2017) from random other sequences within the same set of proteins (n=186). Features spanned characterization of evolutionary conservation to biophysical features of amino acid residues within a protein. To summarize features across the multiple amino acid residues in a motif, we took the average of each feature. Evaluated using 20-fold cross-validation, performance as measured by the area under the Receiver Operating Characteristic curve (auROC) was 0.81 out of 1.0 (p = 2 × 10⁻²⁵, Mann-Whitney U test).
Cop1 Degron Motif Filtering
Given the large number of motif hits found in mice, we filtered out those not also seen in humans or which had low degron potential according to machine learning predictions. Of the 1,067 genes with motif hits in mice, 448 showed overlap in humans. After filtering for a high Random Forest score (>0.5 out of 1.0), 117 high-scoring motifs remained. Among the high scoring candidates, numerous were for previously reported Cop1 substrates, such as Ets1, Etv5 and Jun (Marine, 2012).
Gene signature analysis
Cop1 gene expression signature
We created an RNA expression gene signature for Cop1 KO based on the top 500 differentially expressed genes (250 up-regulated, 250 down-regulated). Genes within the signature were weighted by their log2 fold change values reported by DESeq2 in the Cop1 KO vs Rosa26 (control) condition without IFNG treatment. Only mouse genes with a corresponding human gene were used. A Cop1 signature score was computed by a weighted linear combination of Cop1 KO log2 fold changes with normalized expression values from TCGA (see below).
TCGA expression data
RSEM quantifications (v2) for RNA expression data from The Cancer Genome Atlas (TCGA) was downloaded from the genomic data commons (https://portal.gdc.cancer.gov/). RNA expression was then log2 normalized, followed by subtracting the median expression value for each gene across the cohort.
Correlation with Immune Cell Infiltration
Immune cell infiltration was inferred from bulk RNA-seq data using the immunedeconv R package (Sturm et al., 2019), which contains estimates based on 6 different methods (CIBERSORT (absolute mode), TIMER, xCell, EPIC, MCP-counter, quanTIseq) (Aran et al., 2017; Becht et al., 2016; Finotello et al., 2019; Li et al., 2016; Newman et al., 2015; Racle et al., 2017). Cop1 signature scores were then analyzed for their correlation with immune cell infiltration estimates, after adjusting for tumor purity (partial spearman correlation, see (Li et al., 2017)). Benjamini-Hochberg correction was then applied across all p-values and a correlation was deemed significant at a FDR <0.05.
Cytokine and surface receptor/ligand genes
To analyze genes that may impact the tumor-immune microenvironment, we curated a set of cytokine and surface receptor related genes: “Cytokine-Cytokine Receptor Interaction” pathway from KEGG database and surface receptor/ligand genes as reported by Ramilowski et al (Kanehisa and Goto, 2000; Ramilowski et al., 2015).
Supplementary Material
Figure S5. Related to Figures 4 and 5. Prioritization of Putative Cop1 Substrates.
(A) Heat map showing changes in chromatin accessibility of Rosa26 and Cop1 KO 4T1 cancer cells without IFNγ stimulation.
(B) TF motif enrichment of Rosa26 and Cop1 KO 4T1 cancer cells with or without IFNγ stimulation. Expected (x axis) versus observed (y axis) percentages of IFNγ treated cells peaks overlapping each TF binding site annotation.
(C) Western blot of protein ubiquitination levels in Rosa26 KO and Cop1 KO 4T1 cells under treatment of vehicle or MG132 (at 50 μM for 8 hours).
(D) Heatmap displaying the correlation in the proteome for samples indicates consistency among replicates. Color indicates the spearman correlation.
(E) Differential protein abundance (Cop1 KO VS. Rosa26 4T1 cells) of previously reported substrates of Cop1.
(F) Significant enriched ontology terms of Cop1 KO-specific C/ebpδ peaks. p values determined by hypergeometric test.
(G) Heatmap showing differential transcriptomic expression in Rosa26 KO and C/ebpδ KO 4T1 cells with IFNγ stimulation.
(H) Compared to adjacent normal tissue, COP1 was overexpressed in TCGA cancer samples. Data are shown as mean ± SEM, *p < 0.05, ***p < 0.001, by Mann-Whitney U test.
(I and J) Partial spearman correlation after adjusting for tumor purity of the Cop1 gene expression signature with estimated immune cell infiltration of tumors from I) Cibersort, and J) xCell. X-axis reflects cancer types from TCGA and y-axis is immune cell types.
(K) Correlation of COP1 protein level with protein levels of macrophage-associated chemokines, upon Cop1 KO in multiple human breast and colorectal cancer cell lines.
(L) Kaplan-Meier plot displaying that higher COP1 expression associates with worse survival in the ovarian and kidney cancer cohorts (Cox PH test).
(M and N) Kaplan-Meier plot displaying that higher COP1 expression associates with worse survival in the METABRIC breast cancer cohort (Cox PH test). The association with survival was still significant when restricting Triple Negative Breast Cancer (TNBC) (Mann-Whitney U test).
Figure S1. Related to Figure 1. Optimization and Validation of Primary MusCK In Vivo CRISPR Screens in the Mouse 4T1 TNBC Models.
(A) Pie chart showing the fraction of genes targeted in the MusCK library.
(B) Protein Cas9 expression in MusCK library-infected 4T1 cells.
(C) Expression of hormone receptors and PD-L1 in mouse and human cancer cells.
(D) Principal component analysis of transcriptome of mouse and human breast cancer cells.
(E) MAGeCK analysis and RRA ranking of top depleted genes in the in vitro MusCK screen.
(F) MAGeCK analysis and RRA ranking of top enriched genes in the in vitro MusCK screen.
(G) Mouse 4T1 cell line was transduced with a vector expressing various forms of ovalbumin antigen.
(H) Western blot of 4T1 cell lysate for ovalbumin and GAPDH after transfection with either control or ovalbumin vector.
(I) Tumor volume of wild-type or ovalbumin expressing 4T1 cancers.
(J) Tumor infiltrating T cells in wild-type or ovalbumin expressing 4T1 cancers.
(K) Western blot of 4T1 cell lysate for Cas9, ovalbumin and GAPDH after transduction with CRISPR library.
(L) Flow cytometry analysis of T cells and B cells in different host conditions.
(M) Tumor volume averaged for groups indicated and tumor weight measured at 16 days post implantation. n = 12 per group.
(N) Gene set enrichment analysis of 4T1 tumor and 4T1 cells. Top enriched pathways in 4T1 tumors versus 4T1 cells were shown. GSEA terms significantly upregulated in 4T1 tumors compared with 4T1 cells.
(O) Scheme of in vivo competition between Jak1 or Stat1 KO and control Rosa26 KO cells.
(P) Western blotting of Jak1 and Stat1 expression in 4T1 and EMT6 cells transduced with single gRNA targeting Jak1 (or Stat1).
Figure S2. Related to Figure 2. MusCK 2.0 Library Screens on 4T1 and EMT6 TNBC Mouse Models.
(A) Scheme of MusCK 2.0 in vivo screen.
(B) Tumor volume of 4T1 tumor averaged for groups indicated and tumor weight measured at 16 days post implantation. Error bars represent +/− 1 SEM, n = 10 mice per group.
(C) A matrix of the Pearson’s correlations of the library distribution from one animal compared to any other animal for MusCK 2.0 screen using 4T1 cells.
(D) Representative plots showing the gating strategy for different populations of tumor infiltrating immune cells.
(E and F) Flow cytometry analysis of tumor infiltrating immune cell population in mice under different treatment. Data are shown as mean ± SEM, n = 5 per group, *p < 0.05, **p < 0.01, ***p < 0.001, ****p < 0.0001, by one-way ANOVA with Benjamini-Hochberg post-test multiple comparison.
(G) Tumor volume of EMT6 tumor averaged for groups indicated. Error bars represent +/− 1 SEM, n = 10-12 mice per group.
(H) EMT6 tumor volume and weight measured at 16 days post implantation. Data are shown as mean ± SEM, n = 10-12 mice per group, *p < 0.05, ****p < 0.0001, by one-way ANOVA with Benjamini-Hochberg post-test multiple comparison.
(I) A matrix of the Pearson’s correlations of the library distribution from one animal compared to any other animal for MusCK 2.0 screen using EMT6 cells.
(J) MAGeCK analysis and RRA ranking of top depleted genes in the MusCK 2.0 screen.
Figure S3. Related to Figure 2. MusCK 2.0 Library Screens on MC38 Colon Cancer Mouse Models and Identification of Cop1 Function on Mouse Models.
(A) Tumor volume of MC38 tumor averaged for groups indicated. Error bars represent +/− 1 SEM, n = 10-12 mice per group.
(B) Tumor volume and weight measured at 19 days post implantation. Data are shown as mean ± SEM, n = 10-12 mice per group, *p < 0.05, ****p < 0.0001, by one-way ANOVA with Benjamini-Hochberg post-test multiple comparison.
(C) A matrix of the Pearson’s correlations of the library distribution from one animal compared to any other animal for MusCK 2.0 screen using MC38 cells.
(D) MAGeCK analysis and RRA ranking of top depleted genes in the MusCK 2.0 screen.
(E) Frequency of sgRNAs targeting Cop1 in the MusCK 2.0 screen on 4T1 and EMT6 TNBC mouse models.
(F) Behavior of individual sgRNAs targeting Cop1 in MusCK 2.0 screen in 4T1 TNBC models.
(G) Cell viability of Rosa26 and Cop1 KO 4T1 cells cultured in vitro. Data are shown as mean ± SEM, n = 6 per group, by one-way ANOVA with Benjamini-Hochberg post-test multiple comparison.
(H) Flow cytometry analysis of Cop1 KO cells versus control cells in the resulting 4T1 tumors.
(I) Flow cytometry analysis of Cop1 KO cells versus control cells in the resulting MC38 tumors.
(J and K) Tumor volume and Kaplan-Meier survival analysis of host animals bearing Rosa26 and Cop1 KO MC38 tumors under immunoglobulin G (IgG) isotype or anti-PD-1 antibody treatment. Data are shown as mean ± SEM, n = 10 mice per group, *p < 0.05, ***p < 0.001, by one-way ANOVA with Benjamini-Hochberg post-test multiple comparison.
Figure S6. Related to Figure 6. Trib2 Serve as a Substrate Adaptor for Cop1 to Target C/ebpδ.
(A) Diagram displaying that putative Cop1 substrates must be up-regulated at the protein-level upon Cop1 KO, contain a Cop1 degron motif, and score well according to a machine learning model.
(B) Scoring of the degron-likelihood by the RF algorithm of Cop1 motifs indicates known Cop1 substrates received higher scores. Box plot represents quartiles +/− 1.5 interquartile range. Mann-Whitney U test.
(C) Overlapping the results from mouse and human showed 117 motif hits as possible Cop1 degrons (score>0.5).
(D) Protein interaction network of human COP1 (Bioplex database) indicates tribbles protein family (TRIB1/2/3) physically interact with COP1. Colors denote differential expression upon Cop1 KO: red=up-regulated, blue=down-regulated.
(E and F) The lysate from wild-type 4T1 cells were incubated with Trib2 and C/ebpδ antibody or normal control IgG, and the immunocomplexes were probed with the indicated antibodies.
(G) Relative mRNA levels of Cop1, Trib2 and C/ebpδ in Rosa26 KO and Cop1 KO cancer cells. Data are shown as mean ± SEM, 3 replicates per condition, ****p < 0.0001, by one-way ANOVA with Benjamini-Hochberg multiple test correction.
(H) Real time PCR analysis confirmed that the Cop1 overexpression condition was indeed overexpressed compared to the empty vector.
(I) Western blot of protein ubiquitination levels of Rosa26 KO and Cop1 KO 4T1 cells under treatment of vehicle or MG132.
(J) Model for Cop1-driven macrophage infiltration.
Figure S4. Related to Figure 3. Cop1 Knockout Sensitized Cancer Cells to Immune-mediated Cytotoxicity.
(A) Location of COP1 (RFWD2) gene on chromosome 1 and percentage of subjects with COP1 gene amplification (red) in different breast cancer data sets.
(B) RNA-sequencing of Rosa26 and Cop1 KO 4T1 cancer cells without IFNγ stimulation. Red dots denote genes significantly (p < 0.05) differentially expressed in conditions compared.
(C) Heatmap showing differential transcriptomic expression in Rosa26 and Cop1 KO 4T1 cells without IFNγ stimulation.
(D) Gene set enrichment analysis of Rosa26 and Cop1 KO 4T1 cancer cells without IFNγ stimulation. Top depleted pathways in Cop1 KO cells versus Rosa26 control cells were shown.
(E) Differential transcriptomic expression of macrophage-related genes in Rosa26 and Cop1 KO 4T1 cells without IFNγ stimulation.
(F) Representative images of chemokines from proteome array analysis of control (Rosa26) and Cop1 KO 4T1 in vitro cell culture supernatants without IFNγ stimulation.
(G) Representative images of chemokines from proteome array analysis of control (Rosa26) and Cop1 KO 4T1 in vitro cell culture supernatants with IFNγ stimulation.
(H) Quantification of percentage of macrophages in all tumor-infiltrating myeloid cells. Data are shown as mean ± SEM, n = 8-10 per group, *p < 0.05, **p < 0.01, ***p < 0.001, by one-way ANOVA with Benjamini-Hochberg post-test multiple comparison.
(I) Immunohistochemistry of sections showing monocyte chemoattractant CCL2/MCP1 expression in Rosa26 and Cop1 KO 4T1 tumors.
(J) Flow cytometry analysis of CD8+ T cell populations in Rosa26 and Cop1 KO 4T1 tumors grown in BALB/c mice under different treatment in vivo. Quantification of percentage of CD8+ T cells in all tumor-infiltrating T cells.
(K) Flow cytometry analysis of myeloid cell populations in Rosa26 and Cop1 KO 4T1 tumors grown in BALB/c mice under different treatment in vivo. Quantification of percentage of myeloid cells in all tumor-infiltrating CD45+ cells.
(L) Flow cytometry analysis of monocyte populations in Rosa26 and Cop1 KO 4T1 tumors grown in BALB/c mice under different treatment in vivo. Quantification of percentage of monocytes in all tumor-infiltrating CD45+ cells.
(M) Representative images of chemokines from proteome array analysis of control (Rosa26) and Cop1 KO 4T1 tumors (left). Quantification of differential protein expression (in cytokine array) of tumor extracts harvested from host animals (right).
(N) Gene expressions of macrophage-associated chemokines and chemokine receptors of control (Rosa26) and Cop1 KO 4T1 tumors grown in BALB/c hosts.
(O) Correlation of macrophage infiltration with tumor volume at end point.
(P) Correlation of T cell infiltration with tumor volume at end point.
Table S1: Guide RNA design for MusCK library, Related to Figure 1.
Table S2: In vitro MusCK library screening on 4T1 TNBC cells, Related to Figure 1.
Table S3: In vivo MusCK library screening on 4T1 TNBCcells, Related to Figure 1.
Table S4: In vivo MusCK2.0 library screening on 4T1 TNBC cells, Related to Figure 2.
Table S5: ATAC-seq analysis of Cop1 KO and Rosa26 KO 4T1 cells, Related to Figure 4.
Table S6: Proteomics of Cop1 KO and Rosa26 KO 4T1 cells, Related to Figure 4.
Highlights.
In vivo CRISPR screens identify new immune targets regulating the tumor microenvironment
Cop1 knockout in cancer cells enhances anti-tumor immunity
Cop1 modulates chemokine secretion and macrophage infiltration into tumors
Cop1 targets C/ebpδ degradation via Trib2 and influences ICB response
ACKNOWLEDGMENTS
The authors would like to thank Jin Zhao and Jingyu Peng for their assistance and discussions. This study was supported by the Breast Cancer Research Foundation (BCRF-20–100 to X.S.L. and BCRF-20–019 to M.B.), NIH Grants R01CA234018 (to X.S.L. and M.B.), Damon Runyon Cancer Research Foundation DRQ-04–20 (to C.T.), the Sara Elizabeth O’Brien Trust (to S.S.G.), and the Dana-Farber Cancer Institute.
DECLARATION OF INTERESTS
X.S.L. is a cofounder, board member, scientific advisor board member, and consultant of GV20 Oncotherapy; a stockholder of BMY, TMO, WBA, ABT, ABBV, and JNJ; and receives research funding from Takeda, Sanofi, Bristol Myers Squibb, and Novartis. M.B. receives sponsored research support from and is a consultant to Novartis. M.B. serves on the scientific advisory boards of GV20 Oncotherapy, Kronos Bio, and H3 Biomedicine. T.X. is a cofounder, board member, and full-time employee of GV20 Oncotherapy.
Footnotes
Publisher's Disclaimer: This is a PDF file of an unedited manuscript that has been accepted for publication. As a service to our customers we are providing this early version of the manuscript. The manuscript will undergo copyediting, typesetting, and review of the resulting proof before it is published in its final form. Please note that during the production process errors may be discovered which could affect the content, and all legal disclaimers that apply to the journal pertain.
REFERENCES
- Alshaker HA, and Matalka KZ (2011). IFN-γ, IL-17 and TGF-β involvement in shaping the tumor microenvironment: The significance of modulating such cytokines in treating malignant solid tumors. Cancer Cell Int. 11, 33. [DOI] [PMC free article] [PubMed] [Google Scholar]
- Aran D, Hu Z, and Butte AJ (2017). xCell: digitally portraying the tissue cellular heterogeneity landscape. Genome Biol. 18, 220. [DOI] [PMC free article] [PubMed] [Google Scholar]
- Beatty GL, and Paterson Y (2000). IFN-gamma can promote tumor evasion of the immune system in vivo by down-regulating cellular levels of an endogenous tumor antigen. J. Immunol. 165, 5502–5508. [DOI] [PubMed] [Google Scholar]
- Becht E, Giraldo NA, Lacroix L, Buttard B, Elarouci N, Petitprez F, Selves J, Laurent-Puig P, Sautès-Fridman C, Fridman WH, et al. (2016). Estimating the population abundance of tissue-infiltrating immune and stromal cell populations using gene expression. Genome Biol. 17, 218. [DOI] [PMC free article] [PubMed] [Google Scholar]
- Benci JL, Xu B, Qiu Y, Wu TJ, Dada H, Twyman-Saint Victor C, Cucolo L, Lee DSM, Pauken KE, Huang AC, et al. (2016). Tumor Interferon Signaling Regulates a Multigenic Resistance Program to Immune Checkpoint Blockade. Cell 167, 1540–1554.e12. [DOI] [PMC free article] [PubMed] [Google Scholar]
- Benci JL, Johnson LR, Choa R, Xu Y, Qiu J, Zhou Z, Xu B, Ye D, Nathanson KL, June CH, et al. (2019). Opposing Functions of Interferon Coordinate Adaptive and Innate Immune Responses to Cancer Immune Checkpoint Blockade. Cell 178, 933–948.e14. [DOI] [PMC free article] [PubMed] [Google Scholar]
- Bianchini G, Balko JM, Mayer IA, Sanders ME, and Gianni L (2016). Triple-negative breast cancer: challenges and opportunities of a heterogeneous disease. Nat. Rev. Clin. Oncol. 13, 674–690. [DOI] [PMC free article] [PubMed] [Google Scholar]
- Burr ML, Sparbier CE, Chan Y-C, Williamson JC, Woods K, Beavis PA, Lam EYN, Henderson MA, Bell CC, Stolzenburg S, et al. (2017). CMTM6 maintains the expression of PD-L1 and regulates anti-tumour immunity. Nature 549, 101–105. [DOI] [PMC free article] [PubMed] [Google Scholar]
- Cassetta L, and Pollard JW (2018). Targeting macrophages: therapeutic approaches in cancer. Nat. Rev. Drug Discov. 17, 887–904. [DOI] [PubMed] [Google Scholar]
- Cassetta L, Fragkogianni S, Sims AH, Swierczak A, Forrester LM, Zhang H, Soong DYH, Cotechini T, Anur P, Lin EY, et al. (2019). Human Tumor-Associated Macrophage and Monocyte Transcriptional Landscapes Reveal Cancer-Specific Reprogramming, Biomarkers, and Therapeutic Targets. Cancer Cell 35, 588–602.e10. [DOI] [PMC free article] [PubMed] [Google Scholar]
- Chen C-H, Xiao T, Xu H, Jiang P, Meyer CA, Li W, Brown M, and Liu XS (2018a). Improved design and analysis of CRISPR knockout screens. Bioinformatics 34, 4095–4101. [DOI] [PMC free article] [PubMed] [Google Scholar]
- Chen M, Pockaj B, Andreozzi M, Barrett MT, Krishna S, Eaton S, Niu R, and Anderson KS (2018b). JAK2 and PD-L1 Amplification Enhance the Dynamic Expression of PD-L1 in Triple-negative Breast Cancer. Clin. Breast Cancer 18, e1205–e1215. [DOI] [PubMed] [Google Scholar]
- Codina A, Renauer PA, Wang G, Chow RD, Park JJ, Ye H, Zhang K, Dong MB, Gassaway B, Ye L, et al. (2019). Convergent Identification and Interrogation of Tumor-Intrinsic Factors that Modulate Cancer Immunity In Vivo. Cell Syst 8, 136–151.e7. [DOI] [PMC free article] [PubMed] [Google Scholar]
- Coussens LM, Zitvogel L, and Palucka AK (2013). Neutralizing tumor-promoting chronic inflammation: a magic bullet? Science 339, 286–291. [DOI] [PMC free article] [PubMed] [Google Scholar]
- Dentin R, Liu Y, Koo S-H, Hedrick S, Vargas T, Heredia J, Yates J 3rd, and Montminy M (2007). Insulin modulates gluconeogenesis by inhibition of the coactivator TORC2. Nature 449, 366–369. [DOI] [PubMed] [Google Scholar]
- Dersh D, Phelan JD, Gumina ME, Wang B, Arbuckle JH, Holly J, Kishton RJ, Markowitz TE, Seedhom MO, Fridlyand N, et al. (2021). Genome-wide Screens Identify Lineage- and Tumor-Specific Genes Modulating MHC-I- and MHC-II-Restricted Immunosurveillance of Human Lymphomas. Immunity 54, 116–131.e10. [DOI] [PMC free article] [PubMed] [Google Scholar]
- Dobin A, Davis CA, Schlesinger F, Drenkow J, Zaleski C, Jha S, Batut P, Chaisson M, and Gingeras TR (2013). STAR: ultrafast universal RNA-seq aligner. Bioinformatics 29, 15–21. [DOI] [PMC free article] [PubMed] [Google Scholar]
- Doench JG, Fusi N, Sullender M, Hegde M, Vaimberg EW, Donovan KF, Smith I, Tothova Z, Wilen C, Orchard R, et al. (2016). Optimized sgRNA design to maximize activity and minimize off-target effects of CRISPR-Cas9. Nat. Biotechnol. 34, 184–191. [DOI] [PMC free article] [PubMed] [Google Scholar]
- Dong H, Zhu G, Tamada K, and Chen L (1999). B7-H1, a third member of the B7 family, co-stimulates T-cell proliferation and interleukin-10 secretion. Nat. Med. 5, 1365–1369. [DOI] [PubMed] [Google Scholar]
- Dornan D, Wertz I, Shimizu H, Arnott D, Frantz GD, Dowd P, O’Rourke K, Koeppen H, and Dixit VM (2004a). The ubiquitin ligase COP1 is a critical negative regulator of p53. Nature 429, 86–92. [DOI] [PubMed] [Google Scholar]
- Dornan D, Bheddah S, Newton K, Ince W, Frantz GD, Dowd P, Koeppen H, Dixit VM, and French DM (2004b). COP1, the negative regulator of p53, is overexpressed in breast and ovarian adenocarcinomas. Cancer Res. 64, 7226–7230. [DOI] [PubMed] [Google Scholar]
- Dornan D, Wertz I, Shimizu H, Arnott D, Frantz GD, Dowd P, O’Rourke K, Koeppen H, and Dixit VM (2004c). The ubiquitin ligase COP1 is a critical negative regulator of p53. Nature 429, 86–92. [DOI] [PubMed] [Google Scholar]
- Eferl R, and Wagner EF (2003). AP-1: a double-edged sword in tumorigenesis. Nat. Rev. Cancer 3, 859–868. [DOI] [PubMed] [Google Scholar]
- Eyers PA, Keeshan K, and Kannan N (2017). Tribbles in the 21st Century: The Evolving Roles of Tribbles Pseudokinases in Biology and Disease. Trends Cell Biol. 27, 284–298. [DOI] [PMC free article] [PubMed] [Google Scholar]
- Fallahpour S, Navaneelan T, De P, and Borgo A (2017). Breast cancer survival by molecular subtype: a population-based analysis of cancer registry data. CMAJ Open 5, E734–E739. [DOI] [PMC free article] [PubMed] [Google Scholar]
- Fei T, Chen Y, Xiao T, Li W, Cato L, Zhang P, Cotter MB, Bowden M, Lis RT, Zhao SG, et al. (2017). Genome-wide CRISPR screen identifies HNRNPL as a prostate cancer dependency regulating RNA splicing. Proc. Natl. Acad. Sci. U. S. A 114, E5207–E5215. [DOI] [PMC free article] [PubMed] [Google Scholar]
- Finotello F, Mayer C, Plattner C, Laschober G, Rieder D, Hackl H, Krogsdam A, Loncova Z, Posch W, Wilflingseder D, et al. (2019). Molecular and pharmacological modulators of the tumor immune contexture revealed by deconvolution of RNA-seq data. Genome Med. 11, 34. [DOI] [PMC free article] [PubMed] [Google Scholar]
- Freeman GJ, Long AJ, Iwai Y, Bourque K, Chernova T, Nishimura H, Fitz LJ, Malenkovich N, Okazaki T, Byrne MC, et al. (2000). Engagement of the PD-1 immunoinhibitory receptor by a novel B7 family member leads to negative regulation of lymphocyte activation. J. Exp. Med. 192, 1027–1034. [DOI] [PMC free article] [PubMed] [Google Scholar]
- Gao J, Shi LZ, Zhao H, Chen J, Xiong L, He Q, Chen T, Roszik J, Bernatchez C, Woodman SE, et al. (2016). Loss of IFN-γ Pathway Genes in Tumor Cells as a Mechanism of Resistance to Anti-CTLA-4 Therapy. Cell 167, 397–404.e9. [DOI] [PMC free article] [PubMed] [Google Scholar]
- Gechijian LN, Buckley DL, Lawlor MA, Reyes JM, Paulk J, Ott CJ, Winter GE, Erb MA, Scott TG, Xu M, et al. (2018). Functional TRIM24 degrader via conjugation of ineffectual bromodomain and VHL ligands. Nat. Chem. Biol. 14, 405–412. [DOI] [PMC free article] [PubMed] [Google Scholar]
- Ginhoux F, and Jung S (2014). Monocytes and macrophages: developmental pathways and tissue homeostasis. Nat. Rev. Immunol. 14, 392–404. [DOI] [PubMed] [Google Scholar]
- Gouw M, Michael S, Sámano-Sánchez H, Kumar M, Zeke A, Lang B, Bely B, Chemes LB, Davey NE, Deng Z, et al. (2018). The eukaryotic linear motif resource - 2018 update. Nucleic Acids Res. 46, D428–D434. [DOI] [PMC free article] [PubMed] [Google Scholar]
- Grivennikov SI, Greten FR, and Karin M (2010). Immunity, inflammation, and cancer. Cell 140, 883–899. [DOI] [PMC free article] [PubMed] [Google Scholar]
- Groner AC, Cato L, de Tribolet-Hardy J, Bernasocchi T, Janouskova H, Melchers D, Houtman R, Cato ACB, Tschopp P, Gu L, et al. (2016). TRIM24 Is an Oncogenic Transcriptional Activator in Prostate Cancer. Cancer Cell 29, 846–858. [DOI] [PMC free article] [PubMed] [Google Scholar]
- Gschwandtner M, Derler R, and Midwood KS (2019). More Than Just Attractive: How CCL2 Influences Myeloid Cell Behavior Beyond Chemotaxis. Front. Immunol. 10, 2759. [DOI] [PMC free article] [PubMed] [Google Scholar]
- Gu SS, Zhang W, Wang X, Jiang P, Traugh N, Li Z, Meyer C, Stewig B, Xie Y, Bu X, et al. (2021). Therapeutically Increasing MHC-I Expression Potentiates Immune Checkpoint Blockade. Cancer Discov. 11, 1524–1541. [DOI] [PMC free article] [PubMed] [Google Scholar]
- Halle S, Halle O, and Förster R (2017). Mechanisms and Dynamics of T Cell-Mediated Cytotoxicity In Vivo. Trends Immunol. 38, 432–443. [DOI] [PubMed] [Google Scholar]
- Hanahan D, and Weinberg RA (2011). Hallmarks of cancer: the next generation. Cell 144, 646–674. [DOI] [PubMed] [Google Scholar]
- Ishizuka JJ, Manguso RT, Cheruiyot CK, Bi K, Panda A, Iracheta-Vellve A, Miller BC, Du PP, Yates KB, Dubrot J, et al. (2019). Loss of ADAR1 in tumours overcomes resistance to immune checkpoint blockade. Nature 565, 43–48. [DOI] [PMC free article] [PubMed] [Google Scholar]
- Jacquelot N, Yamazaki T, Roberti MP, Duong CPM, Andrews MC, Verlingue L, Ferrere G, Becharef S, Vétizou M, Daillère R, et al. (2019). Sustained Type I interferon signaling as a mechanism of resistance to PD-1 blockade. Cell Res. 29, 846–861. [DOI] [PMC free article] [PubMed] [Google Scholar]
- Jamieson SA, Ruan Z, Burgess AE, Curry JR, McMillan HD, Brewster JL, Dunbier AK, Axtman AD, Kannan N, and Mace PD (2018). Substrate binding allosterically relieves autoinhibition of the pseudokinase TRIB1. Sci. Signal 11. [DOI] [PMC free article] [PubMed] [Google Scholar]
- Janic A, Valente LJ, Wakefield MJ, Di Stefano L, Milla L, Wilcox S, Yang H, Tai L, Vandenberg CJ, Kueh AJ, et al. (2018). DNA repair processes are critical mediators of p53-dependent tumor suppression. Nat. Med. 24, 947–953. [DOI] [PubMed] [Google Scholar]
- Jeselsohn R, Bergholz JS, Pun M, Cornwell M, Liu W, Nardone A, Xiao T, Li W, Qiu X, Buchwalter G, et al. (2018). Allele-Specific Chromatin Recruitment and Therapeutic Vulnerabilities of ESR1 Activating Mutations. Cancer Cell 33, 173–186.e5. [DOI] [PMC free article] [PubMed] [Google Scholar]
- Jiang P, Gu S, Pan D, Fu J, Sahu A, Hu X, Li Z, Traugh N, Bu X, Li B, et al. (2018). Signatures of T cell dysfunction and exclusion predict cancer immunotherapy response. Nat. Med. 24, 1550–1558. [DOI] [PMC free article] [PubMed] [Google Scholar]
- Kanehisa M, and Goto S (2000). KEGG: kyoto encyclopedia of genes and genomes. Nucleic Acids Res. 28, 27–30. [DOI] [PMC free article] [PubMed] [Google Scholar]
- Keeshan K, He Y, Wouters BJ, Shestova O, Xu L, Sai H, Rodriguez CG, Maillard I, Tobias JW, Valk P, et al. (2006). Tribbles homolog 2 inactivates C/EBPalpha and causes acute myelogenous leukemia. Cancer Cell 10, 401–411. [DOI] [PMC free article] [PubMed] [Google Scholar]
- Kim K, Skora AD, Li Z, Liu Q, Tam AJ, Blosser RL, Diaz LA Jr, Papadopoulos N, Kinzler KW, Vogelstein B, et al. (2014). Eradication of metastatic mouse cancers resistant to immune checkpoint blockade by suppression of myeloid-derived cells. Proc. Natl. Acad. Sci. U. S. A. 111, 11774–11779. [DOI] [PMC free article] [PubMed] [Google Scholar]
- Ko C-Y, Chang W-C, and Wang J-M (2015). Biological roles of CCAAT/Enhancer-binding protein delta during inflammation. J. Biomed. Sci. 22, 6. [DOI] [PMC free article] [PubMed] [Google Scholar]
- Landskron G, De la Fuente M, Thuwajit P, Thuwajit C, and Hermoso MA (2014). Chronic inflammation and cytokines in the tumor microenvironment. J Immunol Res 2014, 149185. [DOI] [PMC free article] [PubMed] [Google Scholar]
- Langmead B, and Salzberg SL (2012). Fast gapped-read alignment with Bowtie 2. Nat. Methods 9, 357–359. [DOI] [PMC free article] [PubMed] [Google Scholar]
- Lawson KA, Sousa CM, Zhang X, Kim E, Akthar R, Caumanns JJ, Yao Y, Mikolajewicz N, Ross C, Brown KR, et al. (2020). Functional genomic landscape of cancer-intrinsic evasion of killing by T cells. Nature 586, 120–126. [DOI] [PMC free article] [PubMed] [Google Scholar]
- Li B, Severson E, Pignon J-C, Zhao H, Li T, Novak J, Jiang P, Shen H, Aster JC, Rodig S, et al. (2016). Comprehensive analyses of tumor immunity: implications for cancer immunotherapy. Genome Biol. 17, 174. [DOI] [PMC free article] [PubMed] [Google Scholar]
- Li F, Huang Q, Luster TA, Hu H, Zhang H, Ng W-L, Khodadadi-Jamayran A, Wang W, Chen T, Deng J, et al. (2020). Epigenetic CRISPR Screen Identifies as an Immunotherapeutic Target in -Mutant Lung Adenocarcinoma. Cancer Discov. 10, 270–287. [DOI] [PMC free article] [PubMed] [Google Scholar]
- Li H, and Durbin R (2009). Fast and accurate short read alignment with Burrows-Wheeler transform. Bioinformatics 25, 1754–1760. [DOI] [PMC free article] [PubMed] [Google Scholar]
- Li H, Handsaker B, Wysoker A, Fennell T, Ruan J, Homer N, Marth G, Abecasis G, Durbin R, and 1000 Genome Project Data Processing Subgroup (2009). The Sequence Alignment/Map format and SAMtools. Bioinformatics 25, 2078–2079. [DOI] [PMC free article] [PubMed] [Google Scholar]
- Li L, Liu Y-D, Zhan Y-T, Zhu Y-H, Li Y, Xie D, and Guan X-Y (2018). High levels of CCL2 or CCL4 in the tumor microenvironment predict unfavorable survival in lung adenocarcinoma. Thorac Cancer 9, 775–784. [DOI] [PMC free article] [PubMed] [Google Scholar]
- Li S, Wan C, Zheng R, Fan J, Dong X, Meyer CA, and Liu XS (2019). Cistrome-GO: a web server for functional enrichment analysis of transcription factor ChIP-seq peaks. Nucleic Acids Res. 47, W206–W211. [DOI] [PMC free article] [PubMed] [Google Scholar]
- Li T, Fan J, Wang B, Traugh N, Chen Q, Liu JS, Li B, and Liu XS (2017). TIMER: A Web Server for Comprehensive Analysis of Tumor-Infiltrating Immune Cells. Cancer Res. 77, e108–e110. [DOI] [PMC free article] [PubMed] [Google Scholar]
- Li T, Fu J, Zeng Z, Cohen D, Li J, Chen Q, Li B, and Liu XS (2020). TIMER2.0 for analysis of tumor-infiltrating immune cells. Nucleic Acids Res. 48, W509–W514. [DOI] [PMC free article] [PubMed] [Google Scholar]
- Li W, Xu H, Xiao T, Cong L, Love MI, Zhang F, Irizarry RA, Liu JS, Brown M, and Liu XS (2014). MAGeCK enables robust identification of essential genes from genome-scale CRISPR/Cas9 knockout screens. Genome Biol. 15, 554. [DOI] [PMC free article] [PubMed] [Google Scholar]
- Li W, Köster J, Xu H, Chen C-H, Xiao T, Liu JS, Brown M, and Liu XS (2015). Quality control, modeling, and visualization of CRISPR screens with MAGeCK-VISPR. Genome Biol. 16, 281. [DOI] [PMC free article] [PubMed] [Google Scholar]
- Lim SY, Yuzhalin AE, Gordon-Weeks AN, and Muschel RJ (2016). Targeting the CCL2-CCR2 signaling axis in cancer metastasis. Oncotarget 7, 28697–28710. [DOI] [PMC free article] [PubMed] [Google Scholar]
- Love MI, Huber W, and Anders S (2014). Moderated estimation of fold change and dispersion for RNA-seq data with DESeq2. Genome Biol. 15, 550. [DOI] [PMC free article] [PubMed] [Google Scholar]
- Mandal R, Samstein RM, Lee K-W, Havel JJ, Wang H, Krishna C, Sabio EY, Makarov V, Kuo F, Blecua P, et al. (2019). Genetic diversity of tumors with mismatch repair deficiency influences anti-PD-1 immunotherapy response. Science 364, 485–491. [DOI] [PMC free article] [PubMed] [Google Scholar]
- Manguso RT, Pope HW, Zimmer MD, Brown FD, Yates KB, Miller BC, Collins NB, Bi K, LaFleur MW, Juneja VR, et al. (2017). In vivo CRISPR screening identifies Ptpn2 as a cancer immunotherapy target. Nature 547, 413–418. [DOI] [PMC free article] [PubMed] [Google Scholar]
- Marine J-C (2012). Spotlight on the role of COP1 in tumorigenesis. Nat. Rev. Cancer 12, 455–464. [DOI] [PubMed] [Google Scholar]
- Mei S, Qin Q, Wu Q, Sun H, Zheng R, Zang C, Zhu M, Wu J, Shi X, Taing L, et al. (2017). Cistrome Data Browser: a data portal for ChIP-Seq and chromatin accessibility data in human and mouse. Nucleic Acids Res. 45, D658–D662. [DOI] [PMC free article] [PubMed] [Google Scholar]
- Mészáros B, Kumar M, Gibson TJ, Uyar B, and Dosztányi Z (2017). Degrons in cancer. Sci. Signal 10. [DOI] [PubMed] [Google Scholar]
- Meyskens FL Jr, Kopecky K, Samson M, Hersh E, Macdonald J, Jaffe H, Crowley J, and Coltman C (1990). Recombinant human interferon gamma: adverse effects in high-risk stage I and II cutaneous malignant melanoma. J. Natl. Cancer Inst. 82, 1071. [DOI] [PubMed] [Google Scholar]
- Meyskens FL Jr, Kopecky KJ, Taylor CW, Noyes RD, Tuthill RJ, Hersh EM, Feun LG, Doroshow JH, Flaherty LE, and Sondak VK (1995). Randomized trial of adjuvant human interferon gamma versus observation in high-risk cutaneous melanoma: a Southwest Oncology Group study. J. Natl. Cancer Inst. 87, 1710–1713. [DOI] [PubMed] [Google Scholar]
- Mezzadra R, Sun C, Jae LT, Gomez-Eerland R, de Vries E, Wu W, Logtenberg MEW, Slagter M, Rozeman EA, Hofland I, et al. (2017). Identification of CMTM6 and CMTM4 as PD-L1 protein regulators. Nature 549, 106–110. [DOI] [PMC free article] [PubMed] [Google Scholar]
- Miao Z-H, and Ding J (2003). Transcription factor c-Jun activation represses mdr-1 gene expression. Cancer Res. 63, 4527–4532. [PubMed] [Google Scholar]
- Migliorini D, Bogaerts S, Defever D, Vyas R, Denecker G, Radaelli E, Zwolinska A, Depaepe V, Hochepied T, Skarnes WC, et al. (2011a). Cop1 constitutively regulates c-Jun protein stability and functions as a tumor suppressor in mice. J. Clin. Invest. 121, 1329–1343. [DOI] [PMC free article] [PubMed] [Google Scholar]
- Migliorini D, Bogaerts S, Defever D, Vyas R, Denecker G, Radaelli E, Zwolinska A, Depaepe V, Hochepied T, Skarnes WC, et al. (2011b). Cop1 constitutively regulates c-Jun protein stability and functions as a tumor suppressor in mice. J. Clin. Invest. 121, 1329–1343. [DOI] [PMC free article] [PubMed] [Google Scholar]
- Minn AJ (2015). Interferons and the Immunogenic Effects of Cancer Therapy. Trends Immunol. 36, 725–737. [DOI] [PMC free article] [PubMed] [Google Scholar]
- Mootha VK, Lindgren CM, Eriksson K-F, Subramanian A, Sihag S, Lehar J, Puigserver P, Carlsson E, Ridderstråle M, Laurila E, et al. (2003). PGC-1α-responsive genes involved in oxidative phosphorylation are coordinately downregulated in human diabetes. Nature Genetics 34, 267–273. [DOI] [PubMed] [Google Scholar]
- Motz GT, and Coukos G (2013). Deciphering and reversing tumor immune suppression. Immunity 39, 61–73. [DOI] [PMC free article] [PubMed] [Google Scholar]
- Murphy JM, Nakatani Y, Jamieson SA, Dai W, Lucet IS, and Mace PD (2015). Molecular Mechanism of CCAAT-Enhancer Binding Protein Recruitment by the TRIB1 Pseudokinase. Structure 23, 2111–2121. [DOI] [PubMed] [Google Scholar]
- Nakamae I, Kato J-Y, Yokoyama T, Ito H, and Yoneda-Kato N (2017). Myeloid leukemia factor 1 stabilizes tumor suppressor C/EBPα to prevent Trib1-driven acute myeloid leukemia. Blood Adv 1, 1682–1693. [DOI] [PMC free article] [PubMed] [Google Scholar]
- Nanda R, Chow LQM, Dees EC, Berger R, Gupta S, Geva R, Pusztai L, Pathiraja K, Aktan G, Cheng JD, et al. (2016). Pembrolizumab in Patients With Advanced Triple-Negative Breast Cancer: Phase Ib KEYNOTE-012 Study. J. Clin. Oncol. 34, 2460–2467. [DOI] [PMC free article] [PubMed] [Google Scholar]
- Ndoja A, Reja R, Lee S-H, Webster JD, Ngu H, Rose CM, Kirkpatrick DS, Modrusan Z, Chen Y-JJ, Dugger DL, et al. (2020). Ubiquitin Ligase COP1 Suppresses Neuroinflammation by Degrading c/EBPβ in Microglia. Cell 182, 1156–1169.e12. [DOI] [PubMed] [Google Scholar]
- Newman AM, Liu CL, Green MR, Gentles AJ, Feng W, Xu Y, Hoang CD, Diehn M, and Alizadeh AA (2015). Robust enumeration of cell subsets from tissue expression profiles. Nat. Methods 12, 453–457. [DOI] [PMC free article] [PubMed] [Google Scholar]
- Newman AM, Steen CB, Liu CL, Gentles AJ, Chaudhuri AA, Scherer F, Khodadoust MS, Esfahani MS, Luca BA, Steiner D, et al. (2019). Determining cell type abundance and expression from bulk tissues with digital cytometry. Nat. Biotechnol. 37, 773–782. [DOI] [PMC free article] [PubMed] [Google Scholar]
- Nielsen SR, and Schmid MC (2017). Macrophages as Key Drivers of Cancer Progression and Metastasis. Mediators Inflamm. 2017, 9624760. [DOI] [PMC free article] [PubMed] [Google Scholar]
- Noy R, and Pollard JW (2014). Tumor-associated macrophages: from mechanisms to therapy. Immunity 41, 49–61. [DOI] [PMC free article] [PubMed] [Google Scholar]
- Nusinow DP, Szpyt J, Ghandi M, Rose CM, McDonald ER 3rd, Kalocsay M, Jané-Valbuena J, Gelfand E, Schweppe DK, Jedrychowski M, et al. (2020). Quantitative Proteomics of the Cancer Cell Line Encyclopedia. Cell 180, 387–402.e16. [DOI] [PMC free article] [PubMed] [Google Scholar]
- Osterlund MT, Hardtke CS, Wei N, and Deng XW (2000). Targeted destabilization of HY5 during light-regulated development of Arabidopsis. Nature 405, 462–466. [DOI] [PubMed] [Google Scholar]
- Pan D, Kobayashi A, Jiang P, Ferrari de Andrade L, Tay RE, Luoma AM, Tsoucas D, Qiu X, Lim K, Rao P, et al. (2018). A major chromatin regulator determines resistance of tumor cells to T cell-mediated killing. Science 359, 770–775. [DOI] [PMC free article] [PubMed] [Google Scholar]
- Patro R, Duggal G, Love MI, Irizarry RA, and Kingsford C (2017). Salmon provides fast and bias-aware quantification of transcript expression. Nat. Methods 14, 417–419. [DOI] [PMC free article] [PubMed] [Google Scholar]
- Pearlman R, Frankel WL, Swanson B, Zhao W, Yilmaz A, Miller K, Bacher J, Bigley C, Nelsen L, Goodfellow PJ, et al. (2017). Prevalence and Spectrum of Germline Cancer Susceptibility Gene Mutations Among Patients With Early-Onset Colorectal Cancer. JAMA Oncol 3, 464–471. [DOI] [PMC free article] [PubMed] [Google Scholar]
- Peranzoni E, Lemoine J, Vimeux L, Feuillet V, Barrin S, Kantari-Mimoun C, Bercovici N, Guérin M, Biton J, Ouakrim H, et al. (2018). Macrophages impede CD8 T cells from reaching tumor cells and limit the efficacy of anti-PD-1 treatment. Proc. Natl. Acad. Sci. U. S. A 115, E4041–E4050. [DOI] [PMC free article] [PubMed] [Google Scholar]
- Qian B-Z, Li J, Zhang H, Kitamura T, Zhang J, Campion LR, Kaiser EA, Snyder LA, and Pollard JW (2011). CCL2 recruits inflammatory monocytes to facilitate breast-tumour metastasis. Nature 475, 222–225. [DOI] [PMC free article] [PubMed] [Google Scholar]
- Qin Q, Mei S, Wu Q, Sun H, Li L, Taing L, Chen S, Li F, Liu T, Zang C, et al. (2016). ChiLin: a comprehensive ChIP-seq and DNase-seq quality control and analysis pipeline. BMC Bioinformatics 17, 404. [DOI] [PMC free article] [PubMed] [Google Scholar]
- Qin Q, Fan J, Zheng R, Wan C, Mei S, Wu Q, Sun H, Brown M, Zhang J, Meyer CA, et al. (2020). Lisa: inferring transcriptional regulators through integrative modeling of public chromatin accessibility and ChIP-seq data. Genome Biol. 21, 32. [DOI] [PMC free article] [PubMed] [Google Scholar]
- Quinlan AR, and Hall IM (2010). BEDTools: a flexible suite of utilities for comparing genomic features. Bioinformatics 26, 841–842. [DOI] [PMC free article] [PubMed] [Google Scholar]
- Racle J, de Jonge K, Baumgaertner P, Speiser DE, and Gfeller D (2017). Simultaneous enumeration of cancer and immune cell types from bulk tumor gene expression data. Elife 6. [DOI] [PMC free article] [PubMed] [Google Scholar]
- Ramilowski JA, Goldberg T, Harshbarger J, Kloppmann E, Lizio M, Satagopam VP, Itoh M, Kawaji H, Carninci P, Rost B, et al. (2015). A draft network of ligand-receptor-mediated multicellular signalling in human. Nat. Commun. 6, 7866. [DOI] [PMC free article] [PubMed] [Google Scholar]
- Ramírez F, Ryan DP, Grüning B, Bhardwaj V, Kilpert F, Richter AS, Heyne S, Dündar F, and Manke T (2016). deepTools2: a next generation web server for deep-sequencing data analysis. Nucleic Acids Res. 44, W160–W165. [DOI] [PMC free article] [PubMed] [Google Scholar]
- Ritchie ME, Phipson B, Wu D, Hu Y, Law CW, Shi W, and Smyth GK (2015). limma powers differential expression analyses for RNA-sequencing and microarray studies. Nucleic Acids Res. 43, e47. [DOI] [PMC free article] [PubMed] [Google Scholar]
- Rørth P, Szabo K, and Texido G (2000). The level of C/EBP protein is critical for cell migration during Drosophila oogenesis and is tightly controlled by regulated degradation. Mol. Cell 6, 23–30. [DOI] [PubMed] [Google Scholar]
- Sagiv-Barfi I, Kohrt HEK, Czerwinski DK, Ng PP, Chang BY, and Levy R (2015). Therapeutic antitumor immunity by checkpoint blockade is enhanced by ibrutinib, an inhibitor of both BTK and ITK. Proc. Natl. Acad. Sci. U. S. A. 112, E966–E972. [DOI] [PMC free article] [PubMed] [Google Scholar]
- Satoh T, Kidoya H, Naito H, Yamamoto M, Takemura N, Nakagawa K, Yoshioka Y, Morii E, Takakura N, Takeuchi O, et al. (2013). Critical role of Trib1 in differentiation of tissue-resident M2-like macrophages. Nature 495, 524–528. [DOI] [PubMed] [Google Scholar]
- Savio MG, Rotondo G, Maglie S, Rossetti G, Bender JR, and Pardi R (2008). COP1D, an alternatively spliced constitutive photomorphogenic-1 (COP1) product, stabilizes UV stress-induced c-Jun through inhibition of full-length COP1. Oncogene 27, 2401–2411. [DOI] [PubMed] [Google Scholar]
- Schmid P, Adams S, Rugo HS, Schneeweiss A, Barrios CH, Iwata H, Diéras V, Hegg R, Im S-A, Shaw Wright G, et al. (2018). Atezolizumab and Nab-Paclitaxel in Advanced Triple-Negative Breast Cancer. N. Engl. J. Med. 379, 2108–2121. [DOI] [PubMed] [Google Scholar]
- de Sena Brandine G, and Smith AD (2019). Falco: high-speed FastQC emulation for quality control of sequencing data. F1000Res. 8, 1874. [DOI] [PMC free article] [PubMed] [Google Scholar]
- Seo HS, Yang J-Y, Ishikawa M, Bolle C, Ballesteros ML, and Chua N-H (2003). LAF1 ubiquitination by COP1 controls photomorphogenesis and is stimulated by SPA1. Nature 423, 995–999. [DOI] [PubMed] [Google Scholar]
- Sievers F, Wilm A, Dineen D, Gibson TJ, Karplus K, Li W, Lopez R, McWilliam H, Remmert M, Söding J, et al. (2011). Fast, scalable generation of high-quality protein multiple sequence alignments using Clustal Omega. Mol. Syst. Biol. 7, 539. [DOI] [PMC free article] [PubMed] [Google Scholar]
- Stuart T, Butler A, Hoffman P, Hafemeister C, Papalexi E, Mauck WM 3rd, Hao Y, Stoeckius M, Smibert P, and Satija R (2019). Comprehensive Integration of Single-Cell Data. Cell 177, 1888–1902.e21. [DOI] [PMC free article] [PubMed] [Google Scholar]
- Sturm G, Finotello F, Petitprez F, Zhang JD, Baumbach J, Fridman WH, List M, and Aneichyk T (2019). Comprehensive evaluation of transcriptome-based cell-type quantification methods for immuno-oncology. Bioinformatics 35, i436–i445. [DOI] [PMC free article] [PubMed] [Google Scholar]
- Su S, Chen J, Yao H, Liu J, Yu S, Lao L, Wang M, Luo M, Xing Y, Chen F, et al. (2018). CD10GPR77 Cancer-Associated Fibroblasts Promote Cancer Formation and Chemoresistance by Sustaining Cancer Stemness. Cell 172, 841–856.e16. [DOI] [PubMed] [Google Scholar]
- Sun H, Lu J, Liu L, Yang CY, and Wang S (2014). Potent and selective small-molecule inhibitors of cIAP1/2 proteins reveal that the binding of Smac mimetics to XIAP BIR3 is not required for their effective induction of cell death in tumor cells. ACS Chem. Biol. 9, 994–1002. [DOI] [PMC free article] [PubMed] [Google Scholar]
- Tisato V, Voltan R, Gonelli A, Secchiero P, and Zauli G (2017). MDM2/X inhibitors under clinical evaluation: perspectives for the management of hematological malignancies and pediatric cancer. J. Hematol. Oncol. 10, 133. [DOI] [PMC free article] [PubMed] [Google Scholar]
- Tsherniak A, Vazquez F, Montgomery PG, Weir BA, Kryukov G, Cowley GS, Gill S, Harrington WF, Pantel S, Krill-Burger JM, et al. (2017). Defining a Cancer Dependency Map. Cell 170, 564–576.e16. [DOI] [PMC free article] [PubMed] [Google Scholar]
- UniProt Consortium (2019). UniProt: a worldwide hub of protein knowledge. Nucleic Acids Res. 47, D506–D515. [DOI] [PMC free article] [PubMed] [Google Scholar]
- Vitari AC, Leong KG, Newton K, Yee C, O’Rourke K, Liu J, Phu L, Vij R, Ferrando R, Couto SS, et al. (2011). COP1 is a tumour suppressor that causes degradation of ETS transcription factors. Nature 474, 403–406. [DOI] [PubMed] [Google Scholar]
- Wachter F, Morgan AM, Godes M, Mourtada R, Bird GH, and Walensky LD (2017). Mechanistic validation of a clinical lead stapled peptide that reactivates p53 by dual HDM2 and HDMX targeting. Oncogene 36, 2184–2190.ric cancer. J. Hematol. Oncol. 10, 133. [DOI] [PMC free article] [PubMed] [Google Scholar]
- Waks AG, and Winer EP (2019). Breast Cancer Treatment. JAMA 321, 316. [DOI] [PubMed] [Google Scholar]
- Walens A, DiMarco AV, Lupo R, Kroger BR, Damrauer JS, and Alvarez JV (2019). CCL5 promotes breast cancer recurrence through macrophage recruitment in residual tumors. Elife 8. [DOI] [PMC free article] [PubMed] [Google Scholar]
- Wang B, Wang M, Zhang W, Xiao T, Chen C-H, Wu A, Wu F, Traugh N, Wang X, Li Z, et al. (2019). Integrative analysis of pooled CRISPR genetic screens using MAGeCKFlute. Nat. Protoc. 14, 756–780. [DOI] [PMC free article] [PubMed] [Google Scholar]
- Wang C, Sun D, Huang X, Wan C, Li Z, Han Y, Qin Q, Fan J, Qiu X, Xie Y, et al. (2020). Integrative analyses of single-cell transcriptome and regulome using MAESTRO. Genome Biol. 21, 198. [DOI] [PMC free article] [PubMed] [Google Scholar]
- Wang D, Sun H, Wei J, Cen B, and DuBois RN (2017). CXCL1 Is Critical for Premetastatic Niche Formation and Metastasis in Colorectal Cancer. Cancer Res. 77, 3655–3665. [DOI] [PMC free article] [PubMed] [Google Scholar]
- Waterhouse AM, Procter JB, Martin DMA, Clamp M, and Barton GJ (2009). Jalview Version 2--a multiple sequence alignment editor and analysis workbench. Bioinformatics 25, 1189–1191. [DOI] [PMC free article] [PubMed] [Google Scholar]
- Wehde BL, Rädler PD, Shrestha H, Johnson SJ, Triplett AA, and Wagner K-U (2018). Janus Kinase 1 Plays a Critical Role in Mammary Cancer Progression. Cell Rep. 25, 2192–2207.e5. [DOI] [PMC free article] [PubMed] [Google Scholar]
- Wei W, and Kaelin WG Jr (2011). Good COP1 or bad COP1? In vivo veritas. J. Clin. Invest. 121, 1263–1265. [DOI] [PMC free article] [PubMed] [Google Scholar]
- Wertz IE, O’Rourke KM, Zhang Z, Dornan D, Arnott D, Deshaies RJ, and Dixit VM (2004). Human De-etiolated-1 regulates c-Jun by assembling a CUL4A ubiquitin ligase. Science 303, 1371–1374. [DOI] [PubMed] [Google Scholar]
- Wong WC, Kim D, Carter H, Diekhans M, Ryan MC, and Karchin R (2011). CHASM and SNVBox: toolkit for detecting biologically important single nucleotide mutations in cancer. Bioinformatics 27, 2147–2148. [DOI] [PMC free article] [PubMed] [Google Scholar]
- Xiao T, Li W, Wang X, Xu H, Yang J, Wu Q, Huang Y, Geradts J, Jiang P, Fei T, et al. (2018). Estrogen-regulated feedback loop limits the efficacy of estrogen receptor-targeted breast cancer therapy. Proc. Natl. Acad. Sci. U. S. A 115, 7869–7878. [DOI] [PMC free article] [PubMed] [Google Scholar]
- Xu H, Xiao T, Chen C-H, Li W, Meyer CA, Wu Q, Wu D, Cong L, Zhang F, Liu JS, et al. (2015). Sequence determinants of improved CRISPR sgRNA design. Genome Res. 25, 1147–1157. [DOI] [PMC free article] [PubMed] [Google Scholar]
- Xu W, Zhong Q, Lin D, Li G, and Cao G (2021). CoolBox: A flexible toolkit for visual analysis of genomics data. bioRxiv. doi: 10.1101/2021.04.15.439923. [DOI] [PMC free article] [PubMed] [Google Scholar]
- Yokoyama T, and Nakamura T (2011). Tribbles in disease: Signaling pathways important for cellular function and neoplastic transformation. Cancer Sci. 102, 1115–1122. [DOI] [PubMed] [Google Scholar]
- Yoshida A, Kato J-Y, Nakamae I, and Yoneda-Kato N (2013). COP1 targets C/EBPα for degradation and induces acute myeloid leukemia via Trib1. Blood 122, 1750–1760. [DOI] [PubMed] [Google Scholar]
- Yu G, Wang L-G, Han Y, and He Q-Y (2012). clusterProfiler: an R package for comparing biological themes among gene clusters. OMICS 16, 284–287. [DOI] [PMC free article] [PubMed] [Google Scholar]
- Zhang J, Yan Y, Yang Y, Wang L, Li M, Wang J, Liu X, Duan X, and Wang J (2016). High Infiltration of Tumor-Associated Macrophages Influences Poor Prognosis in Human Gastric Cancer Patients, Associates With the Phenomenon of EMT. Medicine 95, e2636. [DOI] [PMC free article] [PubMed] [Google Scholar]
- Zhang X, Crowley VM, Wucherpfennig TG, Dix MM, and Cravatt BF (2019). Electrophilic PROTACs that degrade nuclear proteins by engaging DCAF16. Nat. Chem. Biol. 15, 737–746. [DOI] [PMC free article] [PubMed] [Google Scholar]
- Zhang Y, Liu T, Meyer CA, Eeckhoute J, Johnson DS, Bernstein BE, Nusbaum C, Myers RM, Brown M, Li W, et al. (2008). Model-based analysis of ChIP-Seq (MACS). Genome Biol. 9, R137. [DOI] [PMC free article] [PubMed] [Google Scholar]
- Zhao J, Ou B, Han D, Wang P, Zong Y, Zhu C, Liu D, Zheng M, Sun J, Feng H, et al. (2017). Tumor-derived CXCL5 promotes human colorectal cancer metastasis through activation of the ERK/Elk-1/Snail and AKT/GSK3β/β-catenin pathways. Mol. Cancer 16, 70. [DOI] [PMC free article] [PubMed] [Google Scholar]
- Zheng R, Wan C, Mei S, Qin Q, Wu Q, Sun H, Chen C-H, Brown M, Zhang X, Meyer CA, et al. (2019). Cistrome Data Browser: expanded datasets and new tools for gene regulatory analysis. Nucleic Acids Res. 47, D729–D735. [DOI] [PMC free article] [PubMed] [Google Scholar]
Associated Data
This section collects any data citations, data availability statements, or supplementary materials included in this article.
Supplementary Materials
Figure S5. Related to Figures 4 and 5. Prioritization of Putative Cop1 Substrates.
(A) Heat map showing changes in chromatin accessibility of Rosa26 and Cop1 KO 4T1 cancer cells without IFNγ stimulation.
(B) TF motif enrichment of Rosa26 and Cop1 KO 4T1 cancer cells with or without IFNγ stimulation. Expected (x axis) versus observed (y axis) percentages of IFNγ treated cells peaks overlapping each TF binding site annotation.
(C) Western blot of protein ubiquitination levels in Rosa26 KO and Cop1 KO 4T1 cells under treatment of vehicle or MG132 (at 50 μM for 8 hours).
(D) Heatmap displaying the correlation in the proteome for samples indicates consistency among replicates. Color indicates the spearman correlation.
(E) Differential protein abundance (Cop1 KO VS. Rosa26 4T1 cells) of previously reported substrates of Cop1.
(F) Significant enriched ontology terms of Cop1 KO-specific C/ebpδ peaks. p values determined by hypergeometric test.
(G) Heatmap showing differential transcriptomic expression in Rosa26 KO and C/ebpδ KO 4T1 cells with IFNγ stimulation.
(H) Compared to adjacent normal tissue, COP1 was overexpressed in TCGA cancer samples. Data are shown as mean ± SEM, *p < 0.05, ***p < 0.001, by Mann-Whitney U test.
(I and J) Partial spearman correlation after adjusting for tumor purity of the Cop1 gene expression signature with estimated immune cell infiltration of tumors from I) Cibersort, and J) xCell. X-axis reflects cancer types from TCGA and y-axis is immune cell types.
(K) Correlation of COP1 protein level with protein levels of macrophage-associated chemokines, upon Cop1 KO in multiple human breast and colorectal cancer cell lines.
(L) Kaplan-Meier plot displaying that higher COP1 expression associates with worse survival in the ovarian and kidney cancer cohorts (Cox PH test).
(M and N) Kaplan-Meier plot displaying that higher COP1 expression associates with worse survival in the METABRIC breast cancer cohort (Cox PH test). The association with survival was still significant when restricting Triple Negative Breast Cancer (TNBC) (Mann-Whitney U test).
Figure S1. Related to Figure 1. Optimization and Validation of Primary MusCK In Vivo CRISPR Screens in the Mouse 4T1 TNBC Models.
(A) Pie chart showing the fraction of genes targeted in the MusCK library.
(B) Protein Cas9 expression in MusCK library-infected 4T1 cells.
(C) Expression of hormone receptors and PD-L1 in mouse and human cancer cells.
(D) Principal component analysis of transcriptome of mouse and human breast cancer cells.
(E) MAGeCK analysis and RRA ranking of top depleted genes in the in vitro MusCK screen.
(F) MAGeCK analysis and RRA ranking of top enriched genes in the in vitro MusCK screen.
(G) Mouse 4T1 cell line was transduced with a vector expressing various forms of ovalbumin antigen.
(H) Western blot of 4T1 cell lysate for ovalbumin and GAPDH after transfection with either control or ovalbumin vector.
(I) Tumor volume of wild-type or ovalbumin expressing 4T1 cancers.
(J) Tumor infiltrating T cells in wild-type or ovalbumin expressing 4T1 cancers.
(K) Western blot of 4T1 cell lysate for Cas9, ovalbumin and GAPDH after transduction with CRISPR library.
(L) Flow cytometry analysis of T cells and B cells in different host conditions.
(M) Tumor volume averaged for groups indicated and tumor weight measured at 16 days post implantation. n = 12 per group.
(N) Gene set enrichment analysis of 4T1 tumor and 4T1 cells. Top enriched pathways in 4T1 tumors versus 4T1 cells were shown. GSEA terms significantly upregulated in 4T1 tumors compared with 4T1 cells.
(O) Scheme of in vivo competition between Jak1 or Stat1 KO and control Rosa26 KO cells.
(P) Western blotting of Jak1 and Stat1 expression in 4T1 and EMT6 cells transduced with single gRNA targeting Jak1 (or Stat1).
Figure S2. Related to Figure 2. MusCK 2.0 Library Screens on 4T1 and EMT6 TNBC Mouse Models.
(A) Scheme of MusCK 2.0 in vivo screen.
(B) Tumor volume of 4T1 tumor averaged for groups indicated and tumor weight measured at 16 days post implantation. Error bars represent +/− 1 SEM, n = 10 mice per group.
(C) A matrix of the Pearson’s correlations of the library distribution from one animal compared to any other animal for MusCK 2.0 screen using 4T1 cells.
(D) Representative plots showing the gating strategy for different populations of tumor infiltrating immune cells.
(E and F) Flow cytometry analysis of tumor infiltrating immune cell population in mice under different treatment. Data are shown as mean ± SEM, n = 5 per group, *p < 0.05, **p < 0.01, ***p < 0.001, ****p < 0.0001, by one-way ANOVA with Benjamini-Hochberg post-test multiple comparison.
(G) Tumor volume of EMT6 tumor averaged for groups indicated. Error bars represent +/− 1 SEM, n = 10-12 mice per group.
(H) EMT6 tumor volume and weight measured at 16 days post implantation. Data are shown as mean ± SEM, n = 10-12 mice per group, *p < 0.05, ****p < 0.0001, by one-way ANOVA with Benjamini-Hochberg post-test multiple comparison.
(I) A matrix of the Pearson’s correlations of the library distribution from one animal compared to any other animal for MusCK 2.0 screen using EMT6 cells.
(J) MAGeCK analysis and RRA ranking of top depleted genes in the MusCK 2.0 screen.
Figure S3. Related to Figure 2. MusCK 2.0 Library Screens on MC38 Colon Cancer Mouse Models and Identification of Cop1 Function on Mouse Models.
(A) Tumor volume of MC38 tumor averaged for groups indicated. Error bars represent +/− 1 SEM, n = 10-12 mice per group.
(B) Tumor volume and weight measured at 19 days post implantation. Data are shown as mean ± SEM, n = 10-12 mice per group, *p < 0.05, ****p < 0.0001, by one-way ANOVA with Benjamini-Hochberg post-test multiple comparison.
(C) A matrix of the Pearson’s correlations of the library distribution from one animal compared to any other animal for MusCK 2.0 screen using MC38 cells.
(D) MAGeCK analysis and RRA ranking of top depleted genes in the MusCK 2.0 screen.
(E) Frequency of sgRNAs targeting Cop1 in the MusCK 2.0 screen on 4T1 and EMT6 TNBC mouse models.
(F) Behavior of individual sgRNAs targeting Cop1 in MusCK 2.0 screen in 4T1 TNBC models.
(G) Cell viability of Rosa26 and Cop1 KO 4T1 cells cultured in vitro. Data are shown as mean ± SEM, n = 6 per group, by one-way ANOVA with Benjamini-Hochberg post-test multiple comparison.
(H) Flow cytometry analysis of Cop1 KO cells versus control cells in the resulting 4T1 tumors.
(I) Flow cytometry analysis of Cop1 KO cells versus control cells in the resulting MC38 tumors.
(J and K) Tumor volume and Kaplan-Meier survival analysis of host animals bearing Rosa26 and Cop1 KO MC38 tumors under immunoglobulin G (IgG) isotype or anti-PD-1 antibody treatment. Data are shown as mean ± SEM, n = 10 mice per group, *p < 0.05, ***p < 0.001, by one-way ANOVA with Benjamini-Hochberg post-test multiple comparison.
Figure S6. Related to Figure 6. Trib2 Serve as a Substrate Adaptor for Cop1 to Target C/ebpδ.
(A) Diagram displaying that putative Cop1 substrates must be up-regulated at the protein-level upon Cop1 KO, contain a Cop1 degron motif, and score well according to a machine learning model.
(B) Scoring of the degron-likelihood by the RF algorithm of Cop1 motifs indicates known Cop1 substrates received higher scores. Box plot represents quartiles +/− 1.5 interquartile range. Mann-Whitney U test.
(C) Overlapping the results from mouse and human showed 117 motif hits as possible Cop1 degrons (score>0.5).
(D) Protein interaction network of human COP1 (Bioplex database) indicates tribbles protein family (TRIB1/2/3) physically interact with COP1. Colors denote differential expression upon Cop1 KO: red=up-regulated, blue=down-regulated.
(E and F) The lysate from wild-type 4T1 cells were incubated with Trib2 and C/ebpδ antibody or normal control IgG, and the immunocomplexes were probed with the indicated antibodies.
(G) Relative mRNA levels of Cop1, Trib2 and C/ebpδ in Rosa26 KO and Cop1 KO cancer cells. Data are shown as mean ± SEM, 3 replicates per condition, ****p < 0.0001, by one-way ANOVA with Benjamini-Hochberg multiple test correction.
(H) Real time PCR analysis confirmed that the Cop1 overexpression condition was indeed overexpressed compared to the empty vector.
(I) Western blot of protein ubiquitination levels of Rosa26 KO and Cop1 KO 4T1 cells under treatment of vehicle or MG132.
(J) Model for Cop1-driven macrophage infiltration.
Figure S4. Related to Figure 3. Cop1 Knockout Sensitized Cancer Cells to Immune-mediated Cytotoxicity.
(A) Location of COP1 (RFWD2) gene on chromosome 1 and percentage of subjects with COP1 gene amplification (red) in different breast cancer data sets.
(B) RNA-sequencing of Rosa26 and Cop1 KO 4T1 cancer cells without IFNγ stimulation. Red dots denote genes significantly (p < 0.05) differentially expressed in conditions compared.
(C) Heatmap showing differential transcriptomic expression in Rosa26 and Cop1 KO 4T1 cells without IFNγ stimulation.
(D) Gene set enrichment analysis of Rosa26 and Cop1 KO 4T1 cancer cells without IFNγ stimulation. Top depleted pathways in Cop1 KO cells versus Rosa26 control cells were shown.
(E) Differential transcriptomic expression of macrophage-related genes in Rosa26 and Cop1 KO 4T1 cells without IFNγ stimulation.
(F) Representative images of chemokines from proteome array analysis of control (Rosa26) and Cop1 KO 4T1 in vitro cell culture supernatants without IFNγ stimulation.
(G) Representative images of chemokines from proteome array analysis of control (Rosa26) and Cop1 KO 4T1 in vitro cell culture supernatants with IFNγ stimulation.
(H) Quantification of percentage of macrophages in all tumor-infiltrating myeloid cells. Data are shown as mean ± SEM, n = 8-10 per group, *p < 0.05, **p < 0.01, ***p < 0.001, by one-way ANOVA with Benjamini-Hochberg post-test multiple comparison.
(I) Immunohistochemistry of sections showing monocyte chemoattractant CCL2/MCP1 expression in Rosa26 and Cop1 KO 4T1 tumors.
(J) Flow cytometry analysis of CD8+ T cell populations in Rosa26 and Cop1 KO 4T1 tumors grown in BALB/c mice under different treatment in vivo. Quantification of percentage of CD8+ T cells in all tumor-infiltrating T cells.
(K) Flow cytometry analysis of myeloid cell populations in Rosa26 and Cop1 KO 4T1 tumors grown in BALB/c mice under different treatment in vivo. Quantification of percentage of myeloid cells in all tumor-infiltrating CD45+ cells.
(L) Flow cytometry analysis of monocyte populations in Rosa26 and Cop1 KO 4T1 tumors grown in BALB/c mice under different treatment in vivo. Quantification of percentage of monocytes in all tumor-infiltrating CD45+ cells.
(M) Representative images of chemokines from proteome array analysis of control (Rosa26) and Cop1 KO 4T1 tumors (left). Quantification of differential protein expression (in cytokine array) of tumor extracts harvested from host animals (right).
(N) Gene expressions of macrophage-associated chemokines and chemokine receptors of control (Rosa26) and Cop1 KO 4T1 tumors grown in BALB/c hosts.
(O) Correlation of macrophage infiltration with tumor volume at end point.
(P) Correlation of T cell infiltration with tumor volume at end point.
Table S1: Guide RNA design for MusCK library, Related to Figure 1.
Table S2: In vitro MusCK library screening on 4T1 TNBC cells, Related to Figure 1.
Table S3: In vivo MusCK library screening on 4T1 TNBCcells, Related to Figure 1.
Table S4: In vivo MusCK2.0 library screening on 4T1 TNBC cells, Related to Figure 2.
Table S5: ATAC-seq analysis of Cop1 KO and Rosa26 KO 4T1 cells, Related to Figure 4.
Table S6: Proteomics of Cop1 KO and Rosa26 KO 4T1 cells, Related to Figure 4.
Data Availability Statement
The processed sequencing data in this paper have been deposited into the NCBI GEO database: GSE171467, GSE173296, GSE174784, GSE175332. Additional Supplemental Items are available at Mendeley Data: https://data.mendeley.com/datasets/9xkgn447vz/1; https://data.mendeley.com/datasets/9d5499gb8x/1. All the code are also available at GitHub: https://github.com/liulab-dfci/Cop1_Cell_2021.