

SUMMARY
Trophoblast organoids derived from placental villi provide a 3D model system of human placental development, but access to first-trimester tissues is limited. Here we report that trophoblast stem cells isolated from naïve human pluripotent stem cells (hPSCs) can efficiently self-organize into 3D stem cell-derived trophoblast organoids (SC-TOs) with a villous architecture similar to primary trophoblast organoids. Single cell transcriptome analysis reveals the presence of distinct cytotrophoblast and syncytiotrophoblast clusters and a small cluster of extravillous trophoblasts, which closely correspond to trophoblast identities in the post-implantation embryo. These organoid cultures display clonal X chromosome inactivation patterns previously described in the human placenta. We further demonstrate that SC-TOs exhibit selective vulnerability to emerging pathogens (SARS-CoV-2 and Zika virus), which correlates with expression levels of their respective entry factors. The generation of trophoblast organoids from naïve hPSCs provides an accessible 3D model system of the developing placenta and its susceptibility to emerging pathogens.
Keywords: naïve pluripotency, trophoblast stem cells, trophoblast organoids, single cell transcriptomics, placental development, X chromosome inactivation, SARS-CoV-2, Zika virus
Graphical Abstract

eTOC Blurb:
Theunissen et al. describe a methodology for deriving self-renewing 3D trophoblast organoids from naïve human pluripotent stem cells. They demonstrate that stem cell-derived trophoblast organoids model human placental development, X chromosome inactivation, and placental susceptibility to infection by emerging viral pathogens (SARS-CoV-2 and Zika virus).
INTRODUCTION
The human placenta forms a barrier between mother and fetus that nourishes the embryo through the exchange of nutrients and gases and protects the fetus from harmful assaults. Placental abnormalities in the first trimester are associated with pregnancy complications such as preeclampsia, miscarriage, and fetal growth restriction (Smith, 2010). However, the ability to study human placental development in utero is limited due to ethical and legal concerns, particularly at early stages. In recent years, two complementary approaches have been developed to model human placental development in vitro. The first approach is to derive 3D placental organoids from primary proliferative cells of the first-trimester placenta, which are called cytotrophoblasts (CTB) (Haider et al., 2018; Turco et al., 2018). These trophoblast organoids contain CTBs that differentiate into syncytiotrophoblasts (STBs), much like the primary villi, and secrete placental hormones. The recent derivation of human trophoblast stem cells (hTSCs) offers an alternative approach to model the first-trimester placenta in vitro. hTSCs are isolated from primary placenta of the first trimester or human blastocyst outgrowths and can be maintained by combining a WNT activator, epidermal growth factor (EGF), and inhibitors of histone deacetylases (HDACs) and transforming growth factor beta (TGF-β) (Okae et al., 2018). We and others have demonstrated that hTSCs can also be derived from naïve human pluripotent stem cells (hPSCs) (Castel et al., 2020; Cinkornpumin et al., 2020; Dong et al., 2020; Guo et al., 2021; Io et al., 2021) or somatic cells via direct reprogramming (Castel et al., 2020; Liu et al., 2020). Here we explored whether hTSCs have the potential to self-organize into self-renewing 3D trophoblast organoids and determined the cellular complexity of the resulting organoids by single cell transcriptomics. Our findings indicate that, regardless of their source, hTSCs robustly generate 3D trophoblast organoids with a similar villous architecture similar to primary trophoblast organoids. These stem cell-derived trophoblast organoids (SC-TOs) comprise five distinct subpopulations that correspond to trophoblast cell types found during early pregnancy. We also characterize X chromosome inactivation (XCI) dynamics during the generation of SC-TOs from naïve hPSCs and describe approaches for their directed differentiation into invasive 3D EVT organoids. The generation of trophoblast organoids from naïve hPSCs provides an accessible and patient-specific 3D model system of human placental development.
In addition to mediating maternal-fetal communication, the placenta serves as an important defense against fetal viral infections. Transplacental infection of Zika virus (ZIKV) has been implicated as one of several possible mechanisms underlying ZIKV vertical transmission during the first trimester, which can result in severe congenital malformations such as microcephaly in infants (Aagaard et al., 2017; Brasil et al., 2016; Liang et al., 2019; Sheridan et al., 2017). Coronavirus disease 2019 (COVID-19) is a severe acute respiratory disease caused by the SARS-CoV-2 virus. Since the first reported case in Wuhan, China, in December 2019, COVID-19 has rapidly become a global pandemic. While primarily associated with respiratory failure, recent studies have reported an alarming frequency of pregnancy complications in women who contracted COVID-19 (Di Mascio et al., 2020). SARS-CoV-2 utilizes ACE2 and TMPRSS2 surface proteins as entry factors (Hoffmann et al., 2020) and a subset of placental cells express these two proteins on their surface (Sungnak et al., 2020; Weatherbee et al., 2020). We recently detected viral spike RNA and protein in ACE2-expressing maternal and fetal cells in placentas from SARS-CoV-2-infected women, which correlated with alterations of the local renin angiotensin system (Verma et al., 2021). However, clinical evidence of vertical transmission from mother to fetus appears limited in most circumstances (Chen et al., 2020; Schwartz, 2020; Verma et al., 2020), although it has been documented in some cases, particularly when there are comorbidities (Hsu et al., 2021; Vivanti et al., 2020). These data demonstrate the need for an accessible in vitro model system to test mechanisms of SARS-CoV-2 infection of the placenta. Stem cell-derived organoid models have been used to test cell type-specific vulnerability to SARS-CoV-2 infection in other organ systems, such as the lung, gut, brain, and airway epithelium (Bullen et al., 2020; Lamers et al., 2020; Mykytyn et al., 2021; Pellegrini et al., 2020; Yang et al., 2020; Zhou et al., 2020). Here, we demonstrate that early trophoblast cell types in SC-TOs are readily infected by ZIKV but display limited susceptibility to SARS-CoV-2. These findings suggest that the first-trimester placenta may exhibit differential susceptibility to emerging pathogens and our model provides a foundation for elucidating the pathogenesis of viral infection.
RESULTS
3D trophoblast organoids derived from naïve and primary hTSCs display comparable tissue architecture, placental hormone secretion, and capacity for long-term self-renewal
To explore the potential of hTSCs to self-organize into 3D organoids, we dissociated hTSCs derived from a blastocyst (BT5), primary first-trimester CTBs (CT27, CT30), and naïve hPSCs (H9, WIBR3) into single cells and seeded them in 3D Matrigel droplets in the presence of trophoblast organoid medium (TOM) (Turco et al., 2018) (Fig. 1A). 3D structures developed over the course of 10–12 days that could be maintained for at least 10 passages (Fig. 1B and Fig. S1A–B). While most organoids had a dense morphology (Fig. 1B, red arrows), a subset formed cyst-like structures (Fig. 1B, asterisks). Quantitative real-time PCR (qRT-PCR) analysis confirmed the upregulation of trophoblast markers ELF5, GATA3, TFAP2C and downregulation of naïve and primed pluripotency markers in trophoblast organoids generated from naïve hPSCs (Fig. 1C and Fig. S1C). In addition, all stem cell-derived trophoblast organoids (SC-TOs) showed substantial upregulation of a primate-specific microRNA (miRNA) cluster on chromosome 19 (C19MC), which exhibits placenta-specific expression (Noguer-Dance et al., 2010) (Fig. 1D). Interestingly, these miRNAs were already significantly induced in naïve compared to primed hPSCs, which may contribute to the trophoblast potential of naïve hPSCs. Immunofluorescence (IF) analysis indicated that epithelial CTBs (marked by CDH1 and TP63) were largely confined to the periphery of the organoids, while multinucleated STBs were located towards the interior (Fig. 1E). Furthermore, Ki67 staining demonstrated that this epithelial CTB compartment contained proliferative cells (Fig. 1E and Fig. S1D). This “inside-out” architecture is reminiscent of the villous architecture described in primary trophoblast organoids derived directly from first-trimester placental tissues (Turco et al., 2018). Pan-trophoblast markers GATA3 and KRT7 were strongly expressed among the nuclear and cytoskeletal compartments, respectively (Fig. 1E and Fig. S1D). Cyst-like structures present within the organoid culture were uniformly positive for the STB marker CGA, which encodes the alpha subunit of hCG (Fig. S1E), and thus represent a subset of fully syncytialized SC-TOs.
Figure 1: Characterization of 3D organoids derived from naïve and primary hTSCs.
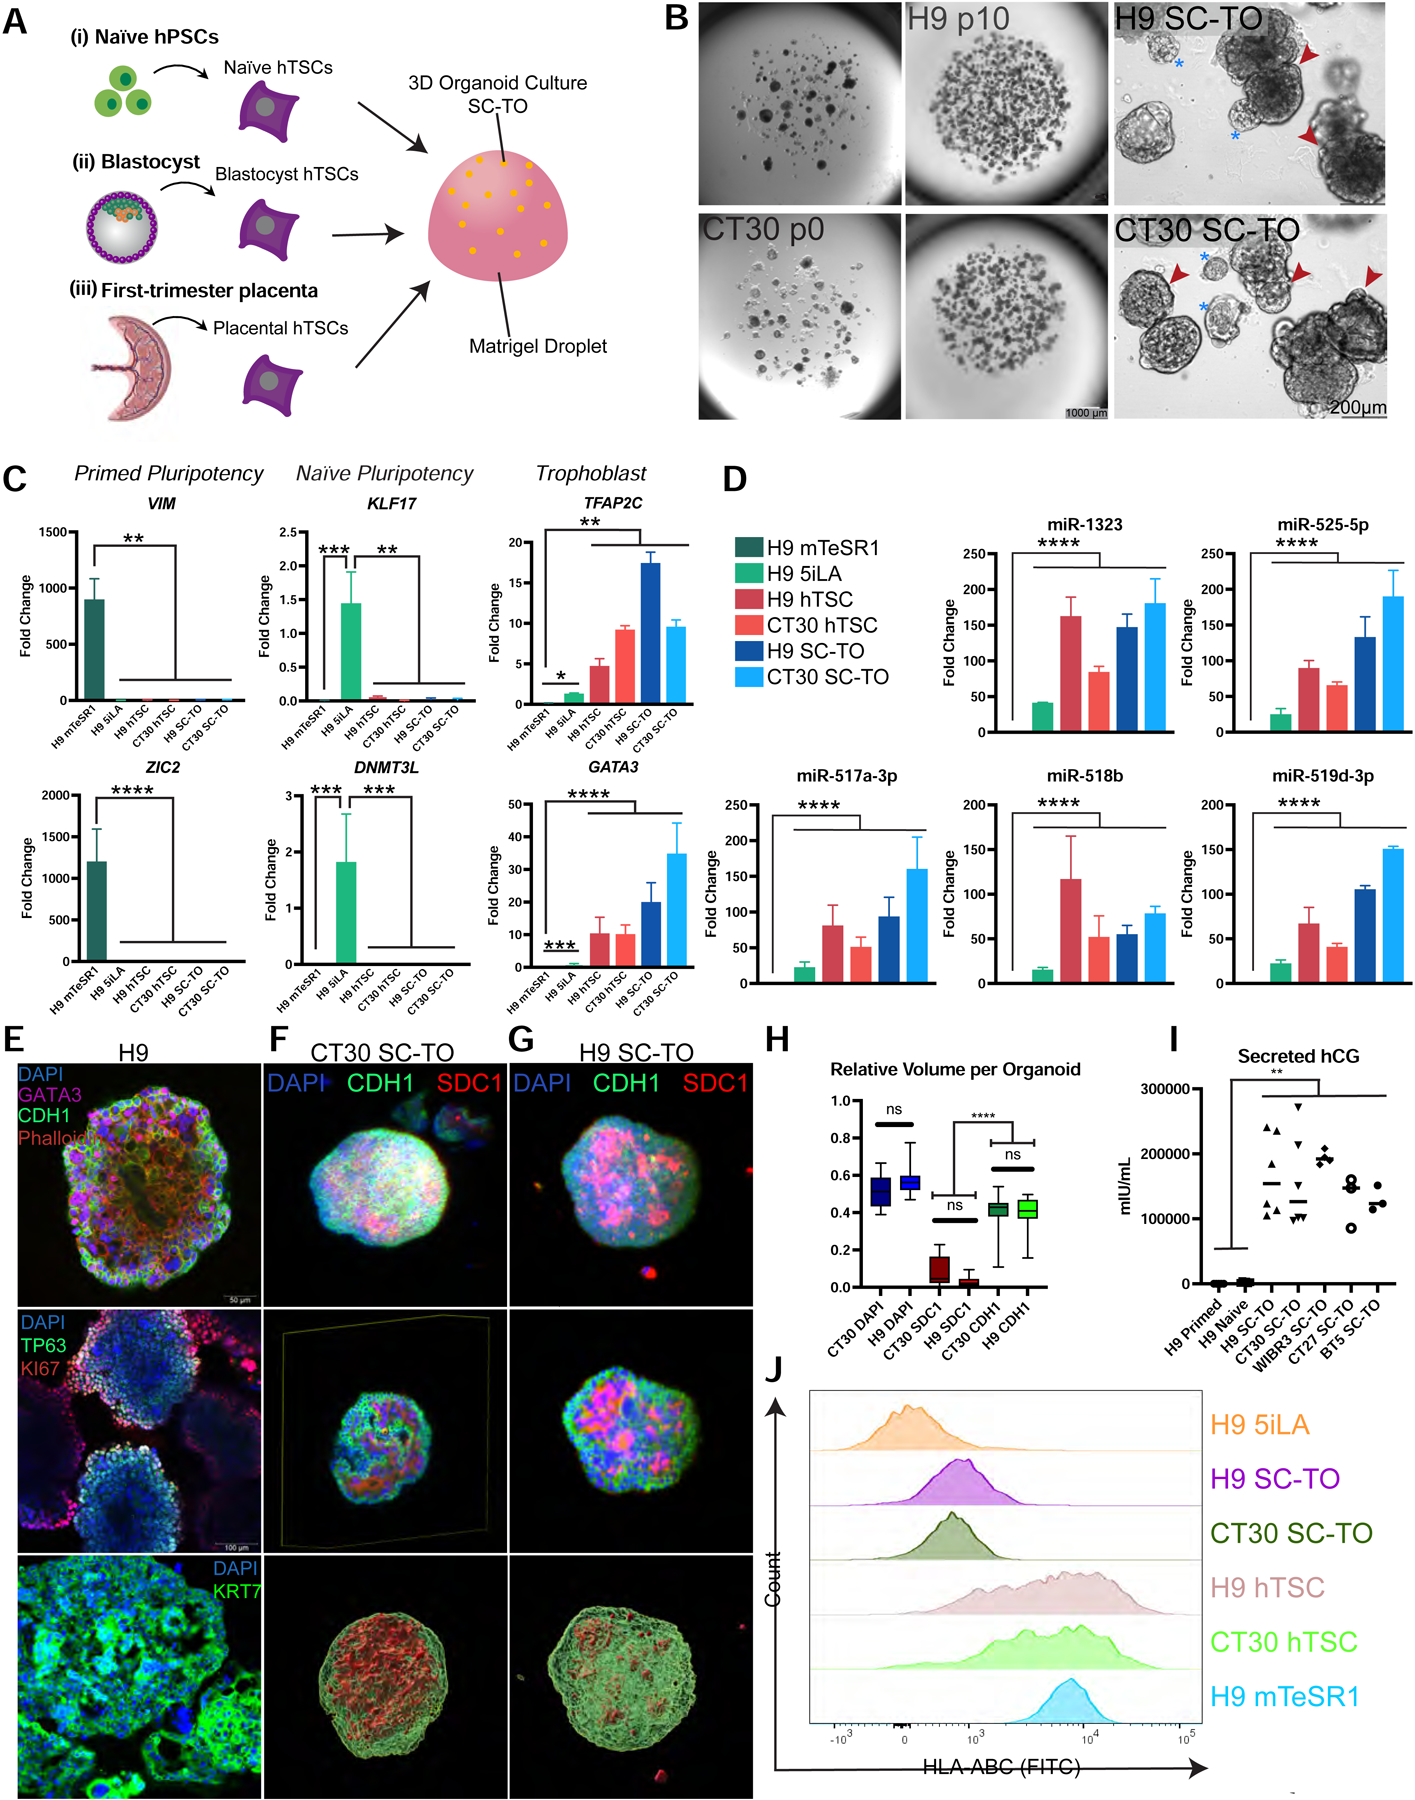
A. Schematic representation of SC-TO derivation. Human trophoblast stem cells (hTSCs) were sourced from naïve human pluripotent stem cells (hPSCs) (Dong et al., 2020), human blastocyst outgrowths, or primary cytrophoblasts (CTBs) of first-trimester placentas (Okae et al., 2018). hTSCs were maintained in hTSC medium and transferred to 3D culture in a Matrigel droplet and maintained in trophoblast organoid medium (TOM) (Turco et al., 2018).
B. Brightfield imaging of H9 and CT30 SC-TOs. Both SC-TO lines were maintained for 10 passages and exhibited a similar overall structure. Organoid morphology consists of opaque, largely CTB, with some interior STB (red arrows) and heavily syncytialized, clear cystic STB (blue asterisks). Stereoscopic images (left, middle columns) scale = 1 mm. Widefield images (right) scale = 200 μm.
C. Quantitative gene expression analysis during derivation of SC-TOs from naïve hPSCs. Primed hPSCs expressed VIM and ZIC2, naïve hPSCs expressed DNMT3L and KLF17, and trophoblast cells in 2D hTSC culture and 3D SC-TOs expressed GATA3 and TFAP2C. Fold change is plotted relative to H9 5i/L/A. Error bars indicate mean ± SD of at least 2 biological replicates. *p value <0.05; **p<0.01; ***p<0.001; ****p<0.0001.
D. Quantitative gene expression analysis for chromosome 19 microRNAs in hTSCs and SC-TOs compared to primed and naïve stem cells. Fold change is plotted relative to H9 mTeSR1. Error bars indicate mean ± SD of at least 2 biological replicates. ****p<0.0001.
E. Immunofluorescence analysis of trophoblast markers in H9 SC-TOs. All images represent single sections of confocal imaging analysis for the following markers: CDH1, GATA3 (top); TP63 and MKI67 (middle); and KRT7 (bottom).
F. Light sheet microscopic images of a representative CT30 SC-TO. Organoids were stained for epithelial CTB marker CDH1 and STB marker SDC1 followed by optical clearing. Bottom image shows 3D volume rendered in Amira software.
G. Light sheet microscopic images of a representative H9 SC-TO. Organoids were stained for epithelial CTB marker CDH1 and STB marker SDC1 followed by optical clearing. Bottom image shows 3D volume rendered in Amira software.
H. Quantification of signals from whole 3D organoids. CT30: n = 19 SC-TOs, H9: n = 14 SC-TOs. The volumes measured were DAPI, SDC1, and CDH1. No significant differences were observed between H9 and CT30 SC-TO for any of the examined proteins.
I. hCG ELISA analysis of secreted hCG levels in cell culture media of primed hPSCs (negative control), naïve hPSCs, and SC-TOs. This experiment was performed on SC-TOs generated from five independent hTSC lines. Paired t test: ** p value < 0.01.
J. Flow cytometry analysis for HLA-ABC (W6/32) in H9 5i/L/A naïve hPSCs (negative control), H9 mTeSR1 primed hPSCs (positive control), H9 hTSCs and SC-TOs, and CT30 hTSCs and SC-TOs.
To obtain a more quantitative measurement of the distribution of key lineage markers, we performed light-sheet imaging on optically cleared SC-TOs. This analysis confirmed their predominant inside-out morphology with an outer shell of CDH1-positive cells encircling an inner syncytial compartment marked by SDC1 (Fig. 1F–G). Quantification of the relative volumes occupied by each marker revealed a 5–10 fold increase in CDH1 compared to SDC1 per organoid, but no significant differences between SC-TOs obtained from naïve and primary hTSCs (Fig. 1H). The secretion of human chorionic gonadotropin (hCG), a key placental hormone, was confirmed using an over-the-counter pregnancy test and by hCG ELISA (Fig. 1I and Fig. S1F). Finally, we performed flow cytometry analysis for classical HLA class I surface antigens, which are weakly expressed in human trophoblast cells but more significantly in amniotic epithelial cells (Hammer et al., 1997). While significant HLA-ABC expression was detected in naïve and primary hTSCs, SC-TOs displayed a reduction in mean signal intensity (Fig. 1J). This suggests that HLA-ABC expression is stimulated by 2D hTSC culture and that SC-TOs more faithfully recapitulate the HLA expression profile of human trophoblast cells in vivo. Taken together, these data demonstrate that all examined hTSC lines harbor the potential for self-organization into 3D SC-TOs with comparable gross morphological structure, placental hormone secretion, and capacity for long-term self-renewal.
Single cell transcriptomes reveal the cellular complexity of 3D organoids generated from naïve and primary hTSCs
We examined the cellular composition of SC-TOs generated from naïve and primary hTSCs by single cell transcriptome analysis. Organoids obtained from naïve hTSCs (H9) and primary hTSCs (CT30) were dissociated into single cells and cDNA libraries were generated for single cell RNA-sequencing (scRNA-seq) using the 10X Genomics platform. Dimensional reduction analysis by Uniform Manifold Approximation and Projection (UMAP) revealed a very similar cellular composition in SC-TOs generated from naïve and primary hTSCs, which was highly reproducible between two replicates (Fig. 2A). Both H9 and CT30 SC-TOs comprised five discrete trophoblast subpopulations: two CTB clusters, two STB clusters, and a small EVT cluster. Pseudotime analysis revealed two distinct developmental trajectories, both of which emerged from CTB-1 (Fig. 2B). One of these trajectories passes from CTB-1 directly into STB-1 and subsequently into STB-2, while the other trajectory proceeds via CTB-2 into EVT. This analysis suggests that trophoblast progenitors within CTB-1 bifurcate into either an EVT or STB trajectory. The CTB clusters were marked by elevated expression of genes such as CDH1, ITGA6, TEAD4, and VGLL1 (Fig. 2C–D); the STB clusters were marked by high expression of CGA, CGB1–8, GCM1, ERVW-1, and SDC1 (Fig. 2C and Fig. 2E); and the EVT cluster exhibited elevated expression of HLAG, ITGA2, and NOTCH1 (Fig. 2C, Fig. 2F, and Table S1). However, the absence of mature EVT markers such as ITGA1 and retention of epithelial surface markers CDH1 and ITGB4 in this cluster (Fig. 2C–D) suggest that these cells have not yet completed differentiation into fully invasive EVTs. We therefore refer to this cluster as primitive EVTs. Differential gene expression analysis between matched clusters in H9 and CT30 organoids revealed few significantly differentially expressed genes (DEGs) (Fig. S2A and Table S2), although the overall proportion of STBs was slightly increased in H9 SC-TOs (Fig. S2B). Hence, SC-TOs generated from naïve and primary hTSCs display a similar cellular composition at the single cell level.
Figure 2: Single cell transcriptome profiles of SC-TOs derived from naïve and primary hTSCs.
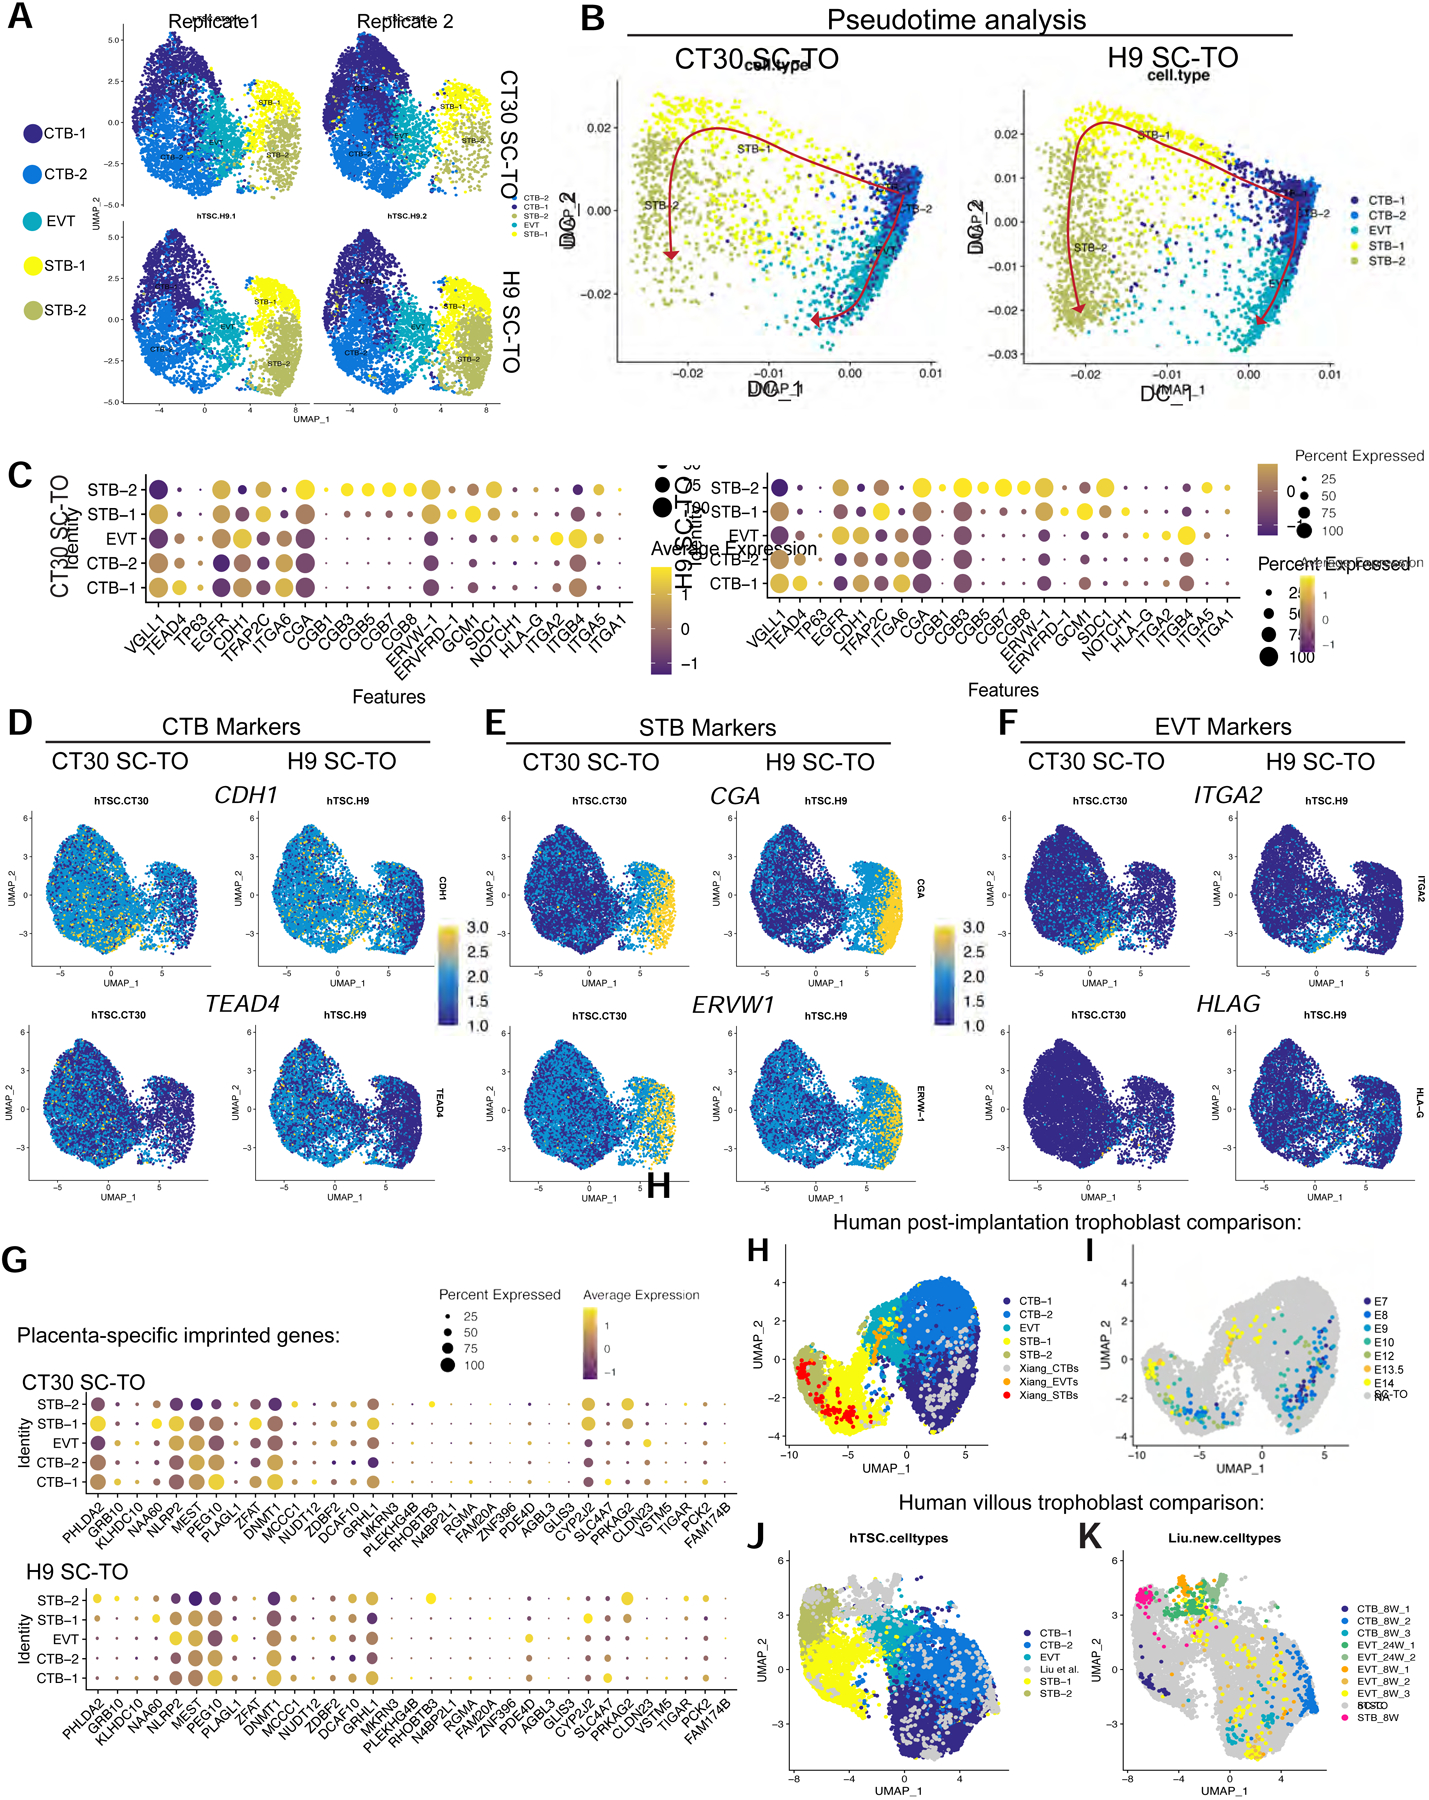
A. Cellular composition of SC-TOs revealed by single cell RNA-sequencing (scRNA-seq). Uniform Manifold Approximation and Projection (UMAP) subclusters include CTB-1 and CTB-2, STB-1 and STB-2, and a small primitive EVT population. These studies were performed on two replicates of SC-TOs generated from two independent genetic backgrounds: H9 naïve hTSCs and CT30 primary hTSCs.
B. In silico analysis of SC-TO differentiation patterns. Pseudotime analyses indicate the relatedness of subclusters between CT30 and H9 SC-TOs, allowing inference of two predominant differentiation trajectories, both of which emerge from CTB-1 (red arrows).
C. Dotplots indicating expression of trophoblast progenitor and lineage markers in five distinct clusters as shown in Fig. 2A. Average gene expression levels and the percentage of cells that express each gene are presented with differential color intensities and circle sizes, respectively.
D. UMAP plots indicating expression of the CTB markers CDH1 and TEAD4 in H9 and CT30 SC-TOs.
E. UMAP plots indicating expression of the STB markers CGA and ERVW-1 in H9 and CT30 SC-TOs.
F. UMAP plots indicating expression of the EVT markers ITGA2 and HLAG in H9 and CT30 SC-TOs.
G. Dotplots indicating expression of placenta-specific imprinted genes in H9 and CT30 SC-TOs. Average gene expression levels and the percentage of cells that express each gene are presented with differential color intensities and circle sizes, respectively.
H. Integration of SC-TO UMAP data with scRNA-seq analysis of human post-implantation stage trophoblasts (Xiang et al., 2020). These data represent combined scRNA-seq data from two independent SC-TO lines (H9 and CT30).
I. Similar to Fig. 2H except that trophoblast subpopulations from Xiang et al. are highlighted and separated by embryonic day (E7–14).
J. Integration of SC-TO UMAP data with scRNA-seq analysis containing trophoblast cells from primary human placental tissues (Liu et al., 2018). SC-TO clusters are highlighted in colors.
K. Similar to Fig. 2J except that primary placental samples from Liu et al. are highlighted in colors.
To further define the identity of these distinct trophoblast subpopulations, we analyzed DEGs between the two CTB subpopulations (CTB-1 vs. CTB-2). Volcano plot analysis indicated that the CTB-1 cluster was enriched in cell cycle-related genes, such as MKI67, CDK1, CCNA2, and CDC20 (Fig. S2C and Table S1). By analyzing genes associated with distinct stages of the cell cycle, we found that CTB-1 was specifically enriched in transcripts related to G2/M phases (Fig. S2D). Gene Ontology (GO) analysis based on DEGs in Table S1 further corroborated that the CTB-1 cluster was enriched in mitotic processes, while CTB-2 displayed a metabolic shift towards oxidative phosphorylation (Fig. S3A). These findings suggest that the CTB-1 cluster represents proliferative CTBs, while CTB-2 contains trophoblast progenitors that have exited the cell cycle and are transitioning towards a more specialized fate. In contrast, GO analysis on the primitive EVT cluster showed upregulation of pathways involved in ECM organization, migration, immune cell interaction, and oxygen sensing, all of which are central processes for EVT function (Fig. S3A). We also analyzed DEGs between the two STB subpopulations (STB-1 vs. STB-2). STB-2 showed the strongest induction of pregnancy-specific glycoprotein (PSG) family genes, genes encoding the alpha and beta subunits of hCG (CGA, CGB3, CGB5, CGB7, and CGB8), and leptin (LEP) (Fig. S2C and Table S1). Furthermore, all cells in this cluster had exited the cell cycle, while a fraction of STB-1 cells still resided in G2/M phases (Fig. S2D). STB-1 was enriched in expression of GCM1, ERVFRD-1, and OVOL1, which have been implicated in regulating the fusion of CTB progenitors into STBs (Anson-Cartwright et al., 2000; Lokossou et al., 2014; Renaud et al., 2015) (Fig. 2C, Fig. S3B, and Table S1). We surmise that STB-1 represents a transitional population of CTBs that are fusing into STBs, which was also suggested by the pseudotime analysis (Fig. 2B), while STB-2 represents more differentiated STBs.
Naïve hPSCs are known to undergo erasure of parent-specific imprinting marks as a consequence of global DNA demethylation (Pastor et al., 2016; Theunissen et al., 2016). However, a recent study reported that hTSCs derived from naïve hPSCs displayed only modest differences in expression of placenta-specific imprinted genes (Cinkornpumin et al., 2020). To corroborate these findings in our organoid model, we compared the expression of imprinted genes at the single cell level in SC-TOs generated from naïve and primary hTSCs (Fig. 2G). Overall, the two SC-TO lines exhibited highly correlated expression of placenta-specific imprinted genes with the notable exceptions of PHLDA2 and ZFAT. Interestingly, failure to activate ZFAT during hTSC derivation from naïve hPSCs was also noted by Pastor and colleagues (Cinkornpumin et al., 2020). We conclude that placenta-specific imprinted genes are largely expressed at appropriate levels during the generation of SC-TOs from naïve hPSCs.
SC-TO subpopulations correspond to trophoblast identities in the human post-implantation embryo
We evaluated the transcriptional correspondence between SC-TOs and discrete stages of human trophoblast development in vivo. The organoid clusters were well-aligned with CTB, EVT, and STB identities in 3D human embryos cultured through implantation stages (Xiang et al., 2020) (Fig. 2H). When segregated by developmental time points, STBs at embryonic days (E)7–12 were more closely aligned with STB-1, while STBs at E13.5–14 instead clustered with the mature STB-2 subpopulation (Fig. 2I). The primitive EVT cluster was aligned with EVTs at E13.5–14, while both CTB clusters correlated with CTBs at E7–12 (Fig. 2I). We also examined whether SC-TOs may correspond transcriptionally to trophoblast identities at later stages of human placental development (Liu et al., 2018). Proliferative CTBs isolated at 8 weeks of human placental development (CTB_8W_3) were aligned with CTB-1, while post-mitotic CTBs (CTB_8W_2) overlapped with CTB-2 (Fig. 2J–K). Liu et al. also identified a subpopulation of fusion-competent CTBs in vivo that expressed some syncytial markers, which they called CTB_8W_1. This subpopulation corresponded to STB-1, which further reaffirms the transitional nature of this cluster. In contrast, mature STBs manually dissected from the 8-week-old placenta clustered with STB-2 (Fig. 2J–K). Finally, EVTs from the 8-week-old placenta were broadly distributed across the EVT and CTB clusters. SC-TO EVTs overlapped marginally with EVT_8W_2 and 3, which comprise a mixture of proliferative and immune-responsive EVTs. In contrast, SC-TO EVTs did not overlap with 24-week EVTs that had completely invaded into the maternal endometrium. We conclude that SC-TOs encompass a variety of trophoblast identities that correspond transcriptionally to the first-trimester placenta. The strongest correlation, however, was observed with trophoblast subpopulations in early post-implantation embryos.
XCI dynamics during trophoblast organoid generation from naïve hPSCs
Like somatic tissues, female extraembryonic tissues must undergo XCI in order to achieve dosage compensation with males. In female mice, the paternal X chromosome is preferentially inactivated in the placenta and yolk sac (Harper et al., 1982; Takagi and Sasaki, 1975; West et al., 1977). Several studies have reported that the human placenta at term is composed of relatively large clonal populations that express either the maternal or paternal X chromosome (Moreira de Mello et al., 2010; Penaherrera et al., 2012; Phung, 2021). However, XCI during human trophoblast development has not been studied thus far. Since naïve hPSCs are known to undergo X chromosome reactivation (XCR) (Sahakyan et al., 2017; Theunissen et al., 2016), we postulated that it should be possible to model placental XCI dynamics during the generation of SC-TOs from naïve hPSCs. Taking advantage of a previously published single nucleotide polymorphism (SNP) array in H9 hESCs (Narva et al., 2010), we first confirmed using bulk RNA-sequencing data that induction of naïve pluripotency in 5i/L/A conditions (Theunissen et al., 2014) resulted in a switch from mono-allelic to bi-allelic expression of X-linked genes (Fig. 3A–B). We then examined the XCI status of SC-TOs generated from these H9 naïve hESCs using our 10X single cell transcriptome data. With the exception of PLCXD1, which is known to escape XCI (Balaton et al., 2015), none of the examined X-linked transcripts showed substantial bi-allelic expression in SC-TOs (Fig. S4A). This confirms that XCI indeed takes place during trophoblast differentiation of naïve hESCs. Some of the examined transcripts showed a random XCI pattern with heterogeneous expression of the reference and alternative alleles in all SC-TO subpopulations, including CTB-1 (Fig. 3C–E). This suggests that allele-specific expression of X-linked genes is already established within CTB progenitors and subsequently maintained upon EVT or STB differentiation. In contrast, other transcripts showed a more skewed XCI pattern with predominant expression of a single allele (Fig. S4A).
Figure 3: X chromosome inactivation (XCI) dynamics during trophoblast organoid derivation from naïve hPSCs.
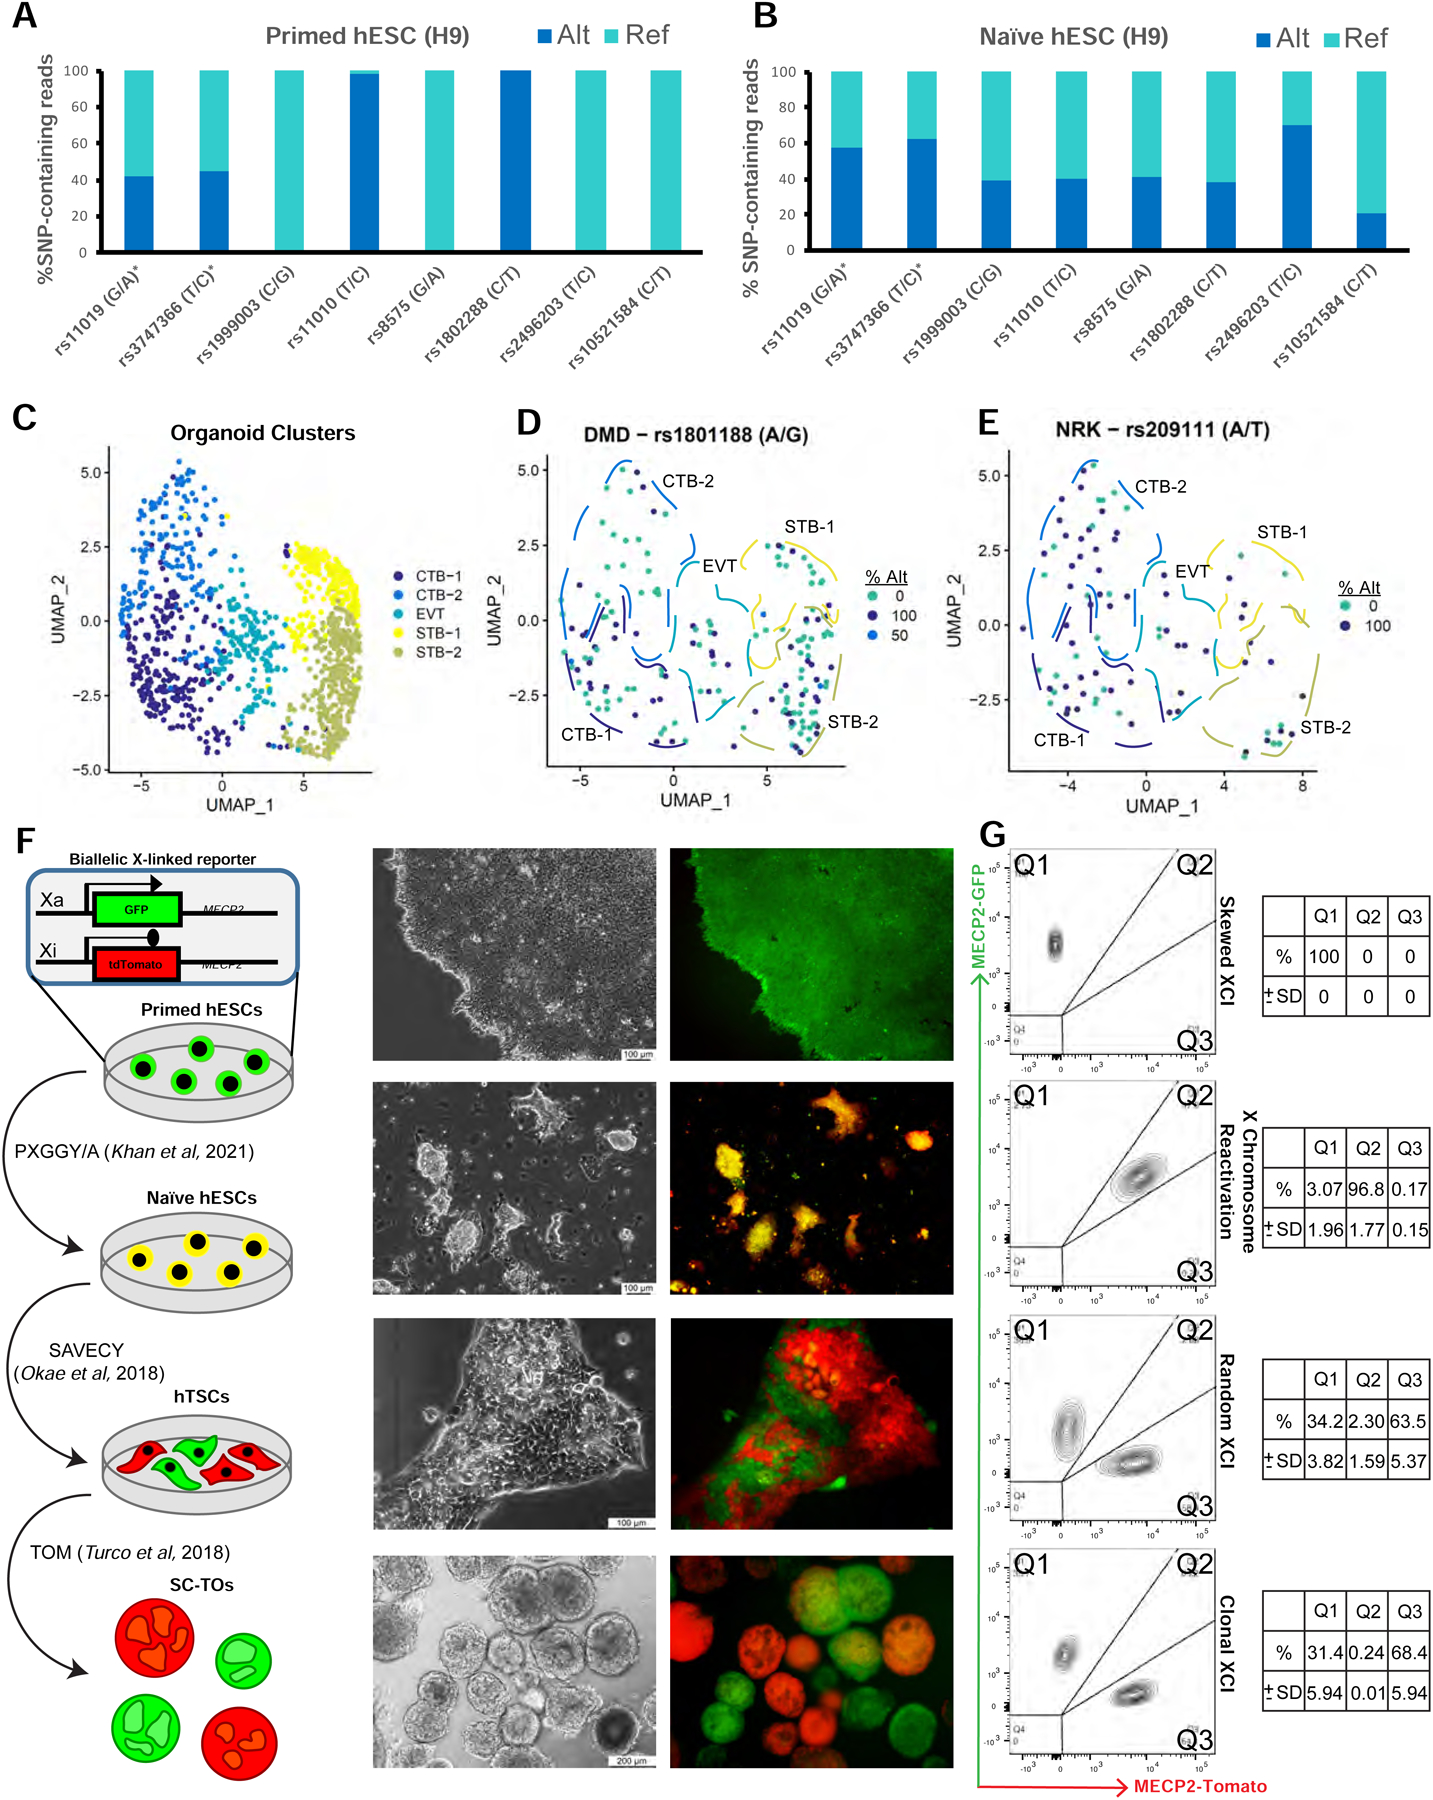
A-B. Allele-specific gene expression analysis using SNPs located within transcribed regions of X-linked genes in primed H9 hESCs in mTeSR1 (A) and naïve hESCs that were derived in 5i/L/A (B). Allelic frequencies were analyzed for those SNPs covered by at least 10 reads in naïve hESCs. Asterisks mark genes reported to escape X inactivation (Balaton et al., 2015).
C. UMAP plot denotes the identities of H9 SC-TO clusters in 10X single cell transcriptome data, which were used to calculate allelic frequencies of X-linked genes in Fig. 3D–E and Fig. S3A.
D. UMAP plot indicating allele-specific expression of DMD in SC-TOs derived from H9 naïve hESCs. Cells expressing the reference allele are indicated in teal, cells expressing the alternative allele are indicated in navy, and the few cells expressing both alleles are indicated in blue.
E. UMAP plot indicating allele-specific expression of NRK in SC-TOs derived from H9 naïve hESCs. Cells expressing the reference allele are indicated in teal and cells expressing the alternative allele are indicated in navy.
F. Schematic (left) and representative phase and fluorescence images (right) of XCI dynamics during SC-TO derivation from naïve hESCs, as revealed using WIBR3 hESCs carrying a dual fluorescent reporter in both alleles of the X-linked MECP2 locus. PXGGY/A: alternative naïve hPSC induction medium (Khan et al., 2021); SAVECY: hTSC medium (Okae et al., 2018); TOM: trophoblast organoid medium (Turco et al., 2018).
G. Flow cytometry analysis for MECP2-GFP and MECP2-tdTomato on samples shown in Fig. 3F. FACS plots are representative of 2 independent biological replicates. Tables (right) indicate mean percentage of cells within each quarter and standard deviation.
See also Figure S4.
To track XCI dynamics during SC-TO derivation from naïve hESCs, we used a bi-allelic reporter hESC line in which both alleles of the X-linked MECP2 gene are labeled with different fluorophores (An et al., 2020; Theunissen et al., 2016). This line is GFP-positive in primed cells and becomes double positive for GFP and tdTomato upon naïve reversion, indicating XCR. We noticed that a subpopulation of non-reactivated cells remained present upon naïve reversion in 5i/L/A (Fig. S4B–C), which is consistent with a prior report (An et al., 2020). However, the fraction of double positive cells was enhanced using a recently developed alternative naïve induction cocktail, PXGGY/A (Khan et al., 2021) (Fig. S4B–C). hTSCs derived from this homogeneous population of WIBR3 MECP2GFP/tdTomato naïve hESCs displayed almost complete loss of bi-allelic expression and emergence of discrete GFP-positive and tdTomato-positive cells (Fig. 3F–G). Hence, XCI at the MECP2 locus occurs at an early stage during trophoblast lineage induction in naïve hESCs in vitro, in agreement with recent observations in non-human primate embryos (Okamoto et al., 2021). Individual organoids derived from this mixed population of MECP2GFP and MECP2tdTomato hTSCs exhibited exclusive expression of either fluorophore, although a few double positive organoids were present (Fig. 3F–G and Fig. S4D). These findings demonstrate that, once established in hTSCs, the allele-specific expression of MECP2 is maintained at the single organoid level. These clonal XCI dynamics are reminiscent of the patchy XCI pattern seen in the human placenta, which is believed to reflect the generation of villous trees from single trophoblast precursors (Moreira de Mello et al., 2010; Penaherrera et al., 2012; Phung, 2021).
Differentiation of SC-TOs into invasive 3D EVT organoids
The above results indicate that culture of naïve or primary hTSCs under standard TOM conditions (Turco et al., 2018) yields organoids that largely contain CTBs with a syncytial core and only a small subset of primitive EVTs. Utilizing a previously reported methodology for differentiating primary trophoblast-derived organoids towards the EVT lineage (Sheridan et al., 2020), we were able to differentiate SC-TOs into specialized EVT organoids that exhibited a lack of cystic STB morphology and a prevalence of migratory cells (Fig. 4A–B, red arrows). These stem cell-derived EVT organoids (SC-EVTOs) displayed elevated secretion of MMP2 compared to SC-TOs (Fig. 4C). We compared gene expression in SC-TOs and SC-EVTOs generated from naïve and primary hTSC by qRT-PCR. SC-EVTOs displayed reduced expression of the CTB markers ELF5 and TEAD4 and the STB marker ERVW1, but increased expression of EVT markers HLAG, MMP2, and FN1 (Fig. 4D). They also widely expressed HLAG and MMP2, markers of EVT differentiation and invasion, at the protein level (Fig. 4E). Overall, these results demonstrate that SC-TOs can undergo differentiation into specialized 3D EVT organoids.
Figure 4: Differentiation of SC-TOs into specialized 3D EVT organoids (SC-EVTOs).
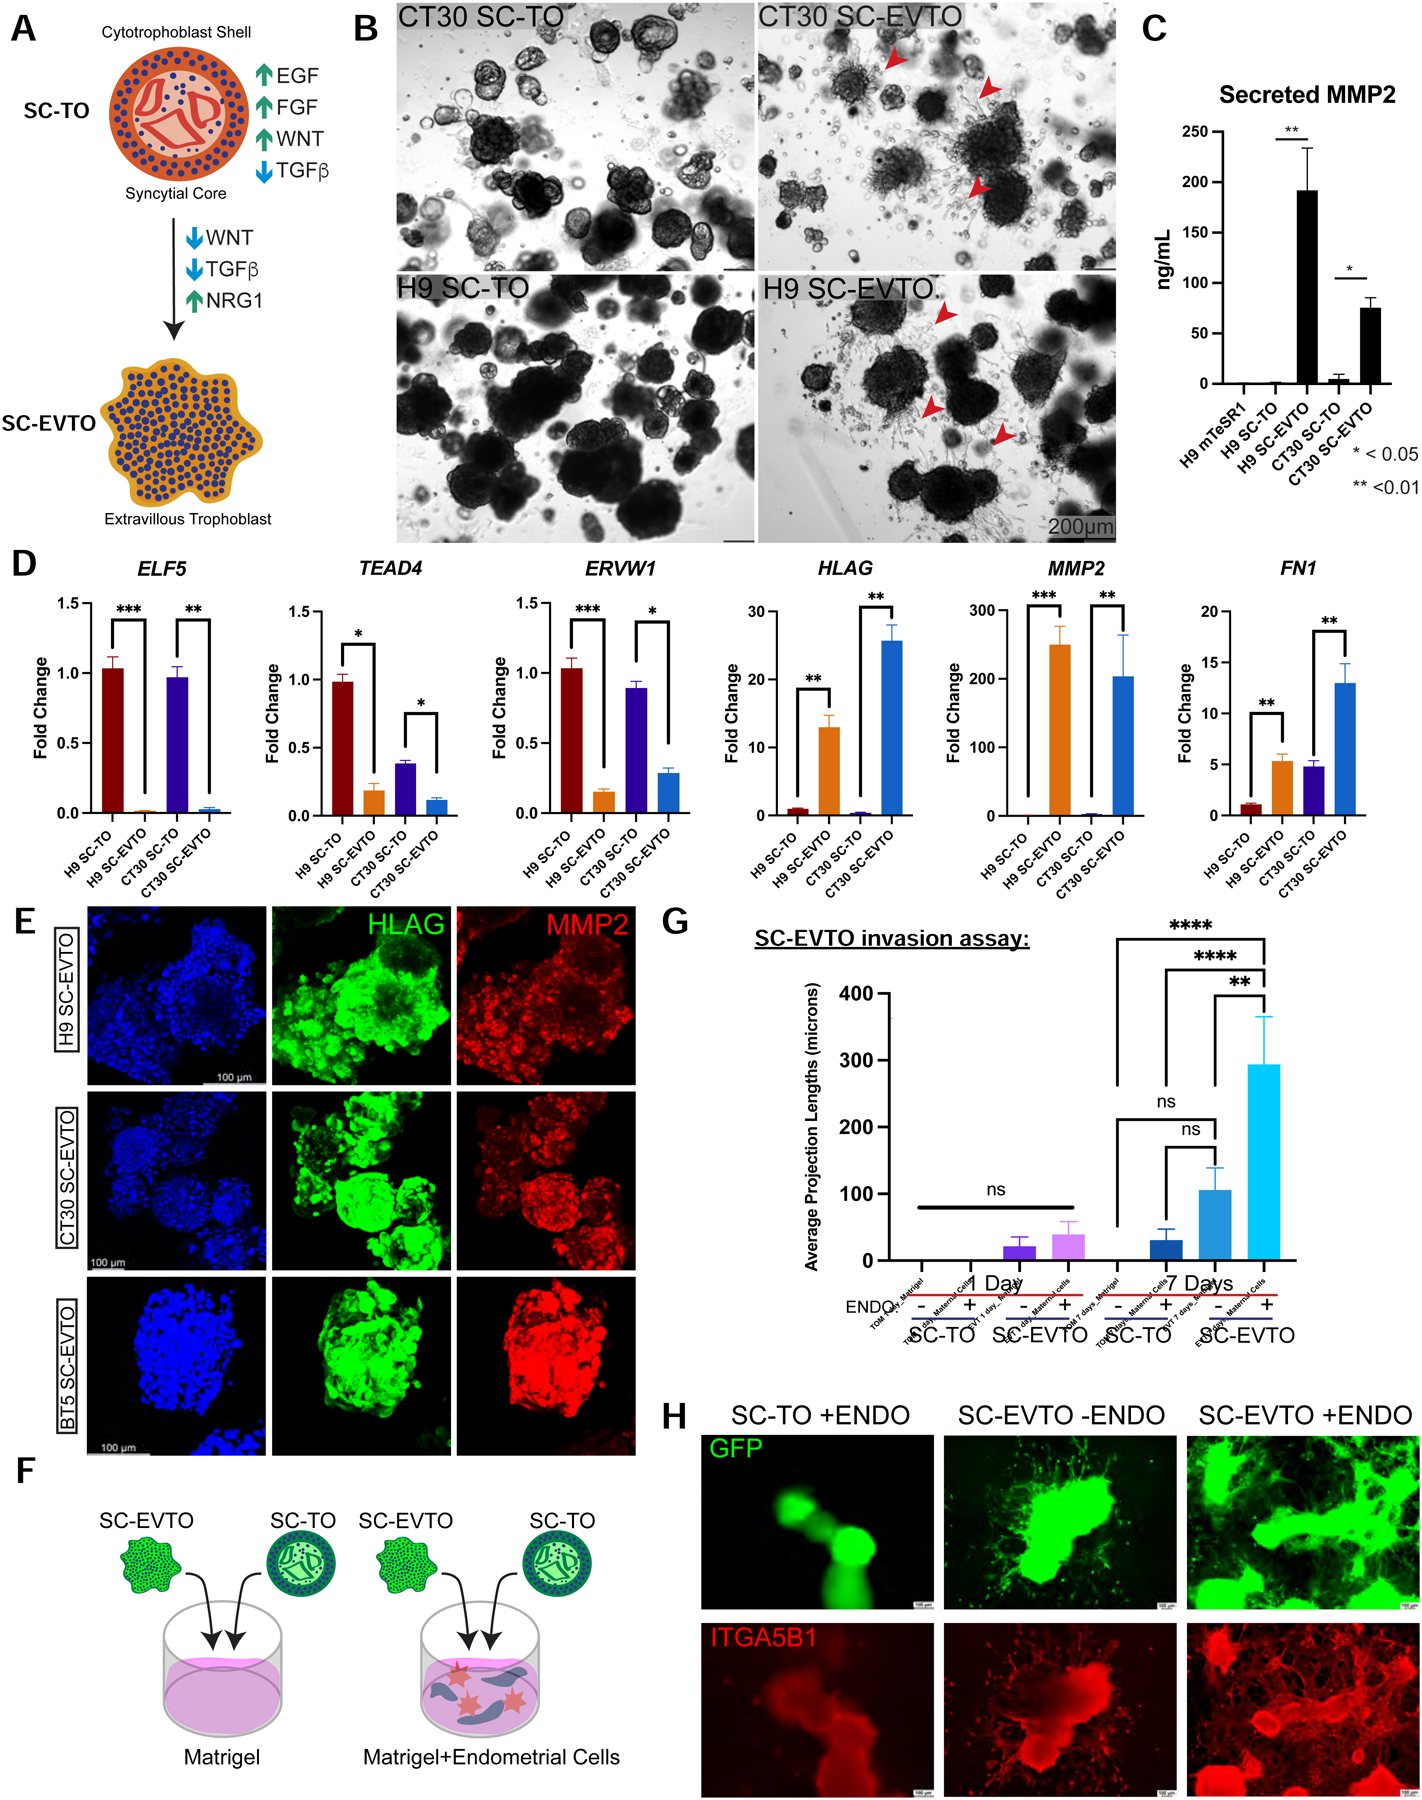
A. Schematic representation of signaling requirements to maintain SC-TOs or induce differentiation towards specialized 3D SC-EVTOs.
B. Phase contrast view of SC-TOs maintained in trophoblast organoid medium (TOM) (Turco et al., 2018), which promotes a smooth and spherical structure. Both CT30 and H9 SC-TOs differentiated into 3D SC-EVTOs exhibit migratory EVTs, as indicated by red arrows. The scale bar depicts 200 μm.
C. ELISA analysis of secreted MMP2 from SC-TO lines exposed to EVT-promoting media. These studies represent two biological replicate experiments (H9 and CT30 SC-TOs). Error bars indicate mean ± 1 SE of three technical replicates. *p-value<0.05; **p-value<0.01.
D. Quantitative gene expression analysis of general trophoblast markers ELF5 and TEAD4, the STB differentiation marker ERVW1, and EVT differentiation markers HLAG, MMP2, and FN1 upon differentiation of H9 and CT30 SC-TOs into SC-EVTOs. Fold change is plotted relative to H9 SC-TO. Error bars indicate mean ± 1 SD of 2–3 biological replicates.
E. Maximal projection images of SC-EVTOs demonstrate overlapping HLAG and MMP2 expression. These data represent differentiation experiments performed with three independent SC-TO lines (H9, CT30, and BT5).
F. Schematic of the SC-TO/SC-EVTO invasion assay to test interactions with immortalized human endometrial fibroblasts and glandular epithelial cells embedded in a 3D Matrigel matrix. H9 SC-TOs were lentivirally labeled with a constitutive GFP vector to enable quantification of invasive projections.
G. Quantification of SC-TO/SC-EVTO invasive projections between days 1 and 7 of co-culture with or without human endometrial cells.
H. Representative images of SC-TO/SC-EVTO invasion assay in the presence (+ENDO) or absence (−ENDO) of human endometrial cells. The most pronounced invasive projections were observed using SC-EVTOs in the presence of endometrial cells. GFP constitutively marks SC-TOs/SC-EVTOs. ITGA5B1 staining indicates invasive EVTs. Scale bar = 100μm.
See also Supplemental Movies 1 and 2 and Table S3.
A key characteristic of early placentation is invasion of EVTs into the maternal decidua. Thus, we assayed the invasive potential of SC-TOs and SC-EVTOs in 3D Matrigel scaffolds in the presence or absence of human endometrial cells (Fig. 4F). For this purpose, Matrigel was combined with immortalized endometrial glandular cells (Kyo et al., 2003) and stromal fibroblasts (Krikun et al., 2004). To facilitate quantification of organoid projections, isogenic SC-TOs and SC-EVTOs were labeled with a constitutively active lentiviral GFP vector. SC-TOs plated on Matrigel displayed few invasive projections over a seven-day period. In contrast, a substantial number of invasive projections emerged from SC-EVTOs in the presence of maternal endometrial cells (Fig. 4G and Supplementary Movies 1 and 2). While SC-EVTOs in Matrigel alone formed some projections, significant projection length was only reached upon contact with maternal endometrial cells. This suggests that endometrial paracrine factors or extracellular matrix scaffolds formed by endometrial fibroblasts promote EVT invasion and maturity. These projections were positive for both the GFP reporter and the migratory EVT marker ITGA5B1 (Fig. 4H). We conclude that SC-EVTOs, but not SC-TOs, have substantial invasive potential in the presence of maternal endometrial cells. The absence of invasive potential in SC-TOs may be attributed to the retention of epithelial gene expression signatures in the small primitive EVT population, as revealed by our single cell transcriptome analysis (Fig. 2A and Fig. 2C).
3D trophoblast organoids display selective vulnerability to emerging viral pathogens
In addition to nurturing the developing fetus, the placenta serves as an important defense against infections. Of recent interest, the emerging viral pathogens SARS-COV-2 and ZIKV have been associated with adverse pregnancy outcomes, including preterm birth, still birth, and fetal/neonatal defects (Brasil et al., 2016; Di Mascio et al., 2020). Thus, we investigated whether SC-TOs can be used to study the permissiveness of early placental cells to these emerging pathogens. First, we determined whether the SC-TOs express viral entry receptors for SARS-CoV-2 and ZIKV. The scRNA-seq data revealed limited co-expression of the SARS-CoV-2 viral entry receptors ACE2 and TMPRSS2 in the STB-2 cluster, which marks the mature STB subpopulation (Fig. 5A). In contrast, the ZIKV entry receptor TYRO3 was more widely expressed across the different clusters (Fig. 5B).
Figure 5: Modeling placental vulnerability to SARS-CoV-2 and ZIKV infection in SC-TOs.
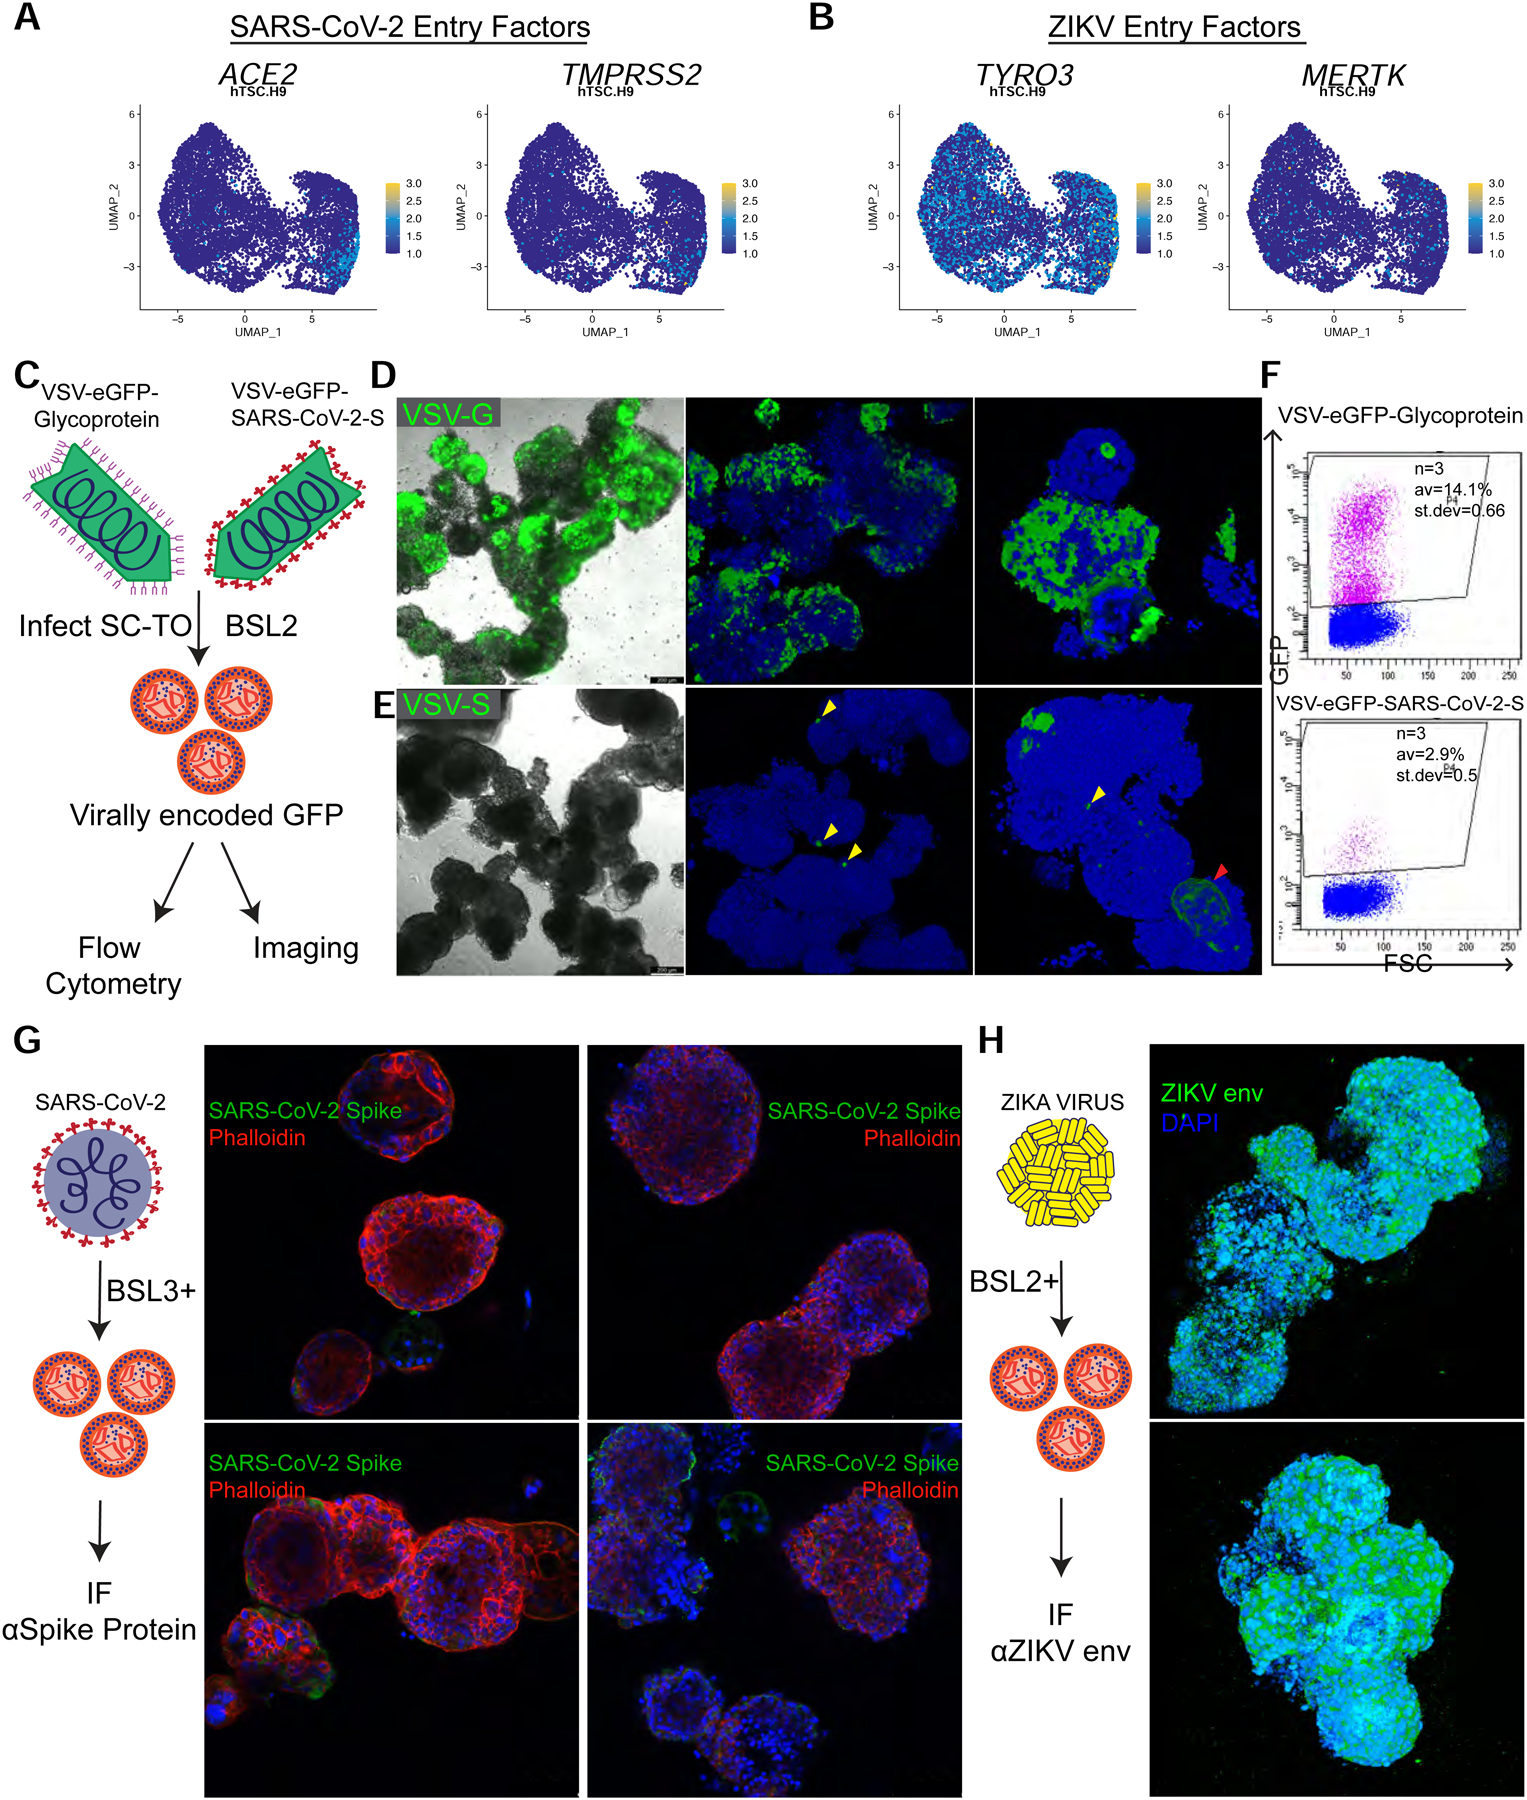
A. UMAP plots indicating expression of the SARS-CoV-2 entry factors ACE2 and TMPRSS2. These data represent combined scRNA-seq data from two H9 SC-TO replicates.
B. UMAP plots indicating expression of the ZIKV entry factors TYRO3 and MERTK. These data represent combined scRNA-seq data from two H9 SC-TO replicates.
C. Schematic of VSV-eGFP-Glycoprotein (VSV-G) and VSV-eGFP-SARS-CoV-2-Spike (VSV-S) infections of SC-TOs. The presence of virally encoded GFP was assayed by flow cytometry and fluorescent microscopy.
D. Infection of H9 SC-TOs with VSV-G showed widespread infection. These data are representative of two biological replicates. The scale bar depicts 200 μm.
E. VSV-S infection of SC-TOs demonstrated more limited infection compare to VSV-G. Yellow arrows indicate the sparse CTBs infected while the red arrow identifies the GFP-positive multinucleated STB. These data are representative of two biological replicates. The scale bar depicts 200 μm.
F. Flow cytometry analysis for virally encoded GFP in dissociated H9 SC-TOs following infection with VSV-S or VSV-G.
G. SC-TOs were infected with a clinical isolate of live SARS-CoV-2 (MOI = 3). Single plane confocal IF imaging for the SARS-CoV-2 Spike protein revealed no significant difference between infected vs. uninfected SC-TOs. Furthermore, morphological signs of infection were absent. These experiments were performed on two independent SC-TO lines (H9 and CT30). The scale bar depicts 100 μm.
H. H9 SC-TOs were infected with the Brazilian strain of ZIKV and assessed by IF for the capsid envelope protein. 3D view of SC-TO (top) or SC-EVTO (bottom) showed widespread infection among all organoid cell types. The scale bar depicts 200 μm.
See also Figure S5.
We infected H9 and CT30 SC-TOs with a SARS-CoV-2 pseudovirus comprising a replication-competent vesicular stomatitis virus (VSV) with the SARS-CoV-2 spike (S) protein, (VSV-S) (Case et al., 2020), which permits examination of SARS-CoV-2 entry, neutralization, and inhibition under reduced biosafety containment (Fig. 5C). The control VSV-eGFP-Glycoprotein (VSV-G) virus efficiently infected many cells within SC-TOs as revealed by fluorescent microscopy and flow cytometry (Fig. 5D–F and Fig. S5A). In contrast, VSV-S infection was only detected in a few CTBs (Fig. 5E, yellow arrows) and a fraction of multinucleated STB-like cells (Fig. 5E and Fig. S5B, red arrows). We also infected CT30 and H9 SC-TOs with a clinical isolate of SARS-CoV-2 under BSL3 conditions (Fig. 5G). IF analysis using an antibody specific to the SARS-CoV-2 Spike protein 24h after infection revealed little signal compared to uninfected controls (Fig. 5G). In marked contrast, the Brazilian strain of ZIKV (Miner et al., 2016) readily infected all cell types within SC-TOs (Fig. 5H), which is consistent with widespread expression of the ZIKV entry receptor, TYRO3 (Fig. 5B). Collectively, these experiments indicate that SC-TOs display selective vulnerability towards SARS-CoV-2 and ZIKV.
We considered the possibility that the inside-out architecture of 3D trophoblast organoids might limit viral access to the interior ACE2-expressing STB population and therefore replicated our findings in 2D hTSCs and their derivatives. We first infected naïve and primary hTSCs with VSV-G/S and obtained similar results as in SC-TOs: whereas hTSCs were highly susceptible to VSV-G infection, almost no infection was seen by VSV-S (Fig. S5C). We also performed VSV-G/S infections on STBs generated from 2D hTSCs in the presence of EGF, Forskolin, and ROCK inhibitor (Okae et al., 2018). While some of these 2D STBs were infected by VSV-S, more robust infection was seen by VSV-G (Fig. S5D–G). We conclude that mature STBs may be susceptible to infection by SARS-CoV-2, in accordance with their ACE2 expression profile (Fig. 5A), but early human trophoblast cells are more readily infected by VSV-G and ZIKV.
DISCUSSION
The placenta has historically been considered the least understood human organ given the practical and ethical restrictions on studying its development in utero and the fact that animal models poorly recapitulate human placental physiology (Carter, 2007; Guttmacher et al., 2014). In recent years two approaches have emerged to study trophoblast development in vitro: the isolation of 2D hTSCs from human blastocysts, first-trimester placental tissues, naïve hPSCs, or somatic cells (Castel et al., 2020; Cinkornpumin et al., 2020; Dong et al., 2020; Guo et al., 2021; Io et al., 2021; Liu et al., 2020; Okae et al., 2018) and the derivation of 3D trophoblast organoids from first-trimester placental tissues (Haider et al., 2018; Turco et al., 2018). Here, we have shown that these two approaches can be combined to enable the isolation of self-renewing trophoblast organoids from naïve and primary hTSCs. These stem cell-derived trophoblast organoids (SC-TOs) display comparable tissue architecture, placental hormone secretion, and capacity for long-term self-renewal as primary trophoblast organoids. By performing in-depth single cell transcriptome profiling, we have demonstrated that SC-TOs encompass a variety of trophoblast identities that closely correspond to CTB progenitor and differentiated cell states found in human post-implantation embryos. Furthermore, we have characterized XCI dynamics during the establishment of SC-TOs from naïve hPSCs and demonstrated that SC-TOs can undergo lineage-specific differentiation into invasive 3D EVT organoids.
The single cell transcriptomes of trophoblast organoids generated from naïve and primary hTSCs were remarkably similar, comprising five distinct trophoblast clusters in broadly comparable proportions. Given the divergent sources of these hTSC lines, this is an unexpected result: whereas primary hTSCs were isolated from first-trimester placental tissues (Okae et al., 2018), naïve hTSCs were obtained by reverting primed hESCs to naïve pluripotency and thereafter applying hTSC media (Dong et al., 2020). The relative scarcity of DEGs between the two SC-TO lines suggests that trophoblast organoid culture represents a powerful attractor state in which the influence of subtle epigenetic differences between naïve and primary hTSCs is mitigated. Furthermore, SC-TOs generated from naïve and primary hTSCs displayed comparable expression of most placenta-specific imprinted genes, despite the globally reduced levels of DNA methylation in naïve hPSCs (Pastor et al., 2016; Theunissen et al., 2016) and hTSCs (Cinkornpumin et al., 2020; Okae et al., 2018). An important question for future research will be to determine whether these imprints are established through non-canonical epigenetic mechanisms, as was recently observed in mouse placental tissues (Andergassen et al., 2021).
Alignment with human trophoblast cell types in vivo indicated that SC-TOs contain a proliferative progenitor pool, CTB-1, which corresponds to CTBs found in the human post-implantation embryo (Xiang et al., 2020). These proliferative CTBs maintain a stable transcriptome until at least 8 weeks of placental development (Liu et al., 2018). Our pseudotime analysis indicates that trophoblast progenitors within CTB-1 bifurcate into either an EVT or STB trajectory. A second CTB cluster was observed that has exited the cell cycle and corresponds to non-proliferative CTBs and immature EVTs in vivo. This cluster likely represents a transitional population of CTBs undergoing differentiation towards the EVT lineage. While SC-TOs only contain a small subpopulation of primitive EVTs, the fraction of HLA-G and MMP2-expressing cells can be expanded by applying culture conditions that promote 3D EVT differentiation. SC-TOs also harbor two discrete clusters of STBs: a transitional cluster that resembles fusion-competent CTBs and a separate cluster of mature STBs that have exited the cell cycle and show upregulation of PSG and CGB family genes. Hence, SC-TOs reflect the cellular diversity of trophoblast identities found in the human post-implantation embryo, encompassing progenitor, transitional, and differentiated cell states.
Studies of human placental tissues at term have revealed the presence of large clonal patches in which either the maternal of paternal X chromosome is silenced (Moreira de Mello et al., 2010; Penaherrera et al., 2012; Phung, 2021). This patchy XCI pattern is thought to result from random XCI at an early stage of human trophoblast development, followed by the clonal expansion of single CTBs into villous trees. By using a double color fluorescent reporter integrated into the X-linked MECP2 locus, we have shown that naive hESCs give rise to discrete populations of GFP-positive and tdTomato-positive hTSCs. The subsequent generation of SC-TOs resulted in emergence of organoids that express a single fluorescent reporter allele, recapitulating clonal XCI patterns observed during human placental development. A recent study in non-human primate embryos reported that trophectoderm-derived extraembryonic cells undergo XCI soon after implantation, while XCI is more protracted in the embryonic lineages (Okamoto et al., 2021). We propose that the derivation of hTSCs from naïve hPSCs presents an experimentally tractable system in which to study the molecular events leading to XCI in the human trophoblast lineage. However, the extent to which XCI during trophoblast differentiation is truly random or skewed will require further investigation and may be influenced by the ability of specific naïve culture conditions to induce complete XCR.
In light of evidence of increased rates of pregnancy complications in women who contracted SARS-CoV-2 (the virus that causes COVID-19) (Di Mascio et al., 2020) or ZIKV (Brasil et al., 2016), we examined whether early trophoblast cell types found within SC-TOs could recapitulate viral infectivity and be useful as models to study infection dynamics. Consistent with isolated expression of the entry factors ACE2 and TMPRSS2, a SARS-CoV-2 pseudovirus only infected a subset of STB-like cells. Furthermore, infection of SC-TOs with a clinical isolate of SARS-CoV-2 did not result in robust expression of the SARS-CoV-2 spike protein. These observations suggest that the SARS-CoV-2 virus may be capable of entering a fraction of STBs that express the appropriate receptors but cannot replicate efficiently once inside these cells. These findings contrast with the high rate of infection by ZIKV, which confirms prior reports that human first-trimester trophoblast cells are permissive to ZIKV infection and replication (Aagaard et al., 2017; Sheridan et al., 2017). Consequently, the first-trimester placenta may present a barrier to vertical transmission of SARS-CoV-2. The STB layer is shed and readily replaced during the first trimester (Burton and Jones, 2009) and this turnover of susceptible cell types could provide additional protection from infection. In accordance with this interpretation, few consistent histopathological changes were observed in placentas from SARS-CoV-2-positive women (He et al., 2020; Hecht et al., 2020; Verma et al., 2021). These findings underscore that the placental barrier is functioning and possibly eliminating the virus prior to extensive damage to the placenta and fetus. We hypothesize that the adverse pregnancy outcomes noted in women infected with SARS-CoV-2 could be a result of dysregulation of renin angiotensin system (Verma et al., 2021) or immune responses (Foo et al., 2021; Juttukonda et al., 2022). Another possibility is that comorbidities, such as vascular endothelial disruption caused by severe preeclampsia or obesity, may predispose the placenta to infection by SARS-CoV-2 (Rosenbloom et al., 2021; Verma et al., 2021). This hypothesis could be investigated by generating SC-TOs from preeclamptic patients or by replicating the high inflammatory environment seen in preeclampsia and re-examining the response to viral infection.
In summary, we have shown that self-renewing 3D trophoblast organoids can be isolated from naïve and primary hTSCs, which provides a methodology to model the impact of disease-associated mutations in a 3D microenvironment that reflects the cellular diversity of the first-trimester placenta. While this work was in preparation, Turco and colleagues published an independent comparison of trophoblast organoids and hTSCs (Sheridan et al., 2021). In agreement with our data, they also observed reduced expression of classical HLA molecules in trophoblast organoids. Our work extends these findings by generating trophoblast organoids from naïve hPSCs and profiling their single cell transcriptome, XCI status, and susceptibility to viral pathogens. The ability to genetically manipulate naïve hPSCs prior to differentiation into SC-TOs enables functional interrogation of regulatory factors implicated in placental organogenesis. Pertinent questions for future investigation will be to examine whether the long-term culture or in vivo transplantation of SC-TOs promotes maturation to later gestational stages, as has been described for other types of organoids (Subramanian et al., 2019), and to model placental vulnerability to other pathogens implicated in adverse pregnancy outcomes, such as cytomegalovirus and novel variants of SARS-CoV-2.
LIMITATIONS OF STUDY
We have identified several limitations in our study. First, the SC-TOs generated from naïve and primary hTSCs display an inside-out villous architecture with an outer CTB layer and an inner syncytial compartment, which is similar to previously described primary TOs (Haider et al., 2018; Turco et al., 2018). Achieving an organoid culture system that recapitulates the specific architecture of the human placenta with a peripheral STB layer would provide a more faithful model of human placental development and the response to viral infections. A second limitation is that SC-TOs were profiled by single cell transcriptomics at 10 days of culture and prolonged organoid culture may be accompanied by changes in the relative proportions of trophoblast subpopulations. Third, the SARS-CoV-2 pseudovirus used in this study contains the spike sequence from SARS-CoV-2 isolate Wuhan-Hu-1, which was first isolated December 2019 (Wu et al., 2020). Therefore, we cannot exclude the possibility that novel SARS-CoV-2 variants may have enhanced ability to infect early human trophoblast cells.
STAR Methods
RESOURCE AVAILABILITY
Lead contact:
Requests for further information should be directed to and will be fulfilled by the Lead Contact, Thorold Theunissen (t.theunissen@wustl.edu).
Materials availability
Requests for resources and reagents should be directed to and will be fulfilled by the Lead Contact, Thorold Theunissen (t.theunissen@wustl.edu).
Data and Code Availability
Single-cell RNA-seq data have been deposited at GEO and are publicly available as of the date of publication. Accession numbers are listed in the key resources table.
This paper does not report original code
Any additional information required to reanalyze the data reported in this paper is available from the lead contact upon request.
KEY RESOURCES TABLE
| REAGENT | SOURCE | IDENTIFIER |
|---|---|---|
| Antibodies | ||
| anti-KRT7 | Dako/Agilent | M7018 (RRID: AB_2134589) |
| anti-TP63 | Abcam | ab124762 (RRID: AB_10971840) |
| anti-SDC1 | Abcam | ab34164 (RRID: AB_778207) |
| anti-E-Cadherin (rabbit) | Cell Signaling | 3195S (RRID: AB_2291471) |
| anti-E-Cadherin (mouse) | Cell Signaling | 14472S (RRID: AB_2728770) |
| anti-hCG beta | Abcam | ab53087 (RRID: AB_870731) |
| anti-MMP2 | Cell Signaling | 40994S (RRID: AB_2799191) |
| anti-hCG alpha | R&D | MAB4169 (RRID: AB_2079126) |
| anti-HLAG | Santa Cruz | sc-21799 (RRID: AB_627938) |
| Pan HLA-A,B,C (W6/32-488) | Biolegend | 311413 (RRID: AB_493133) |
| anti-ZIKV capsid | GeneTex | GTX133317 (RRID: AB_2756861) |
| anti-Ki67 | Cell Signaling | 9449S (RRID: AB_2797703) |
| anti-SARS-CoV-2 Spike protein | Gift from Dr. Ellebedy, Washington University in St. Louis | Clone number 1C02 |
| anti-ITGA5B1 (rabbit) | Abcam | ab275977 |
| Secondary ab-Donkey anti-mouse 488 | Thermo Fisher Scientific | A21202 (RRID: AB_141607) |
| Secondary ab-Donkey anti-rabbit 488 | Thermo Fisher Scientific | A21206 (RRID: AB_2535792) |
| Secondary ab-Donkey anti-mouse 555 | Thermo Fisher Scientific | A31570 (RRID: AB_2536180) |
| Secondary ab-Donkey anti-rabbit 555 | Thermo Fisher Scientific | A31572 (RRID: AB_162543) |
| Secondary ab-Donkey anti-human 488 | Thermo Fisher Scientific | SA5-10126 (RRID: AB_2556706) |
| Chemicals, peptides, and recombinant proteins | ||
| Phalloidin-670 | Cytoskeleton | PHDN1 |
| CHIR99021 | R&D | 4423 |
| A83-01 | Peprotech | 9094360 |
| SB431542 | BioVision | 1674 |
| Valproic Acid | Sigma-Aldrich | P4543 |
| Insulin-Transferrin-Selenium-Ethanolamine (ITS - X) | Gibco | 51500056 |
| Insulin-Transferrin-Selenium (ITS -G) | Gibco | 41400045 |
| Forskolin | Sigma-Aldrich | F3917 |
| Y-27632 | Stemgent | 04–0012 |
| PD0325901 | Stemgent | 04–0006 |
| IM-12 | Enzo | BML-WN102 |
| SB590885 | Tocris | 2650 |
| WH-4-023 | A Chemtek | S1180 |
| XAV939 | Sigma | X3004 |
| Gö6983 | Tocris | 2285 |
| GDC-0994 | Selleck Chemicals | S7554 |
| rhEGF | Peprotech | AF-100-15 |
| rhHGF | Peprotech | 100-39 |
| rhR-Spondin1 | Peprotech | 120-38 |
| rhFGF2 | Peprotech | 100-18B |
| rhNRG1 | Cell Signaling | 5218SC |
| Activin A | PeproTech | 120-14 |
| LIF | PeproTech | 300-05 |
| Prostaglandin E2 | Millipore Sigma | P0409 |
| hESC qualified Matrigel | Corning | 354277 |
| Dispase | Stem Cell Technologies | 07923 |
| TrypLE Express | Gibco | 12604-013 |
| Primocin | Invitrogen | ant-pm-1 |
| N-Acetyl-L-Cysteine | Sigma Aldrich | A9165 |
| Knock-out Serum Replacement | ThermoFisher | 10828028 |
| Collagen IV | Corning | 354233 |
| Papain | MP Biomedicals | 100921 |
| Phenol-red free DMEM/F12 | Sigma Aldrich | D-2906 |
| Charcoal-stripped fetal bovine serum | Thermo Scientific | A3382101 |
| Ibidi micro well chamber slides | Ibidi | 80826 |
| Medroxyprogesterone 17-acetate | Sigma-Aldrich | M1629 |
| beta-Estradiol | Sigma-Aldrich | E8875 |
| 8-Bromo-cAMP | Tocris | 1140 |
| Critical commercial assays | ||
| E.Z.N.A. total RNA kit | Omega | D6834 |
| miRNeasy Mini Kit | Qiagen | 1038703 |
| TaqMan Advanced miRNA cDNA Synthesis Kit | Applied Biosystems | A28007 |
| TaqMan Fast Advanced Master Mix | Applied Biosystems | 4444556 |
| DNeasy Blood and Tissue Kit | Qiagen | 69504 |
| MMP2 ELISA Kit | Abcam | ab100606 |
| hCG ELISA Kit | CalBiotech | HC251F |
| Deposited data | ||
| Raw and Processed data | This paper | GEO: GSE172241 |
| A developmental landscape of 3D-cultured human pre-gastrulation embryos | Xiang et al., 2020 | GEO: GSE136447 |
| Single-cell RNA-seq reveals the diversity of trophoblast subtypes and patterns of differentiation in the human placenta | Liu et al., 2018 | GEO: GSE89497 |
| Experimental models: Cell lines | ||
| H9 (WA09); female | WashU GEiC | RRID: CVCL_9773 |
| WIBR3 (hESC); female | Whitehead Institute | RRID: CVCL_9767 |
| WIBR3-MECP2-GFP/tdTomato; female | Whitehead Institute | N/A |
| bTS5 (BT5) hTSC; female | Drs. Okae, Arima, and Pastor | RCB Cat# RCB4940 (RRID: CVCL_A6JH) |
| CT27 hTSC; female | Drs. Okae, Arima, and Pastor | RCB Cat# RCB4936 (RRID: CVCL_A7AZ) |
| CT30 hTSC; female | Drs. Okae, Arima, and Pastor | RCB Cat# RCB4938 (RRID: CVCL_A7BB) |
| Human Endometrial Stromal Cells-Immortalized | ATCC | CRL-4003 (RRID: CVCL_C464) |
| Human endometrial epithelial cells (EM-TERTs)-Immortalized | Dr. Pamela Pollock, Queensland Un. of Technology, Australia | N/A |
| MicroRNA probes | ||
| TaqMan MicroRNA Advanced Assay 477860_mir Assay Name: hsa-miR-16-5p | Applied Biosystems | A25576 |
| TaqMan MicroRNA Advanced Assay 478703_mir Assay Name: miR-1323 | Applied Biosystems | A25576 |
| TaqMan MicroRNA Advanced Assay 479396_mir Assay Name: miR-525-5p | Applied Biosystems | A25576 |
| TaqMan MicroRNA Advanced Assay 479485_mir Assay Name: miR-517a-3p | Applied Biosystems | A25576 |
| TaqMan MicroRNA Advanced Assay 478148_mir Assay Name: miR-518b | Applied Biosystems | A25576 |
| TaqMan MicroRNA Advanced Assay 478986_mir Assay Name: miR-519d-3p | Applied Biosystems | A25576 |
| Software and algorithms | ||
| FlowJo_v10.6.2 | FlowJo™ | RRID:SCR_008520; https://www.flowjo.com/ |
| Prism 9 | GraphPad | RRID:SCR_002798; https://www.graphpad.com |
| FIJI | NIH | https://imagej.net/Fiji |
| Amira | ThermoFisher | N/A |
| R 4.0.0 | R project | N/A; https://www.r-project.org/ |
| Cellranger 5.0.0 | 10Xgenomics | https://support.10xgenomics.com/single-cell-gene-expression/software/downloads/latest |
| ClusterProfiler 4.0.0 | Bioconductor | https://bioconductor.org/packages/release/bioc/html/clusterProfiler.html |
| Seurat 4.0 | Satija Lab | https://satijalab.org/seurat |
| pheatmap 1.0.12 | CRAN | https://cran.r-project.org/web/packages/pheatmap/index.html |
EXPERIMENTAL MODEL AND SUBJECT DETAILS
Cell lines and culture conditions
H9 (female) hESCs were obtained from the Washington University Genome Engineering and iPSC Center (GEiC), WIBR3 and WIBR3 MECP2-GFP/tdTomato hESCs (female) were obtained from Dr. Rudolf Jaenisch at the Whitehead Institute for Biomedical Research, BT5 (female), CT27 (female), and CT30 (female) hTSCs were obtained from Dr. William Pastor at McGill University with permission from Drs. Okae and Arima at Tohoku University, human endometrial stromal cells (female) were obtained from ATCC, and human endometrial epithelial cells (female) were obtained from Dr. Pamela Pollock at Queensland University. The identities of the H9 and WIBR3 hESC lines used in this study were authenticated using Short Tandem Repeat (STR) profiling. The cell culture is regularly tested and negative for mycoplasma contamination. All experiments involving hESCs were approved by the Institutional Biological and Chemical Safety Committee and Embryonic Stem Cell Research Oversight Committee at Washington University School of Medicine. Details about the culture conditions for each cell line are provided below.
Culture of primed and naïve hPSCs
Primed hPSCs were cultured in mTeSR1 Plus (STEMCELL Technologies, #100-0274) on hESC-qualified Matrigel (Corning, 354277) coated wells and passaged using ReLeSR (STEMCELL Technologies, 05872) every 4 to 6 days. Primed hPSCs were cultured in at 37 degrees Celcius in 5% CO2 and 20% O2. Naive hPSCs were cultured on mitomycin C-inactivated mouse embryonic fibroblast (MEF) feeder cells and were passaged by a brief PBS wash followed by a 5 minute incubation in TrypLE Express (Gibco, 12604) to disperse the cells to single-cells. Centrifugation occurs in fibroblast medium [DMEM (Millipore Sigma, #SLM-021-B) supplemented with 10% FBS (Cytiva, SH30088.03), 1X GlutaMAX (Gibco, 35050), and 1% penicillin-streptomycin (Gibco, 15140)]. Naive hPSCs were cultured in the 5i/L/A media as previously described (Theunissen et al., 2014). 500 mL of 5i/L/A was generated by combining: 240 mL DMEM/F12 (Gibco, 11320), 240 mL Neurobasal (Gibco, 21103), 5 mL N2 100X supplement (Gibco, 17502), 10 mL B27 50X supplement (Gibco, 17504), 10 μg recombinant human LIF (PeproTech, 300-05), 1X GlutaMAX, 1X MEM NEAA (Gibco, 11140), 0.1 mM β-mercaptoethanol (Millipore Sigma, 8.05740), 1% penicillin-streptomycin, 50 μg/ml BSA Fraction V (Gibco, 15260), and the following small molecules and cytokines: 1 μM PD0325901 (Stemgent, 04-0006), 1 μM IM-12 (Enzo, BML-WN102), 0.5 μM SB590885 (Tocris, 2650), 1 μM WH4-023 (A Chemtek, H620061), 10 μM Y-27632 (Stemgent, 04-0012), and 10 ng/mL Activin A (Peprotech, 120-14). Naïve hPSCs were cultured in 5% O2, 5% CO2 at 37C. For primed to naïve hPSC conversion, 2 × 10⁵ single primed cells were seeded on a 6-well plate with MEF feeder layer in 2 mL mTeSR1 supplemented with 10 μM Y-27632. Two days later, medium was switched to 5i/L/A. After 7 to 10 days from seeding, the cells were expanded polyclonally by using TrypLE Express on a MEF feeder layer. Tissue culture media were filtered using a 0.22 μm filter. Media were changed every 1–2 days. Naïve hPSCs before passage 10 were used for experiments.
The WIBR3-MECP2 reporter cell line was converted to naïve pluripotency using the alternative PXGGY/A naïve induction cocktail, as recently described (Khan et al., 2021). Primed WIBR3-MECP2 cells were maintained in mTeSR1 Plus as described above, dissociated with TrypLE Express, and 200,000 single cells were plated upon mitomycin C inactivated MEFs. For the first 48 hours, cells were maintained in mTeSR1 Plus with 10uM Y-27632, then switched to PXGGY/A medium for 10–12 days. ROCK inhibitor Y-27632 was only added for 24h after passaging. The culture was passaged 2 times every 3–4 days followed by flow cytometry analysis and hTSC derivation, as previously described (Dong et al., 2020).
hTSC culture
hTSCs were cultured according to Okae et al (Okae et al., 2018). Collagen IV (5μg/mL) was used as the substrate and was coated overnight at 37°C in 6-well plates. Medium contained DMEM/F12 supplemented with 0.1 mM 2-mercaptoethanol, 0.2% FBS, 0.5% Penicillin-Streptomycin, 0.3% BSA, 1% ITS-X (Gibco, 51500), 1.5 μg/ml L-ascorbic acid (Wako, 013–12061), 50 ng/ml EGF (Peprotech, AF-100-15), 2 μM CHIR99021 (R&D #4423), 0.5 μM A83-01 (Peprotech, 90943360), 1 μM SB431542 (BioVision, 1674), 0.8 mM VPA (Sigma Aldrich, P4543), and 5 μM Y-27632 and was changed daily. Cells were passaged with TrypLE every 3–4 days and 50,000 cells were passaged for continued growth. All experiments were performed using hTSCs between 20–30 passages. Derivation of hTSCs from naïve hPSCs was performed as previously described (Dong et al., 2020).
Derivation of stem cell-derived trophoblast organoids (SC-TOs)
2D hTSCs were grown in hTSC medium (Okae et al., 2018) until cells reached 80% confluency. hTSCs were single-cell dissociated with TrypLE and washed twice in Advanced DMEM/F12. 3,000 cells were suspended in 30uL Matrigel droplets to a final concentration of 72% Matrigel in Advanced DMEM/F12. Droplets were seeded in 24 well plates. A two-minute incubation step on the benchtop was required before turning the plate over and polymerizing the Matrigel droplets at 37°C for 30 minutes. Plates were subsequently removed from the incubator and 500uL of trophoblast organoid medium (TOM) was added. TOM medium was prepared as described previously (Turco et al., 2018) [Advanced DMEM/F12 (Life Technologies #12634010), 1X N2 Supplement (Life Technologies #17502048), 1X B27 Supplement minus vitamin A (Life Technologies 12587010), 100ug/mL Primocin (Invivogen #ant-pm-1), 1.25mM N-Acetyl-L-Cysteine (Sigma #A9165), 2mM L-Glutamine (Life Technologies #25030-024), 500nM A83-01 (Peprotech #9094360), 1.5uM CHIR99021 (Stemgent #04-0004), 2uM Y-27632 (Stemgent #04-0012), 50ng/mL rhEGF (Peprotech #AF-100-15), 50ng/mL rhHGF (Peprotech #100-39), 80ng/mL rhR-Spondin1 (Peprotech #120-38), 100ng/mL rhFGF2 (Peprotech #100-18B), and 2.5uM Prostaglandin E2 (Millipore Sigma #P0409)]. 500uL of TOM was changed daily and organoids were maintained for 8–10 days between passages. Matrigel droplets were washed once with PBS and 1mL of TrypLE Express was used to break up droplets and dissociate the organoids for 20 minutes at 37°C in a 1.5 mL Eppendorff tube, which was inverted several times throughout the incubation. Following incubation, tubes were washed three times in Advanced DMEM/F12 by centrifugation at 1000 rpm for 3–5 minutes. Between each wash, 100uL of Advanced DMEM/12 was added and organoids were dissociated by trituration approximately 20 times or until a single-cell suspension of organoids was obtained. A 40μm filter was employed to remove large, unbroken chunks of organoids. 3,000–5,000 cells were re-seeded per 30μL Matrigel droplet.
METHOD DETAILS
Differentiation of 2D hTSCs
EVT differentiation of 2D hTSCs was performed as described in Okae et al (Okae et al., 2018). hTSCs were grown to 80% confluency in hTSC medium and split by using TrypLE Express into a single cell suspension. These cells were resuspended in EVT medium-1 (DMEM/F12 supplemented with 0.1 mM 2-mercaptoethanol, 0.5% Penicillin-Streptomycin, 0.3% BSA, 1% ITS-X supplement, 100 ng/ml NRG1, 7.5 μM A83-01, 2.5 μM Y27632, and 4% KnockOut Serum Replacement) and 75,000 cells per well were plated in 1ug/mL of Collagen IV precoated wells. Matrigel was added to the medium at a final concentration of 0.5%. EVT cells were allowed to grow in this medium for 3 days. Following this, the medium was changed to EVT medium-2, which lacks NRG1 but is otherwise the same as EVTm-1, and Matrigel was added to this medium to a final concentration of 0.5%. On day 6, the cells were split into new Collagen IV-coated wells with TrypLE Express at a 1:2 ratio into EVT medium-3, which is the same as EVTm-2 but lacks KOSR. Matrigel was once again added at 0.5% and EVTs were allowed 2 additional days of growth.
STB differentiation from hTSCs in adherent culture was performed as previously described (Okae et al., 2018) with minor modifications. 3.75×10⁴ hTSCs were added to 24 well plates coated with 2.5ug/mL Collagen IV. hTSCs were resuspended in STB medium (DMEM/F12 supplemented with 0.1 mM 2-mercaptoethanol, 0.5% Penicillin-Streptomycin, 0.3% BSA, 1% ITS-X supplement, 2.5 mM Y27632, 50 ng/ml EGF, 2 mM forskolin, and 4% KSR) and allowed to grow for 3 days. At day 3, an equal proportion of STB medium was added to wells and incubated another 3 days. Infection with VSV-G and VSV-S occurred on day 5 for 24 hours as described below.
Differentiation of SC-TOs into specialized 3D EVT organoids
For differentiation of SC-TOs into 3D EVT organoids, we followed the established protocol from Sheridan et al (Sheridan et al., 2020). Like 2D EVT differentiation, EVT organoids were differentiated by using phases of EVT media. 3,000–5,000 dissociated organoids were seeded in 30uL Matrigel droplets in 24 well plates as described above and cultured in TOM media for 3 days. Media were changed to organoid EVT medium-1 [Adv. DMEM/F12, 0.1 2-mercaptoethanol, 0.5% Penicillin/Streptomycin, 0.3% bovine serum albumin, 1% ITS-X, 100ng/mL NRG1, 7.5uM A83-01, and 4% knockout serum replacement] for 5 days and 500uL-1mL of media were replaced each day per well. Subsequently, organoid EVT medium-2 was applied, which is identical to organoid EVTm-1 except for the omission of NRG1. EVTm-2 was replaced for an additional 2–3 days, or until robust migratory cells sprouted from the organoids.
Human endometrial invasion assay
Immortalized human endometrial stromal cells (Krikun et al., 2004) and immortalized human endometrial epithelial cells (Kyo et al., 2003) were both maintained in phenol-red free DMEM/F12 supplemented with 7.5% charcoal-stripped fetal bovine serum, 1x non-essential amino acids, 1x Insulin/Transferrin/Selenium, and 1x Antibiotic-Antimycotic at 37°C and 5% CO2. Endometrial epithelial cells were nucleofected (Lonza BioScience) with a pBRY-nuclear mCherry plasmid (Addgene #52409), and stably transfected cells were obtained by FACS, sorting for mCherry fluorescence on three consecutive passages (98%+ cells were red at last sorting). For 3D-culture, each well of an 8-well chamber slide was loaded with 100 uL ice-cold Matrigel containing 4×10⁵ human endometrial fibroblasts. After Matrigel was solidified for 30 minutes at 37°C, 200 uL culture medium containing 2.5×10⁴ nuclear-mCherry endometrial epithelial cells were seeded on top of the Matrigel. Control wells contained Matrigel and culture medium without cells. The chamber slides were incubated overnight before SC-TO/SC-EVTO seeding. H9 hTSCs were lentivirally transduced with a constitutively active FUW-GFP virus, as previously described (Theunissen et al., 2014), and high GFP-expressing cells were obtained by FACS. These GFP-labeled H9 hTSCs were used to derive SC-TOs by transfer to TOM medium for 8 days or SC-EVTOs by transfer to TOM medium for 3 days, followed by 5 days of EVT organoid medium. Organoids were removed from Matrigel droplet by incubating them in Cell Recovery solution on ice for 30 minutes. Whole organoids were resuspended in endometrium medium containing Estradiol (36 nM), Medroxyprogesterone 17-Acetate (1 μM), and c-AMP (100 μM) and seeded upon endometrial-matrigel surface with medium changes every other day. Organoids attached overnight and were fixed and analyzed for GFP labeled organoid projection lengths after 7 days of co-culture using ImageJ software.
Movies were taken on a Zeiss Cell Discoverer 7 confocal microscope equipped with 5% CO2 and 37°C incubation temperature. GFP labeled H9 SC-TOs and SC-EVTOs upon endometrial interface (epithelial cells labeled mCherry) were imaged for 21 hours on day 5 of interaction.
Immunofluorescence
Organoids were isolated from Matrigel droplets by trituration using a 1000 μl pipette tip along the bottom of the well in Cell Recovery Solution (Corning #354253). Cell Recovery Solution with Matrigel and organoids in suspension was collected in a 1.5mL tube and placed on ice for 30 minutes. Organoids were gently centrifuged (600 rcf for 5 min) and washed in PBS once before fixation in 4% Paraformaldehyde on ice for 30 minutes. Fixed organoids were washed with PBS+0.1% BSA 3 times prior to permeabilization and blocking overnight at 4°C in PBS+ 4%BSA+ 5% FBS + 0.5% Triton-X. Primary antibodies were added in staining solution (PBS+ 4% BSA + 5% FBS + 0.1% Tween-20) and incubated overnight at 4°C. Secondary antibodies were incubated overnight at 4°C in staining solution at a concentration of 1:300. Phalloidin-670 and Hoechst dye were also added at this step. Organoids were mounted in Prolong Gold Antifade mounting medium (ThermoFisher #P36930) between two coverslips separated by Grace biolabs Cover Well incubation chambers (Grace Bio-Labs #645401). Confocal imaging was performed on a Leica SP8 Single photon confocal microscope. Widefield imaging was performed on a Leica DMi-8 fluorescence microscope.
Light-sheet microscopy
Organoids were immunostained as described above and then cleared in a Glycerol-Fructose clearing solution (60% glycerol and 2.5M fructose). Cleared organoids were resuspended and embedded in 50% clearing solution and 50% water + 2.5% low melting point agarose. SC-TOs in agarose were drawn into a light sheet microscope capillary tube and allowed to solidify overnight at 4°C before imaging the next day on a Zeiss Lattice Lightsheet 7 Microscope. CDH1, SDC1, and DAPI signals were analyzed for volume (microns3) using Amira software.
Flow cytometry
Flow cytometry was performed to analyze the proportion of cells expressing GFP fluorescence as a result of VSV-eGFP-SARS-CoV-2-S/G infection. Cells grown in 2D (hTSCs, 2D EVT) were infected for 1 hour and medium was changed to non-infectious medium for 8 hours. Cells were dissociated with TrypLE Express and fixed in 4% PFA in suspension for 10 minutes. Cells were washed three times with PBS+0.1% BSA. Cells were passed through a 40 micron cell strainer and run on a BD LSRFortessa X-20 and analyzed by using FlowJo software. Uninfected control samples were used as a negative GFP signal and compared to VSV-G (positive GFP control) and VSV-S (experimental samples).
RNA isolation and quantitative RT-PCR
Total RNA was isolated using the E.Z.N.A. total RNA kit I (Omega, D6834), and cDNA synthesis was performed on total RNA using the high capacity cDNA reverse transcription kit (Applied Biosystems, 4368814). Real-time PCR was performed using PowerUp SYBR Green master mix (Applied Biosystems, A25743) on the StepOnePlus Real-Time PCR System (Applied Biosystems). All analyses were done in triplicate among 2–3 biological replicates. Gene expression was normalized to RPLP0. Error bars represent the standard deviation (SD) of biological replicate fold change values.
For miRNA analysis, total RNAs, including small RNAs were isolated using the Qiagen miRNeasy mini kit. cDNA synthesis was performed using the TaqMan Advanced MicroRNA cDNA Synthesis Kit, followed by TaqMan probe real-time PCR. We followed all the manufacturer’s specified instructions. The following thermocycling conditions were used for qRT-PCR: 95 °C for 20 sec, 40 cycles of 95 °C for 1 sec, and 60 °C for 20 sec. miRNA expression was normalized to a ubiquitously expressed miRNA, hsa-mir-16-5p. All analysis was done in technical triplicates. Error bars represent standard deviation of 2–3 biological replicates.
qRT-PCR probes and primers are listed in Table S3.
hCG and MMP2 ELISAs
hTSCs were plated at 30,000 cells per Matrigel droplet and 10 days later medium was collected. Medium was collected from organoid droplet wells after 24 hours of incubation for all experiments. Dilution factors were first determined on test samples before final experimentation. Manufacturer’s instructions were followed in the execution of the ELISAs.
Single cell RNA sequencing
Single cell suspensions for scRNA-seq were prepared by dissociating organoids in Papain enzyme solution (MP Biomedicals, 100921). Organoids were removed from Matrigel droplets in cell recovery solution on ice for 20 minutes. Free organoids were washed once in ice-cold HBSS and centrifuged at 4000 RPM for 30 seconds. The supernatant was removed and 400μL of activated Papain solution was added. Organoids were incubated at 37°C for 10 minutes, inverting the tube every 2 minutes. 600μL of 10% FBS in DMEM with 5 mM magnesium was added to each sample. Gentle trituration of the sample was performed 3–5 times with a P1000 pipet. Following this, 10 μl of DNase I was added to each tube and inverted gently to mix. We next incubated samples at 37°C for 5 minutes and gently triturated an additional 3–5 times. Organoids were centrifuged at 4000 rpm for 30 seconds. The supernatant was removed, dissociated organoids were resuspended in PBS+0.04% BSA, and the cell suspension was passed through a 40 micron filter. Trypan blue was used to test viability (>90% live cells).
cDNA was prepared after the GEM generation and barcoding, followed by the GEM-RT reaction and bead cleanup steps. Purified cDNA was amplified for 11–13 cycles before being cleaned up using SPRIselect beads. Samples were then run on a Bioanalyzer to determine the cDNA concentration. GEX libraries were prepared as recommended by the 10x Genomics Chromium Single Cell 3’ Reagent Kits (v3 Chemistry) user guide with appropriate modifications to the PCR cycles based on the calculated cDNA concentration. For sample preparation on the 10x Genomics platform, the Chromium Single Cell 3’ GEM, Library and Gel Bead Kit v3 (PN-1000075), Chromium Single Cell B Chip Kit (PN-1000153), and Dual Index Kit TT Set A (PN-1000215) were used. The concentration of each library was accurately determined through qPCR utilizing the KAPA library Quantification Kit according to the manufacturer’s protocol (KAPA Biosystems/Roche) to produce cluster counts appropriate for the Illumina NovaSeq6000 instrument. Normalized libraries were sequenced on a NovaSeq6000 S4 Flow Cell using the XP workflow and a 28×10×10×150 sequencing recipe according to manufacturer protocol. A median sequencing depth of 50,000 reads/cell was targeted for each Gene Expression Library.
VSV-eGFP-SARS-CoV-2-S, VSV-G, and ZIKV infection in trophoblast organoids
The chimeric pseudovirus, VSV-eGFP-SARS-CoV-2-S, was kindly provided by Dr. Sean P.J. Whelan, Washington University School of Medicine in Saint Louis. The chimeric virus was synthesized by integrating the SARS-CoV-2 Spike gene (Wuhan-Hu-1 isolate) in an infectious molecular clone of Vesicular stomatitis virus (VSV) (Case et al., 2020). VSV-eGFP-SARS-CoV-2-S and VSV-eGFP-G were propagated in Vero cells, and titration of the virus was performed using the qPCR standard curve described previously (Verma et al., 2021). The Brazilian strain of ZIKV was provided by S. Whitehead (Bethesda, MD) and obtained initially from P.F.C. Vasconcelos (Instituto Evandro Chagas, Levilândia, Brazil). ZIKV was propagated in Vero cells, and the titer was calculated by focus forming assay (FFU) as described previously (Cao et al., 2017). Trophoblast organoids were infected with VSV-eGFP-SARS-CoV-2-S and VSV-eGFP-G, at 5, and 1 multiplicity of infection (MOI), respectively, and incubated for 24h at 37°C, 5% CO2, and 70% relative humidity. Monolayer trophoblasts were incubated with 5 or 1 MOI of VSV-S or VSV-G, respectively, for one hour. Subsequently, medium was changed to non-infectious medium overnight and analyzed the following day. ZIKV infection was performed at 0.1 MOI for 2h at 37°C, 5% CO2, and 70% relative humidity. After 2h of ZIKV infection the media were removed, and organoids were washed with PBS, and fresh media was added and further incubated for 24 h. After incubation, the culture supernatant was harvested, and organoids were fixed using 1% PFA. All experiments were performed under biosafety level 2 (BSL2) conditions.
SARS-CoV-2 infection
H9 and CT30 organoids were counted at 10 days of growth and seeded at 3.8 × 10⁵ and 8 × 10⁴ cells per well in 500 μL of DMEM supplemented with 2% FBS, 10 mM HEPES, penicillin and streptomycin (D2F) in a 24-well tissue culture plate. These cells were infected with a multiplicity of infection of 30, 3 and 0.3 of the WA1 strain of SARS-CoV-2 for one hour at 37°C. This equates to 11.4 × 10⁶, 11.4 × 10⁵, and 11.4 × 10⁴ pfu and 2.4 × 10⁶, 2.4 × 10⁵, and 2.4 × 10⁴ pfu for the H9 and CT30 cells respectively. This virus was expanded on Vero cells overexpressing human TMPRSS2 virus and sequenced by next-generation sequencing to confirm the identity and presence of the Furin-cleavage site in the Spike protein. Next, the cells were transferred gently to 15mL conical tubes and spun for 5 minutes at 200×g. The supernatant was aspirated, and the cells were resuspended in 1.0mL of D2F and transferred to a fresh 24-well tissue culture plate. 24h hours later, the cells were collected in a 15 mL conical tube and spun for 5 minutes at 200×g. Following removal of the tissue culture supernatant, the cells were washed gently in PBS + 0.1% BSA and spun again for 5 minutes at 37°C. After removing the supernatant, the cells were fixed with 500 μL 4% paraformaldehyde for 30 minutes at 20°C. Next, the fixed cells were spun for 5 minutes at 200×g, washed with 3 mL of PBS + 0.1% BSA, before a final centrifugation for 5 minutes at 200×g. Following removal of the supernatant, the cells were resuspended in 1.0mL PBS + 0.1%BSA before further analysis.
QUANTIFICATION AND STATISTICAL ANALYSIS
ELISA data analysis
Graphpad Prism was used to create visual graphs and analyses. Statistical significance was determined by a one-way ANOVA with Sidak’s multiple comparisons test. Significance was determined by p<0.05. *P value<0.05, **P value<0.01.
qRT-PCR data analysis
Fold change values were determined by 2^-ddCt and means among 2–3 replicates were visualized in each graph. Statistical analysis was determined using dCt values of each analyzed group and a paired t-test or One way ANOVA was used to determine statistical significance. Ns = not significant, or p-value above 0.05. *p<0.05, **p<0.01, ***p<0.001, ****p<0.0001.
scRNA-seq analysis
Raw sequencing data were converted to fastq format using the cellranger mkfastq command (v.5.0.0). scRNA-seq reads were aligned to the GRCh38 (UCSC hg38) reference genome and quantified using the cellranger count command using default parameters.
Count data was processed using the R package Seurat (v.4.0.0) (Stuart et al., 2019), using Gencode v.31 for gene identification and considering only protein-coding genes. Cells with less than 2,500 or more than 8,000 informative genes expressed, cells with less than 15,000 sequenced fragments and cells with more than 25% mitochondrial gene content were excluded. Count data was log-normalized and scaled to 10,000. scRNA-seq data sets for H9 ESC- and CT30-derived TSC organoids, and replicates respectively, were transformed and mitochondrial gene content was regressed out using SCTransform as implemented in Seurat, and the data sets were integrated using 4,000 anchors following SC transformation.
PCA analysis was based on the 3,500 most variable genes. Nearest neighbors were computed using the top 6 principal components, and 5 clusters were identified using the Louvain community detection implemented in Seurat’s FindClusters function (‘resolution=0.3’). 2-dimensional representations were generated using uniform manifold approximation and projection (UMAP). For each cluster, the genes differentially expressed between H9 ESC and CT30-derived organoids were determined using the FindMarkers function and a Wilcoxon Rank Sum test (‘logfc.threshold = 0.1, min.pct = 0.25’). GO term enrichment analyses were performed with the clusterProfiler package in R. To infer developmental trajectories, quality-filtered count data was normalized, and replicates were integrated using the ingest function in the Python package Scanpy (v.1.2.8; scanpy.readthedocs.io). Diffusion maps were calculated with destiny (Angerer et al., 2016) as implemented in Scanpy.
To compare with publicly available scRNA-seq data sets, raw counts were obtained from GEO (accession: GSE89497 (Liu et al., 2018); GSE136447 (Xiang et al., 2020)), and re-analyzed as described above using SC transformation. For the Liu et al. data set, we used the markers provided as a Supplementary Table in the paper to reproduce and reassign the cell types to clusters; for the Xiang et al. data set, cell types were directly provided as Supplementary Table. Processed and annotated public scRNA-seq data sets were integrated with our combined TSC organoid scRNA-seq data sets using reciprocal PCA as implemented in Seurat.
Allele-specific analysis of X-linked gene expression
scRNA-seq reads of H9-derived organoids were aligned to chrX of the GRCh38 (UCSC hg38) reference genome with cellranger count command, and reads for each single cell were extracted from the sam file guided by the barcodes as listed in the “CB:Z” column by cellranger. Heterozygous SNPs for the H9 (p25) stem cell line were obtained from an Affymetrix genome-wide SNP 6.0 Array on GEO (accession: GSE15096). 5 nt sequence windows in exons, +/− 2 nt around the SNP, were extracted from the alignment files for each single cell using the GenomicAlignments package in R; SNPs that were covered by at least 50 reads over all single cells were considered for further analysis. The alignment quality of the reads was inspected manually by using BLAT as implemented on the UCSC browser. Some SNPs (rs10521478, rs14115, rs8575, rs7392258) that were covered by multi-mapping reads only were discarded. For each single cell, the number of reads with the reference allele or alternate allele was counted using custom PERL scripts. Bulk RNA-seq data sets for primed and naïve H9 hESCs derived in 5i/L/A were obtained from GEO (accession: GSE138688 (Dong et al., 2020)), and aligned with HISAT2 (http://daehwankimlab.github.io/hisat2) to the GRCh38 (UCSC hg38) reference genome. Read alignments on SNPs were extracted with the GenomicAlignments package in R and allele frequencies were analyzed as described for SNPs that were covered by at least 10 reads in naïve hESCs.
Supplementary Material
Supplemental Movie 1 [Related to Fig. 4]: H9 SC-TOs grown in TOM conditions do not form invasive projections when in contact with maternal endometrial cells in vitro. GFP-labeled H9 SC-TOs were cultured on a 3D Matrigel scaffold with endometrial glandular epithelium labeled with nuclear mCherry and endometrial fibroblasts (unlabeled) and allowed to interact for 6 days. This movie contains 21 hours and 40 min of footage beginning on day 5 of co-culture. Endometrial gland cells (red) established connections with the SC-TOs (green), but SC-TOs did not form projections. Brightfield is left, GFP and mCherry signals are right. Time located at top left corner. Frames were taken every 10 minutes. Scale bar = 100 μm.
Supplemental Movie 2 [Related to Fig. 4]: H9 SC-EVTOs grown in EVT conditions form multiple invasive projections and migratory trophoblasts when in contact with endometrial cells in vitro. GFP-labeled H9 SC-EVTOs were added to a 3D Matrigel scaffold with endometrial glandular epithelium labeled with nuclear mCherry and endometrial fibroblasts (unlabeled) and allowed to interact for 6 days. This movie contains 21 hours and 40 min of footage beginning on day 5 of co-culture. Brightfield is left, GFP and mCherry signals are right. Time located at top left corner. Frames were taken every 10 minutes. Scale bar = 100 μm.
Table S1: Differential gene expression between discrete clusters found within SC-TOs [Related to Fig. 2]. H9 and CT30 clusters were combined and the percentage of genes expressed in each subcluster was compared between each cluster and all other clusters (adj P value < 0.05; Wilcoxon signed-rank test; BH correction). This identified upregulated genetic markers in each cluster. The final two tabs include a comparison of upregulated genes in CTB-1 vs. CTB-2 and STB-1 vs. STB-2 (Wilcoxon signed-rank test; BH correction).
Table S2: Differential gene expression between the H9 (naïve) and CT30 (primary) SC-TO lines [Related to Fig. 2]. Individual clusters (CTB-1, CTB-2, both CTBs, STB-1, STB-2, both STBs, and EVT) were compared between H9 and CT30 to identify SC-TO line-specific genetic markers (adj P value < 0.05; Wilcoxon signed-rank test; BH correction).
Highlights:
Single cell analysis of human stem cell-derived trophoblast organoids (SC-TOs)
SC-TO subpopulations correspond to trophoblast cell types in human embryos
SC-TOs recapitulate placental X chromosome inactivation dynamics
SC-TOs model selective placental vulnerability to emerging viral infections
ACKNOWLEDGEMENTS
We thank the Genome Technology Access Center at Washington University School of Medicine for assistance with scRNA-seq and the Washington University Center for Cellular Imaging and the Washington University Biology Imaging Facility for assistance with imaging. Lightsheet data were generated on a Zeiss Lightsheet Z.1 Microscope, which was purchased with support from the Office of Research Infrastructure Programs (ORIP), a part of the NIH Office of the Director under grant OD025034. All experiments involving hESCs were approved by the Institutional Biological and Chemical Safety Committee and Embryonic Stem Cell Research Oversight Committee at Washington University School of Medicine. We thank Angela Bowman and Lilianna Solnica-Krezel for critical reading of the manuscript.
FUNDING
This work was supported by the National Institutes of Health (NIH) Director’s New Innovator Award (DP2 GM137418) and grants from the Children’s Discovery Institute (CDI-LI-2019-819), the Shipley Foundation Program for Innovation in Stem Cell Science, and the Edward Mallinckrodt, Jr. Foundation to T.W.T. R.M.K. is supported by a Training in Regenerative Medicine training grant (T32 EB028092) from the NIH. I.U.M. is supported by NIH / NICHD grant R01 HD091218 and 3R01HD091218-04S1 (RADx-UP Supplement) and a McDonnell International Academy Award. L.M. is supported by NIH grant R01 HD106120. Federal NIH/NIGMS funds were not used to develop integrated 3D models of human embryonic development.
DECLARATION OF INTERESTS
I.U.M. serves on the Scientific Advisory Board of Luca Biologics. The Boon laboratory has received unrelated funding support in sponsored research agreements from AI Therapeutics, GreenLight Biosciences Inc., and Nano targeting & Therapy Biopharma Inc. The Boon laboratory has received funding support from AbbVie Inc., for the commercial development of SARS-CoV-2 mAb. A.C.M.B. is a recipient of a licensing agreement with Abbvie Inc., for commercial development of SARS-CoV-2 mAb.
Footnotes
Publisher's Disclaimer: This is a PDF file of an unedited manuscript that has been accepted for publication. As a service to our customers we are providing this early version of the manuscript. The manuscript will undergo copyediting, typesetting, and review of the resulting proof before it is published in its final form. Please note that during the production process errors may be discovered which could affect the content, and all legal disclaimers that apply to the journal pertain.
REFERENCES
- Aagaard KM, Lahon A, Suter MA, Arya RP, Seferovic MD, Vogt MB, Hu M, Stossi F, Mancini MA, Harris RA, et al. (2017). Primary Human Placental Trophoblasts are Permissive for Zika Virus (ZIKV) Replication. Sci Rep 7, 41389. [DOI] [PMC free article] [PubMed] [Google Scholar]
- Amita M, Adachi K, Alexenko AP, Sinha S, Schust DJ, Schulz LC, Roberts RM, and Ezashi T (2013). Complete and unidirectional conversion of human embryonic stem cells to trophoblast by BMP4. Proc Natl Acad Sci U S A 110, E1212–1221. [DOI] [PMC free article] [PubMed] [Google Scholar]
- An C, Feng G, Zhang J, Cao S, Wang Y, Wang N, Lu F, Zhou Q, and Wang H (2020). Overcoming Autocrine FGF Signaling-Induced Heterogeneity in Naive Human ESCs Enables Modeling of Random X Chromosome Inactivation. Cell Stem Cell 27, 482–497 e484. [DOI] [PubMed] [Google Scholar]
- Andergassen D, Smith ZD, Kretzmer H, Rinn JL, and Meissner A (2021). Diverse epigenetic mechanisms maintain parental imprints within the embryonic and extraembryonic lineages. Dev Cell 56, 2995–3005 e2994. [DOI] [PMC free article] [PubMed] [Google Scholar]
- Angerer P, Haghverdi L, Buttner M, Theis FJ, Marr C, and Buettner F (2016). destiny: diffusion maps for large-scale single-cell data in R. Bioinformatics 32, 1241–1243. [DOI] [PubMed] [Google Scholar]
- Anson-Cartwright L, Dawson K, Holmyard D, Fisher SJ, Lazzarini RA, and Cross JC (2000). The glial cells missing-1 protein is essential for branching morphogenesis in the chorioallantoic placenta. Nat Genet 25, 311–314. [DOI] [PubMed] [Google Scholar]
- Balaton BP, Cotton AM, and Brown CJ (2015). Derivation of consensus inactivation status for X-linked genes from genome-wide studies. Biol Sex Differ 6, 35. [DOI] [PMC free article] [PubMed] [Google Scholar]
- Brasil P, Pereira JP Jr., Moreira ME, Ribeiro Nogueira RM, Damasceno L, Wakimoto M, Rabello RS, Valderramos SG, Halai UA, Salles TS, et al. (2016). Zika Virus Infection in Pregnant Women in Rio de Janeiro. N Engl J Med 375, 2321–2334. [DOI] [PMC free article] [PubMed] [Google Scholar]
- Bullen CK, Hogberg HT, Bahadirli-Talbott A, Bishai WR, Hartung T, Keuthan C, Looney MM, Pekosz A, Romero JC, Sille FCM, et al. (2020). Infectability of human BrainSphere neurons suggests neurotropism of SARS-CoV-2. ALTEX 37, 665–671. [DOI] [PubMed] [Google Scholar]
- Burton GJ, and Jones CJ (2009). Syncytial knots, sprouts, apoptosis, and trophoblast deportation from the human placenta. Taiwan J Obstet Gynecol 48, 28–37. [DOI] [PubMed] [Google Scholar]
- Cao B, Parnell LA, Diamond MS, and Mysorekar IU (2017). Inhibition of autophagy limits vertical transmission of Zika virus in pregnant mice. J Exp Med 214, 2303–2313. [DOI] [PMC free article] [PubMed] [Google Scholar]
- Carter AM (2007). Animal models of human placentation--a review. Placenta 28 Suppl A, S41–47. [DOI] [PubMed] [Google Scholar]
- Case JB, Rothlauf PW, Chen RE, Liu Z, Zhao H, Kim AS, Bloyet LM, Zeng Q, Tahan S, Droit L, et al. (2020). Neutralizing Antibody and Soluble ACE2 Inhibition of a Replication-Competent VSV-SARS-CoV-2 and a Clinical Isolate of SARS-CoV-2. Cell Host Microbe. [DOI] [PMC free article] [PubMed] [Google Scholar]
- Castel G, Meistermann D, Bretin B, Firmin J, Blin J, Loubersac S, Bruneau A, Chevolleau S, Kilens S, Chariau C, et al. (2020). Induction of human trophoblast stem cells from somatic cells and pluripotent stem cells. Cell Rep 33, 108419. [DOI] [PubMed] [Google Scholar]
- Chen H, Guo J, Wang C, Luo F, Yu X, Zhang W, Li J, Zhao D, Xu D, Gong Q, et al. (2020). Clinical characteristics and intrauterine vertical transmission potential of COVID-19 infection in nine pregnant women: a retrospective review of medical records. Lancet 395, 809–815. [DOI] [PMC free article] [PubMed] [Google Scholar]
- Cinkornpumin JK, Kwon SY, Guo Y, Hossain I, Sirois J, Russett CS, Tseng HW, Okae H, Arima T, Duchaine TF, et al. (2020). Naive Human Embryonic Stem Cells Can Give Rise to Cells with a Trophoblast-like Transcriptome and Methylome. Stem Cell Reports 15, 198–213. [DOI] [PMC free article] [PubMed] [Google Scholar]
- Di Mascio D, Khalil A, Saccone G, Rizzo G, Buca D, Liberati M, Vecchiet J, Nappi L, Scambia G, Berghella V, et al. (2020). Outcome of coronavirus spectrum infections (SARS, MERS, COVID-19) during pregnancy: a systematic review and meta-analysis. Am J Obstet Gynecol MFM 2, 100107. [DOI] [PMC free article] [PubMed] [Google Scholar]
- Dong C, Beltcheva M, Gontarz P, Zhang B, Popli P, Fischer LA, Khan SA, Park KM, Yoon EJ, Xing X, et al. (2020). Derivation of trophoblast stem cells from naive human pluripotent stem cells. Elife 9. [DOI] [PMC free article] [PubMed] [Google Scholar]
- Foo SS, Cambou MC, Mok T, Fajardo VM, Jung KL, Fuller T, Chen W, Kerin T, Mei J, Bhattacharya D, et al. (2021). The systemic inflammatory landscape of COVID-19 in pregnancy: Extensive serum proteomic profiling of mother-infant dyads with in utero SARS-CoV-2. Cell Rep Med 2, 100453. [DOI] [PMC free article] [PubMed] [Google Scholar]
- Guo G, Stirparo GG, Strawbridge SE, Spindlow D, Yang J, Clarke J, Dattani A, Yanagida A, Li MA, Myers S, et al. (2021). Human naive epiblast cells possess unrestricted lineage potential. Cell Stem Cell. [DOI] [PMC free article] [PubMed] [Google Scholar]
- Guttmacher AE, Maddox YT, and Spong CY (2014). The Human Placenta Project: placental structure, development, and function in real time. Placenta 35, 303–304. [DOI] [PMC free article] [PubMed] [Google Scholar]
- Haider S, Meinhardt G, Saleh L, Kunihs V, Gamperl M, Kaindl U, Ellinger A, Burkard TR, Fiala C, Pollheimer J, et al. (2018). Self-Renewing Trophoblast Organoids Recapitulate the Developmental Program of the Early Human Placenta. Stem Cell Reports 11, 537–551. [DOI] [PMC free article] [PubMed] [Google Scholar]
- Hammer A, Hutter H, Blaschitz A, Mahnert W, Hartmann M, Uchanska-Ziegler B, Ziegler A, and Dohr G (1997). Amnion epithelial cells, in contrast to trophoblast cells, express all classical HLA class I molecules together with HLA-G. Am J Reprod Immunol 37, 161–171. [DOI] [PubMed] [Google Scholar]
- Harper MI, Fosten M, and Monk M (1982). Preferential paternal X inactivation in extraembryonic tissues of early mouse embryos. J Embryol Exp Morphol 67, 127–135. [PubMed] [Google Scholar]
- He M, Skaria P, Kreutz K, Chen L, Hagemann IS, Carter EB, Mysorekar IU, Nelson DM, Pfeifer J, and Dehner LP (2020). Histopathology of Third Trimester Placenta from SARS-CoV-2-Positive Women. Fetal Pediatr Pathol, 1–10. [DOI] [PubMed] [Google Scholar]
- Hecht JL, Quade B, Deshpande V, Mino-Kenudson M, Ting DT, Desai N, Dygulska B, Heyman T, Salafia C, Shen D, et al. (2020). SARS-CoV-2 can infect the placenta and is not associated with specific placental histopathology: a series of 19 placentas from COVID-19-positive mothers. Mod Pathol 33, 2092–2103. [DOI] [PMC free article] [PubMed] [Google Scholar]
- Hoffmann M, Kleine-Weber H, Schroeder S, Kruger N, Herrler T, Erichsen S, Schiergens TS, Herrler G, Wu NH, Nitsche A, et al. (2020). SARS-CoV-2 Cell Entry Depends on ACE2 and TMPRSS2 and Is Blocked by a Clinically Proven Protease Inhibitor. Cell 181, 271–280 e278. [DOI] [PMC free article] [PubMed] [Google Scholar]
- Hsu AL, Guan M, Johannesen E, Stephens AJ, Khaleel N, Kagan N, Tuhlei BC, and Wan XF (2021). Placental SARS-CoV-2 in a pregnant woman with mild COVID-19 disease. J Med Virol 93, 1038–1044. [DOI] [PMC free article] [PubMed] [Google Scholar]
- Io S, Kabata M, Iemura Y, Semi K, Morone N, Minagawa A, Wang B, Okamoto I, Nakamura T, Kojima Y, et al. (2021). Capturing human trophoblast development with naive pluripotent stem cells in vitro. Cell Stem Cell. [DOI] [PubMed] [Google Scholar]
- Juttukonda LJ, Wachman EM, Boateng J, Jain M, Benarroch Y, and Taglauer ES (2022). Decidual immune response following COVID-19 during pregnancy varies by timing of maternal SARS-CoV-2 infection. J Reprod Immunol 151, 103501. [DOI] [PMC free article] [PubMed] [Google Scholar]
- Khan SA, Park KM, Fischer LA, Dong C, Lungjangwa T, Jimenez M, Casalena D, Chew B, Dietmann S, Auld DS, et al. (2021). Probing the signaling requirements for naive human pluripotency by high-throughput chemical screening. Cell Rep 35, 109233. [DOI] [PMC free article] [PubMed] [Google Scholar]
- Krikun G, Mor G, Alvero A, Guller S, Schatz F, Sapi E, Rahman M, Caze R, Qumsiyeh M, and Lockwood CJ (2004). A novel immortalized human endometrial stromal cell line with normal progestational response. Endocrinology 145, 2291–2296. [DOI] [PubMed] [Google Scholar]
- Kyo S, Nakamura M, Kiyono T, Maida Y, Kanaya T, Tanaka M, Yatabe N, and Inoue M (2003). Successful immortalization of endometrial glandular cells with normal structural and functional characteristics. Am J Pathol 163, 2259–2269. [DOI] [PMC free article] [PubMed] [Google Scholar]
- Lamers MM, Beumer J, van der Vaart J, Knoops K, Puschhof J, Breugem TI, Ravelli RBG, Paul van Schayck J, Mykytyn AZ, Duimel HQ, et al. (2020). SARS-CoV-2 productively infects human gut enterocytes. Science 369, 50–54. [DOI] [PMC free article] [PubMed] [Google Scholar]
- Liang B, Guida JP, Costa Do Nascimento ML, and Mysorekar IU (2019). Host and viral mechanisms of congenital Zika syndrome. Virulence 10, 768–775. [DOI] [PMC free article] [PubMed] [Google Scholar]
- Liu X, Ouyang JF, Rossello FJ, Tan JP, Davidson KC, Valdes DS, Schroder J, Sun YBY, Chen J, Knaupp AS, et al. (2020). Reprogramming roadmap reveals route to human induced trophoblast stem cells. Nature 586, 101–107. [DOI] [PubMed] [Google Scholar]
- Liu Y, Fan X, Wang R, Lu X, Dang YL, Wang H, Lin HY, Zhu C, Ge H, Cross JC, et al. (2018). Single-cell RNA-seq reveals the diversity of trophoblast subtypes and patterns of differentiation in the human placenta. Cell Res 28, 819–832. [DOI] [PMC free article] [PubMed] [Google Scholar]
- Lokossou AG, Toudic C, and Barbeau B (2014). Implication of human endogenous retrovirus envelope proteins in placental functions. Viruses 6, 4609–4627. [DOI] [PMC free article] [PubMed] [Google Scholar]
- Miner JJ, Cao B, Govero J, Smith AM, Fernandez E, Cabrera OH, Garber C, Noll M, Klein RS, Noguchi KK, et al. (2016). Zika Virus Infection during Pregnancy in Mice Causes Placental Damage and Fetal Demise. Cell 165, 1081–1091. [DOI] [PMC free article] [PubMed] [Google Scholar]
- Moreira de Mello JC, de Araujo ES, Stabellini R, Fraga AM, de Souza JE, Sumita DR, Camargo AA, and Pereira LV (2010). Random X inactivation and extensive mosaicism in human placenta revealed by analysis of allele-specific gene expression along the X chromosome. PLoS One 5, e10947. [DOI] [PMC free article] [PubMed] [Google Scholar]
- Mykytyn AZ, Breugem TI, Riesebosch S, Schipper D, van den Doel PB, Rottier RJ, Lamers MM, and Haagmans BL (2021). SARS-CoV-2 entry into human airway organoids is serine protease-mediated and facilitated by the multibasic cleavage site. Elife 10. [DOI] [PMC free article] [PubMed] [Google Scholar]
- Narva E, Autio R, Rahkonen N, Kong L, Harrison N, Kitsberg D, Borghese L, Itskovitz-Eldor J, Rasool O, Dvorak P, et al. (2010). High-resolution DNA analysis of human embryonic stem cell lines reveals culture-induced copy number changes and loss of heterozygosity. Nat Biotechnol 28, 371–377. [DOI] [PubMed] [Google Scholar]
- Noguer-Dance M, Abu-Amero S, Al-Khtib M, Lefevre A, Coullin P, Moore GE, and Cavaille J (2010). The primate-specific microRNA gene cluster (C19MC) is imprinted in the placenta. Hum Mol Genet 19, 3566–3582. [DOI] [PubMed] [Google Scholar]
- Okae H, Toh H, Sato T, Hiura H, Takahashi S, Shirane K, Kabayama Y, Suyama M, Sasaki H, and Arima T (2018). Derivation of human trophoblast stem cells. Cell Stem Cell 22, 50–63 e56. [DOI] [PubMed] [Google Scholar]
- Okamoto I, Nakamura T, Sasaki K, Yabuta Y, Iwatani C, Tsuchiya H, Nakamura SI, Ema M, Yamamoto T, and Saitou M (2021). The X chromosome dosage compensation program during the development of cynomolgus monkeys. Science 374, eabd8887. [DOI] [PubMed] [Google Scholar]
- Pastor WA, Chen D, Liu W, Kim R, Sahakyan A, Lukianchikov A, Plath K, Jacobsen SE, and Clark AT (2016). Naive Human Pluripotent Cells Feature a Methylation Landscape Devoid of Blastocyst or Germline Memory. Cell Stem Cell 18, 323–329. [DOI] [PMC free article] [PubMed] [Google Scholar]
- Pellegrini L, Albecka A, Mallery DL, Kellner MJ, Paul D, Carter AP, James LC, and Lancaster MA (2020). SARS-CoV-2 Infects the Brain Choroid Plexus and Disrupts the Blood-CSF Barrier in Human Brain Organoids. Cell Stem Cell 27, 951–961 e955. [DOI] [PMC free article] [PubMed] [Google Scholar]
- Penaherrera MS, Jiang R, Avila L, Yuen RK, Brown CJ, and Robinson WP (2012). Patterns of placental development evaluated by X chromosome inactivation profiling provide a basis to evaluate the origin of epigenetic variation. Hum Reprod 27, 1745–1753. [DOI] [PMC free article] [PubMed] [Google Scholar]
- Phung TN, Olney KC, Silasi M, Perley L, O’Bryan J, Kliman HJ and Wilson MW (2021). X chromosome inactivation in the human placenta is patchy and distinct from adult tissues. bioRxiv. [DOI] [PMC free article] [PubMed] [Google Scholar]
- Renaud SJ, Chakraborty D, Mason CW, Rumi MA, Vivian JL, and Soares MJ (2015). OVO-like 1 regulates progenitor cell fate in human trophoblast development. Proc Natl Acad Sci U S A 112, E6175–6184. [DOI] [PMC free article] [PubMed] [Google Scholar]
- Rosenbloom JI, Raghuraman N, Carter EB, and Kelly JC (2021). Coronavirus disease 2019 infection and hypertensive disorders of pregnancy. Am J Obstet Gynecol. [DOI] [PMC free article] [PubMed] [Google Scholar]
- Sahakyan A, Kim R, Chronis C, Sabri S, Bonora G, Theunissen TW, Kuoy E, Langerman J, Clark AT, Jaenisch R, et al. (2017). Human naive pluripotent stem cells model X chromosome dampening and X inactivation. Cell Stem Cell 20, 87–101. [DOI] [PMC free article] [PubMed] [Google Scholar]
- Schwartz DA (2020). An Analysis of 38 Pregnant Women With COVID-19, Their Newborn Infants, and Maternal-Fetal Transmission of SARS-CoV-2: Maternal Coronavirus Infections and Pregnancy Outcomes. Arch Pathol Lab Med 144, 799–805. [DOI] [PubMed] [Google Scholar]
- Sheridan MA, Fernando RC, Gardner L, Hollinshead MS, Burton GJ, Moffett A, and Turco MY (2020). Establishment and differentiation of long-term trophoblast organoid cultures from the human placenta. Nat Protoc 15, 3441–3463. [DOI] [PubMed] [Google Scholar]
- Sheridan MA, Yunusov D, Balaraman V, Alexenko AP, Yabe S, Verjovski-Almeida S, Schust DJ, Franz AW, Sadovsky Y, Ezashi T, et al. (2017). Vulnerability of primitive human placental trophoblast to Zika virus. Proc Natl Acad Sci U S A 114, E1587–E1596. [DOI] [PMC free article] [PubMed] [Google Scholar]
- Sheridan MA, Zhao X, Fernando RC, Gardner L, Perez-Garcia V, Li Q, Marsh SGE, Hamilton R, Moffett A, and Turco MY (2021). Characterization of primary models of human trophoblast. Development 148. [DOI] [PMC free article] [PubMed] [Google Scholar]
- Smith GC (2010). First-trimester determination of complications of late pregnancy. JAMA 303, 561–562. [DOI] [PubMed] [Google Scholar]
- Subramanian A, Sidhom EH, Emani M, Vernon K, Sahakian N, Zhou Y, Kost-Alimova M, Slyper M, Waldman J, Dionne D, et al. (2019). Single cell census of human kidney organoids shows reproducibility and diminished off-target cells after transplantation. Nat Commun 10, 5462. [DOI] [PMC free article] [PubMed] [Google Scholar]
- Sungnak W, Huang N, Becavin C, Berg M, Queen R, Litvinukova M, Talavera-Lopez C, Maatz H, Reichart D, Sampaziotis F, et al. (2020). SARS-CoV-2 entry factors are highly expressed in nasal epithelial cells together with innate immune genes. Nat Med 26, 681–687. [DOI] [PMC free article] [PubMed] [Google Scholar]
- Takagi N, and Sasaki M (1975). Preferential inactivation of the paternally derived X chromosome in the extraembryonic membranes of the mouse. Nature 256, 640–642. [DOI] [PubMed] [Google Scholar]
- Theunissen TW, Friedli M, He Y, Planet E, O’Neil RC, Markoulaki S, Pontis J, Wang H, Iouranova A, Imbeault M, et al. (2016). Molecular criteria for defining the naive human pluripotent state. Cell Stem Cell 19, 502–515. [DOI] [PMC free article] [PubMed] [Google Scholar]
- Theunissen TW, Powell BE, Wang H, Mitalipova M, Faddah DA, Reddy J, Fan ZP, Maetzel D, Ganz K, Shi L, et al. (2014). Systematic identification of culture conditions for induction and maintenance of naive human pluripotency. Cell Stem Cell 15, 471–487. [DOI] [PMC free article] [PubMed] [Google Scholar]
- Turco MY, Gardner L, Kay RG, Hamilton RS, Prater M, Hollinshead MS, McWhinnie A, Esposito L, Fernando R, Skelton H, et al. (2018). Trophoblast organoids as a model for maternal-fetal interactions during human placentation. Nature 564, 263–267. [DOI] [PMC free article] [PubMed] [Google Scholar]
- Verma S, Carter EB, and Mysorekar IU (2020). SARS-CoV2 and pregnancy: An invisible enemy? Am J Reprod Immunol 84, e13308. [DOI] [PMC free article] [PubMed] [Google Scholar]
- Verma S, Joshi CS, Silverstein RB, He M, Carter EB, and Mysorekar IU (2021). SARS-CoV-2 colonization of maternal and fetal cells of the human placenta promotes alteration of local renin-angiotensin system. Med (N Y). [DOI] [PMC free article] [PubMed] [Google Scholar]
- Vivanti AJ, Vauloup-Fellous C, Prevot S, Zupan V, Suffee C, Do Cao J, Benachi A, and De Luca D (2020). Transplacental transmission of SARS-CoV-2 infection. Nat Commun 11, 3572. [DOI] [PMC free article] [PubMed] [Google Scholar]
- Weatherbee BAT, Glover DM, and Zernicka-Goetz M (2020). Expression of SARS-CoV-2 receptor ACE2 and the protease TMPRSS2 suggests susceptibility of the human embryo in the first trimester. Open Biol 10, 200162. [DOI] [PMC free article] [PubMed] [Google Scholar]
- West JD, Frels WI, Chapman VM, and Papaioannou VE (1977). Preferential expression of the maternally derived X chromosome in the mouse yolk sac. Cell 12, 873–882. [DOI] [PubMed] [Google Scholar]
- Wu F, Zhao S, Yu B, Chen YM, Wang W, Song ZG, Hu Y, Tao ZW, Tian JH, Pei YY, et al. (2020). A new coronavirus associated with human respiratory disease in China. Nature 579, 265–269. [DOI] [PMC free article] [PubMed] [Google Scholar]
- Xiang L, Yin Y, Zheng Y, Ma Y, Li Y, Zhao Z, Guo J, Ai Z, Niu Y, Duan K, et al. (2020). A developmental landscape of 3D-cultured human pre-gastrulation embryos. Nature 577, 537–542. [DOI] [PubMed] [Google Scholar]
- Yang L, Han Y, Nilsson-Payant BE, Gupta V, Wang P, Duan X, Tang X, Zhu J, Zhao Z, Jaffre F, et al. (2020). A Human Pluripotent Stem Cell-based Platform to Study SARS-CoV-2 Tropism and Model Virus Infection in Human Cells and Organoids. Cell Stem Cell 27, 125–136 e127. [DOI] [PMC free article] [PubMed] [Google Scholar]
- Zhou J, Li C, Liu X, Chiu MC, Zhao X, Wang D, Wei Y, Lee A, Zhang AJ, Chu H, et al. (2020). Infection of bat and human intestinal organoids by SARS-CoV-2. Nat Med 26, 1077–1083. [DOI] [PubMed] [Google Scholar]
Associated Data
This section collects any data citations, data availability statements, or supplementary materials included in this article.
Supplementary Materials
Supplemental Movie 1 [Related to Fig. 4]: H9 SC-TOs grown in TOM conditions do not form invasive projections when in contact with maternal endometrial cells in vitro. GFP-labeled H9 SC-TOs were cultured on a 3D Matrigel scaffold with endometrial glandular epithelium labeled with nuclear mCherry and endometrial fibroblasts (unlabeled) and allowed to interact for 6 days. This movie contains 21 hours and 40 min of footage beginning on day 5 of co-culture. Endometrial gland cells (red) established connections with the SC-TOs (green), but SC-TOs did not form projections. Brightfield is left, GFP and mCherry signals are right. Time located at top left corner. Frames were taken every 10 minutes. Scale bar = 100 μm.
Supplemental Movie 2 [Related to Fig. 4]: H9 SC-EVTOs grown in EVT conditions form multiple invasive projections and migratory trophoblasts when in contact with endometrial cells in vitro. GFP-labeled H9 SC-EVTOs were added to a 3D Matrigel scaffold with endometrial glandular epithelium labeled with nuclear mCherry and endometrial fibroblasts (unlabeled) and allowed to interact for 6 days. This movie contains 21 hours and 40 min of footage beginning on day 5 of co-culture. Brightfield is left, GFP and mCherry signals are right. Time located at top left corner. Frames were taken every 10 minutes. Scale bar = 100 μm.
Table S1: Differential gene expression between discrete clusters found within SC-TOs [Related to Fig. 2]. H9 and CT30 clusters were combined and the percentage of genes expressed in each subcluster was compared between each cluster and all other clusters (adj P value < 0.05; Wilcoxon signed-rank test; BH correction). This identified upregulated genetic markers in each cluster. The final two tabs include a comparison of upregulated genes in CTB-1 vs. CTB-2 and STB-1 vs. STB-2 (Wilcoxon signed-rank test; BH correction).
Table S2: Differential gene expression between the H9 (naïve) and CT30 (primary) SC-TO lines [Related to Fig. 2]. Individual clusters (CTB-1, CTB-2, both CTBs, STB-1, STB-2, both STBs, and EVT) were compared between H9 and CT30 to identify SC-TO line-specific genetic markers (adj P value < 0.05; Wilcoxon signed-rank test; BH correction).
Data Availability Statement
Single-cell RNA-seq data have been deposited at GEO and are publicly available as of the date of publication. Accession numbers are listed in the key resources table.
This paper does not report original code
Any additional information required to reanalyze the data reported in this paper is available from the lead contact upon request.
KEY RESOURCES TABLE
| REAGENT | SOURCE | IDENTIFIER |
|---|---|---|
| Antibodies | ||
| anti-KRT7 | Dako/Agilent | M7018 (RRID: AB_2134589) |
| anti-TP63 | Abcam | ab124762 (RRID: AB_10971840) |
| anti-SDC1 | Abcam | ab34164 (RRID: AB_778207) |
| anti-E-Cadherin (rabbit) | Cell Signaling | 3195S (RRID: AB_2291471) |
| anti-E-Cadherin (mouse) | Cell Signaling | 14472S (RRID: AB_2728770) |
| anti-hCG beta | Abcam | ab53087 (RRID: AB_870731) |
| anti-MMP2 | Cell Signaling | 40994S (RRID: AB_2799191) |
| anti-hCG alpha | R&D | MAB4169 (RRID: AB_2079126) |
| anti-HLAG | Santa Cruz | sc-21799 (RRID: AB_627938) |
| Pan HLA-A,B,C (W6/32-488) | Biolegend | 311413 (RRID: AB_493133) |
| anti-ZIKV capsid | GeneTex | GTX133317 (RRID: AB_2756861) |
| anti-Ki67 | Cell Signaling | 9449S (RRID: AB_2797703) |
| anti-SARS-CoV-2 Spike protein | Gift from Dr. Ellebedy, Washington University in St. Louis | Clone number 1C02 |
| anti-ITGA5B1 (rabbit) | Abcam | ab275977 |
| Secondary ab-Donkey anti-mouse 488 | Thermo Fisher Scientific | A21202 (RRID: AB_141607) |
| Secondary ab-Donkey anti-rabbit 488 | Thermo Fisher Scientific | A21206 (RRID: AB_2535792) |
| Secondary ab-Donkey anti-mouse 555 | Thermo Fisher Scientific | A31570 (RRID: AB_2536180) |
| Secondary ab-Donkey anti-rabbit 555 | Thermo Fisher Scientific | A31572 (RRID: AB_162543) |
| Secondary ab-Donkey anti-human 488 | Thermo Fisher Scientific | SA5-10126 (RRID: AB_2556706) |
| Chemicals, peptides, and recombinant proteins | ||
| Phalloidin-670 | Cytoskeleton | PHDN1 |
| CHIR99021 | R&D | 4423 |
| A83-01 | Peprotech | 9094360 |
| SB431542 | BioVision | 1674 |
| Valproic Acid | Sigma-Aldrich | P4543 |
| Insulin-Transferrin-Selenium-Ethanolamine (ITS - X) | Gibco | 51500056 |
| Insulin-Transferrin-Selenium (ITS -G) | Gibco | 41400045 |
| Forskolin | Sigma-Aldrich | F3917 |
| Y-27632 | Stemgent | 04–0012 |
| PD0325901 | Stemgent | 04–0006 |
| IM-12 | Enzo | BML-WN102 |
| SB590885 | Tocris | 2650 |
| WH-4-023 | A Chemtek | S1180 |
| XAV939 | Sigma | X3004 |
| Gö6983 | Tocris | 2285 |
| GDC-0994 | Selleck Chemicals | S7554 |
| rhEGF | Peprotech | AF-100-15 |
| rhHGF | Peprotech | 100-39 |
| rhR-Spondin1 | Peprotech | 120-38 |
| rhFGF2 | Peprotech | 100-18B |
| rhNRG1 | Cell Signaling | 5218SC |
| Activin A | PeproTech | 120-14 |
| LIF | PeproTech | 300-05 |
| Prostaglandin E2 | Millipore Sigma | P0409 |
| hESC qualified Matrigel | Corning | 354277 |
| Dispase | Stem Cell Technologies | 07923 |
| TrypLE Express | Gibco | 12604-013 |
| Primocin | Invitrogen | ant-pm-1 |
| N-Acetyl-L-Cysteine | Sigma Aldrich | A9165 |
| Knock-out Serum Replacement | ThermoFisher | 10828028 |
| Collagen IV | Corning | 354233 |
| Papain | MP Biomedicals | 100921 |
| Phenol-red free DMEM/F12 | Sigma Aldrich | D-2906 |
| Charcoal-stripped fetal bovine serum | Thermo Scientific | A3382101 |
| Ibidi micro well chamber slides | Ibidi | 80826 |
| Medroxyprogesterone 17-acetate | Sigma-Aldrich | M1629 |
| beta-Estradiol | Sigma-Aldrich | E8875 |
| 8-Bromo-cAMP | Tocris | 1140 |
| Critical commercial assays | ||
| E.Z.N.A. total RNA kit | Omega | D6834 |
| miRNeasy Mini Kit | Qiagen | 1038703 |
| TaqMan Advanced miRNA cDNA Synthesis Kit | Applied Biosystems | A28007 |
| TaqMan Fast Advanced Master Mix | Applied Biosystems | 4444556 |
| DNeasy Blood and Tissue Kit | Qiagen | 69504 |
| MMP2 ELISA Kit | Abcam | ab100606 |
| hCG ELISA Kit | CalBiotech | HC251F |
| Deposited data | ||
| Raw and Processed data | This paper | GEO: GSE172241 |
| A developmental landscape of 3D-cultured human pre-gastrulation embryos | Xiang et al., 2020 | GEO: GSE136447 |
| Single-cell RNA-seq reveals the diversity of trophoblast subtypes and patterns of differentiation in the human placenta | Liu et al., 2018 | GEO: GSE89497 |
| Experimental models: Cell lines | ||
| H9 (WA09); female | WashU GEiC | RRID: CVCL_9773 |
| WIBR3 (hESC); female | Whitehead Institute | RRID: CVCL_9767 |
| WIBR3-MECP2-GFP/tdTomato; female | Whitehead Institute | N/A |
| bTS5 (BT5) hTSC; female | Drs. Okae, Arima, and Pastor | RCB Cat# RCB4940 (RRID: CVCL_A6JH) |
| CT27 hTSC; female | Drs. Okae, Arima, and Pastor | RCB Cat# RCB4936 (RRID: CVCL_A7AZ) |
| CT30 hTSC; female | Drs. Okae, Arima, and Pastor | RCB Cat# RCB4938 (RRID: CVCL_A7BB) |
| Human Endometrial Stromal Cells-Immortalized | ATCC | CRL-4003 (RRID: CVCL_C464) |
| Human endometrial epithelial cells (EM-TERTs)-Immortalized | Dr. Pamela Pollock, Queensland Un. of Technology, Australia | N/A |
| MicroRNA probes | ||
| TaqMan MicroRNA Advanced Assay 477860_mir Assay Name: hsa-miR-16-5p | Applied Biosystems | A25576 |
| TaqMan MicroRNA Advanced Assay 478703_mir Assay Name: miR-1323 | Applied Biosystems | A25576 |
| TaqMan MicroRNA Advanced Assay 479396_mir Assay Name: miR-525-5p | Applied Biosystems | A25576 |
| TaqMan MicroRNA Advanced Assay 479485_mir Assay Name: miR-517a-3p | Applied Biosystems | A25576 |
| TaqMan MicroRNA Advanced Assay 478148_mir Assay Name: miR-518b | Applied Biosystems | A25576 |
| TaqMan MicroRNA Advanced Assay 478986_mir Assay Name: miR-519d-3p | Applied Biosystems | A25576 |
| Software and algorithms | ||
| FlowJo_v10.6.2 | FlowJo™ | RRID:SCR_008520; https://www.flowjo.com/ |
| Prism 9 | GraphPad | RRID:SCR_002798; https://www.graphpad.com |
| FIJI | NIH | https://imagej.net/Fiji |
| Amira | ThermoFisher | N/A |
| R 4.0.0 | R project | N/A; https://www.r-project.org/ |
| Cellranger 5.0.0 | 10Xgenomics | https://support.10xgenomics.com/single-cell-gene-expression/software/downloads/latest |
| ClusterProfiler 4.0.0 | Bioconductor | https://bioconductor.org/packages/release/bioc/html/clusterProfiler.html |
| Seurat 4.0 | Satija Lab | https://satijalab.org/seurat |
| pheatmap 1.0.12 | CRAN | https://cran.r-project.org/web/packages/pheatmap/index.html |