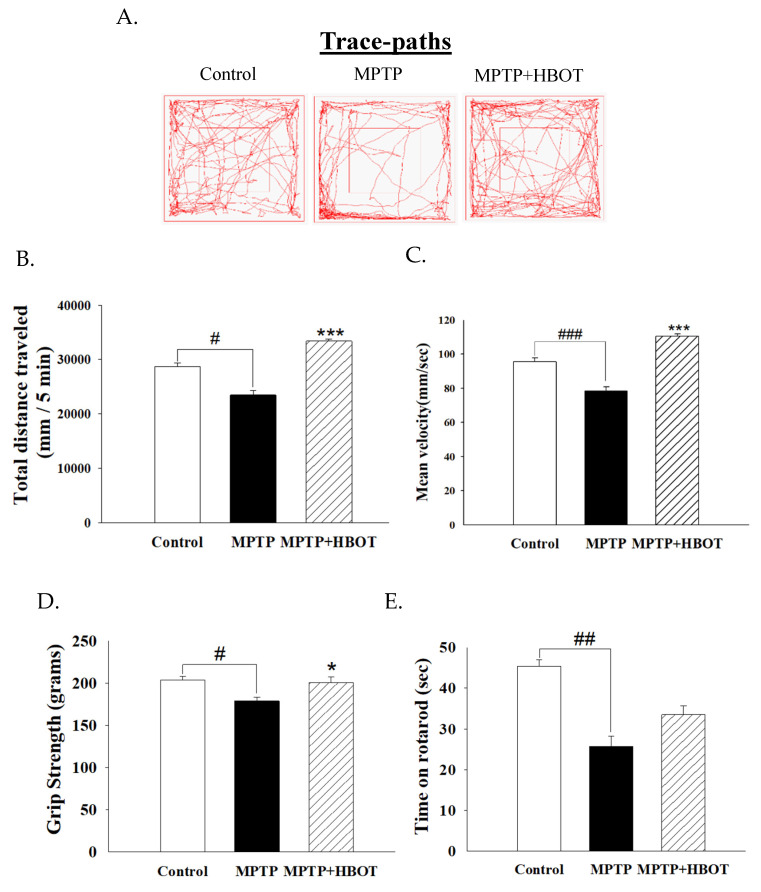
Figure 2.
Effects of HBOT on locomotor activity, grip strength and motor performance in MPTP-treated mice. For locomotor activity test, (A) trace paths, (B) total distance and (C) mean velocity of mice were recorded in 5 min. (D) The maximum whole-limb muscle force was measured by grip strength meter. (E) Latency to fall was measured by rotarod. All data are expressed as mean ± SEM (n = 5). # p < 0.05, ## p < 0.01 and ### p < 0.001 compared with the control group; * p < 0.05 and *** p < 0.001 compared with the MPTP group.

