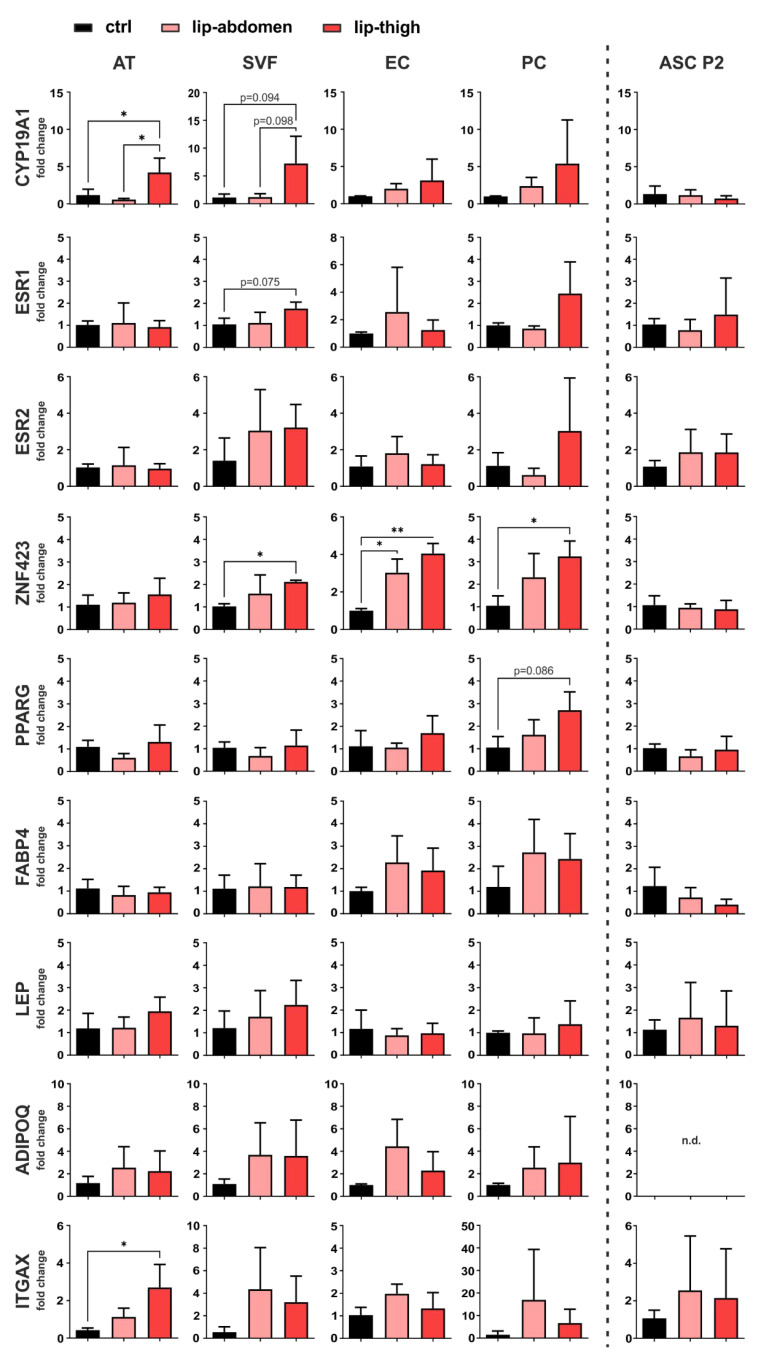
Figure 4.
Gene expression analysis of factors involved in local estrogen metabolism, adipogenesis and inflammation. Subcutaneous adipose tissue (AT) of the thigh region collected from healthy individuals (ctrl: n = 3) and lipedema patients (lip-thigh: n = 4), as well as abdominal AT of lipedema patients (lip-abdomen: n = 3) served to isolate the stromal vascular fraction (SVF), which was in turn sorted for CD31+ endothelial cells (EC) and CD45− CD31− CD146+ pericytes (PC). SVF was cultivated and passaged two times to collect adipose-derived stromal/stem cells (ASC P2). RNA was isolated and quantitative real-time RT-PCR for gene expression analysis was performed. Fold change in gene expression (log scale) is normalized to ctrl expression levels and shown as mean ± SD. The p-values indicate the statistical significance of the group comparison (one-way ANOVA, Tukey’s post-hoc test); * p < 0.05, ** p < 0.01. Abbreviations: CYP19A1: cytochrome P450 family 19 subfamily A member 1, aromatase; ESR1: estrogen receptor 1; ESR2: estrogen receptor 2; ZNF423: zinc finger protein 423; PPARG: peroxisome proliferator-activated receptor gamma; FABP4: fatty acid binding protein 4; LEP: leptin; ADIPOQ: adiponectin; ITGAX: Integrin subunit alpha X, CD11C, n.d.: not detected.

