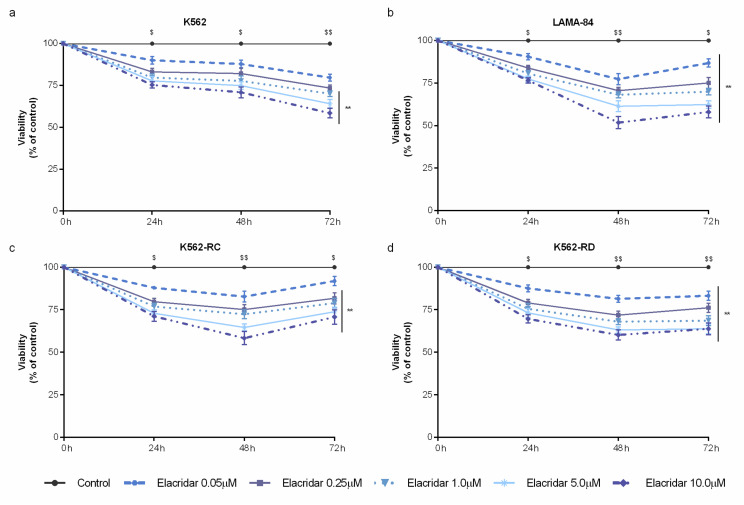
Figure 2.
Dose–response curves of elacridar on sensitive and imatinib-resistant CML cell lines. K562 (a), LAMA-84 (b), K562-RC (c), and K562-RD (d) cells were incubated in the absence and presence of different concentrations of elacridar as monotherapy during 72 h. Results were expressed as a percentage (%) normalized to control and represent the mean ± SEM obtained from nine independent experiments. ** p < 0.01; comparison with control); $ p < 0.05, $$ p < 0.01 (comparison with time 0 h).

