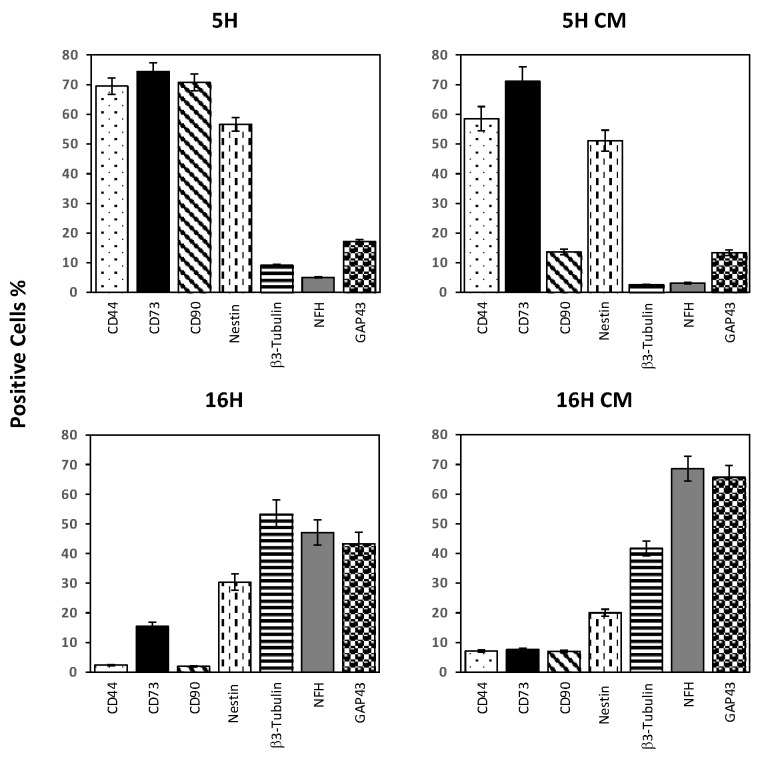
Figure 6.
Effects of hypoxia on the phenotypic expression profiles of DPSCs treated with CM enriched by hypoxia. Flow cytometry analysis of DPSC-treated groups; 5H CM and 16H CM were compared with the 5H and 16H groups to determine the profile of expression of several neuronal and stem markers. Histograms indicate the means ± SE of three different experiments.

