Abstract
This is the first report of a prototype that allows for real-time interaction with high-resolution cellular modules using GLASS© technology. The prototype was developed* using zStack data sets which allow for real-time interaction of low polygon and direct surface models exported from primary source imaging. This paper also discusses potential educational and clinical applications of a wearable, interactive, user-centric, augmented reality visualization of cellular structures. * Prototype was developed using IMARIS© , ImageJ© , MAYA® , 3DCOAT© , UNITY© , ZBrush© , OcculusRift® , LeapMotion© , and output for multiplatform function with Google GLASS© technology as its viewing modality.
Introduction
The practice of clinical medicine requires an understanding of complex physiological systems at both the cellular and higher anatomic levels. Confocal laser scanning microscopy (CLSM) and scanning electron microscopy (SEM) are current methods used to visualize cellular structures.
Confocal Laser Scanning Microscopy
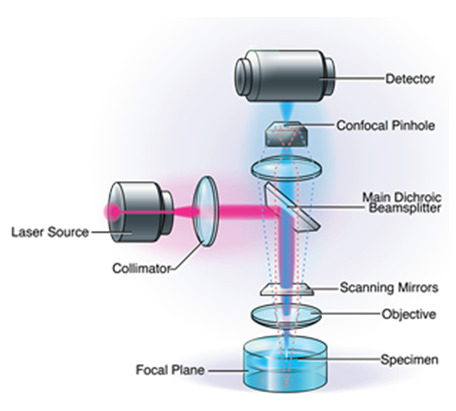
Widely used in the biological sciences, CLSM is used to provide non-invasive optical sectioning of intact tissue in vivo, with high image resolution (Pawley 2006). When compared to conventional microscopy, CLSM offers significant advantages, including a controllable depth of field, the elimination of image degrading out-of-focus information, and the ability to collect serial optical sections from thick specimens (Pawley 2006; Wilhelm et al., 1997). However, a key tradeoff of CLSM is that it is reliant on light, which ultimately limits its degree of magnification and resolution, and may be problematic when attempting to visualize extremely detailed biological structures (Alhede et al., 2012).
Confocal Laser Scanning Microscopy.
Scanning Electron Microscopy
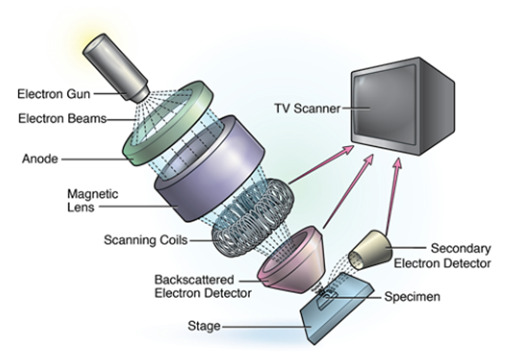
Another visualization technology in the biological sciences is SEM. SEM is used widely in clinical medicine, from neurobiology evaluating neuronal cell growth to regenerative medicine focusing on nerve repair (Mattson et al., 2000; Guénard et al., 1992). When compared to traditional light microscopy, SEM offers a greater depth of field, allowing for more of a specimen to be in focus at one time. In addition, SEM provides a much higher image resolution, meaning that closely spaced specimens can be magnified at much higher levels (Purdue University 2014). While CLSM is better suited for visualization of general structures, SEM is superior when a higher magnification is needed, and when attempting to visualize the spatial relationships between cells (Alhede et al., 2012). However, while SEM may provide superior image resolution it cannot be used in vivo , which ultimately limits its application in both clinical medicine and medical training.
Scanning Electron Microscopy.
zStack Datasets and MRI/CAT Scanning in Medical Imaging
If CLSM data allows for in vivo use but is ultimately limited by its resolution, and SEM allows for superior resolution but cannot be performed in vivo , then modern 3D imaging techniques allow for new possibilities for in vivo medical visualization at the nanometer scale. These new advances in medical visualization rely on medical imaging technologies such as magnetic resonance imaging (MRI) and computed axial tomography (CAT). These imaging technologies allow for extremely high image resolution of clinical specimens (Diffen.com 2014). These images can be "stacked" by combining multiple images taken at different levels of focus (Condeelis 2010). This technique allows for greater depth of field (the Z-plane, ergo Z-stacking) than originally apparent in the individual source images. Focus stacking is valuable, as it allows for the creation of images that would be physically impossible to capture with normal imaging techniques. Also of critical importance, is that these medical imaging technologies can be performed in real time on in vivo specimens (University of Houston 2014). While the use of zStack data sets in medical imaging holds tremendous promise, one of its limitations, despite providing real time imagining of in vivo tissue, has been its application in clinical medicine.
Interactive, User-centric, Augmented Reality Visualization of Cellular Structures
To fully leverage the tremendous advances in medical imaging and resolution offered by zStack data sets and MRI/CT data in medical education and clinical medicine, it is necessary to develop new systems to more effectively connect users with this information. Advances in interactive 3D graphics and augmented reality offer novel data-fusion approaches that allow for users to meaningfully interact in an immersive environment, while achieving unparalleled high-resolution visualization (Chiew et al., 2014). This article is the first report of a software prototype that allows users to interact in real-time with high-resolution cellular models using GLASS© technology.
Prototype Procedure and Pipeline for Developing Neuronal Model
The procedure, as illustrated below in the overall process graphic (Figure 1 ), starts with obtaining data in the form of "stacks" of voxel, based on imaging derived from CSLM. This information is then input into a software application, called FIJI, via an algorithm, which creates a 3D surface rendering of the zSTACK information based on theoretical in vivo samples. Initially, Imaris was the first choice of software for creating 3D renderings of the zStack data, however, FIJI was subsequently used, based on the National Institute of Health's development and support of this open source software.
Figure 1.

Overall Procedure Graphic
The cellular image selected was considered suitable, due to the clarity of the subject matter (Figure 2 ). The stack of pixel based images was opened and viewed as a flat 2D stack of images, which can be evaluated much like a stack of voxel based CT images, using software such as a PAC's viewing workstation.
Figure 2.
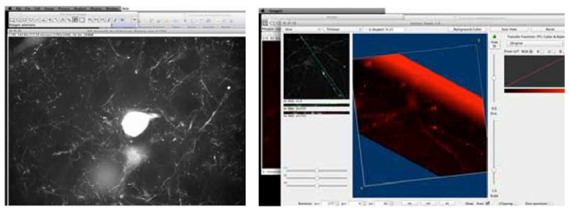
Z-stack from rat brain cortex showing a subset of fluorescent-protein expressing neurons and microglia.
To view the image in a 3D environment, a 3D surface volume rendering was created using the 3D viewer plug-in for FIJI, via ImageJ. The 3D view was then calculated by the FIJI surface rendering algorithm, using the PLUG-INS drop down menu. This converts the pixel-based stacked images into a 3D volume, utilizing voxels. Once a 3D surface volume rendering was created, the image could be viewed and manipulated using a 3D surface based representation of a point cloud mesh, created by the software of a specified surface or resolution, within the zStack data set (Figures 3 to 6 ).
Figure 3.
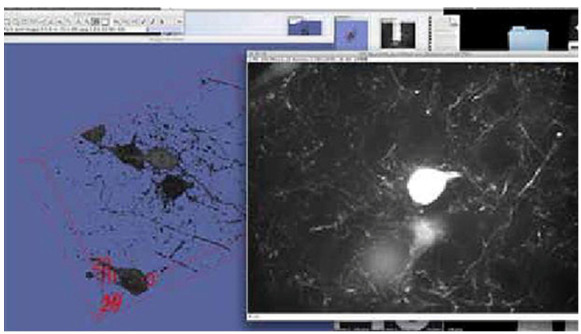
Viewing the neuron zStack data set within FIJI; This image was taken within FIJI showing (right) one single plane of a zStack data set taken from a larger stack of image planes comprising a full zStack data set. The neuron body is displayed as a white mass in the center of the single plane image. The surrounding web-like structures are component parts of the main neuron and surrounding neurons. This single plane image is accompanying the 3D surface rendering of the neuron full data set (blue), with the neuron body and component structures displayed in black. A 3D cube can be seen surrounding the full 3D data set, corresponding to its position in 3D space.
Figure 6.
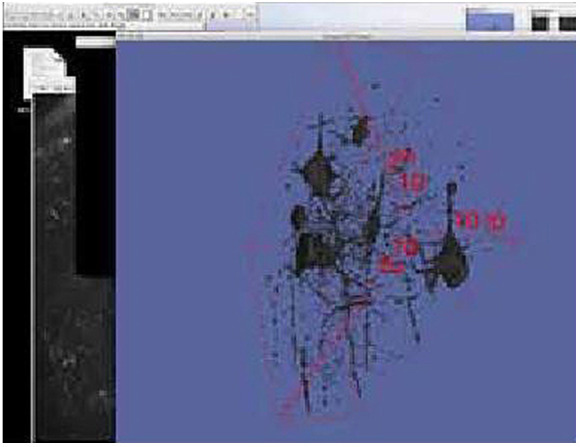
Viewing 3D Volume Rendering; The 3D surface rendering at the highest level of threshold, after it has undergone one pass of selection and deletion within FIJI by lasso selecting on single plane images, similar to segmentation processing of DICOM imaging in a PAC’s viewing workstation. The 3D surface rendering seen here is the exact model used for retopologization and importation into UNITY.
Figure 4.
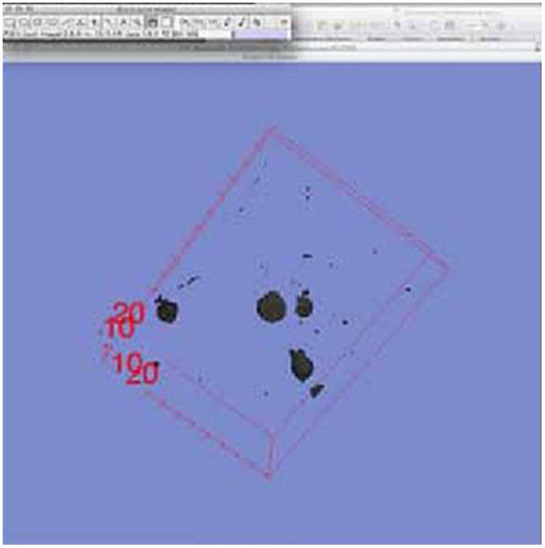
Creating a 3D volume rendering; This image is the 3D surface rendering of the neuron data set within FIJI at the lowest threshold level. A 3D cube is visible surrounding the structure indicating its position in 3D space. This is the lowest threshold level 3D surface rendering, viewed from within FIJI, and is what was used for the lowest threshold model directly in UNITY.
Figure 5.
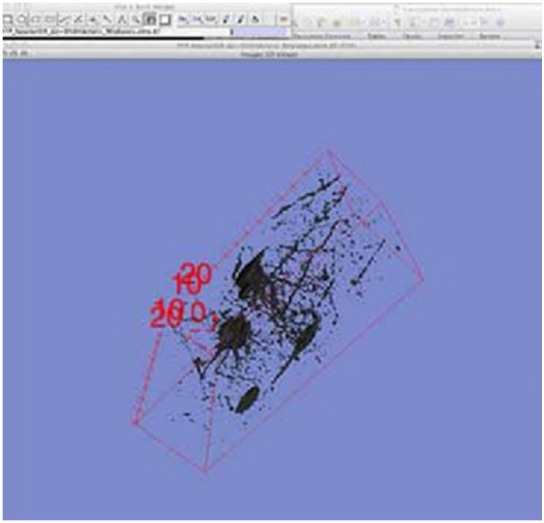
Isolating the neuron for export; The neuron data set within FIJI, as a 3D surface render. A red box is visible around the neuron to indicate the 3D dimension and position of the neuron model along with x,y,z coordinates, indicated in the four corners of the neuron. The black structures within the 3D cube are the neuron zStack data set, set at the fourth level of threshold. The structure of the neuron has already undergone one round of selection and deletion within FIJI.
The objective in this initial stage was to obtain usable 3D meshes that could be imported into UNITY. Imaris was used to develop 3D volume renderings. This was important, as UNITY is a game engine (simulation platform) that allows Augmented Reality interactivity with the 3D image and permits for development across multiple platforms, including Android and iOS. To accomplish this, the images needed to be in a quadrangulated .obj format so that they could be imported into UNITY smoothly, without limiting functionality within the simulation platform (UNITY 5; Figures 7 and 8 ). At least two levels of resolution (four resolution meshes are optimal) are needed to create an interactive experience within the Augmented Reality output. These two distinct meshes would independently have interaction added to each of them within UNITY. Optimally, four levels of resolution were desired as output models from FIJI. These levels of resolution would correlate with internal cellular structures (e.g., cell membrane, organelles, etc.).
Figure 7.
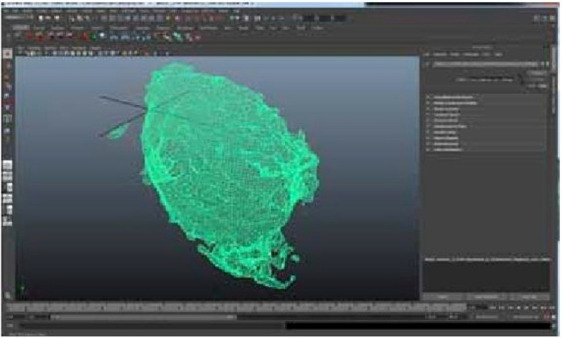
Interior section of neuron model in Maya - triangulated Mesh.
Figure 8.
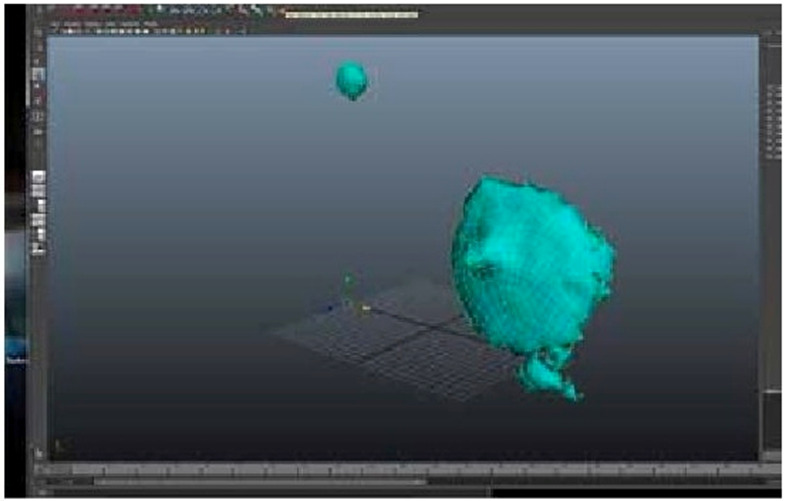
Quadrangulated mesh
The first level of resolution was the outermost surface volume. This first resolution is set at a high threshold to provide the lowest possible resolution that will ultimately translate to the most interior portion of the overall volume of the neuron. The threshold function can be modified in certain software, to give further resolution of a distinct region of interest within the surface volume, based on specific structures of the subject.
In the end, all four resolution meshes were obtained by simple inspection of imaging and adjustments within the threshold function and set to be exported as triangulated meshes, based on the surface volume rendering of each resolution. When importing the initial zStack data, set surface volume must be selected prior to volume rendering. Once surface is selected, the threshold for each volume can then be adjusted with the 3D viewer plug-in. For real use inside engine software (UNITY 5), models must conform to the edge flow theory of 3D modeling. Without this consideration, the resulting imported mesh straight would result in a point cloud triangulated mesh, which is virtually unusable for producing a functioning prototype. Figures 7 and 8 depict the exported mesh in its original triangulated topology, compared to the final, usable, retopologized, quadrangulated mesh models.
One of the major challenges of this project centered on exporting point cloud triangular meshes from FIJI into UNITY. The complexity of a triangulated mesh does not permit existing mathematics to be run quickly enough by any current 3D software to make triangulated meshes usable beyond the function of simple rendering. To compute the full mesh of a volume, the software will calculate its overall volume by connecting the X, Y, and Z points with a triangle. The surface is then covered volumetrically to form an outer shell or "mesh" based on the volume of a given object. This process creates a mesh which can then be "understood" by a 3D animation and rendering software. This challenge was overcome through a process known as retopologizing, which allows for the creation of a quadrangular mesh that could be exported directly from the CLSM data.
Exporting into MAYA
Once the triangulated mesh was exported, it was then opened in Maya for a general inspection of the triangulated mesh. The mesh, at each of the four resolutions, was opened in Maya one at a time, in preparation to all be integrated together, after the cleanup and separation was completed. As seen in Figures 9 to 11 , there are multiple levels of resolution or threshold aligned side by side from right to left, for comparison. At this stage, the priority was the separation of just one neuron from a complex web of dendrites. Note in Figures 9 to 11 , that the mesh on the far left is the highest level of resolution (i.e., the outermost layer of the neuron or cell membrane).
Figures 9, 10 and 11.

Three levels of neuron body in MAYA directly imported from FIJI.
Moving from left to right, each successive level, shows the single neuron separated from the larger mesh of many neurons included in the original zSTACK image. This particular neuron was chosen because of its ability to be separated from the block of neuron axons and dendrites throughout the block of imaged tissue. Once the export is completed, the model was ready to be imported into 3D for retopologization of the mesh. The remaining mesh at each resolution and the target neuron can be seen in Figures 12 and 13 .
Figure 12.
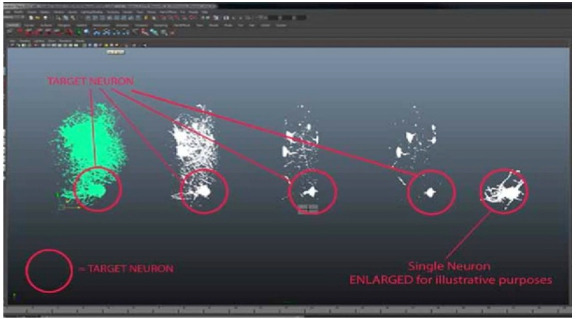
Red circles show neuron separation from zStack dataset mesh imported from FIJI.
Figure 13.
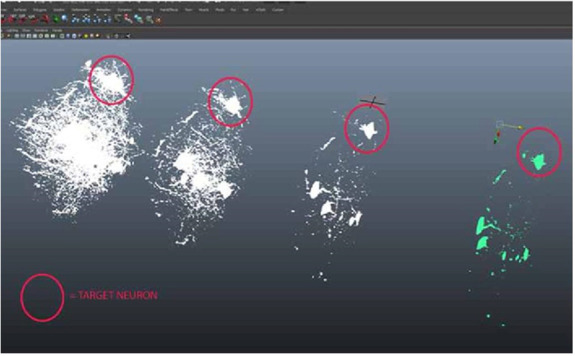
Red circles show neuron separation from zStack dataset mesh imported from FIJI.
Retopologization
At this stage, each of the four resolutions has been prepared for importation into the 3D coat for retopologizing. The ultimate goal of the procedure is to achieve a retopologized and quadrangulated model, with proper edge flow, that can be used without modeling or handling issues when interactive behaviors are added within UNITY. Analysis of the structure of the 3D volume model is necessary to determine how closely to follow the morphology of the original model. It is necessary to follow the original output of the neuron morphology (original exported triangulated surface mesh) to stay true to the original imaging modality (zStack/FIJI). While the specific procedure will change with each target structure being retopologized and optimized, this is a key step, ensuring that the ultimate model maintains its accuracy.
Importing into UNITY 5
Once the retopologized mesh was completed at each of the four thresholds, the model was ready for exportation from MAYA and importation to UNITY. Bringing the model, at all four thresholds, into UNITY effectively creates a pipeline for interaction within the UNITY simulation platform. UNITY 5 offered the best solution, in terms of providing a simulation environment for the neuron model. Interaction can be added by way of the prepackaged UNITY 5 options and scripts. Furthermore, UNITY 5 conveniently uses a choice of scripting languages (i.e. C#, JavaScript, etc.) which are standard scripting languages used across the commercial game and design developer’s toolbox, including Web and OSX, as well as, Android. There are a range of potential ways that this procedure could be further expanded upon.
A brief description of the UNITY translation to augmented reality/virtual reality interaction, highlights possible solutions for further exploration into more complex interactive user features. In UNITY, the model of all four resolutions (four separate models, one for each resolution) of the neuron were imported and placed into a new scene and aligned on a horizontal axis. Several directional lights (set to blue and emission values adjusted per aesthetic) were added to the scene in four locations, just superior to each of the four threshold models, to add a lighting system that would match the final prototype interface. The prototype interface was added in the lower left hand corner as a simple plane, with attributes set to glass as its material. A premade user interface design, created in Adobe Illustrator, was added in the material attribute of the glass plane. This served as a sample interface design. Note that an interactive user interface (GUI) can be added within UNITY as buttons with C# scripting, or direct GUI with C#, to provide functionality. There are multiple options within UNITY to provide a user interface, and each option will vary in interactivity and production complexity. Furthermore, the interactive attributes, such as switching scenes, resetting location, animation triggers, etc. can be applied to the GUI and will also vary in production complexity.
Once the four models, as well as direct lighting, and GUI were placed into the two UNITY scenes, interactive behaviors need to be added to each of the four resolution models. To do this, four sphere colliders were added to the scene and sized proportionally to each neuron threshold. This was the simplest way to provide interaction with the neuron models within UNITY. This approach was used for this prototype to keep the workflow as simple, and direct, as possible so automation of this procedure would be easier to implement if the prototype progressed to Phase 2 of development. Note that this approach is not the only possible workflow to add interaction to the models, and that UNITY offers many solutions to add scripting, triggers, colliders and interaction to models, including Mesh colliders and direct addition of C# scripting, which functions similarly to variable action script (UNITY 2016). The sphere colliders were placed within each threshold neuron model and parented to the corresponding model. Physics were added to each sphere collider though the attributes menu. Drag was set very high, at 1000, and gravity was turned off. Sticky attributes on each of the colliders were also turned on and adjusted per desired effect, to provide more control and prevent “fly off” of structures when the leap motion controller kit was added. The last procedural step to the UNITY file was addition of the Leap Motion controller kit.
For direct-from-imaging-source data integration, the same pipeline is followed without including the retopologizing step. For the purposes of this project, this direct data integration prototype was necessary, to highlight the possible options inherent in the use of a direct-from-source imaging workflow. While the direct imaging data for each neuron threshold was possible to achieve, the models without retopologizing remain in a triangulated mesh format. This mesh format causes various problems within the simulation platform, such as transparencies in undesirable locations, loss of mesh format when applied to colliders, uncontrollability of objects and system crashes. These issues led the team to determine that while direct-from-imaging-source data is possible to use, further work within software development is necessary to improve UNITY simulation platform integration.
Leap Motion Integration
At this stage the retopologized models and the direct imaging models were loaded to the UNITY platform, into one combined scene. This full UNITY scene has two scenes in one file, and can flip back and forth between the two scenes as layers by using the GUI. The scene was ready for the hand tracking integration, using the Leap Motion controller. A new asset bundle was imported using the Import New Package function, under the Assets menu. The physical controller was plugged into the USB port and placed as per controller specifications. The “play mode” was pressed within UNITY and hands, represented as black talon like representations of the human hand, were now controlled via the Leap Motion controller and its motion tracking algorithm. See Figures 14 to 24 for examples and screenshots of integration with direct and retopologized mesh prototype.
Figure 14.
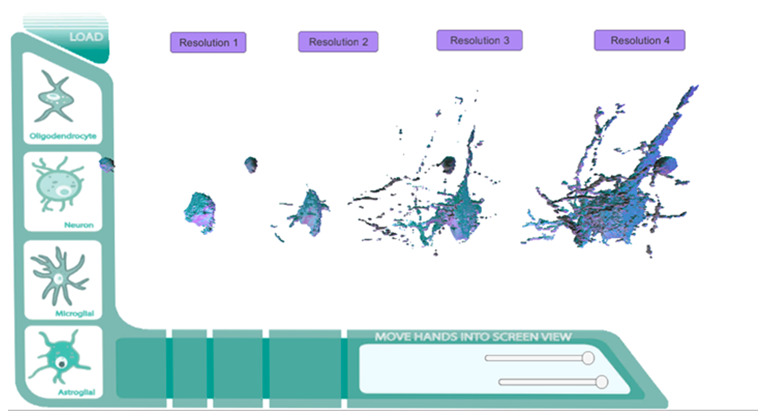
Direct Mesh (FIJI to MAYA to UNITY 5) prototype screen with Leap Motion integration.
Figure 15.
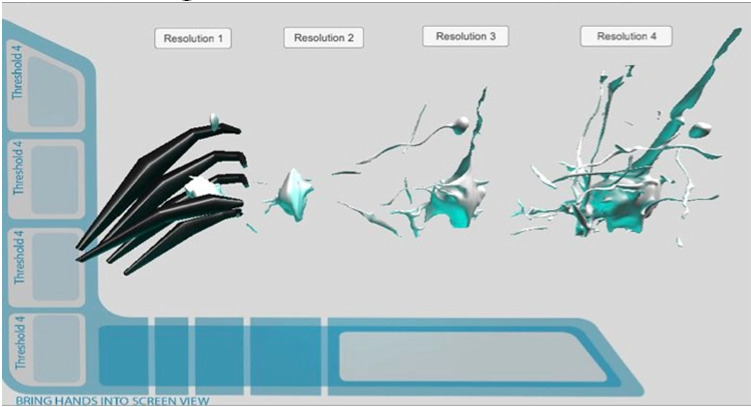
Prototype with Leap Motion integration (Hand=Black). Showing direct motion tracking involvement capabilities and physical interaction.
Figure 16.
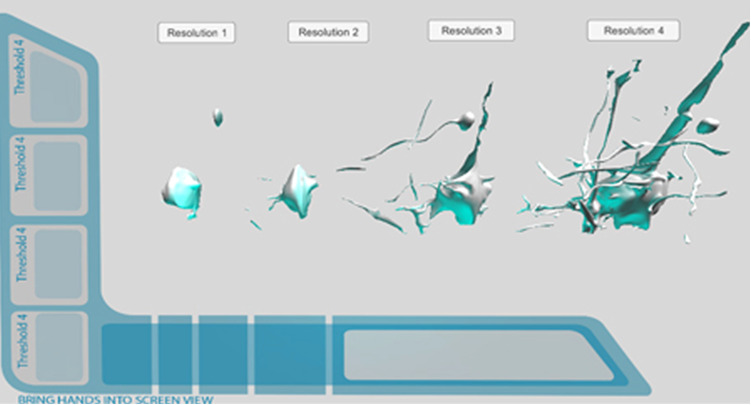
Prototype layout. Neuron levels 1-4.
Figure 17.
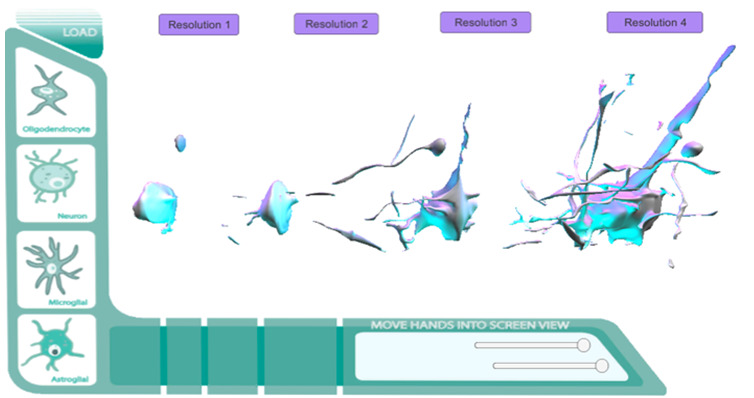
Final Prototype. Histo/Cyto educational model GUI added.
Figure 18.
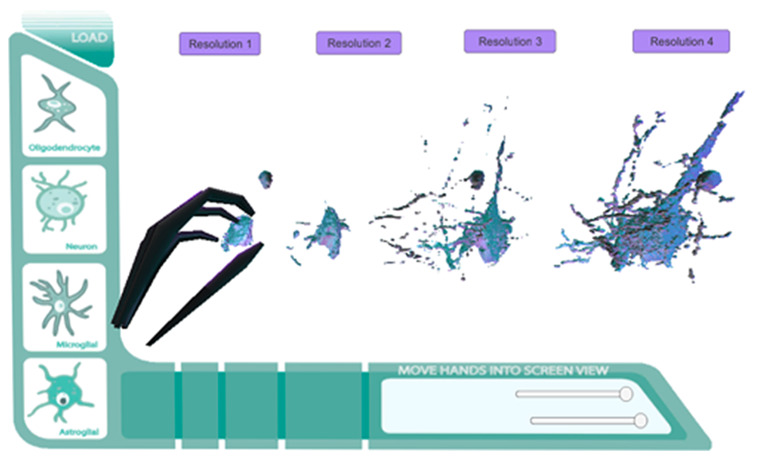
Final Prototype Direct Mesh Screen with Leap Motion integration.
Figure 19.
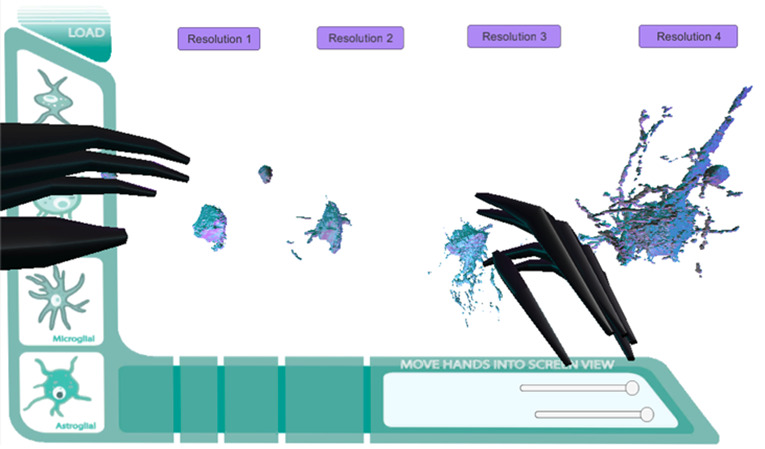
Final Direct Mesh Prototype. Histo/Cyto educational model GUI added. Leap Motion integration. (Hand=Black).
Figure 20.
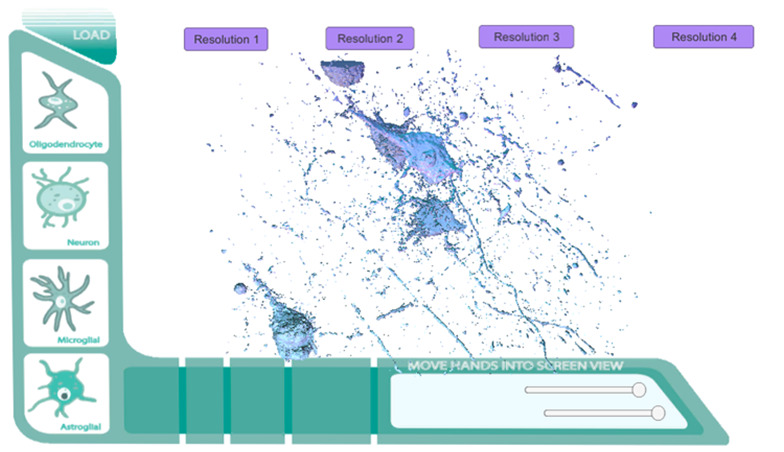
Full Direct Mesh Prototype. Full zStack data set directly imported into prototype.
Figure 21.
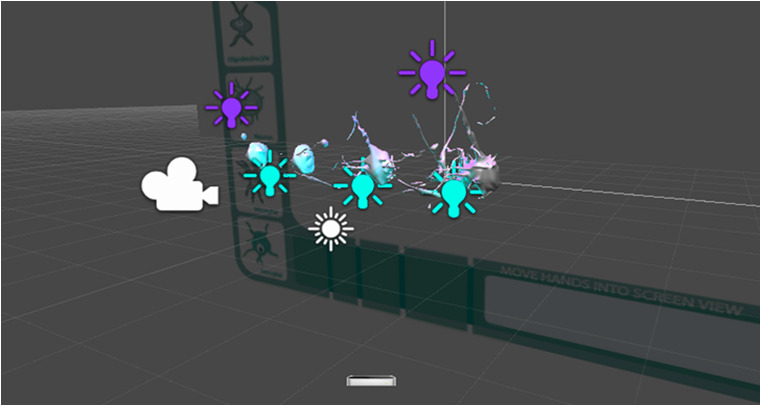
Building prototype in UNITY 5.
Figure 22.
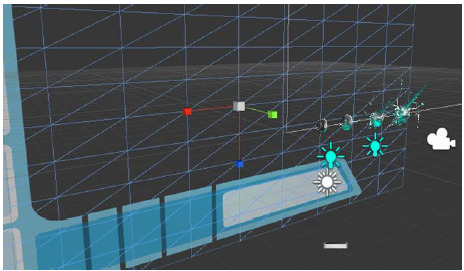
Building prototype in UNITY 5. GUI layout.
Figure 23.
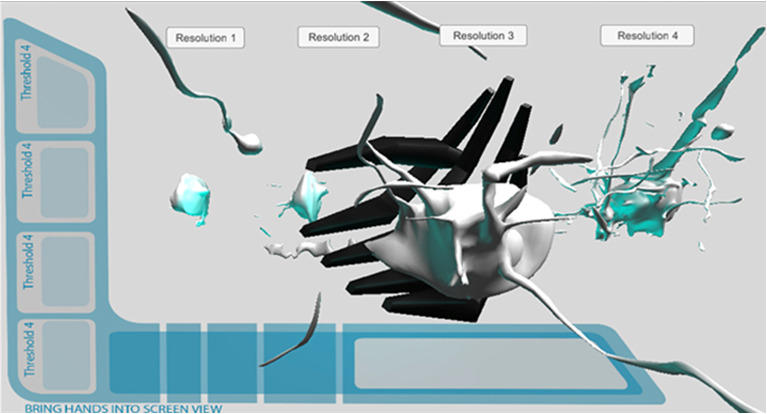
Retopologized Mesh Prototype. Leap Motion integration.
Figure 24.
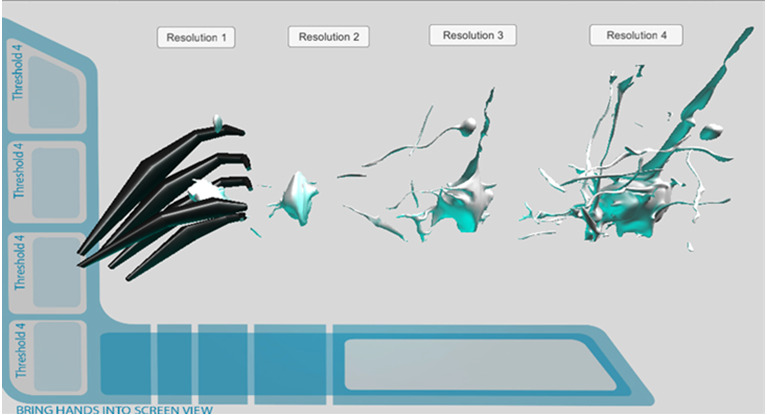
Retopologized Mesh Prototype. Leap Motion integration Early Stages of Development.
Summary of Procedure / Output to Wearable Devices / Augmented Reality Output
The end result of the procedural algorithm, detailed here, is the creation of a user centric, augmented reality, high resolution visualization of a human neuron. Using zStack data sets, and a range of software platforms, this procedure has the ability to deliver output for multiplatform function with Epson Moverio© , OcculusRift© , and GLASS© technology, such as Google GLASS and MICROSOFT HoloLens© . The procedure for output to augmented reality is relatively simple, using the end output UNITY file. Each device or headset will require their own proprietary SDK be used for integration to their product. For the purposes of this algorithm, Epson Moverio© was used as the end modality, but any wearable device can be utilized. See Table 1 for an overview of the entire process.
Table 1.
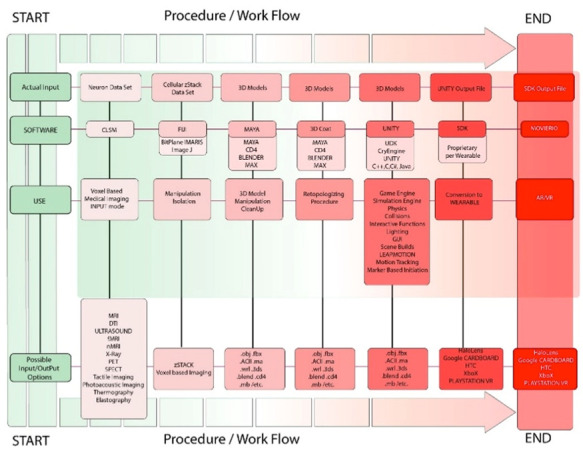
Procedure/workflow illustrating the progression from data input through 3D modeling to AR/VR output
Technical Directions and Uses
The prototype that was developed for this project has the potential to serve as a launching point for further development across a variety of applications. There are several directions of development that have been considered and planned, as this prototype moves to Phase 2. Phase 2 development will enable the application of this new technology in various fields, from clinical research to educational uses.
From the perspective of medical education, this technology can be applied to simultaneous real-time group usage (where more than one participant would be viewing or investigating the augmented reality/virtual reality structures through the wearable headgear). Additionally, a marker based initiation system (Siltanen 2012) can be implemented through UNITY with Leap Motion and would enable all participants of the group to see the same augmented reality/virtual reality structures from different vantage points in real-time. Full groups of users would be able to access the visual information and interact with it in a real-time scenario in the same location or even multiple locations. If each wearable device were linked to the same system, and accessing the same hardware, real-time individual, yet separate, interaction with visual structures could be achieved. This would allow a group interface and interaction with a single data set in real-time and would have significant educational applications, such as for anatomical education.
Morphology or 3D shape of a visual structure, especially when applied to pathology, cytology and histology, is significant and can be used as a tool of direction and learning on a very complex and deeply layered scale. With this inherent educational value in intuitive investigation of shape and morphology, we can see how the future application and integration of tools and user centric functions within UNITY, such as distance determination and measurement, density visualization and directional determination functions can be applied, increasing the value of this prototype. Simple interaction within the prototype, with hand gestures and motion tracking allowing for measurement of structures, visual inspection of region of interest and investigation of specific groups of structures, can be added to this procedure without excessive amounts of production time. This simple user functionality would increase the usability of the technology within research and educational platforms that rely heavily on structural morphology and shape.
A “4D” or time-lapse function could be added relatively simply within UNITY through UNITY’s animation system, Mecanim (UNITY 2016). This function could allow the user to interact with a running animation of a time-lapse cycle of cellular and molecular processes. It is this research team’s opinion that if the addition of the above proposed functionality (distance interpretation, density visualization and directional measurements) were integrated within our prototype, more information could be gained toward the understanding of not only cellular pathways and cellular resolution mechanics, but potentially of molecular dynamics.
Future Software Development Directions and Uses
Looking ahead to fully automating the procedure presented here should be the highest priority when approaching new software development and implementation in combination with, or in addition to, the software used in this prototype. While the previous section describes achievable solutions and extensions of the procedure, implementation of further testing and quantitative and qualitative data collection of the benefits of the prototype could begin in a medical education setting.
The addition of selection functions, per region of interest, by touch interaction with 3D structures would be a monumental leap forward in the use and manipulation of large data sets related to cellular level research. A touch selection function could potentially be integrated based on vertices of a structural mesh within UNITY, such as a marching cubes algorithm. Marching cubes is a computer graphics algorithm for extracting a polygonal mesh of an isosurface from a 3D discrete scalar field, also known as voxels (Lorensen 1987). The applications of this algorithm are mainly concerned with medical visualizations within CT and MRI scan data images, and special effects or 3D modeling with what is usually referred to as metaballs or other metasurfaces. An analogous 2D method is called the marching squares algorithm (Nielson 1991; Hansen 2005). The same touch selection function could be implemented with the Voronoi point seed placement algorithm (Sanchez-Gutierrez et al., 2016; Reem 2009). This approach functions similarly to these algorithms and could be added with a deletion or mobility function, meaning that large data sets could be subtracted from, or added to, with simple touch interaction. From a research perspective, with integration of this function, the analysis, grouping and correlation level of study could aid in making large data sets more user friendly (Klauschen et al., 2009).
If we are to discuss the possible directions of touch and selection integration, we must also discuss a magic lasso approach to selection in the same fashion (Patterson 2016). The addition of the intuitive hand gesture magic lasso selection would have some of the same quantitative results with its integration in the user centricity and educational value. If a selection system based on hand motion and generalized “lasso” selection was integrated, the manipulation and investigation of larger sets of data (where more data could be deleted and disregarded quickly) could be executed more quickly and effectively.
Lastly, in terms of the additional functionality for future directions with this prototype, more attention will be given to the integration of education based functions. For example, within UNITY, simple variables, like action scripting if/then functions (UNITY 2016), can be tagged to specific touch interactions. If I touch this portion of a structures mesh, then I receive information pertaining to that specific component of the structure. Interactive hit testing and quizzing can occur in various formats related to structure and anatomy, whereby increasing the learning component associated with 3D structural examination. It is important to note that the GUI created in this prototype was done so to show possible solutions for accessing multiple data sets spanning across multiple cell and tissue types and stored in one central server location. For example, when the user interacts with a touch initiated GUI, UNITY would be able load the new data set within the central scene. Without an instantaneous retopologization function, premade cellular resolution models can be loaded into the UNITY scene from an external server location.
Applications in Medical Education and Clinical Medicine
Histology and Anatomy Education
One of the exciting aspects of this prototype is its potential to radically change how students study cellular histology and anatomy. Research in medical education has previously evaluated the efficacy of earlier forms of augmented reality learning systems in medical education to promote conceptual understanding of dynamic models and complex causality. Studies have confirmed the value of these enhanced learning modalities to foster greater knowledge retention and understanding (Wu et al., 2013; Thomas et al., 2010; Blum et al., 2012). However, this initial work has focused primarily on anatomy education and surgical simulation, using interactive models, and has not evaluated the potential use of real-time patient datasets obtained from MRI/CT information. Augmented reality technology has the potential to make medical learning less abstract and more realistic.
Neurology and Surgical Planning Applications
The use of zStack data sets in medical imaging has recently seen wide adoption in Neurology. Neurobiology researchers are currently using 3D visualization technology to study and evaluate the reperfusion of neuronal cells, following cerebral ischemia, and to evaluate neuroinflammation and myelin loss. Another area of interest for this technology is related to neurosurgical operation planning. By creating a real-time, interactive, augmented reality model, using a patient’s own imaging data, surgeons can work to develop a “flight plan” prior to initiating neurosurgery, to avoid key areas of the brain, providing potential benefits and improved outcomes.
Protein Expression Visualization
Another major clinical application of this technology is in 3D protein expression visualization, allowing for real-time visualization of protein distribution in vivo . Current research has begun to explore the correlation between changes in local protein distributions caused by diseases, such as cancer, Alzheimer’s disease, Parkinson’s disorders. Both invasive and noninvasive imaging techniques could provide a more informative and complete understanding of these diseases.
Conclusion
This article serves to report on the development of a working prototype that provides an interactive, user-centric, augmented reality visualization of cellular structures using deconvoluted, zStack datasets. This allows for real-time interactivity of cellular models without sacrificing accuracy.
Biographies
R. Scott Riddle, MFA Medical Illustration , is a medical illustrator and co-founder of Photon Biomedical, an innovative medical animation, 3D-modeling and augmented reality (AR) / virtual reality (VR) content creation agency for the healthcare industry. He has previously worked in biotech, defense and pharmaceutical industries developing medical visualization. His interests include bringing the latest in 3D animation and augmented reality into medical education and clinical medicine.
Daniel Wasser, MD , received his medical degree from Tel Aviv University and is the other co-founder of Photon Biomedical. Dr. Wasser has extensive experience in clinical medicine, scientific communications, and health technology. Additional interests include advancing medical education and bridging the gap between technology and clinical medicine to enhance patient outcomes. Dr. Wasser can be reached at daniel@photonbiomedical.com .
Michael McCarthy, MEd , is a technology and education specialist with experience in applying the latest in instructional design to the development of user interfaces. His interests include software design and applying established adult learning principles to enhance and streamline the user experience of cutting-edge technology.
References
- Alhede M, Qvortrup K, Liebrechts R, Høiby N, Givskov M, et al. 2012. . Combination of microscopic techniques reveals a comprehensive visual impression of biofilm structure and composition . FEMS Immunol Med Microbiol . 65 (2 ), 335 -42 . 10.1111/j.1574-695X.2012.00956.x [DOI] [PubMed] [Google Scholar]
- Blum T, Kleeberger V, Bichlmeier C, Navab N. 2012. Miracle: an augmented reality magic mirror system for anatomy education. In: Proceedings of the 2012 IEEE virtual reality; 2012 March 4-8, Orange County, CA, USA. [Google Scholar]
- Chiew WM, Lin F, Qian K, Seah HS . 2014. . A heterogeneous computing system for coupling 3D endomicroscopy with volume rendering in real-time image visualization . Comput Ind . 65 (2 ), 367 -81 . 10.1016/j.compind.2013.10.002 [DOI] [Google Scholar]
- Condeelis J, Weissleder R . 2010. . In vivo imaging in cancer . Cold Spring Harb Perspect Biol . 2 (12 ), a003848 . 10.1101/cshperspect.a003848 [DOI] [PMC free article] [PubMed] [Google Scholar]
- Diffen.com. 2014. CT Scan vs MRI. Diffen LLC, n.d http://www.diffen.com/difference/CT_Scan_vs_MRI . Published 2014. Accessed Nov 15, 2014.
- Guénard V, Kleitman N, Morrissey TK, Bunge RP, Aebischer P . 1992. . Syngeneic Schwann cells derived from adult nerves seeded in semipermeable guidance channels enhance peripheral nerve regeneration . J Neurosci . 12 (9 ), 3310 -20 . [DOI] [PMC free article] [PubMed] [Google Scholar]
- Hansen CD, Johnson CR. 2005. Visualization Handbook . Oxford, UK: Elsevier, Inc. [Google Scholar]
- Klauschen F, Qi H, Egen JG, Germain RN, Meier-Schellersheim M . 2009. . Computational reconstruction of cell and tissue surfaces for modeling and data analysis . Nat Protoc . 4 (7 ), 1006 -12 . 10.1038/nprot.2009.94 [DOI] [PMC free article] [PubMed] [Google Scholar]
- Lorensen WE, Cline HE . 1987. . Marching cubes: A high resolution 3D surface construction algorithm . Comput Graph . 21 (4 ), 163 -69 . 10.1145/37402.37422 [DOI] [Google Scholar]
- Mattson MP, Haddon RC, Rao AM . 2000. . Molecular functionalization of carbon nanotubes and use as substrates for neuronal growth . J Mol Neurosci . 14 (3 ), 175 -82 . 10.1385/JMN:14:3:175 [DOI] [PubMed] [Google Scholar]
- Nielson GM, Hamann B. 1991.The asymptotic decider: resolving the ambiguity in marching cubes. Proceedings of the 2nd conference on Visualization (VIS '91). Los Alamitos, CA: IEEE Computer Society. 83-91. [Google Scholar]
- Patterson S. 2016. The Magnetic Lasso Tool in Photoshop. http://www.photoshopessentials.com/basics/selections/magnetic-lasso-tool/ . Accessed April 3, 2016.
- Pawley JB. 2006. Handbook of Biological Confocal Microscopy (3rd ed.) . Berlin: Springer. [Google Scholar]
- Purdue University Radiological and Environmental Management. 2014. Scanning electron microscope. http://www.purdue.edu/ehps/rem/rs/sem.htm . Accessed Nov 15, 2014.
- Reem D. 2009. An algorithm for computing Voronoi diagrams of general generators in general normed spaces. Proceedings of the 6th International Symposium on Voronoi Diagrams in science and engineering , 144–152. [Google Scholar]
- Sánchez-Gutiérrez D, Tozluoglu M, Barry JD, Pascual A, Mao Y, et al. 2016. . Fundamental physical cellular constraints drive self-organization of tissues . EMBO J . 35 (1 ), 77 -88 . 10.15252/embj.201592374 [DOI] [PMC free article] [PubMed] [Google Scholar]
- Siltanen S. 2012. Theory and applications of marker-based augmented reality. VTT Technical Research Centre of Finland. http://www.vtt.fi/inf/pdf/science/2012/S3.pdf . Accessed April 1, 2016.
- Thomas RG, John NW, Delieu JM . 2010. . Augmented reality for anatomical education . J Vis Commun Med . 33 (1 ), 6 -15 . 10.3109/17453050903557359 [DOI] [PubMed] [Google Scholar]
- User Manual UNITY. 2016. http://docs.unity3d.com/Manual/index.html . Accessed April 1, 2016.
- University of Houston Biology and Biochemistry Imagine Core. 2014. http://bbic.nsm.uh.edu/protocols/leica-z-stacks . Accessed Nov 15, 2014.
- Wilhelm S, Grobler B, Gulch M, Heinz H. 1997. Confocal laser scanning microscopy principles. Zeiss Jena http:// zeiss-campus.magnet.fsu.edu/referencelibrary/pdfs/ ZeissConfocalPrinciples.pdf .
- Wu HK, Lee SW, Chang HY, Liang JC . 2013. . Current status, opportunities and challenges of augmented reality in education . Comput Educ . 62 , 41 -49 . 10.1016/j.compedu.2012.10.024 [DOI] [Google Scholar]


