Abstract
Background and Aim:
The ability to predict survival in cirrhosis is essential to management. Artificial intelligence models are promising alternatives to current scores and staging systems. The objective of this study was to test the feasibility of such a model to predict the short- and long-term survival of patients with different stages of cirrhosis.
Materials and Methods:
Clinical, laboratory, and survival data of patients with cirrhosis were collected retrospectively. A machine learning model was designed using feature selection. The model’s prediction performance was compared with the Model for End-stage Liver Disease-serum sodium (MELD-Na) and the Child-Turcotte-Pugh (CTP) scores using area under the curve (AUC) analysis.
Results:
The study population consisted of 124 cirrhotic patients. The AUC of the CTP score for 1-, 3-, and 12-month overall survival was 0.75 (CI:0.61-0.88), 0.77 (0.65-0.88), and 0.69 (CI:0.60-0.79), respectively. The AUC of the MELD-Na scores for the same time points was 0.7 (CI:0.62-0.86), 0.73 (CI:0.63-0.83), and 0.68 (CI:0.59-0.78). The machine learning model mean AUC for the entire study population was 0.87 (±0.082) for 1 month, 0.85 (±0.077) for 3 months, and 0.76 (±0.076) for 12 months. The model predicted 1-, 3-, and 12-month survival with an AUC of 0.91 (±0.03), 0.88 (±0.10), and 0.91 (±0.06), respectively, in patients with variceal bleeding.
Conclusion:
To the best of our knowledge, this is the first study to test a machine learning model in this context. The model outperformed the MELD-Na and CTP scores in the prediction of short- and long-term survival and also successfully predicted high risk variceal bleeding.
Keywords: Artificial intelligence, cirrhosis, machine learning, prognosis, survival, variceal bleeding
Introduction
Cirrhosis continues to be an important cause of morbidity and mortality. The general course of the disease is well known, with a compensated stage followed by decompensation, specific complications, and a high rate of mortality. However, this course can vary according to patient- and disease-related factors. This variability reinforces the need to be able to predict the survival of patients with cirrhosis in order to optimize the use of limited therapeutic resources, such as liver grafts. In response to this need, several models, tools, and measurements have been developed. The Model for End-Stage Liver Disease (MELD)-Na score and its derivatives,[1] the Child-Turcotte-Pugh (CTP) score,[2] clinical staging systems, and physiological measurements are useful; however, each option has drawbacks and efforts to define a globally accepted approach to survival prediction continue.
In theory, machine learning has distinct advantages compared with the other approaches: it can integrate more variables, performance can be increased with more training data, and it can adopt specific patients-problems-outcomes and time points. Machine learning methods have been used to tackle similar problems in hepatology, such as predicting post-transplant recurrence and overall survival in hepatocellular carcinoma, as well as wait-list mortality and recipient survival in transplantation. However, validation using external datasets and further studies with a prospective design are still needed.
The objective of this study was to create a pilot machine learning model to predict the overall survival of patients with cirrhosis as well as to predict outcomes of acute variceal bleeding.
Materials and Methods
Study Design and Patient Population
The institutional database was retrospectively examined for patients with cirrhosis who had undergone an upper endoscopy to treat or screen for varices between January 2015 and January 2021. Patients with an administrative coding for cirrhosis or chronic liver disease who were admitted to the endoscopy unit, inpatient wards, or the emergency department and referred for a gastroenterology consultation were included. Patients with insufficient clinical, laboratory, or survival data were excluded.
Data Collection and Variables
Three sets of data were assembled. First, clinical information related to the primary liver disease, including the etiology of the liver disease, the medical therapy applied, the presence of portal hypertensive landmarks observed in radiological studies, CTP scores, CTP classifications, and MELD-serum sodium (MELD-Na) scores were collected and re-evaluated. Second, in cases with acute bleeding, clinical and laboratory data from an emergency care admission, including vital signs, complete blood counts, chemistry, and coagulation tests were collected. Third, the overall survival data of each case, both the time to event from the index endoscopy and 1-, 3-, and 12-month survival information, were collected.
Machine Learning Models, Feature Selection, and Model Training
The Light Gradient Boosting Machine (LightGBM) (Microsoft Corp., Redmond, WA, USA) machine learning method was used to test the performance of this approach to survival prediction. LightGBM is an ensemble of multiple decision trees that learn from each in order to generate a more accurate final model.[3] Multiple stratified train/test splits were applied to estimate the generalization error and the model was trained and evaluated 50 times with different training and test sets to obtain statistically significant results. In every iteration, the data were shuffled and split into training and test sets with an 80/20 ratio and target label ratios were preserved with stratification. The mean area under the curve (AUC) of 50 models was used to evaluate the estimated generalization error and the SD of the scores was used to calculate the confidence interval. Two model-agnostic feature-importance techniques were also employed for feature selection: permutation feature importance and leave-one-out feature importance. The intent was to select a set of parameters that performed well in the prediction of survival rate at different time periods in every model. These parameters were selected intuitively, rather than using a black box optimizer, which can induce overfitting.
Outcomes and Statistical Analysis
Descriptive statistics of the patient population characteristics were calculated and presented using the median and interquartile range for non-parametric continuous variables, the mean and SD for parametric continuous variables, and ratios for categorical variables. The AUCs of the MELD-Na, CTP and machine learning models were compared for survival prediction at 3 time points.
Results
Characteristics of Study Population
A total of 124 patients with cirrhosis who had undergone an upper endoscopy for screening or treatment of esophageal varices were included in the research. The mean age of our population was 61 years (±15 years), and 70 (56%) were male. The etiology of the cirrhosis was cryptogenic, alcoholic liver disease, chronic hepatitis B or C, vascular disease, or nonalcoholic steatohepatitis. The mean CTP score of the study population was 7.6 (range: 5-13) and there were 29, 59, and 36 cases classified as classes A, B, and C, respectively. The mean MELD-Na score was 16 (±11), and 37, 45, 23, 18 patients were categorized in score groups of <10, 10-19, 20-29, and 30-40 respectively. There were 19 cases of stage 1 cirrhosis, 37 cases of stage 2, 31 cases of stage 3, and 37 cases of stage 4 (Table 1).
Table 1.
Clinical characteristics of the study population
| Mean (SD) | Count (%) | |
|---|---|---|
| Gender | ||
| Male | 54 | 43.5 |
| Female | 70 | 56.5 |
| Esophageal varices | ||
| None | 44 | 35.5 |
| Grade 1 | 22 | 17.7 |
| Grade 2 | 11 | 8.9 |
| Grade 3 | 8 | 6.5 |
| History of variceal bleeding | 9 | 7.3 |
| Active variceal bleeding | 30 | 24.2 |
| MELD-Na groups | ||
| <10 | 37 | 30.1 |
| 10–19 | 45 | 36.6 |
| 20–29 | 23 | 18.7 |
| 30–40 | 18 | 14.6 |
| CTP class | ||
| A | 29 | 23.4 |
| B | 59 | 47.6 |
| C | 36 | 29 |
| Cirrhosis stage | ||
| Stage 1 | 19 | 15.3 |
| Stage 2 | 37 | 29.8 |
| Stage 3 | 31 | 25 |
| Stage 4 | 37 | 29.8 |
CTP: Child-Turcotte-Pugh; MELD-Na: Model for End-stage Liver Disease-serum sodium modification.
Bleeding Episodes
Thirty-one patients underwent an upper endoscopy for variceal bleeding upon admission to an inpatient ward from the emergency department. The mean length of time from the initial diagnosis of cirrhosis to a bleeding episode was 48 months (±46 months). They presented with signs or symptoms of bleeding, such as hematemesis, melena, mental changes, or hypotension, or were referred due to a significant drop in hemoglobin concentration. At presentation, most of the patients had a normal heart rate and blood pressure; however, 7 cases were hypotensive and 6 cases were tachycardic. The median hemoglobin value was 8.8 g/dL (range: 4.5-14.8 g/dL). Two-fifths of the cases had a platelet count of <100,000/dL, another two-fifths had a count of 100,000-150,000/dL, and the remaining fifth had a count of >150,000/dL. Details of vital signs and laboratory work at admission are presented in Table 2. The mean length of survival of patients after bleeding was 39 months (±6 months) (Table 2).
Table 2.
Clinical and laboratory features of patients with variceal bleeding episodes
| Mean (SD)/Count (%) | |
|---|---|
| Time from initial diagnosis to bleeding (months) | 39 (6) |
| Mental examination at presentation | |
| Normal | 21 (65.7%) |
| Confusion | 8 (28.6%) |
| Stupor | 2 (5.7%) |
| Heart rate | |
| Normal | 24 (77%) |
| Tachycardia | 7 (23%) |
| Blood pressure | |
| Normal | 23 (74%) |
| Hypotensive | 8 (27%) |
| Ascites at presentation | |
| Absent | 15 (48.6%) |
| Mild | 6 (20%) |
| Overt | 10 (31.4%) |
| Medications | |
| Use of antiplatelet agents | 2 (8.6%) |
| Use of anticoagulant agents | 5 (17.1%) |
| Use of beta-blockers | 20 (62.9%) |
| Laboratory values | |
| Hemoglobin (g/dL) | 9 (7.9–11) |
| Platelet (per μL) | 110 (87–152) |
| Sodium (mg/dL) | 136 (133–137) |
| Creatinine (mg/dL) | 0.75 (0.61–0.99) |
| Blood urea nitrogen (mg/dL) | 30.8 (14–37.23) |
| Albumin (g/dL) | 2.82 (2.5–3.2) |
| Bilirubin (mg/dL) | 1.56 (1–2.3) |
| International normalized ratio | 1.36 (1.2–1.4) |
| Activated partial thromboplastin time | 25.8 (22.2–33.2) |
Survival Outcomes
The mean overall survival of the study population was 35.0 months (range: 10 days-102 months). The mortality rate for the 3 time points examined was: 17.7% at 1 month, 23.4% at 3 months, and 49.2% at 12 months. As demonstrated in Figures 1 and 2, a higher MELD-Na score or a higher CTP classification was associated with a lower overall survival. The AUC of the CTP score for 1-, 3-, and 12-month overall survival was 0.75 (CI:0.61-0.88), 0.77 (CI:0.65-0.88), and 0.69 (CI:0.60-0.79). The AUC for the MELD-Na score for the same time points was 0.74 (CI:0.62-0.86), 0.73 (CI:0.63-0.83), and 0.68 (CI:0.59-0.78) (Fig. 3).
Figure 1.
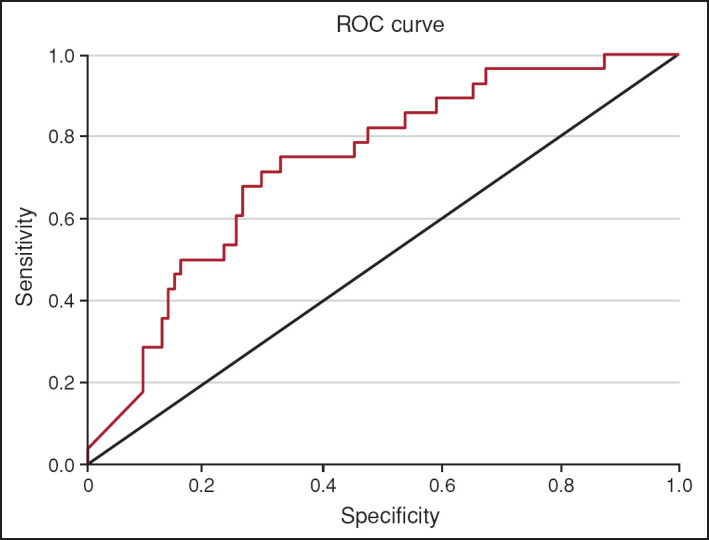
Area under the curve for MELD-Na score prediction of 3-month survival in the study population.
MELD-Na: Model for End-stage Liver Disease-serum sodium modification; ROC: Receiver operating characteristic.
Figure 2.
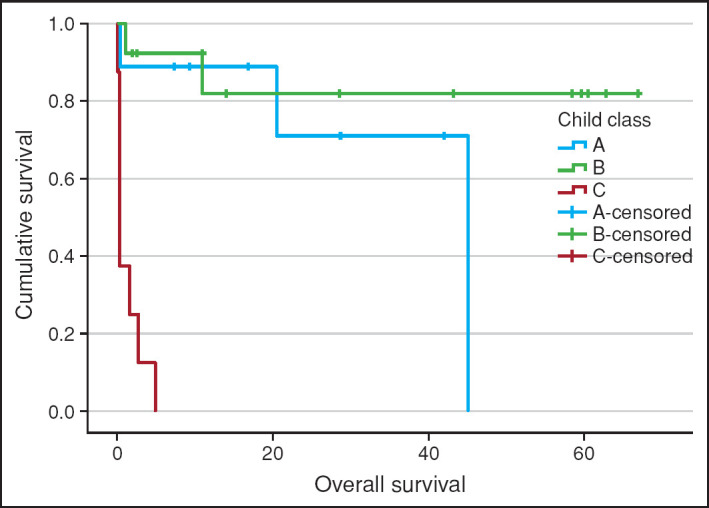
Comparison of the overall survivals of child classes.
Figure 3.
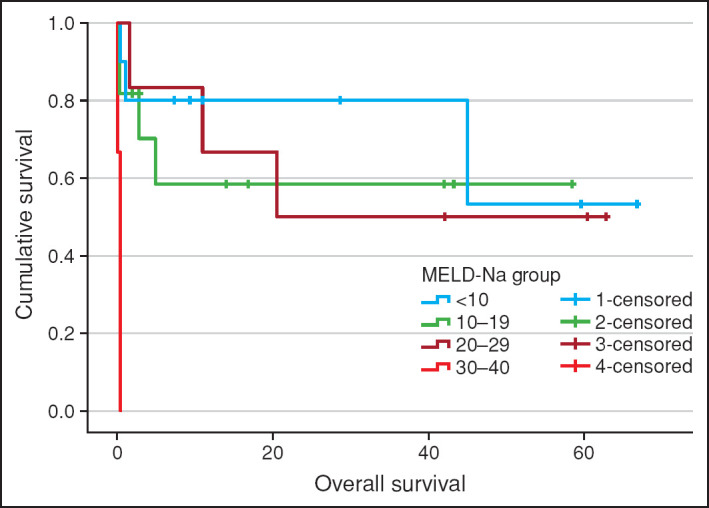
Comparison of overall survival of the 4 MELD-Na score groups.
MELD-Na: Model for End-stage Liver Disease-serum sodium modification.
Model Outputs
The risk classification of the machine learning model was tested for the ability to predict 1-, 3-, and 12-month overall survival for the total study population and the patients with variceal bleeding. First, a feature selection was performed to choose the optimal parameters to be integrated into the model. Age, gender, grade of encephalopathy and ascites, grade of esophageal varices, bleeding history, presence of portal venous thrombosis, CTP scores, use of beta-blockers, hemoglobin concentration, leukocyte differentials, biochemistry (albumin, sodium, creatinine, urea-nitrogen, total protein, alanine transaminase, aspartate transaminase, alkaline phosphatase, gamma-glutamyl transferase, and bilirubin), international normalized ratio (INR), and activated partial thromboplastin time were selected. The model was then trained and tested using our database. The mean AUC of the machine learning model for the entire study population was 0.87 (±0.082) for 1 month, 0.85 (±0.077) for 3 months, and 0.76 (±0.076) for 12 months. For bleeding patients, the model predicted 1-, 3-, and 12- months survival with an AUC of 0.91 (±0.03), 0.88 (±0.10), and 0.91 (±0.06), respectively (Fig. 4).
Figure 4.
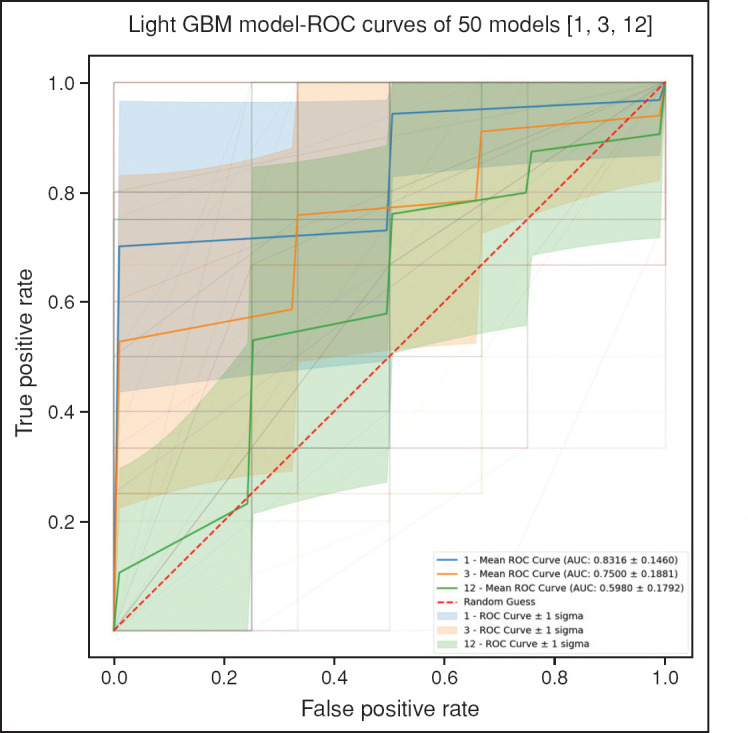
The area under the curve (AUC) and mean of 50 machine learning models to predict 1-, 3-, and 12-month survival of the study population.
LightGBM: Light Gradient Boosting Machine; ROC: Receiver operating characteristic.
Figure 5.
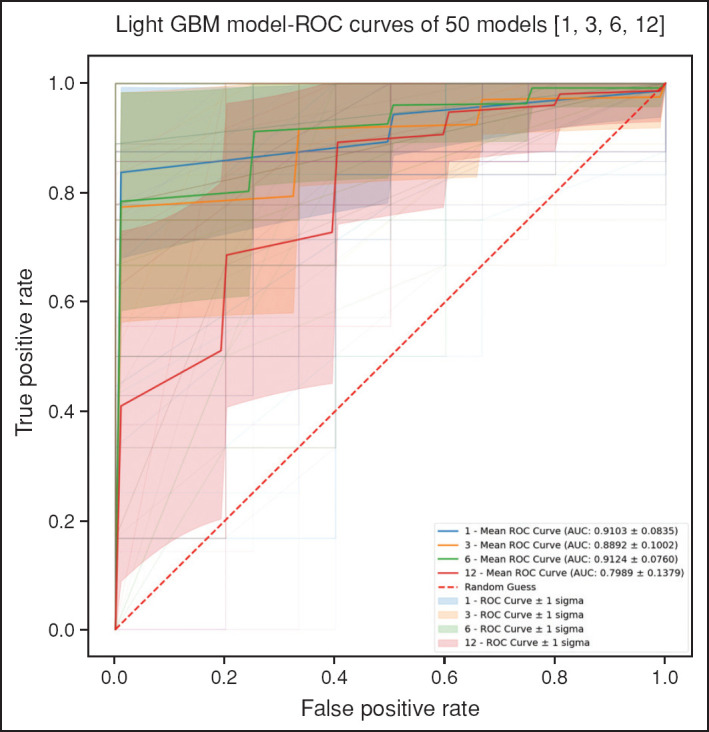
Area under the curve (AUC) and mean of 50 machine learning model results to predict 1-, 3-, and 12- month overall survival of patients with variceal bleeding.
LightGBM: Light Gradient Boosting Machine; ROC: Receiver operating characteristic.
Discussion
This study tested the feasibility of using a machine learning model to predict cirrhotic patients’ short- and long- term survival. Our model successfully classified the compensated and decompensated patients’ 1- 3- and 12-month survival with AUCs comparable to the widely accepted MELD-Na and CTP scores.
Predicting the prognosis of cirrhosis patients has long been a significant challenge. Decompensated cirrhosis is a major determinant of survival. The progression from a compensated to a decompensated stage occurs at a rate of 5% to 7% per year and decreases life expectancy from 10 years to 2 years.[4] A significant portion of patients have decompensated cirrhosis at the time of diagnosis and transplantation is the only curative option. Therefore, there is a need to further stratify patients according to the mortality risks. Staging models, scores, and physiological measurements have been developed, and currently, the CTP and MELD are the most extensively used.[5] These two scales each have specific strengths and weaknesses. While the CTP score has proven useful to assess the severity of cirrhosis and evaluate surgical risk, it was developed more than 50 years ago.[2,6] The CTP integrates the synthetic and excretory functions of the liver, as well as the complications of ascites and encephalopathy. However, concerns about the CTP include the fact that it uses empirically selected variables, it includes subjective judgement, each variable is weighted equally, it lacks renal variables, and it has a limiting ceiling effect.[7] The MELD score was first proposed about 20 years ago to measure mortality risk and select candidates for a transjugular intrahepatic portosystemic shunt.[8] The MELD score circumvented many drawbacks of the CTP with objective variables, no ceiling effect, and the incorporation of widely available laboratory tests and measures of renal function, as well as ease of use and strong validation. Nonetheless, the MELD score also has weaknesses: There are disparities based on gender and race, several conditions still require exceptions, INR values can vary between laboratories, and since the creatinine level is dependent on muscle mass, it is less valuable in cases of cirrhosis.[9,10] The most studied physiological measurement, the hepatic-venous pressure gradient, is a reliable and validated predictor of prognosis; however, the invasive nature precludes widespread utilization in clinical practice. Research on the topic has also examined other approaches to predict the prognosis of cirrhotic patients, and other clinical staging systems or modifications to the CTP and the MELD have been proposed but have not achieved widespread acceptance.[10]
This was a preliminary study to assess the feasibility of a machine learning model as a tool to predict the outcome of cirrhotic patients. To the best of our knowledge, this is the first study to use this approach in variceal bleeding episodes. Our study has several limitations inherent to a small population, retrospective design, and machine learning methods. We included a population with a balanced number of compensated and decompensated cirrhosis patients that was managed at a single institution with reliable survival data to increase the validity of our results. However, the drawbacks of small population size, such as generalizability and statistical power, are acknowledged. Machine learning has its own limitations, such as over-fitting of the model to the dataset, though we performed multiple training and test splits of our population. Further validation of our model with different and larger datasets is required.
Machine learning can be used to address problems in medicine that demonstrate a connection between virtually any type of data and a measurable outcome. Hepatology is a good fit for such efforts, as it includes extensive, multi-omic datasets, measurable outcomes, and vital, unanswered questions. Additional research efforts with bigger, diverse datasets followed by prospective studies using the developed models will add to our knowledge about the future use of machine learning in this field.
Footnotes
Ethics Committee Approval: The Hacettepe University Clinical Research Ethics Committee granted approval for this study (date: 16.03.2021, number: GO 21/201).
Peer-review: Externally peer-reviewed.
Author Contributions: Concept – CS, HYB, BS; Design – CS, HYB, BS; Supervision – HYB, BS; Data Collection and/or Processing – TKA, HS, IET, CS; Analysis and/or Interpretation – IET, HS, CS, HS, TKA; Literature Search –CS, TKA; Writing – CS; Critical Reviews – HYB, BS.
Conflict of Interest: Cem Simsek is an equity holder in Algomedicus.
Financial Disclosure: This study is supported by Algomedicus Artificial Intelligence and Medical Simulation Company, Ankara, Turkey.
References
- 1.Kamath PS, Wiesner RH, Malinchoc M, Kremers W, Therneau TM, Kosberg CL, et al. A model to predict survival in patients with end-stage liver disease. Hepatology. 2001;33(2):464–470. doi: 10.1053/jhep.2001.22172. [DOI] [PubMed] [Google Scholar]
- 2.Pugh RN, Murray-Lyon IM, Dawson JL, Pietroni MC, Williams R. Transection of the oesophagus for bleeding oesophageal varices. Br J Surg. 1973;60(8):646–649. doi: 10.1002/bjs.1800600817. [DOI] [PubMed] [Google Scholar]
- 3.Ge PS, Runyon BA. Treatment of Patients with Cirrhosis. N Engl J Med. 2016;375(21):2104–2105. doi: 10.1056/NEJMc1612334. [DOI] [PubMed] [Google Scholar]
- 4.Lyles T, Elliott A, Rockey DC. A risk scoring system to predict in-hospital mortality in patients with cirrhosis presenting with upper gastrointestinal bleeding. J Clin Gastroenterol. 2014;48(8):712–720. doi: 10.1097/MCG.0000000000000014. [DOI] [PubMed] [Google Scholar]
- 5.Child CG, Turcotte JG. Surgery and portal hypertension. Major Probl Clin Surg. 1964;1:1–85. [PubMed] [Google Scholar]
- 6.Peng Y, Qi X, Guo X. Child-Pugh Versus MELD Score for the Assessment of Prognosis in Liver Cirrhosis: A Systematic Review and Meta-Analysis of Observational Studies. Medicine (Baltimore) 2016;95(8) doi: 10.1097/MD.0000000000002877. e2877. [DOI] [PMC free article] [PubMed] [Google Scholar]
- 7.Durand F, Valla D. Assessment of the prognosis of cirrhosis: Child-Pugh versus MELD. J Hepatol. 2005;42(Suppl(1)):S100–107. doi: 10.1016/j.jhep.2004.11.015. [DOI] [PubMed] [Google Scholar]
- 8.Sacleux SC, Samuel D. A Critical Review of MELD as a Reliable Tool for Transplant Prioritization. Semin Liver Dis. 2019;39(4):403–413. doi: 10.1055/s-0039-1688750. [DOI] [PubMed] [Google Scholar]


