Abstract
Chemical exchange saturation transfer (CEST) imaging is a non-invasive molecular imaging technique for indirectly measuring low-concentration endogenous metabolites. Conventional CEST has low specificity, owing to the effects of spillover, magnetization transfer (MT), and T1 relaxation, thus necessitating an inverse Z-spectrum analysis. We aimed to investigate the usefulness of inverse Z-spectrum analysis in creatine (Cr)-CEST in mice, by conducting preclinical 7T-magnetic resonance imaging (MRI) and comparing the conventional analysis metric magnetization transfer ratio (MTRconv) with the novel metric apparent exchange-dependent relaxation (AREX). We performed Cr-CEST imaging using 7T-MRI on mouse testes, using C57BL/6 mice as the control and a cisplatin-treated model. We prepared different doses of cisplatin to observe its dose dependence effect on testicular function. CEST imaging was obtained using an MT pulse with varying saturation frequencies, ranging from −4.8 ppm to +4.8 ppm. The application of control mouse testes improved the specificity of the CEST effect and image contrast between the testes and testicular epithelium. The cisplatin-treated model revealed impaired testicular function, and the Cr-CEST imaging displayed decreased Cr levels in the testes. There was a significant difference between the low- and high-dose models. The MTR values of Cr-CEST reflected the cisplatin dose dependence of testicular dysfunction.
Keywords: chemical exchange saturation transfer, CEST, radiology, animal study, creatine, cisplatin-treated model
1. Introduction
Chemical exchange saturation transfer (CEST) imaging is a non-invasive molecular imaging technique that indirectly measures low-concentration endogenous metabolites [1]. In CEST imaging, a magnetization transfer (MT) pulse selectively saturates protons, following which this magnetic saturation is transferred between the excited metabolite protons and non-excited water protons through chemical exchange. This decreases the water signal. The measurement of this attenuation helps to indirectly determine the number of low-concentration solutes. Exchangeable protons include amino protons (-NH2), amide protons (-NH), and hydroxyl protons (-OH) [1]. The chemical exchange rate depends on the pH level, metabolite concentration, and temperature [2]. Furthermore, the CEST signal is affected by various physical factors, such as the radiofrequency (RF) magnitude, magnetic field strength, and B0 and B1 homogeneity [3,4,5]. In conventional CEST imaging of endogenous metabolites in vivo, the Z-spectrum not only reflects the CEST signal, but also the semi-solid macromolecular MT effect, the direct water proton saturation (spillover) effect, and the T1 relaxation of the water protons [6,7]. Therefore, the specificity of the CEST signal can be compromised by its effects.
Reliable CEST quantification warrants the elimination of factors that affect the signal. Researchers have used several approaches, such as the three-point method [8], chemical exchange rotation transfer [9], Lorentzian-line-fit analysis, and Lorentzian difference model fitting [10], to solve these problems. However, these methods generate insufficient correction. For more accurate detection of CEST effects, Zaiss et al. proposed a novel evaluation method that isolates and corrects the effects of spillover, MT, and T1 relaxation on the CEST signal, using the inverse metric of the Z-spectrum (1/Z) [6]. They presented a novel index, the MTRrex, which eliminates spillover and MT effects. Moreover, the index that compensates for T1 relaxation is termed the apparent exchange-dependent relaxation (AREX) [5,11].
Previous researchers have performed CEST imaging on various metabolites, such as amide protons [4], glutamate (Glu) [12], lactate [13], creatine (Cr) [14], and glycosaminoglycans (GAG) [15], in numerous organs. In particular, Cr-CEST imaging is useful for detecting Cr in the skeletal muscles [16,17] and brain [13,18]. Recently, researchers have reported on the usefulness of Cr-CEST imaging in the testis when examining Cr metabolites that have been altered by testicular torsion and radiation damage [19,20]. However, they performed Cr-CEST imaging using the conventional method, such that the specificity of the CEST signal could be compromised by spillover, the MT effect, and T1 relaxation of the water protons [6,7]. There are no reports on Cr-CEST imaging using an inverse Z-spectrum analysis of the testis.
We aimed to investigate the usefulness of inverse Z-spectrum analysis in Cr-CEST to evaluate mice with cisplatin-induced testicular dysfunction, by comparing the conventional analysis metric MTRconv and a novel metric AREX, using preclinical 7T-magnetic resonance imaging (MRI).
2. Materials and Methods
2.1. Animal Preparation
All animal procedures were approved by the research ethics committee of our university. All experimental procedures involving animals and their care were performed in accordance with the Osaka University Guidelines for Animal Experimentation. We purchased C57BL/6 male mice from SLC Japan (Shizuoka, Japan). The 16 mice were divided into 3 groups (aged 7–8 weeks). First, we performed an experiment using control mice (6 mice, 12 testes, aged 9–10 weeks) to demonstrate the in vivo application of inverse Z-spectrum analysis. To assess the impaired testes, cisplatin was administered to the mice. Cisplatin is an anticancer drug used in chemotherapy and causes testicular dysfunction [21,22,23,24]. To observe the dose dependence effect of cisplatin on testicular function, we prepared two groups using different doses of cisplatin (Wako, Osaka, Japan), as follows: a low-dose group (7.5 mg/kg, 6 mice, 12 testes, aged 9–10 weeks) and a high-dose group (15 mg/kg, 6 mice, 12 testes, aged 9–10 weeks). Cisplatin was administered via an intraperitoneal injection. We used all mice after a cisplatin intraperitoneal injection. We performed CEST imaging 18 days following the cisplatin injection. During all animal experiments, the mice were placed under general anesthesia with isoflurane (3.0% for induction and 1.5% for maintenance). Their body temperature was maintained at 36.5 °C with regulated water flow, and their respiration was continuously monitored using a physiological monitoring system (SA Instruments, Inc., Stony Brook, NY, USA).
2.2. MRI Experiments
All MRI experiments were performed on a horizontal 7T-MRI unit (PharmaScan 70/16 US, Bruker BioSpin, Ettlingen, Germany, 16 cm horizontal bore magnet, 9 cm inner diameter shielded gradient), equipped with a volume coil with a 30 mm inner diameter. We acquired CEST data using MT rapid acquisition with a refocused echoes (RARE) sequence. The sequence parameters were as follows: repetition time (TR) = 2300 ms; echo time (TE) = 33 ms; field of view (FOV) = 25.6 × 25.6 mm2; slice thickness = 1 mm; matrix size = 128 × 128; number of averages = 1; and in-plane resolution = 200 × 200 µm2. The MT pulse parameters were as follows: shape of continuous-wave saturation pulse = block pulse; length = 100 ms; number of pulses = 20; interpulse delay = 0.01 ms; bandwidth = 12.8 Hz; B1 amplitude = 1.2 µT; and flip angle = 1840°.
We obtained the Z-spectrum from CEST images with varying saturation frequencies, ranging from −4.8 ppm to +4.8 ppm (0.3 ppm per step; 33 images), and 1 S0 image (without an MT pulse). Point-by-point B0 correction was performed by water saturation shift referencing (WASSR) [25]. To obtain the WASSR data, the B1 amplitude was set to 0.3 µT and saturation offsets were set from −1.0 ppm to +1.0 ppm (0.1 ppm per step; 21 images). For the inverse Z-spectrum analysis, we obtained T1 map images. These maps were acquired using the T1 map RARE sequence. The sequence parameters were as follows: TE = 16 ms; TR = 5500, 3000, 1500, 800, 400, and 200 ms; FOV = 25.6 × 25.6 mm2; slice thickness = 1 mm; matrix size = 128 × 128; number of averages = 1; in-plane resolution = 200 × 200 µm2; and RARE factor = 4. The total acquisition time per animal was approximately 60 min.
2.3. Data Processing
All processing and data analyses of the CEST imaging were performed using in-house scripts written in MATLAB (2021a, MathWorks, Inc., Natick, MA, USA). MTR values were obtained using ImageJ (National Institutes of Health, Bethesda, MD, USA) from the CEST images created by the MATLAB analysis. In animal experiments, the oval regions of interest (ROIs) were attributed to the entire left and right testes to measure their signal value. In the experiment using control mice, we set the ROIs in the left and right testicular epithelium to observe the change in contrast before and after the inverse Z-spectrum analysis. We calculated and compared the MTR values and differences in MTR asymmetry between the testes and testicular epithelium (ΔMTR asymmetry). ΔMTR asymmetry is defined as follows:
| Contrast of MTR asymmetry (%) = MTR (testis) − MTR (testicular epithelium). |
In this study, the conventional MTR asymmetry was described as MTRconv. MTRconv and AREX were calculated as previously described [6,26]. The most common CEST quantification method, Z-spectrum asymmetry analysis, uses the subtraction of the Z values between Zlab (the label scan at the resonance frequency offset of the target metabolite) and Zref (the reference scan at the frequency located symmetrically to 0 ppm).
| MTRconv = Zref − Zlab |
where MTRrex is the spillover- and MT-corrected index derived from the AREX calculation process.
| (1) |
In addition, considering the T1 relaxation compensation, the AREX is calculated as follows:
| (2) |
2.4. Histopathology
Following MRI, we sacrificed the control and cisplatin-treated mice. The testes were collected and fixed in 4% phosphate-buffered formaldehyde (control: three mice, six testes; low-dose: three mice, six testes; and high-dose: three mice, six testes). Testis specimens were embedded in paraffin, sectioned at 5 µm, and stained with hematoxylin and eosin. The tissues were dehydrated with 95% ethanol twice for 30 min, and then soaked in xylene for 1 hour at 60–70 °C, followed by paraffin for 12 h. For the mouse testes, we used 0.5 mL of 95% ethanol in dehydration. We examined the testicular tissues using a light microscope (Keyence, Osaka, Japan). For the histological evaluation of spermatogenesis, we evaluated at least 20 seminiferous tubules per testis to calculate the Johnsen score [27], a 10-point evaluation method for quantifying spermatogenesis according to the profile of cells encountered along the seminiferous tubules. A Johnsen score of 10 indicates complete spermatogenesis with several spermatozoa, whereas a score of 1 indicates no cells in the spermatogonia. The Johnsen score was evaluated by one urologist with >5 years of clinical experience.
2.5. Statistical Analysis
The MTR asymmetry values are presented as mean values ± standard deviation (SD). We performed a Wilcoxon’s test to compare the differences between the two groups (MTRconv vs. AREX) using Prism 8 (version 8, GraphPad Software, San Diego, CA, USA). The differences between the three groups (control, low-dose and high-dose) were analyzed using the Kruskal–Wallis test. Differences were considered statistically significant at p-value < 0.05. The notations for significant differences in the graphs of results are defined as follows: * p < 0.05 and ** p < 0.01.
3. Results
3.1. In Vivo Imaging
3.1.1. Application of Mouse Testes
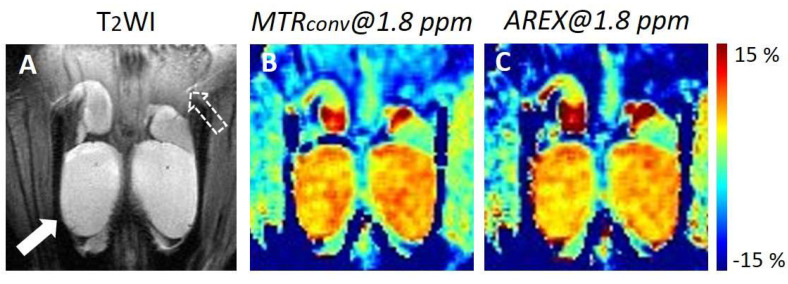
Figure 1 depicts the representative in vivo Cr-CEST images of the mouse testes. In the MTR asymmetry map at 1.8 ppm, the testes displayed a higher MTR value than other tissues (Figure 1B,C). There was no visible difference between the MTR value of MTRconv and that of AREX in the testes. However, the MTR value of AREX was lower than that of MTRconv in the testicular epithelium. Figure 2 depicts the difference in the MTR asymmetry value at 1.8 ppm between the testis and testicular epithelium. The ΔMTR asymmetry of AREX was significantly larger than MTRconv (MTRconv: 11.0 ± 2.0 vs. AREX: 15.6 ± 3.5; p < 0.001).
Figure 1.
Representative in vivo Cr-CEST images of control mouse testes. (A) Anatomical T2WI image. The white arrow shows the testis. The white dotted arrow shows the testicular epithelium. (B) MTR asymmetry maps at 1.8 ppm of MTRconv. (C) MTR asymmetry maps at 1.8 ppm of AREX. MTR, magnetization transfer ratio; MTRconv, conventional analysis metric magnetization transfer ratio; AREX, apparent exchange-dependent relaxation; and Cr-CEST, creatine chemical exchange saturation transfer.
Figure 2.
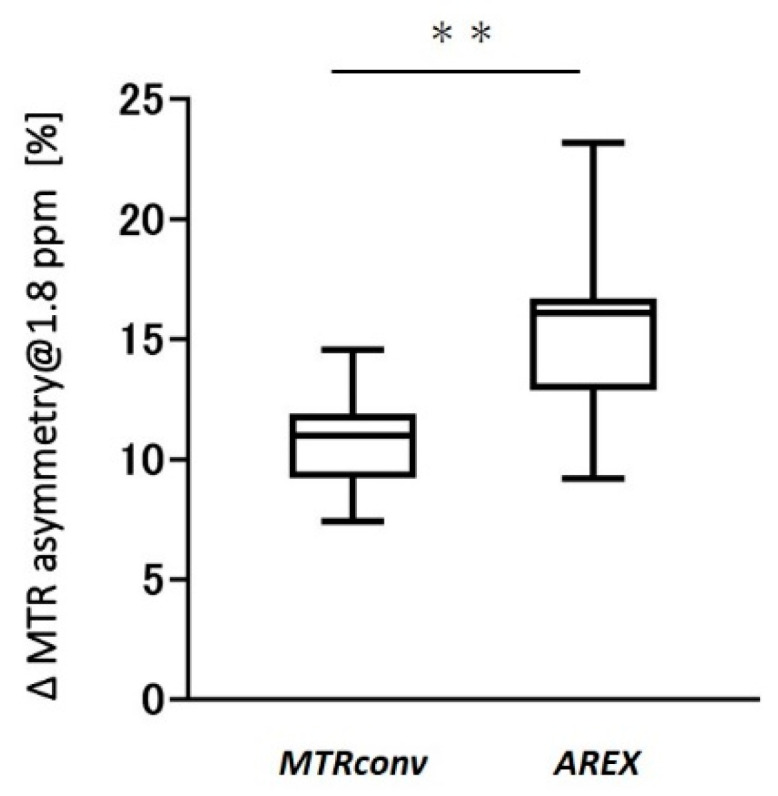
Difference in MTR asymmetry values between the testis and testicular epithelium at 1.8 ppm of MTRconv and AREX. ** p < 0.001. MTR, magnetization transfer ratio; MTRconv, conventional analysis metric magnetization transfer ratio; and AREX, apparent exchange-dependent relaxation.
3.1.2. Cisplatin-Treated Model Observations
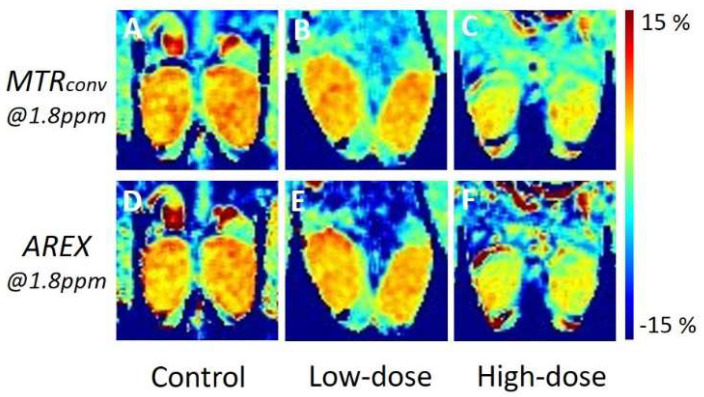
Figure 3 depicts the representative in vivo Cr-CEST images of the control mice and low- and high-dose cisplatin-treated mice. The MTR value of the cisplatin-treated mouse testes was lower than that of the control in both MTRconv and AREX (Figure 3A–C and Figure 3D–F). The high-dose model showed a larger reduction than the low-dose model. There was no visible difference between MTRconv and AREX.
Figure 3.
Representative in vivo Cr-CEST images of control and cisplatin-treated mice. The upper row displays the MTR asymmetry map of MTRconv at 1.8 ppm, whereas the bottom row displays the MTR asymmetry map of AREX. The left column represents the control (A,D), the central column represents the low dose (B,E), and the right column represents the high dose (C,F). MTR, magnetization transfer ratio; MTRconv, conventional analysis metric magnetization transfer ratio; AREX, apparent exchange-dependent relaxation; and Cr-CEST, creatine chemical exchange saturation transfer.
Figure 4 contains graphs of MTR asymmetry at 1.8 ppm and the results of the statistical analysis. The low- and high-dose models revealed a more significant decrease than the control in both MTRconv and AREX. Furthermore, the high-dose group was significantly lower than the low-dose group (MTRconv, control: 6.0 ± 0.7 vs. low-dose: 4.6 ± 0.6, p < 0.05; control: 6.0 ± 0.7 vs. high-dose: 3.0 ± 0.8, p < 0.001; low-dose: 4.6 ± 0.6 vs. high-dose: 3.0 ± 0.8, p < 0.05. AREX, control: 5.4 ± 0.4 vs. low dose: 4.3 ± 0.5, p < 0.05; control: 5.4 ± 0.4 vs. high dose: 2.8 ± 0.9, p < 0.001; low-dose: 4.3 ± 0.5 vs. high-dose: 2.8 ± 0.9, p < 0.05). The low-dose model revealed a 23% and 21% decrease in the MTR value for MTRconv and AREX, respectively, compared with the control, whereas the high-dose model revealed a 50% and 48% decrease, respectively.
Figure 4.
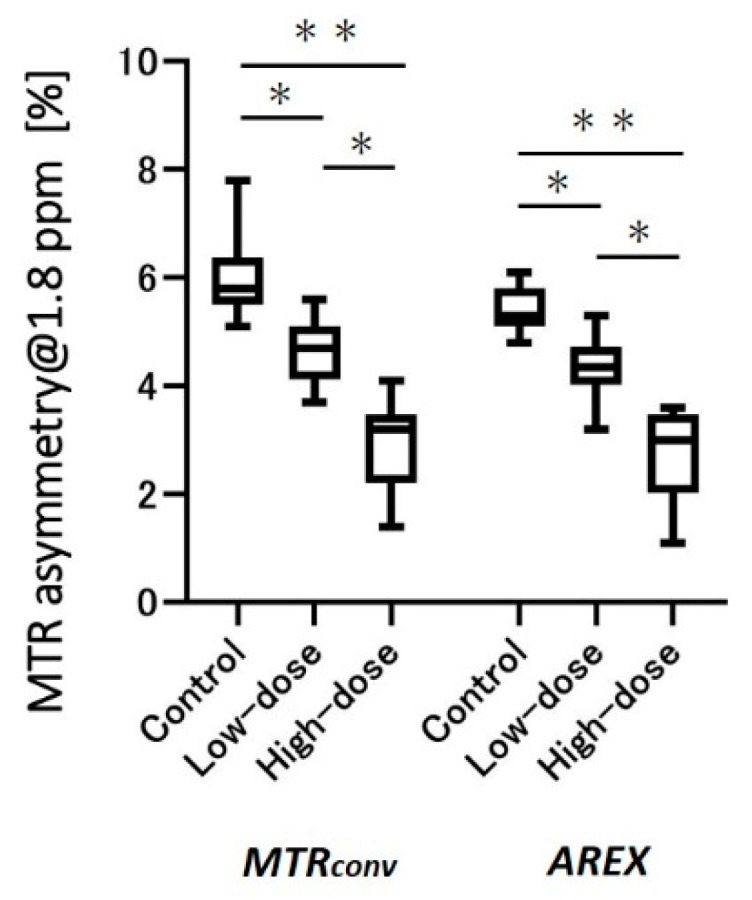
MTR asymmetry graphs at 1.8 ppm in the testes of control, low-, and high-dose cisplatin-treated models. * p < 0.05, ** p < 0.001. MTR, magnetization transfer ratio; MTRconv, conventional analysis metric magnetization transfer ratio; and AREX, apparent exchange-dependent relaxation.
3.2. Histological Changes in Cisplatin-Treated Model
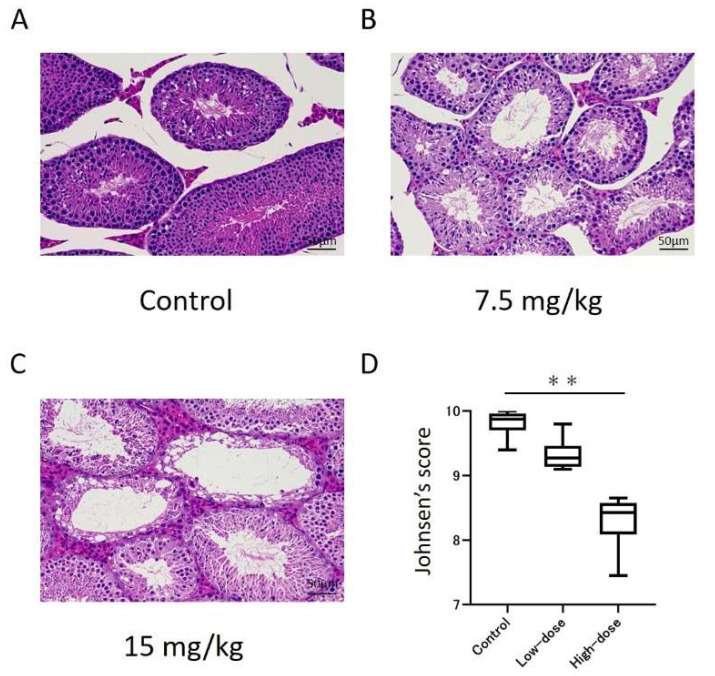
Figure 4 represents the histopathological analysis of the testes in the control and cisplatin-treated mice. We observed spermatogenesis dysfunction in both the low- and high-dose cisplatin-treated models (Figure 5A–C). The Johnsen score for the high-dose group was significantly lower than that for the control (Figure 5D; control: 9.8 ± 0.2 vs. high-dose: 8.3 ± 0.4, p < 0.001), whereas there was no significant difference in the low-dose group (low-dose: 9.3 ± 0.2).
Figure 5.
Histopathological changes in the testes of the control and cisplatin-treated mice. (A–C) Images of hematoxylin and eosin staining of the seminiferous tubules. (D) Graphical representation of the Johnsen score. ** p < 0.001.
4. Discussion
This is the first study to report the efficacy of Cr-CEST imaging using inverse Z-spectrum analysis for assessing the dose dependence of anticancer drugs on testicular function. The application of in vivo imaging of mouse testes improved the specificity of the CEST effect and image contrast between the testis and testicular epithelium. The cisplatin-treated model displayed impaired testicular function, and Cr-CEST revealed decreased Cr levels in the testes. The decrease in Cr levels in the testes showed the dose dependence of anticancer drugs. The difference between the control and cisplatin-treated models was similar in the MTRconv and AREX groups. Cr-CEST imaging of the testis with inverse Z-spectrum analysis may help to assess the effects of anticancer drugs on testicular function.
4.1. Application of Mice Testes
The testis is an organ rich in Cr, particularly in the Sertoli cells and germ cells [28]. Takahashi et al. reported that the MTR value of the testis is five times higher than that of the skeletal muscle in Cr-CEST [19]. Despite the unclear role of Cr in the testis, infertile testes [29], ischemic testes [19], and X-ray-exposed testes [20] reveal low Cr levels. Moreover, Cr is a supposedly useful biomarker of testicular function. In this study, the testes displayed strong Cr-CEST signals. Moreover, Cr-CEST imaging using inverse Z-spectrum analysis revealed a significant increase in contrast between the testis and testicular epithelium in AREX, thus indicating increased specificity of the CEST effect. Cr-CEST imaging using inverse Z-spectrum analysis was also useful for detecting Cr in the testes.
4.2. Anticancer Drug Administration Model Observations
We not only examined changes in the MTR value between MTRconv and AREX in the control mice, but also the usefulness of inverse Z-spectrum analysis in a model of induced testicular dysfunction. We compared the difference in MTR values between the control and model mice with cisplatin-induced impaired testicular function, before and after inverse Z-spectrum analysis. By comparing the CEST images at 1.8 ppm obtained from the control, low- (7.5 mg/kg) and high-dose (15 mg/kg) cisplatin-treated models (Figure 3), we found that there was a visible difference between the three groups in both MTRconv and AREX. Similarly, Figure 4 revealed that in both MTRconv and AREX, the MTR value of the cisplatin-treated groups was significantly lower than that of the controls, and there was also a significant difference between the low- and high-dose models. This revealed that the impairment of testicular function with cisplatin administration is dose dependent. There was no major difference in the MTR values of the testes between MTRconv and AREX, and both showed similar trends. Although the contrast in the images was increased in AREX, the MTR values of the testes did not change substantially before and after inverse Z-spectrum analysis, indicating that the MTR values of the testes were not greatly affected by inverse Z-spectrum analysis.
In this study, which is focused on testis pathology, we observed spermatogenesis in both the control and cisplatin-treated models, but the testis of the cisplatin-treated mice was damaged and its cell structure was disorganized. The degree of impairment was more severe in the high-dose model compared to the low-dose model, and the Johnsen score showed similar results. Previous studies administered cisplatin at 2, 4, 6, 8, and 10 mg/kg, and the Johnsen scores were lower with a dose dependence [30]. Our result was consistent with this. However, in the comparison of the MTR values, the low-dose model showed a significant decrease compared to the control, and there was also a significant difference between the low- and high-dose models, whereas the Johnsen score only showed a significant difference in the high-dose model. Therefore, Cr-CEST imaging may be more sensitive to testicular dysfunction caused by anticancer drug administration than histopathology by biopsy.
In this study, the CEST images revealed that the administration of anticancer drugs impaired testicular function and decreased Cr levels. In addition, the degree of testicular damage was dose dependent for cisplatin, and the MTR values of the testes in Cr-CEST imaging were found to reflect this. This trend remained after inverse Z-spectrum analysis. Therefore, Cr-CEST imaging using inverse Z-spectral analysis may be applied to the evaluation of testicular Cr levels in pathological models.
4.3. Limitation
This study had one limitation: we only performed B0 correction using the WASSR method to acquire the CEST imaging data, and performed no correction for B1 inhomogeneity. The CEST effect depends on the B1 amplitude and is maximal at a certain amplitude [11]. Thus, B1 inhomogeneity not only affects the signal-to-noise ratio of the CEST signal, but also the image contrast [26]. MTRconv is not easily affected by B1 inhomogeneity, and the changes in image contrast with and without B1 correction are small. However, AREX is substantially dependent on B1 inhomogeneity. Without B1 correction, the entire FOV may have an inhomogeneous contrast [7]. In particular, we performed the present experiment using ultra-high field 7T-MRI with large B1 inhomogeneity [26]. This necessitates B1 correction or RF shimming for CEST imaging using inverse Z-spectral analysis in ultra-high field MRI.
5. Conclusions
We applied inverse Z-spectrum analysis to in vivo Cr-CEST imaging using a preclinical 7T-MRI, which improved the specificity of the CEST effect. The MTR values of Cr-CEST reflected the cisplatin dose dependence of testicular dysfunction.
Author Contributions
Conceptualization, R.S., J.U., S.K. and S.S.; methodology, R.S and S.S.; investigation, R.S.; data curation, R.S. and S.S.; writing—original draft preparation, R.S. and S.S.; writing—review and editing, R.S. and S.S.; supervision, S.S.; funding acquisition, S.S. All authors have read and agreed to the published version of the manuscript.
Funding
This research was funded by the Japan Society for the Promotion of Science (JSPS) KAKENHI (grant number 19K08172). This work was the result of using research equipment shared by the MEXT Project for promoting the public utilization of advanced research infrastructure (program for supporting construction of core facilities) (grant number JPMXS0450400021).
Institutional Review Board Statement
The study was conducted according to the guidelines of the Declaration of Helsinki and approved by the Research Ethics Committee of Osaka University (Number: R02-05-0).
Informed Consent Statement
Not applicable.
Data Availability Statement
The data presented in this study are available on request from the corresponding author.
Conflicts of Interest
The authors declare no conflict of interest.
Footnotes
Publisher’s Note: MDPI stays neutral with regard to jurisdictional claims in published maps and institutional affiliations.
References
- 1.Ward K.M., Aletras A.H., Balaban R.S. A New Class of Contrast Agents for Mri Based on Proton Chemical Exchange Dependent Saturation Transfer (Cest) J. Magn. Reson. 2000;143:79–87. doi: 10.1006/jmre.1999.1956. [DOI] [PubMed] [Google Scholar]
- 2.Jin T., Wang P., Zong X., Kim S.G. Mr Imaging of the Amide-Proton Transfer Effect and the Ph-Insensitive Nuclear Overhauser Effect at 9.4 T. Magn. Reson. Med. 2013;69:760–770. doi: 10.1002/mrm.24315. [DOI] [PMC free article] [PubMed] [Google Scholar]
- 3.Wu B., Warnock G., Zaiss M., Lin C., Chen M., Zhou Z., Mu L., Nanz D., Tuura R., Delso G. An overview of CEST MRI for non-MR physicists. EJNMMI Phys. 2016;3:19. doi: 10.1186/s40658-016-0155-2. [DOI] [PMC free article] [PubMed] [Google Scholar]
- 4.Tanoue M., Saito S., Takahashi Y., Araki R., Hashido T., Kioka H., Sakata Y., Yoshioka Y. Amide proton transfer imaging of glioblastoma, neuroblastoma, and breast cancer cells on a 11.7 T magnetic resonance imaging system. Magn. Reson. Imaging. 2019;62:181–190. doi: 10.1016/j.mri.2019.07.005. [DOI] [PubMed] [Google Scholar]
- 5.Stabinska J., Cronenberg T., Wittsack H.-J., Lanzman R.S., Müller-Lutz A. Quantitative pulsed CEST-MRI at a clinical 3T MRI system. Magn. Reson. Mater. Phys. Biol. Med. 2017;30:505–516. doi: 10.1007/s10334-017-0625-0. [DOI] [PubMed] [Google Scholar]
- 6.Zaiss M., Xu J., Goerke S., Khan I.S., Singer R.J., Gore J.C., Gochberg D.F., Bachert P. Inverse Z-Spectrum Analysis for Spillover-, Mt-, and T1-Corrected Steady-State Pulsed Cest-Mri—Application to Ph-Weighted Mri of Acute Stroke. NMR Biomed. 2014;27:240–252. doi: 10.1002/nbm.3054. [DOI] [PMC free article] [PubMed] [Google Scholar]
- 7.Rerich E., Zaiss M., Korzowski A., Ladd M.E., Bachert P. Relaxation-Compensated Cest-Mri at 7 T for Mapping of Creatine Content and Ph--Preliminary Application in Human Muscle Tissue in Vivo. NMR Biomed. 2015;28:1402–1412. doi: 10.1002/nbm.3367. [DOI] [PubMed] [Google Scholar]
- 8.Zhang X.-Y., Wang F., Li H., Xu J., Gochberg D.F., Gore J.C., Zu Z. Accuracy in the quantification of chemical exchange saturation transfer (CEST) and relayed nuclear Overhauser enhancement (rNOE) saturation transfer effects. NMR Biomed. 2017;30:e3716. doi: 10.1002/nbm.3716. [DOI] [PMC free article] [PubMed] [Google Scholar]
- 9.Zu Z., Janve V.A., Xu J., Does M.D., Gore J.C., Gochberg D.F. A new method for detecting exchanging amide protons using chemical exchange rotation transfer. Magn. Reson. Med. 2012;69:637–647. doi: 10.1002/mrm.24284. [DOI] [PMC free article] [PubMed] [Google Scholar]
- 10.Zaiß M., Schmitt B., Bachert P. Quantitative separation of CEST effect from magnetization transfer and spillover effects by Lorentzian-line-fit analysis of z-spectra. J. Magn. Reson. 2011;211:149–155. doi: 10.1016/j.jmr.2011.05.001. [DOI] [PubMed] [Google Scholar]
- 11.Zaiss M., Bachert P. Exchange-dependent relaxation in the rotating frame for slow and intermediate exchange-modeling off-resonant spin-lock and chemical exchange saturation transfer. NMR Biomed. 2012;26:507–518. doi: 10.1002/nbm.2887. [DOI] [PubMed] [Google Scholar]
- 12.Cui J., Zu Z. Towards the Molecular Origin of Glutamate Cest (Glucest) Imaging in Rat Brain. Magn. Reson. Med. 2020;83:1405–1417. doi: 10.1002/mrm.28021. [DOI] [PubMed] [Google Scholar]
- 13.Saito S., Takahashi Y., Ohki A., Shintani Y., Higuchi T. Early detection of elevated lactate levels in a mitochondrial disease model using chemical exchange saturation transfer (CEST) and magnetic resonance spectroscopy (MRS) at 7T-MRI. Radiol. Phys. Technol. 2018;12:46–54. doi: 10.1007/s12194-018-0490-1. [DOI] [PubMed] [Google Scholar]
- 14.Saito S., Mori Y., Tanki N., Yoshioka Y., Murase K. Factors affecting the chemical exchange saturation transfer of Creatine as assessed by 11.7 T MRI. Radiol. Phys. Technol. 2014;8:146–152. doi: 10.1007/s12194-014-0303-0. [DOI] [PubMed] [Google Scholar]
- 15.Einarsson E., Peterson P., Onnerfjord P., Gottschalk M., Xu X., Knutsson L., Dahlberg L.E., Struglics A., Svensson J. The role of cartilage glycosaminoglycan structure in gagCEST. NMR Biomed. 2020;33:e4259. doi: 10.1002/nbm.4259. [DOI] [PubMed] [Google Scholar]
- 16.Takahashi Y., Saito S., Kioka H., Araki R., Asano Y., Takashima S., Sakata Y., Yoshioka Y. Mouse skeletal muscle creatine chemical exchange saturation transfer (CrCEST) imaging at 11.7T MRI. J. Magn. Reson. Imaging. 2019;51:563–570. doi: 10.1002/jmri.26844. [DOI] [PubMed] [Google Scholar]
- 17.Kogan F., Stafford R.B., Englund E.K., Gold G.E., Hariharan H., Detre J.A., Reddy R. Perfusion has no effect on thein vivoCEST effect from Cr (CrCEST) in skeletal muscle. NMR Biomed. 2016;30:e3673. doi: 10.1002/nbm.3673. [DOI] [PMC free article] [PubMed] [Google Scholar]
- 18.Singh A., Debnath A., Cai K., Bagga P., Haris M., Hariharan H., Reddy R. Evaluating the feasibility of creatine-weighted CEST MRI in human brain at 7 T using a Z-spectral fitting approach. NMR Biomed. 2019;32:e4176. doi: 10.1002/nbm.4176. [DOI] [PMC free article] [PubMed] [Google Scholar]
- 19.Takahashi Y., Kioka H., Saito S., Fukuhara S., Asano Y., Takashima S., Yoshioka Y., Sakata Y. Accurate Estimation of the Duration of Testicular Ischemia Using Creatine Chemical Exchange Saturation Transfer (CrCEST) Imaging. J. Magn. Reson. Imaging. 2020;53:1559–1567. doi: 10.1002/jmri.27456. [DOI] [PubMed] [Google Scholar]
- 20.Takahashi Y., Kioka H., Fukuhara S., Kuribayashi S., Saito S., Asano Y., Takashima S., Yoshioka Y., Sakata Y. Visualization of Spatial Distribution of Spermatogenesis in Mouse Testes Using Creatine Chemical Exchange Saturation Transfer Imaging. J. Magn. Reson. Imaging. 2021;54:1457–1465. doi: 10.1002/jmri.27734. [DOI] [PubMed] [Google Scholar]
- 21.Tharmalingam M.D., Matilionyte G., Wallace W.H.B., Stukenborg J.-B., Jahnukainen K., Oliver E., Goriely A., Lane S., Guo J., Cairns B., et al. Cisplatin and carboplatin result in similar gonadotoxicity in immature human testis with implications for fertility preservation in childhood cancer. BMC Med. 2020;18:374. doi: 10.1186/s12916-020-01844-y. [DOI] [PMC free article] [PubMed] [Google Scholar]
- 22.Kohsaka T., Minagawa I., Morimoto M., Yoshida T., Sasanami T., Yoneda Y., Ikegaya N., Sasada H. Efficacy of relaxin for cisplatin-induced testicular dysfunction and epididymal spermatotoxicity. Basic Clin. Androl. 2020;30:3–13. doi: 10.1186/s12610-020-0101-y. [DOI] [PMC free article] [PubMed] [Google Scholar]
- 23.Chieffi P., De Martino M., Esposito F. New Anti-Cancer Strategies in Testicular Germ Cell Tumors. Recent Pat. Anti-Cancer Drug Discov. 2019;14:53–59. doi: 10.2174/1574892814666190111120023. [DOI] [PubMed] [Google Scholar]
- 24.De Martino M., Chieffi P., Esposito F. miRNAs and Biomarkers in Testicular Germ Cell Tumors: An Update. Int. J. Mol. Sci. 2021;22:1380. doi: 10.3390/ijms22031380. [DOI] [PMC free article] [PubMed] [Google Scholar]
- 25.Kim M., Gillen J., Landman B.A., Zhou J., van Zijl P.C. Water saturation shift referencing (WASSR) for chemical exchange saturation transfer (CEST) experiments. Magn. Reson. Med. 2009;61:1441–1450. doi: 10.1002/mrm.21873. [DOI] [PMC free article] [PubMed] [Google Scholar]
- 26.Windschuh J., Zaiss M., Meissner J.-E., Paech D., Radbruch A., Ladd M.E., Bachert P. Correction of B1-inhomogeneities for relaxation-compensated CEST imaging at 7 T. NMR Biomed. 2015;28:529–537. doi: 10.1002/nbm.3283. [DOI] [PubMed] [Google Scholar]
- 27.Johnsen S.G. Testicular Biopsy Score Count—A Method for Registration of Spermatogenesis in Human Testes: Normal Values and Results in 335 Hypogonadal Males. Horm. Res. Paediatr. 1970;1:2–25. doi: 10.1159/000178170. [DOI] [PubMed] [Google Scholar]
- 28.Moore N.P. The distribution, metabolism and function of creatine in the male mammalian reproductive tract: A review. Int. J. Androl. 2000;23:4–12. doi: 10.1046/j.1365-2605.2000.00197.x. [DOI] [PubMed] [Google Scholar]
- 29.Storey P., Gonen O., Rosenkrantz A.B., Khurana K.K., Zhao T., Bhatta R., Alukal J.P. Quantitative Proton Spectroscopy of the Testes at 3 T: Toward a Noninvasive Biomarker of Spermatogenesis. Investig. Radiol. 2018;53:87–95. doi: 10.1097/RLI.0000000000000414. [DOI] [PMC free article] [PubMed] [Google Scholar]
- 30.Soni K.K., Kim H.K., Choi B.R., Karna K.K., You J.H., Cha J.S., Shin Y.S., Lee S.W., Kim C.Y., Park J.K. Dose-dependent effects of cisplatin on the severity of testicular injury in Sprague Dawley rats: Reactive oxygen species and endoplasmic reticulum stress. Drug Des. Dev. Ther. 2016;10:3959–3968. doi: 10.2147/DDDT.S120014. [DOI] [PMC free article] [PubMed] [Google Scholar]
Associated Data
This section collects any data citations, data availability statements, or supplementary materials included in this article.
Data Availability Statement
The data presented in this study are available on request from the corresponding author.


