Abstract
Parkinson’s Disease (PD) is a progressive central nervous system disorder that is caused due to the neural degeneration mainly in the substantia nigra in the brain. It is responsible for the decline of various motor functions due to the loss of dopamine-producing neurons. Tremors in hands is usually the initial symptom, followed by rigidity, bradykinesia, postural instability, and impaired balance. Proper diagnosis and preventive treatment can help patients improve their quality of life. We have proposed an ensemble of Deep Learning (DL) models to predict Parkinson’s using DaTscan images. Initially, we have used four DL models, namely, VGG16, ResNet50, Inception-V3, and Xception, to classify Parkinson’s disease. In the next stage, we have applied a Fuzzy Fusion logic-based ensemble approach to enhance the overall result of the classification model. The proposed model is assessed on a publicly available database provided by the Parkinson’s Progression Markers Initiative (PPMI). The achieved recognition accuracy, Precision, Sensitivity, Specificity, F1-score from the proposed model are 98.45%, 98.84%, 98.84%, 97.67%, and 98.84%, respectively which are higher than the individual model. We have also developed a Graphical User Interface (GUI)-based software tool for public use that instantly detects all classes using Magnetic Resonance Imaging (MRI) with reasonable accuracy. The proposed method offers better performance compared to other state-of-the-art methods in detecting PD. The developed GUI-based software tool can play a significant role in detecting the disease in real-time.
Keywords: Parkinson’s disease, CNN Model, ensemble method, DaTscan images
1. Introduction
Parkinson’s disease (PD) has a prevalence rate of 1% in the over-60 age group, and affects about 0–2 per 1000 people. It is the second most common brain disease after Alzheimer’s disease [1]. A central nervous system disorder, especially those affecting the brain, causes the neurons to degenerate. A person suffering from this disease will experience tremors at rest, bradykinesia (slow movement), rigidity, sleep disturbances, asymmetry in posture, depression, and other such symptoms. In the advanced stages of the disease, PD dementia becomes coarse and patients have difficulty sleeping or concentrating. People with PD lose the nerve endings that produce dopamine, the prime chemical which controls most of the involuntary functions of the body. This might help explain some of the involuntary symptoms of PD, like tiredness, non-uniform blood pressure, reduced peristalsis, and a sudden drop in blood pressure.
PD appears hereditary in some cases, and certain mutations can be traced to it, but most of the time this disease is random. There is a growing consensus that it is caused by a combination of genetics and environmental factors, such as exposure to toxins. A loss of dopaminergic neurons in the substantia nigra region of the brain is one of the leading causes of Parkinson’s disease [2]. Currently, there is no particular test for its diagnosis [3]. The diagnosis till date is primarily based on the symptoms mentioned above and their response to PD medications. However, non-invasive imaging like Positron Emission Tomography (PET) scans can help with the diagnosis. Since these are not purely scientific, the need for Artificial Intelligence (AI) based techniques for diagnosis become important. Researchers have been addressing the need for AI-based systems because many of them have been so far adopted successfully in different medical imaging applications [4,5,6].
The aim of this paper is to present an ensemble approach for the detection of PD that integrates decision scores obtained from four different DL models. In addition to assisting practitioners in performing disease diagnosis, the outcomes of this model will enable physicians to take action before patients’ disorders become more serious. The present study has been conducted using a publicly available database of DaTscan Single Photon Emission Computerized Tomography (SPECT) images accessed from the PPMI data [7]. The proposed model provides a higher recognition score than many of the existing methodologies in the literature.
The organization of the paper is as follows: some co-related works for the classification of PD have been mentioned in Section 2. Section 3 describes the motivation and overview of the proposed work. The details regarding the dataset used, along with the pre-processing steps applied to the dataset have been mentioned in Section 4. In Section 5, we have explained the methodology used in the present experiment including the details of the base models and the applied ensemble approach. Section 6 describes the results obtained by the proposed model and also compares its performance with other state-of-the-art techniques found in the literature. Section 7 describes the application that is developed by using the proposed methodology. Finally, Section 8 and Section 9 discuss and conclude the overall work.
2. Related Work
Till date, researchers across the world have been trying to observe the outcomes of various Machine Learning (ML) and DL-based methods for prediction of PD. Though several of these techniques have provided satisfactory results, it has also been noticed that different models yield different outcomes.
This section briefly highlights a few of the approaches available in the literature. Abos et al. [8] extracted features from Resting-State Functional MRI (rsfMRI) and used Support Vector Machine (SVM) for the detection of PD. They achieved an 86.96% accuracy, 78.95% sensitivity, and a specificity of 92.59%. Amoroso et al. [9] used network and clinical features to classify PD patients using an SVM. They experimented on the PPMI dataset and got a 93% recognition accuracy and sensitivity, and 92% of specificity. A Sparse feature selection model was proposed by Lei et al. [10], reporting an accuracy of around 80%. Salvatore et al. [11] considered healthy, PD, and supranuclear palsy MRI images to extract features. Next, they have used Principal Components Analysis (PCA) to find the relevant features and fed them to an SVM classifier for classification purposes, having obtained above 90% accuracy for the case of PD patients vs. controls. Prashant et al. [12] used SVM with striatal binding ratio to classify PD patients and they got an accuracy of 96.14%, a sensitivity score of 95.74%, and 77.35% specificity.
Brahim et al. [13] performed their experiments for classifying PD using shape and surface-fitting-based features and an SVM classifier. They achieved a 92.6% accuracy, a 91.2% sensitivity, and a specificity of 93.1%. An Artificial Neural Network (ANN) architecture for PD classification was proposed by Rumman et al. [14] and they obtained an accuracy of 94%, sensitivity of 100%, and specificity of 88%.
Sivaranjani et al. [15] proposed a Convolutional Neural Network (CNN) trained on the PPMI dataset and achieved an accuracy of 88.9%. Another DL-based framework was proposed by Esmaeilzadeh et al. [16] for classification and regression of PD on PPMI images. Shah et al. [17] have shown the effectiveness of their proposed CNN-based model used for the categorization of PD on the PPMI MRI dataset with good results. Another work to detect PD from Neuromelanin sensitive MRI using a CNN has been shown in [18] that has achieved an 85% accuracy. Magesh et al. [19] trained the VGG16 model on the PPMI dataset and obtained a 95.2% accuracy, and a specificity of 90.9%. Quan et al. [20] considered the transfer learning concept and used the InceptionV3 model in their experiment of predicting PD. They obtained a 98.4% accuracy, a sensitivity score of 98.8%, and a specificity score of 97.6%. Whereas, Ortiz et al. [21] trained two DL models—AlexNet and LeNet for the classification of PD and Health Control. They achieved a better accuracy of 95 ± 0.3% when using AlexNet.
After analyzing the methods reported in [18,19,20,21], we have observed that most of the models have some limitations. For example, a few models [17,19] have shown higher false positive rate, whereas some others [18,21] have shown higher false negative rate. The probable reason for that may be the weakness of the models to deal with the nature of data. According to the authors in [19], this may happen due to abnormal increase in dopamine activity in the Region of Interest (ROI) of the scans.
On the other hand, the literature reveals that the fusion techniques have already been applied successfully in distinct domains to produce a better result than any individual learning model [22,23,24]. An ensemble is a model which is used to combine the predictions made by different learning models. The predictions made by the members of an ensemble model may be combined using statistics (like mode or mean) or they can be combined using more sophisticated strategies. Generally, an ensemble model tries to learn how much to rely on each member and under what conditions. Though ensemble methods come with additional computational cost and complexity, there are reasons to use an ensemble model. Usually, an ensemble model makes better predictions and shows superior performance over a single learning model. Also, such a model reduces the dispersion of the predictions of the different base models. From the literature it can be observed that ensemble techniques have shown competent results in varied domains like predicting COVID-19 using CT scans [25], human activity recognition using sensor data [26], breast cancer detection using histopathology images [27], plant identification using leaf images [28], cervical cancer detection [29], handwritten music symbol recognition [30].
However, a limited number of research works are there which try to improve the overall classification accuracy of PD by introducing ensemble-based techniques applied to ML approaches. The author in [31] has shown the usefulness of the K-Nearest Neighbours (KNN) ensemble technique for the detection of PD. Authors in [32] combined SVM with linear kernel classifiers for different tests considering RNA, Cerebrospinal Fluid, Serum tests, and pre-processed neuro-images features from PPMI database subjects. Table 1 highlights a few past methods proposed so far in this domain.
Table 1.
A comparative study of some past methods related to the proposed work.
| Work Ref. | Dataset | Method/Classifier | Accuracy | Sensitivity | Specificity |
|---|---|---|---|---|---|
| [8] | Custom | SVM on rsfMRI | 86.96% | 78.95% | 92.59% |
| [9] | PPMI | SVM | 93% | 93% | 92% |
| [10] | PPMI | Sparse feature selection model | 80% | 84.70 ± 19.29% | - |
| [11] | PPMI | PCA followed by SVM | >90% | >90% | >90% |
| [12] | PPMI | SVM with striatal binding ratio | 96.14% | 95.74% | 77.35% |
| [13] | PPMI | SVM | 92.6% | 91.2% | 93.1% |
| [14] | PPMI | ANN | 94% | 100% | 88% |
| [15] | PPMI | AlexNet | 88.9% | - | - |
| [18] | Custom | CNN | 85% | - | - |
| [19] | PPMI | VGG-16 | 95.2% | - | 90.9% |
| [20] | PPMI | InceptionV3 | 98.4% | 98.8% | 97.6% |
| [21] | PPMI | AlexNet and LeNet | 95±0.3% | - | - |
| [31] | PD dataset | KNN | 98.46% | - | - |
| [32] | PPMI | SVM with linear kernel classifiers | 96% | - | - |
| [33] | Custom | Modified Grey Wolf Optimization | 94.83% | - | - |
| [34] | Custom | Optimized cuttlefish algorithm | 94% | - | - |
| [35] | PPMI | PCA and ANN | 97% | - | - |
| [36] | Custom | ROI based diagnosis | 86.67% | - | - |
3. Motivation and Overview
As in most cases, it has been observed that DL models perform better as compared to ML models due to their ability to extract powerful features automatically from inputs using convolution and pooling operations. Hence, in this work, we have considered DL models as the base learners. It is to be noted that DL based neural networks are actually nonlinear networks which come with better flexibility and also scale in proportion to the training data available. However, a flip side of this flexibility is that these models generally learn through a stochastic training method, and due to this they become very sensitive to the training data. Also, they may find a varied set of weights every time the models are trained, and hence they generate varied predictions about the input samples. A competent alternative to minimize the variance of neural network models can be to use different models instead of a single model, and to unite the prediction scores obtained from these models.
Keeping this fact in mind, we have used an ensemble learning approach where different standard CNN models are used to generate the initial predictions from the input DaTscan images related to PD, which are then combined using a Fuzzy-ranked based fusion approach. Although literature of PD detection divulges that a few number of researchers have made an attempt to apply ensemble approaches which are very naive, and hence may fail to capture information yielded by different learning models intelligently.
4. Dataset
The present experiments were conducted using a dataset containing 645 DaTscan SPECT images extracted from the Parkinson’s Progression Markers Initiative (PPMI) [7] DaTscan images were widely used in the automatic diagnosis of Parkinson’s Disease after being preprocessed and reorganized from PPMI SPECT images. Each PPMI SPECT image, then, is built into a volume of 91 × 109 × 91 [37,38].
4.1. Dataset Preparation
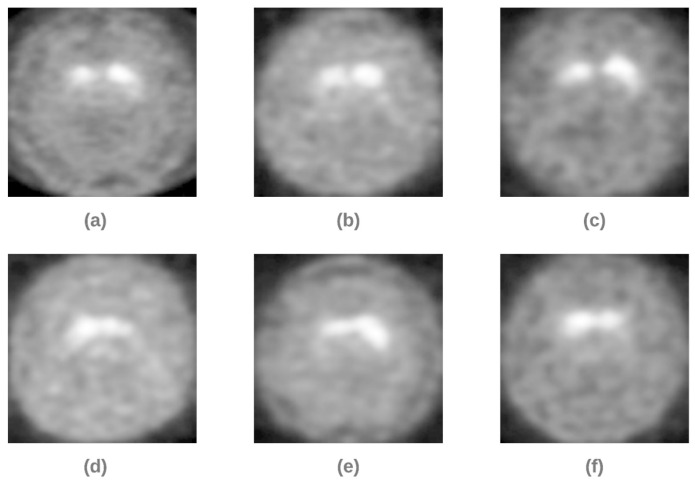
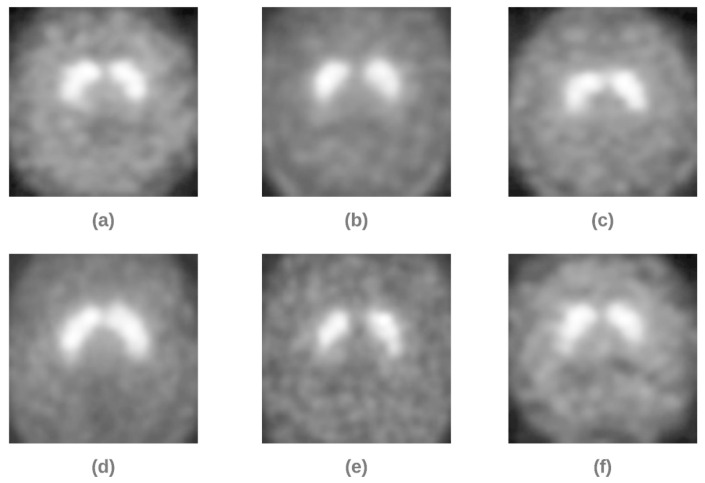
All the DaTscan images were in DICOM format, and each consisted of 91 slides of shape 109 × 91. To make them fit for the current study, we extracted the 41’st slide from every DaTscan image and converted it into png format. Due to the difference in the size of the brain of males and females, we cropped the extra unnecessary black portion. This resulted in the irregularity of the dimensions of the extracted images. To fit the extracted images into our DL models, we resized them to 224 × 224 resolution and were scaled between [0, 1], keeping the brightness range between [0.1, 1.5]. Figure 1 shows some of the sample images from the PPMI dataset for a person having PD and Figure 2 shows samples from PPMI dataset for a person without PD.
Figure 1.
Sample images (a–f) from PPMI dataset for a person suffering from PD.
Figure 2.
Sample images (a–f) from PPMI dataset for a person not suffering from PD.
4.2. Dataset Splitting
The dataset, consisting of a total of 645 images (432 PD and 213 non-PD), is randomly divided into an 80:20 ratio for train-test splitting. The details of the images (PD and non-PD) present in the train and test sets have been mentioned in Table 2.
Table 2.
Dataset details.
| Category | PD | Non-PD | Total |
|---|---|---|---|
| Train | 346 | 170 | 516 |
| Test | 86 | 43 | 129 |
5. Proposed Methodology
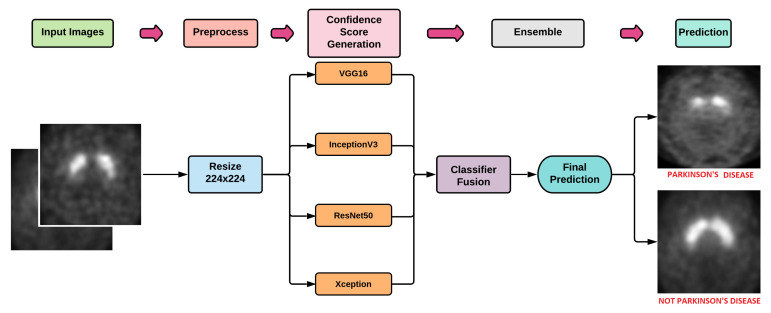
In the current work, initially we have trained four popularly used DL models namely VGG16 [39], Xception [40], ResNet50 [41], and Inception-V3 [42] on the training set of PPMI dataset. The trained models have been used for the evaluation of the test set. The obtained outcomes from these four models are then ensembled using the Fuzzy Rank Level Fusion (FRLF) based approach to elevate the overall performance of the model. Figure 3 shows the basic workflow of the proposed work.
Figure 3.
Workflow of the proposed work.
5.1. DL Models
In the current work, we have used VGG16, ResNet50, Inception-V3, and Xception models to train the training dataset. A brief description of the four DL models is mentioned in the following subsections.
5.1.1. VGG16
VGG16 was one of the best performing architectures in the ImageNet Large Scale Visual Recognition Challenge (ILSVRC) 2014 [39]. The model achieved a 92.7% test accuracy on the ImageNet dataset. The model contains a total of 16 layers - 13 Convolutional layers, 3 Fully Connected layers, 5 Max Pooling layers, and a Softmax layer.
All the hidden layers in this model use Rectified Linear Unit (ReLU) as its activation function. ReLU results in faster learning and also decreases the likelihood of vanishing gradient. To solve the current binary classification problem, we have added a final layer of Softmax activation. Figure 4 depicts the VGG16 architecture.
Figure 4.
Architecture of VGG16 model.
5.1.2. ResNet50
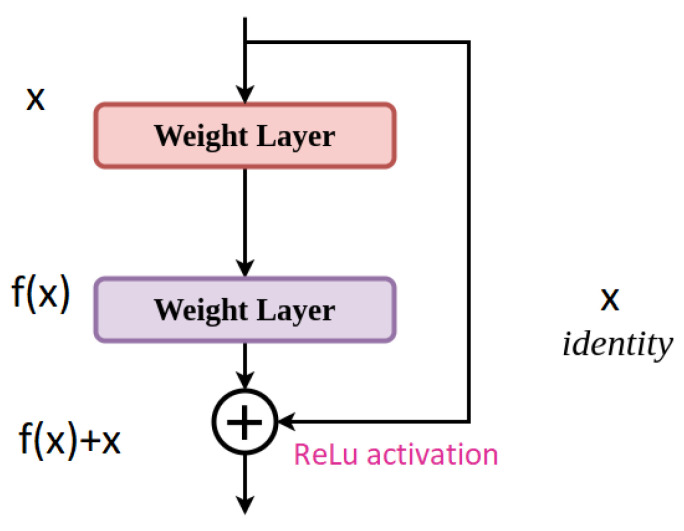
ResNet50 [41] introduces a 50-layer deep residual learning framework having shortcut connections that simply perform identity mappings. We have added a final layer of Softmax activation for the binary classification problem under consideration. Figure 5 depicts the architecture of the ResNet50 model.
Figure 5.
Architecture of ResNet50 model.
5.1.3. Inception-V3
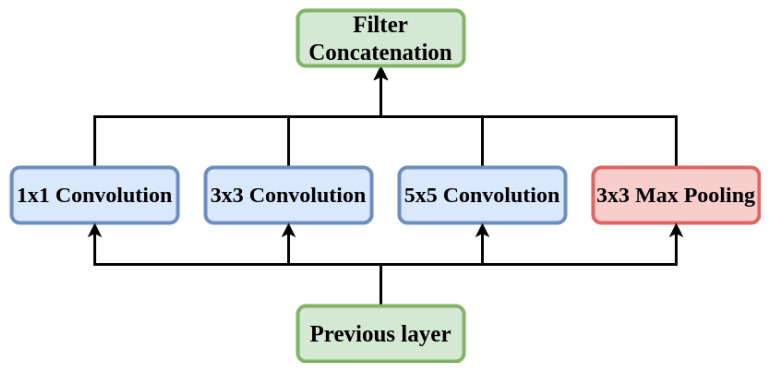
Inception-V3 [42] is a frequently used model for the image classification tasks. This model is composed of symmetric and asymmetric constituents including layers like convolution, average and max pooling, and fully connected layers. Despite having a 42-layer architecture and approximately 12 million parameters, the cost of computation is remarkably less and it is very much efficient than VGGNet [39]. Figure 6 depicts the architecture of the Inception-V3 model.
Figure 6.
Architecture of Inception-V3 model.
5.1.4. Xception
Xception stands for “extreme inception”. It re-frames the way we look at neural nets—Convolution Nets in particular. As the name suggests, it takes the principle of Inception to an extreme. In Xception there is no intermediate activation function for non-linearity [40].
We have added a final layer of Softmax activation for the current binary classification problem. The architecture is shown in Figure 7.
Figure 7.
Architecture of the Xception model.
In this work, we have trained VGG16, ResNet50, Inception-V3, and Xception models over a total of 500 epochs with batch size and step size of 16 and 32, respectively for each of the epochs. The learning rate of all the models was set to 0.001, and Adam optimizer has been used to handle sparse gradients on noisy images [43]. Confidence scores of these base models are then ensembled to improve the overall performance. The ensembled method used here is detailed in the next subsection.
5.2. Ensemble Method
Essentially, classifier combinations are developed from the idea that each classifier operates in a unique way so that different outcomes can be observed depending on the classifier. So, choosing only one classifier might not be the best idea since the used classifier might not be able to extract potential useful information. In order to avoid this problem, ensemble methods can be used that take into account the outcomes of the various classifiers and make the final choice so that overall accuracy is enhanced. The FRLF [44] algorithm here generates fuzzy ranks by using the confidence scores of a classifier on a Gaussian function. It compares the proximity of classifier outputs as opposed to conventional ranking methods. When a return is ideal, the fuzzy rank is 0, which corresponds to the highest rank (rank 1) in conventional ranking; when the outcome is far away from the ideal, the fuzzy rank gradually approaches unity. This ensemble approach aims to generate a ranking system based on the confidence scores of the base learners, which will become apparent later in this section.
The FRLF method can be expressed mathematically as follows. Let there be N different models (, , …, ) for a particular input. In our case, the value of N is 4, as mentioned above.
In the first step, our proposed system chooses a model (say ) and generates confidence scores for all the corresponding classes. Let the confidence scores be (, , …, ). The confidence scores are then used to calculate fuzzy ranks. The Gaussian density function is used to assign lesser rank to scores with higher confidence. Let the fuzzy ranks be (, , …, ) where C represents the sum of the number of distinct classes in consideration. In specific, The and represent the confidence score and fuzzy rank of the class while classifying through the model . Correspondingly, we have (, , …, ) and (, , …, ) and so on for the models used in the experiments.
In order to fulfill the following condition, the confidence scores have to be normalized:
| (1) |
The fuzzy rank for a class c using model is generated by taking the complement of the Gaussian density Function, as shown below:
| (2) |
As a result, it should be noted that lies between [0, 1] and lowest value is said to be the winner which is analogous to top ranked in conventional ranking.
Let, represents the set of top K fuzzy ranked classes generated by the model . It is to be noted that and () might differ as they belong to two different classifier models. The complement of confidence score sum and the rank sum relative to a class c is determined as follows:
| (3) |
| (4) |
where and are the penalties, which are assigned to a class c if it does not belong to the set of top K ranks (1 in our case). and are the hyper-parameters and for our case and have values of 0.33 and 0.05 respectively which is obtained experimentally. These particular set of values have yielded the maximum accuracy score for our dataset. Both these penalties revoke the possibility of class c to likely become a winner. The combination of and are multiplied to obtain the final score used for the final ranking, which is defined as follows:
| (5) |
Finally, a class with the smallest (minimum) final score is selected as the predicted class of the input sample as shown in the equation below:
| (6) |
6. Results
In this section, we have provided a discussion about the results obtained from the four base learners, i.e., VGG16, ResNet50, Inception-V3, and Xception. The later part of this section also reports the explainability of the base learners using Grad-Cam and the outcomes observed after applying the proposed FRLF method.
To analyze the obtained outcomes, the metrics and the equations used to compute the values of the metrics have been shown through Equations (7)–(11)
| (7) |
| (8) |
| (9) |
| (10) |
| (11) |
where, TP, TN, FP, and FN are defined as follows:
True Positives (TP): True positives are the case when the actual class of the data point was True (1) and the predicted class is also True (1).
True Negative (TN): True negatives are the case when the actual class of the data point was False (0) and the predicted class is also False (0).
False Positive (FP): False positives are the case when the actual class of the data point was False (1) and the predicted class is True (1).
False Negative (FN): False negatives are the case when the actual class of the data point was True (1) and the predicted class is False (0).
6.1. Results of Base Learners
After training the base learners, i.e., VGG16, ResNet50, Inception-V3, and Xception, each of them was then evaluated on the test set. Table 3 shows the results obtained by the four base learners.
Table 3.
Observed results from the DL models for the prediction of PD.
| Model | Accuracy | Precision | Sensitivity | Specificity | F1-Score |
|---|---|---|---|---|---|
| VGG16 | 95.34% | 96.51% | 96.51% | 93.02% | 96.51% |
| ResNet 50 | 93.02% | 95.29% | 94.19% | 90.69% | 94.74% |
| Inception-V3 | 93.02% | 92.31% | 97.67% | 83.72% | 94.81% |
| Xception | 95.34% | 94.44% | 98.84% | 88.37% | 96.59% |
From Table 2, it is to notice that both VGG16 and Xception models obtained the highest accuracy among all the base learners, attaining an accuracy of 95.34%. Both ResNet50 and InceptionV3 models exhibit the lowest performance by providing an accuracy of 93.04% for the test set. Despite acquiring the same truthfulness in both cases, the models differ in several and . The experimental analysis also reveals that Inception-V3 and Xception models predict PD patients more accurately as they misclassify the least number of PD patients. On the other hand, VGG16 and ResNet50 can predict non-PD patients more accurately.
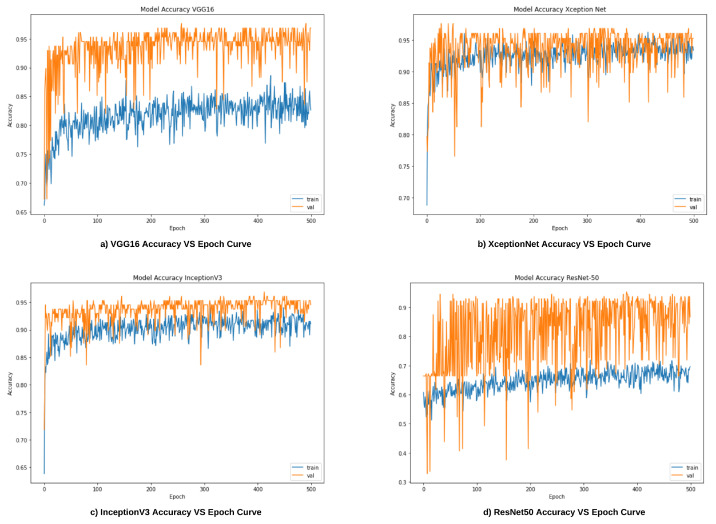
Figure 8a–d illustrates the accuracy vs. epoch curves for the train and test sets for all four base CNN models.
Figure 8.
Accuracy vs. Epoch curves for the base learners.
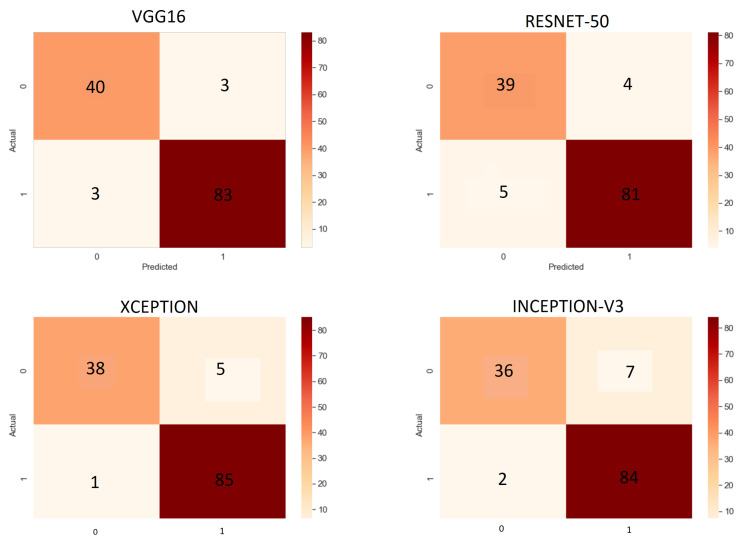
Figure 9 depicts the confusion matrix for all the base learners evaluated on the test set.
Figure 9.
Confusion matrices for all base learners.
6.2. Grad-Cam Analysis of Base Learners
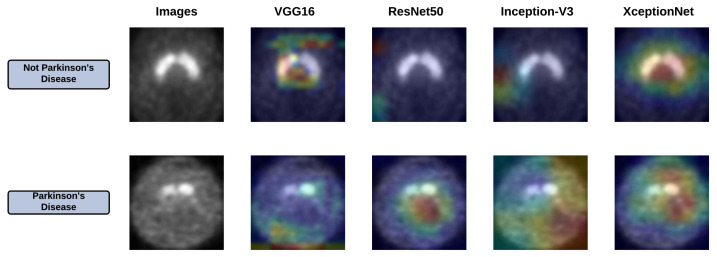
The base learners have facilitated impressive accuracy in the classification of PD and non-PD, yet the biggest problem is in their explainability, which is the vital aspect of understanding and debugging. To understand where the base learners are looking into the input images, we have provided Grad-Cam analysis [45]. This method uses the gradients of a target class, which flows through the final convolutional layer to generate a concentrated map emphasizing the ROI. Figure 10 depicts the ROI obtained by applying Grad-Cam for all the base learners.
Figure 10.
Grad-Cam of all the base learners.
6.3. Results of Ensemble Approach
After obtaining the results from the base learners, we have ensembled the outcomes using the previously mentioned FRLF method to enhance the overall recognition performance of the proposed system. We have also experimented with a few other basic ensemble techniques like Sum Rule, Product Rule, and Majority Voting to compare the outcomes with the FRLF technique. The working strategy of sum rule, product rule, and majority voting is mentioned here in brief.
Let there be N different models (, , …, ). Let the ith model in consideration be whose confidence score are (, , …, ) where C are the total number of classes in consideration. Then for sum rule [46], the final equation for the prediction of the class for a particular input X is defined as:
| (12) |
| (13) |
similarly, for the product rule [47], the equation is deduced as follows:
| (14) |
| (15) |
for the majority voting [47] ensemble approach, the equation for the final class prediction comes out to be:
| (16) |
| (17) |
where, , and are the final confidence score for a class c, prediction of a model with the highest probability and a function which returns the category which has the highest number of occurrences for a given input X.
Table 4 reflects the results obtained after applying these ensemble techniques.
Table 4.
Results obtained after applying different ensemble approaches.
| Model | Accuracy (in %) | Precision | Sensitivity | Specificity | F1-Score |
|---|---|---|---|---|---|
| Sum Rule | 96.89% | 96.59% | 98.84% | 93.02% | 97.70% |
| Product Rule | 92.25% | 90.42% | 98.84% | 79.07% | 94.44% |
| Majority Voting | 96.12% | 95.5% | 98.84% | 90.69% | 97.59% |
| FRLF method | 98.45% | 98.84% | 98.84% | 97.67% | 98.84% |
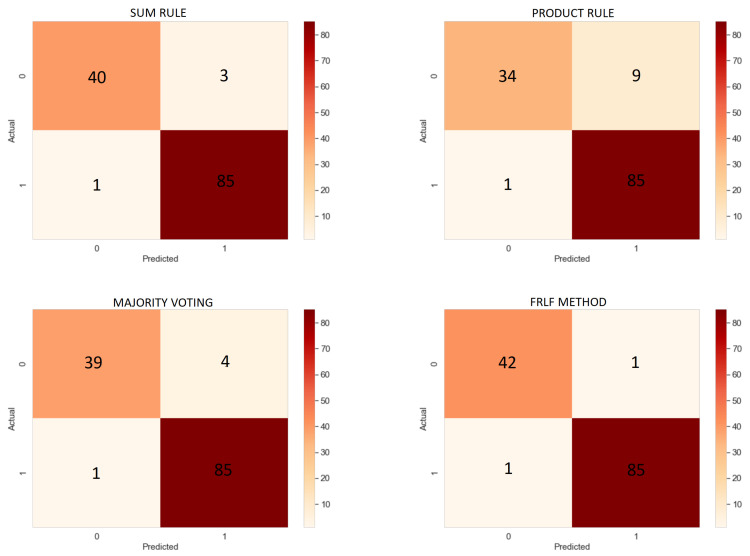
From Table 4, it is to notice that the applied sum rule, product rule, majority voting, and the proposed FRLF method produce an accuracy of 96.89%, 92.25%, 96.12%, and 98.45%. Looking into the accuracy obtained by the ensembled approach, all of them except the product rule performed better than the base learners. Despite achieving the lowest accuracy by-product rule, all the four ensembles can predict the PD patients more accurately by only misclassifying one PD patient as a non-PD patient, i.e., , yet they differ in several false positives.
The FRLF ensemble-based approach performed significantly higher than the base learners as well as the other ensembled methods. In contrast to supplementary ensemble approaches, the FRLF method misclassified only 2 images, 1 for each of the and , obtaining the highest among all the metrics taken into consideration. Figure 11 shows the confusion matrices obtained from all the ensemble approach.
Figure 11.
Confusion Matrices of Ensemble method.
6.4. Comparison
Table 5 compares the performance of the proposed FRLF system for the classification of Parkinson’s disease with some past works mentioned in the literature.
Table 5.
Comparison of our proposed method with some past methods found in the literature.
| Work Ref. | Method/Classifier | Accuracy | Dataset Used |
|---|---|---|---|
| [12] | SVM with Striatal Binding Ratio | 96.14% | PPMI |
| [13] | PCA with SVM | 92.60% | PPMI |
| [14] | Custom ANN | 94.00% | PPMI |
| [19] | VGG-16 | 95.20% | PPMI |
| [20] | InceptionV3 | 98.40% | PPMI |
| [21] | LeNet and AlexNet | 95% ± 0.30% | PPMI |
| [48] | t-test and SVM | 86.96% | PPMI |
| Proposed | CNN models + FRLF | 98.45% | PPMI |
Authors in [48] used the dataset that was considerably smaller (19 PD patients and 27 healthy subjects) than the PPMI MRI dataset. They have achieved 86.96% recognition accuracy which is also lesser than our proposed approach. Authors in [19] developed a DL-based model using LIME and VGG16 for the early diagnosis of Parkinson’s disease using the same PPMI dataset and obtained 95.20% accuracy that is relatively lesser than our proposed technique. From the remaining entries of this table, it can be observed that the works mentioned through [12,13,14,20,21] also performed the same task of predicting Parkinson’s disease on the same PPMI dataset. Looking into the obtained accuracies, it can be said that our proposed technique outperforms all the works.
7. Software Tool
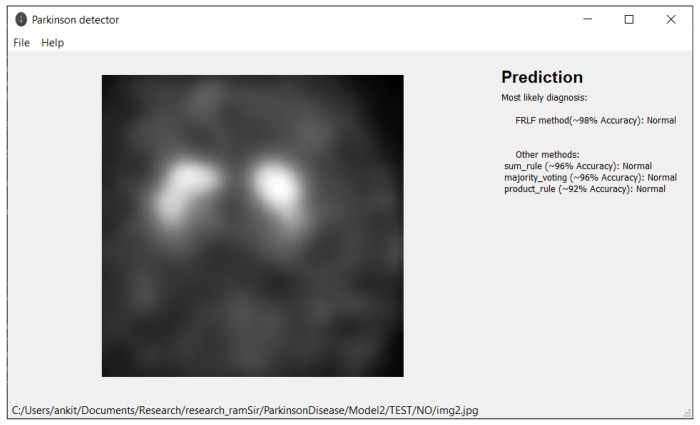
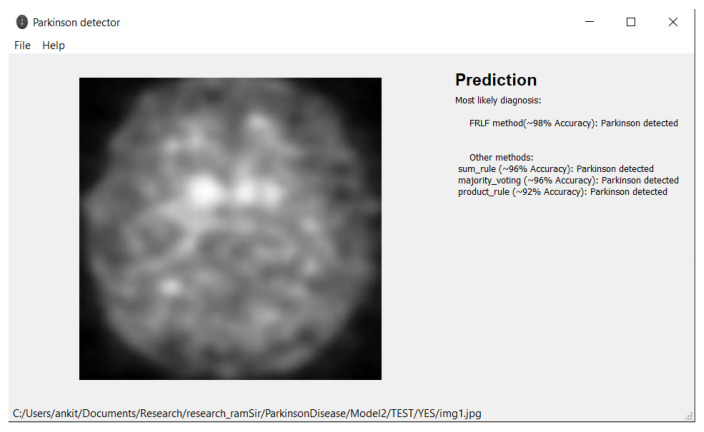
Based on the proposed model, we have developed an application provided in [49] for working with MRI images that can be used by any medical personnel as a support tool for fast preliminary diagnosis. The application is written in Python and runs in both Windows and Linux environment. The user interface is implemented using the Qt library. Our application can work directly with Dicom files (.dcm) from an MRI machine or with any image files (jpg, png, etc.) exported from DICOM viewers. We provided a simple user interface with drag-and-drop support. Figure 12 and Figure 13 depict the outcomes of the application. In the application, we implement all presented ensemble approaches (Sum Rule, Product Rule, Majority voting, and new FRLF method). All ensemble methods use 4 neural networks: VGG-16, ResNet 50, InceptionV3, and Xception. Application requirements include:
-
Operating system:
-
–
Windows 7 or later
-
–
Ubuntu 16.04 or later
-
–
Mac OS 10.12.6 (Sierra) or later (64-bit) (no GPU support)
-
–
Python 3.6 or later
Hard Drive-Maximum 4GB of free space
Processor-Intel Core i3
Internet connection-wideband connection for first use (for neural networks downloading)
Admin privileges are not a requirement.
Figure 12.
Illustration of prediction made by the software tool while classifying the DaTscan image as “Normal” class.
Figure 13.
Illustration of prediction made by the software tool while classifying the DaTscan image as “PD” class.
Note: prediction from the application cannot be used as a medical diagnosis.
8. Discussion
Parkinson’s disease has a prevalence rate of 1% in the over-60 age group, and it is the second most common brain disease after Alzheimer’s disease. In addition to assisting practitioners in the process of disease diagnosis, the outcomes of this model will enable them to take timely action before patients’ disorders become more serious.
Based on previously stated results, we can safely comment that our method works effectively on the PPMI dataset, and achieves an accuracy of 98.45%. Also, in the medical image analysis domain especially, it is absolutely necessary to reduce the number of mis-classifications because a false diagnosis can cause physical, emotional and psychological damage to the patient and his/her family. We have observed that the number of false positives and false negatives gets reduced significantly when we have used the FRLF ensemble technique as compared to when we use the Sum Rule, Product Rule and Majority Scoring technique.
One limitation of our work is the number of mis-classifications. Though it is less than most other methods tested on the dataset, we still have wrongly classified images and hence this cannot be used for medical diagnosis with a 100% accuracy. Also, we do not know if the FRLF method is domain-specific or can be applied on other diseases except for Parkinson’s disease. We plan to reduce the number of inaccurate classifications and to test the FRLF ensemble technique on other datasets.
9. Conclusions
In the present work, we have proposed an ensemble of DL models to predict Parkinson’s disease effectively using the PPMI DaTscan images. We have designed a fuzzy ensemble model, called FRLF, which is applied on the confidence scores of four classic DL models- VGG16, ResNet50, Inception-V3, and Xception to enhance the overall results of the model. From the results reported in the above section, we can ensure that the proposed model achieves state-of-the-art performance. Recognition accuracy, Precision, Sensitivity, Specificity, F1-score of the proposed model are 98.45%, 98.84%, 98.84%, 97.67%, and 98.84% respectively. We have also incorporated our model in a GUI-based software tool for public use that instantly detects Parkinson’s disease in DaTscan images given to it as inputs. This can play a significant role in detecting Parkinson’s disease in real-time. Our work is primarily based on DaTscan images. We have not yet extended our work to MRI scans or CT scans, which is our plan for future work in this domain.
Author Contributions
Conceptualization, A.K., S.B., S.S., A.S., D.K. and R.S.; Methodology, R.S., S.S.; Software, A.K., D.K. and A.S.; Validation, S.S., S.B. and R.S.; Formal analysis, A.K., D.K., A.S. and R.S.; Investigation, A.K., S.S., R.S. and D.K.; Resources, R.S. and D.K.; Data curation, A.K., S.B., S.S., A.S., D.K. and R.S.; Writing—original draft preparation, A.K., S.S., S.B., R.S., D.K. and A.S.; Writing—review and editing, R.S., S.S. and D.K.; Visualization, A.K., S.B. and S.S.; Supervision, R.S.; Project administration, R.S., S.S. and D.K.; Funding acquisition, D.K. and A.S. All authors have read and agreed to the presented version of the manuscript.
Institutional Review Board Statement
Not applicable.
Informed Consent Statement
Not applicable.
Data Availability Statement
Dataset used here is a public one.
Conflicts of Interest
The authors declare no conflict of interest.
Funding Statement
This research received no external funding.
Footnotes
Publisher’s Note: MDPI stays neutral with regard to jurisdictional claims in published maps and institutional affiliations.
References
- 1.Tysnes O., Storstein A. Epidemiology of Parkinson’s disease. J. Neural. Transm. 2017;124:901–905. doi: 10.1007/s00702-017-1686-y. [DOI] [PubMed] [Google Scholar]
- 2.What Causes Parkinson’s Disease. [(accessed on 2 March 2019)]. Available online: https://www.parkinson.org/Understanding-Parkinsons/Causes.
- 3.Massano J., Bhatia K.P. Clinical approach to parkinson’s disease: Features, diagnosis, and principles of management. Cold Spring Harb. Perspect Med. 2012;2:a008870. doi: 10.1101/cshperspect.a008870. [DOI] [PMC free article] [PubMed] [Google Scholar]
- 4.Zhang A., San-Segundo R., Panev S., Tabor G., Stebbins K., Whitford A.S., De la Torre F., Hodgins J.K. Automated tremor detection in parkinson’s disease using accelerometer signals; Proceedings of the IEEE/ACM International Conference on Connected Health: Applications, Systems and Engineering Technologies; Washington, DC, USA. 26–28 September 2018; pp. 13–14. [DOI] [Google Scholar]
- 5.Cai Z., Gu J., Wen C., Zhao D., Huang C., Huang H., Tong C., Li J., Chen H. An intelligent parkinson’s disease diagnostic system based on a chaotic bacterial foraging optimization enhanced fuzzy knn approach. Comput. Math. Methods Med. 2018;2018:2396952. doi: 10.1155/2018/2396952. [DOI] [PMC free article] [PubMed] [Google Scholar]
- 6.Tagaris A., Kollias D., Stafylopatis A. Assessment of parkinson’s disease based on deep neural networks; Proceedings of the International Conference on Engineering Applications of Neural Networks; Crete, Greece. 5–7 June 2017; pp. 391–403. [DOI] [Google Scholar]
- 7.Parkinson’s Progression Markers Initiative. [(accessed on 2 March 2019)]. Available online: https://www.ppmi-info.org/
- 8.Abós A., Baggio H., Segura B., García-Díaz A.I., Compta Y., Martí M.J., Junqué F.V., Junqué C. Discriminating cognitive status in Parkinson’s disease through functional connectomics and machine learning. Sci. Rep. 2017;7:45347. doi: 10.1038/srep45347. [DOI] [PMC free article] [PubMed] [Google Scholar]
- 9.Amoroso N., Rocca M.L., Monaco A., Bellotti R., Tangaro S. Complex networks reveal early MRI markers of Parkinson’s disease. Med. Image Anal. 2018;48:12–24. doi: 10.1016/j.media.2018.05.004. [DOI] [PubMed] [Google Scholar]
- 10.Lei H., Zhao Y., Wen Y., Luo Q., Cai Y., Liu G., Lei B. Sparse feature learning for multi-class Parkinson’s disease classification. Technol. Health Care. 2018;26:193–203. doi: 10.3233/THC-174548. [DOI] [PMC free article] [PubMed] [Google Scholar]
- 11.Salvatore C., Cerasa A., Castiglioni I., Gallivanone F., Augimeri A., Lopez M., Arabia G., Morelli M., Gilardi M.C., Quattrone A. Machine learning on brain MRI data for differential diagnosis of Parkinson’s disease and Progressive Supranuclear Palsy. J. Neurosci. Methods. 2014;222:230–237. doi: 10.1016/j.jneumeth.2013.11.016. [DOI] [PubMed] [Google Scholar]
- 12.Prashanth R., Roy S.D., Mandal P.K., Ghosh S. High-Accuracy Classification of Parkinson’s Disease Through Shape Analysis and Surface Fitting in 123I-Ioflupane SPECT Imaging. IEEE J. Biomed. Health Inform. 2017;21:794–802. doi: 10.1109/JBHI.2016.2547901. [DOI] [PubMed] [Google Scholar]
- 13.Brahim A., Khedher L., Górriz J.M., Ramírez J., Toumi H., Lespessailles E., Jennane R., El Hassouni M. A proposed computer-aided diagnosis system for parkinson’s disease classification using 123i-fp-cit imaging; Proceedings of the International Conference on Advanced Technologies for Signal and Image Processing (ATSIP); Fez, Morocco. 22–24 May 2017; [DOI] [Google Scholar]
- 14.Rumman M., Tasneem A.N., Farzana S., Pavel M.I., Alam M.A. Early detection of parkinson’s disease using image processing and artificial neural network; Proceedings of the International Conference on Informatics, Electronics and Vision; Kitakyushu, Japan. 25–29 June 2018; [DOI] [Google Scholar]
- 15.Sivaranjini S., Sujatha C.M. Deep learning based diagnosis of pd using convolutional neural network. Multimed. Tools Appl. 2020;79:15467–15479. doi: 10.1007/s11042-019-7469-8. [DOI] [Google Scholar]
- 16.Esmaeilzadeh S., Yang Y., Adeli E. End-to-End Parkinson Disease Diagnosis using Brain MR-Images by 3D-CNN. arXiv. 20181806.05233 [Google Scholar]
- 17.Shah P.M., Zeb A., Shafi U., Zaidi S.F.A., Shah M.A. Detection of parkinson disease in brain mri using convolutional neural network; Proceedings of the 24th International Conference on Automation and Computing (ICAC); Newcastle upon Tyne, UK. 6–7 September 2018; [DOI] [Google Scholar]
- 18.Shinde S., Prasad S., Saboo Y., Kaushick R., Saini J., Pal P.K., Ingalhalikar M. Predictive markers for Parkinson’s disease using deep neural nets on neuromelanin sensitive MRI. Neuroimage. 2019;22:101748. doi: 10.1016/j.nicl.2019.101748. [DOI] [PMC free article] [PubMed] [Google Scholar]
- 19.Magesh P.R., Myloth R.D., Tom R.J. An explainable machine learning model for early detection of parkinson’s disease using lime on datscan imagery. Comput. Biol. Med. 2020;126:104041. doi: 10.1016/j.compbiomed.2020.104041. [DOI] [PubMed] [Google Scholar]
- 20.Quan J., Xu L., Xu R., Tong T., Su J. DaTscan SPECT Image Classification for Parkinson’s Disease. arXiv. 20191909.04142 [Google Scholar]
- 21.Ortiz A., Munilla J., Martínez-Ibañez M., Górriz J.M., Ramírez J., Salas-Gonzalez D. Parkinson’s disease detection using isosurfacesbased features and convolutional neural networks. Front. Neuroinform. 2019;13:48. doi: 10.3389/fninf.2019.00048. [DOI] [PMC free article] [PubMed] [Google Scholar]
- 22.Banerjee A., Singh P.K., Sarkar R. Fuzzy integral based cnn classifier fusion for 3d skeleton action recognition. IEEE Trans. Circuits Syst. Video Technol. 2020;31:2206–2216. doi: 10.1109/TCSVT.2020.3019293. [DOI] [Google Scholar]
- 23.Garain A., Singh P.K., Sarkar R. Fuzzygcp: A deep learning architecture for automatic spoken language identification from speech signals. Expert Syst. Appl. 2021;168:114416. doi: 10.1016/j.eswa.2020.114416. [DOI] [Google Scholar]
- 24.Sarkar S.S., Ansari M.S., Mahanty A., Mali K., Sarkar R. Microstructure image classification: A classifier combination approach using fuzzy integral measure. Integr. Mater Manuf. Innov. 2021;10:286–298. doi: 10.1007/s40192-021-00210-x. [DOI] [Google Scholar]
- 25.Kundu R., Singh P.K., Mirjalili S., Sarkar R. COVID-19 detection from lung CT-Scans using a fuzzy integral-based CNN ensemble. Comput. Biol. Med. 2021;138:104895. doi: 10.1016/j.compbiomed.2021.104895. [DOI] [PMC free article] [PubMed] [Google Scholar]
- 26.Ghosal S., Sarkar M., Sarkar R. NoFED-Net: Non-Linear Fuzzy Ensemble of Deep Neural Networks for Human Activity Recognition. IEEE Internet Things J. 2022 doi: 10.1109/JIOT.2022.3155560. [DOI] [Google Scholar]
- 27.Bhowal P., Sen S., Velasquez J.D., Sarkar R. Fuzzy ensemble of deep learning models using choquet fuzzy integral, coalition game and information theory for breast cancer histology classification. Expert Syst. Appl. 2022;190:116167. doi: 10.1016/j.eswa.2021.116167. [DOI] [Google Scholar]
- 28.Ganguly S., Bhowal P., Oliva D., Sarkar R. BLeafNet: A Bonferroni mean operator based fusion of CNN models for plant identification using leaf image classification. Ecol. Inform. 2022;69:101585. doi: 10.1016/j.ecoinf.2022.101585. [DOI] [Google Scholar]
- 29.Pramanik R., Biswas M., Sen S., de Souza A., Júnior L., Paulo Papa J., Sarkar R. A Fuzzy Distance-based Ensemble of Deep Models for Cervical Cancer Detection. Comput. Methods Programs Biomed. 2022;219:106776. doi: 10.1016/j.cmpb.2022.106776. [DOI] [PubMed] [Google Scholar]
- 30.Paul A., Pramanik R., Malakar S., Sarkar R. An ensemble of deep transfer learning models for handwritten music symbol recognition. Neural Comput. Appl. 2021:1–19. doi: 10.1007/s00521-021-06629-9. [DOI] [Google Scholar]
- 31.Gök M. An ensemble of k-nearest neighbours algorithm for detection of parkinson’s disease. Int. J. Syst. Sci. 2013;46:1108–1112. doi: 10.1080/00207721.2013.809613. [DOI] [Google Scholar]
- 32.Castillo-Barnes D., Ramírez J., Segovia F., Martínez-Murcia F., Salas-Gonzalez D., Górriz J. Robust ensemble classification methodology for i123-ioflupane spect images and multiple heterogeneous biomarkers in the diagnosis of parkinson’s disease. Front. Neuroinformatics. 2018;12:53. doi: 10.3389/fninf.2018.00053. [DOI] [PMC free article] [PubMed] [Google Scholar]
- 33.Sharma P., Sundaram S., Sharma M., Sharma A., Gupta D. Diagnosis of Parkinson’s disease using modified grey wolf optimization. Cogn. Syst. Res. 2018;54:100–115. doi: 10.1016/j.cogsys.2018.12.002. [DOI] [Google Scholar]
- 34.Gupta D., Julka A., Jain S., Aggarwal T., Khanna A., Arunkumar N., de Albuquerque V.H.C. Optimized cuttlefish algorithm for diagnosis of Parkinson’s disease. Cogn. Syst. Res. 2018;52:36–48. doi: 10.1016/j.cogsys.2018.06.006. [DOI] [Google Scholar]
- 35.Sharma V., Kaur S., Kumar J., Singh A.K. A Fast Parkinson’s Disease Prediction Technique using PCA and Artificial Neural Network; Proceedings of the 2019 International Conference on Intelligent Computing and Control Systems (ICCS); Madurai, India. 15–17 May 2019; pp. 1491–1496. [DOI] [Google Scholar]
- 36.Rana B., Juneja A., Saxena M., Gudwani S., Kumaran S.S., Agrawal R.K., Behari M. Regions-of-interest based automated diagnosis of Parkinson’s disease using T1-weighted MRI. Expert Syst. Appl. 2015;42:4506–4516. doi: 10.1016/j.eswa.2015.01.062. [DOI] [Google Scholar]
- 37.Adams M.P., Rahmim A., Tang J. Improved motor outcome prediction in Parkinson’s disease applying deep learning to DaTscan SPECT images. Comput. Biol. Med. 2021;132:104312. doi: 10.1016/j.compbiomed.2021.104312. [DOI] [PubMed] [Google Scholar]
- 38.Leung K.H., Rowe S.P., Pomper M.G., Du Y. A three-stage, deep learning, ensemble approach for prognosis in patients with Parkinson’s disease. EJNMMI Res. 2021;11:52. doi: 10.1186/s13550-021-00795-6. [DOI] [PMC free article] [PubMed] [Google Scholar]
- 39.Simonyan K., Zisserman A. Very deep convolutional networks for large-scale image recognition. arXiv. 20141409.1556 [Google Scholar]
- 40.Chollet F. Xception: Deep Learning with Depthwise Separable Convolutions; Proceedings of the 2017 IEEE Conference on Computer Vision and Pattern Recognition (CVPR); Honolulu, HI, USA. 21–26 July 2017; [DOI] [Google Scholar]
- 41.He K., Zhang X., Ren S., Sun J. Deep residual learning for image recognition; Proceedings of the 2016 IEEE Conference on Computer Vision and Pattern Recognition (CVPR); Las Vegas, NV, USA. 27–30 June 2016; [DOI] [Google Scholar]
- 42.Szegedy C., Vanhoucke V., Ioffe S., Shlens J., Wojna Z. Rethinking the inception architecture for computer vision. arXiv. 20151512.00567 [Google Scholar]
- 43.Kingma D.P., Ba J. Adam: A method for stochastic optimization. arXiv. 20141412.6980 [Google Scholar]
- 44.Sing J.K., Dey A., Ghosh M. Confidence factor weighted gaussian function induced parallel fuzzy rank-level fusion for inference and its application to face recognition. Inf. Fusion. 2019;47:60–71. doi: 10.1016/j.inffus.2018.07.005. [DOI] [Google Scholar]
- 45.Selvaraju R.R., Cogswell M., Das A., Vedantam R., Parikh D., Batra D. Grad-cam: Visual explanations from deep networks via gradientbased localization; Proceedings of the IEEE International Conference on Computer Vision 2017; Venice, Italy. 2–29 October 2017; pp. 618–626. [DOI] [Google Scholar]
- 46.De R., Chakraborty A., Chatterjee A., Sarkar R. A weighted ensemble-based active learning model to label microarray data. Med. Biol. Eng. Comput. 2020;58:2427–2441. doi: 10.1007/s11517-020-02238-1. [DOI] [PubMed] [Google Scholar]
- 47.Mohandes M., Deriche M., Aliyu S.O. Classifiers combination techniques: A comprehensive review. IEEE Access. 2018;6:19626–19639. doi: 10.1109/ACCESS.2018.2813079. [DOI] [Google Scholar]
- 48.Long D., Wang J., Xuan M., Gu Q., Xu X., Kong D., Zhang M. Automatic classification of early pd with multi-modal mr imaging. PLoS ONE. 2012;7:e47714. doi: 10.1371/journal.pone.0047714. [DOI] [PMC free article] [PubMed] [Google Scholar]
- 49. [(accessed on 17 June 2021)]. Available online: https://gitlab.com/digiratory/biomedimaging/parkinson-detector.
Associated Data
This section collects any data citations, data availability statements, or supplementary materials included in this article.
Data Availability Statement
Dataset used here is a public one.


