Abstract
The potential impact of natural factors on the runoff of intermittent rivers and ephemeral streams (IRES) has been largely ignored in the Tarim Basin, China. A representative example is the Keriya River. To quantify the long-term dynamic variations in lower reach surface runoff of IRES, river length, defined as the distance between a selected fix point along the perennial river segment to its dynamic, ephemeral end, was used as an indicator. Using a total of 272 remote sensing images, we digitized and measured the distance (river length) between the center of Yutian County and the river’s end point on each image, and then calculated monthly inter-annual and intra-annual variations in length of the lower Keriya River from 2000 to 2019. Hydrometeorological data were combined with descriptors of anthropogenic disturbances to assess the relative influence of natural factors and anthropogenic disturbances on lower reach river runoff. The results showed that intra-annual variations in river length fluctuated seasonally, with the minimum value occurring in June; two main peaks occurred in March and August. The minimum June value in river length was closely linked to an increase in agricultural water demand and a decrease in upper reach runoff. The August peak in river length was related to the peak values in upper reach runoff and agricultural water demand; upper reach runoff made a significant contribution because the former was about 20% more than the latter in summer. The March peak corresponded to elevated lower reach groundwater levels and to the melting of ice along river channels. Inter-annual variations in river length were due to inter-annual variations in upper reach runoff and middle reach agricultural water use which increased slightly during the study period. Inter-annual variations in frequency and amplitude of the fluctuations in river length were mainly controlled by changes in upper reach runoff. The minimum in river length in 2009 was consistent with the low in upper reach runoff of the Keriya River and other rivers in the Tarim Basin. The most significant factors controlling variations in river length are natural in origin.
1. Introduction
Drylands encompass areas where the climate is classified as dry subhumid, semiarid, arid or hyper-arid; they cover about 41% of Earth’s terrestrial surface, and feed more than 38% of the global population [1]. They are also one of the most ecological fragile areas on the planet [2, 3] and contain intermittent rivers and ephemeral streams (IRES). IRES are defined as streams that cease to flow at some point along the river’s lower (downstream) reach [4]; they provide important ecological services that play a vital worldwide role in supporting biodiversity and human societies [5, 6]. IRES are often one of the most important sources of water in arid regions and constitute a large proportion of the total number and length of the planet’s rivers [7, 8]. The number and length of IRES are continuously increasing in global drylands as a result of climate change and human-induced water abstractions [4, 8]. Thus, the IRES of arid regions are becoming the focus of academic investigation. Nonetheless, most studies on rivers in arid regions have focused on perennial streams and rivers; there have been far fewer investigations of IRES [9]. The studies of IRES that have been conducted to date have mostly: (1) debated the definition of an IRES [4, 8, 10], (2) described their hydrological characteristics [7, 11–16], (3) developed conceptual models of stream flow [17, 18], (4) outlined the driving factors for their development [19–21], (5) assessed their hydrological connectivity [6, 22–24], and (6) discussed their management and protection [5, 9, 25–27]. The long-term change of IRES has not been strictly quantified on a global scale, and the universality, importance and fate of IRES have been neglected [6]. The limited study of IRES is partly due to the limited number of hydrological observation stations and limited monitoring data that are available [6]. An exception is the long-term and freely available time series data that can be obtained from remotely sensed images such as Landsat [28–32] and MODIS [33–35]. Both can provide effective supplemental ground observations. In fact, the analyses of these remote-sensing images provide a viable approach to quantify the long-term dynamic variations in runoff through IRES. For example, river length, defined as distance from a given datum to the end of the channel along its lower reach where water ceases to flow (and disappears), can be visually extracted from remote sensing images and used as a surrogate for surface runoff. Moreover, the data are relatively easy to obtain; only one remote sensing image is often needed for the digital measurement of river length per month. While the use of river length as documented herein may serve as a relatively effective approach, the number of studies specifically using this indicator to quantify runoff in IRES in arid regions remains small.
The Tarim Basin, located in an arid region in northwestern China, is the world’s largest inland arid basin, and possesses the planet’s second largest shifting sand desert [36, 37]. IRES are very common within the Tarim Basin [38]. During the past few decades, the basin has been affected by global climate change and intensified anthropogenic disturbances [39–41] that are associated with rapid population growth, large-scale land reclamation, and the mass exploitation of riverine surface water resources. As a result, water use and water shortages have become increasingly apparent [42]. Hence, the academic community has conducted numerous studies on the impact of human activities on runoff allocation and runoff change in the Tarim Basin [43–46]. Most rivers in the Tarim Basin represent IRES; thus, these recent investigations can be regarded as the study of IRES. Among them, many studies have argued that human activities in oases within the upper reach of the Tarim River are the main cause of decreased lower reach runoff [43–45, 47–56]. Admittedly, human activities have an influence on hydrological processes that have led to the lower reach reduction in surface runoff within IRES. Nonetheless, relatively little attention has been directed towards the analysis of natural hydrological processes on runoff, particularly the potential impacts of natural changes within the upper reaches of the basins flows on lower reach runoff [57].
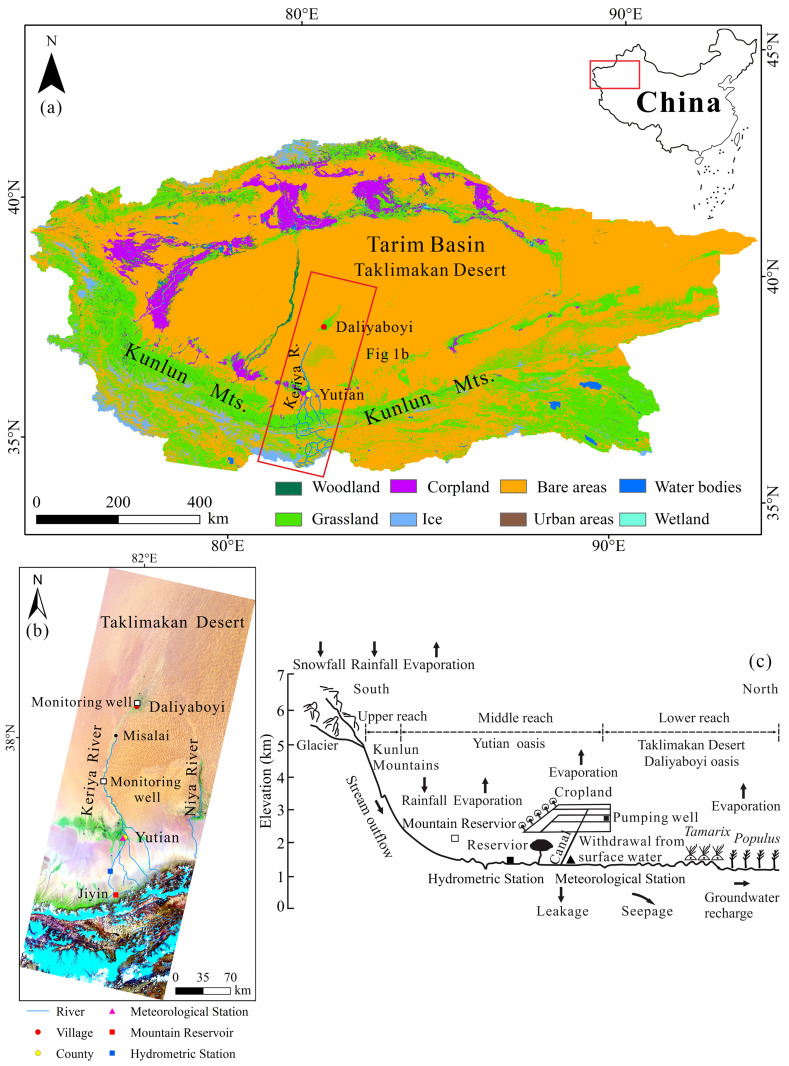
The Keriya River is an important seasonal tributary of the Tarim River [58]; it originates in the Kunlun Mountains (above 6,100 m a.s.l.) along the northern margin of the Tibetan Plateau [59] (Fig 1a). The Yutian agricultural oasis was developed along the middle reaches of the river [60] and is located where upper reach runoff flows out of the mountains (Fig 1a). Within downstream sections of the middle reaches of the river (used for human activities), the remaining water in the Keriya River flows into a natural oasis in the Daliyaboyi area (about 170 km away from the Yutian oasis). The Daliyaboyi area is located in the hinterland of the Taklimakan Desert [61] (Fig 1b). Variations in the length of the lower Keriya River can therefore be used to decipher the contributions of anthropogenic disturbances and natural variations in runoff on water availability and flow.
Fig 1.
(a) Location of the Tarim Basin in China, and land cover in 2018 in the Tarim Basin. Land-cover map is available for download through the Copernicus Climate Change Service (C3S) Climate Data Store (CDS), at a spatial resolution of 300-m. The China map was downloaded from http://bzdt.ch.mnr.gov.cn/, and the grant number is GS(2020)3183; (b) The Landsat 8 OLI images based on a composite of Band 7 (Red), 5 (Green) and 2 (Blue). Images show the location of the Keriya River Basin. The river channel north of Misalai is ephemeral; south of Misalai the channel is perennial. (c) Conceptual model describing the controls on the variations in surface runoff, including factors within the mountains, the agricultural oasis, and the desert in Keriya River Basin. Land-cover map and Landsat image were downloaded from the website https://land.copernicus.eu/global/products/lc [2018], and http://landsat.visibleearth.nasa.gov/, respectively. Because the map and image downloaded from these websites are free and open to scholars, our study does not need to supply a copyright notice.
This study developed a long-term (2000–2019) time-series of the seasonal variations in river length from remotely sensed images of the lower reaches of the Keriya River. Combined with hydro-meteorological and other statistical data, the impacts of both natural and anthropogenic factors on the frequency and magnitude of temporal variations in runoff in the river basin were analyzed. This paper provides a new perspective for comprehensively understanding the impacts of anthropogenic disturbances and natural factors on hydrological changes along the lower reaches of the Keriya River. This study also advances and enriches our understanding of long-term variations in runoff within IRES in the Tarim Basin.
2. Materials and methods
2.1. Regional setting
The Keriya River has a length of about 740 km, including both a perennial and ephemeral stream reach [62]. The mean annual runoff in the upper Keriya River Basin is 7.57×10⁸ m3 (1958–2013) (provided by the Hotan Hydrology and Water Resource Survey Bureau of Xinjiang Uygur Autonomous Region, China). Runoff during the spring, summer, autumn and winter accounted for 11.7%, 66.4%, 14.7% and 7.2% of the total annual flow, respectively [63]. Annual flows are characterized by a single period of peak flow. The inter-annual variation in runoff of the Keriya River is limited (the coefficient of variation is 0.17) (1957–1984), even though its seasonal variation is significant [59]. The Keriya River Basin is divided into three general elevational zones: an upper zone of ice, snow and permafrost (altitude of 6100–2600 m a.s.l.); a zone dominated by an agricultural oasis in the middle reach of the basin (altitude of 2600–1400 m a.s.l.); and a zone characterized by desert along its lower reaches (altitude of 1400–1100 m a.s.l.) [62] (Fig 1c).
In the headwaters of the Keriya River Basin, there are 173 glaciers that cover a total area of 520 km2 and possess a total volume of 490×108 m3 [63]. Seventy one percent of the Keriya River’s discharge is derived from the melting of glaciers and snow in its mountainous headwater regions; 9% is derived from precipitation, which is also mainly concentrated in the mountains. Groundwater contributes about 20% of the river’s flow [63]. The period of high (flood) flows within the upper reaches of the river is between July and August [59]. The mean annual precipitation is 129.2 mm in upper reach areas, while the mean annual evaporation between 1986–2013 was approximately 1902.4 mm (measured at the Langan Hydrological Station) (provided by the Hotan Hydrology and Water Resource Survey Bureau of Xinjiang Uygur Autonomous Region, China).
Within the zone possessing the middle reach agricultural oasis (approximately 1716 km2), the mean annual temperature is 11.8°C, the mean annual precipitation is 52.56 mm, and the mean relative humidity is 44.9% (calculated using the records from 1961 to 2019 at the middle reach meteorological station). The largest consumer of water is agriculture, which comprises about 98% of Yutian’s total water withdrawals; the combined use of water for industrial and domestic purposes represents only about 2% of the total [64]. The agricultural irrigation water is obtained from rivers, reservoirs and groundwater (springs and wells). Surface water bodies comprise about 86% (4.63×10⁸ m3 yr –1) of the total, whereas groundwater only accounts for 14% (0.74×10⁸ m3 yr –1) [64].
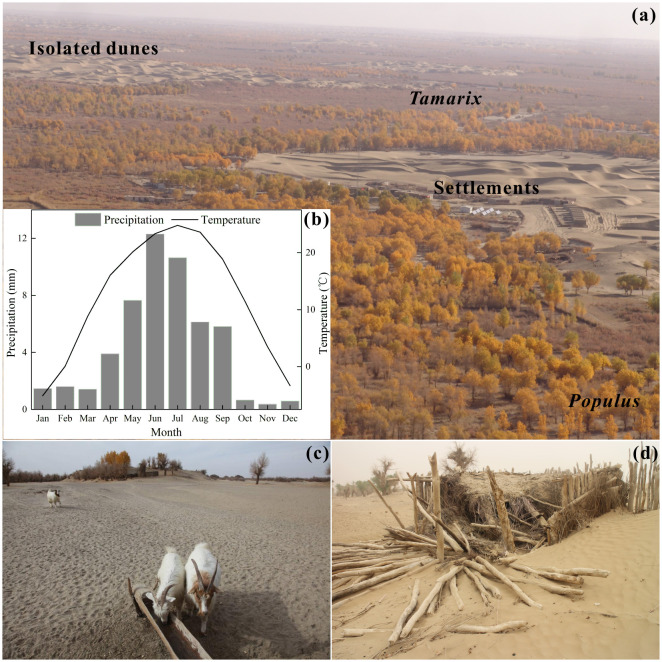
The ephemeral river section of the Keriya River is located north of Misalai in most years [61] (Fig 1b). The flow to the oasis depends on the amount of surface water discharged from the middle reaches of the Keriya River. During the flood period, streamflow can traverse the ephemeral section and reach Daliyaboyi [60]. Daliyaboyi is the largest natural primitive desert oases within a present-day area and covers about 324 km2 [65] in the central Taklimakan Desert (Fig 1b). The oasis is maintained as a natural area [61]. There are no modern industrial and agricultural activities in the oasis. The mean annual temperature is about 11.8°C. The highest and the lowest temperatures occur in July and January, respectively [66]. The mean annual precipitation in the area is less than 10 mm; thus, the oasis is characterized by an extremely arid climate [62] (Fig 2b). Vegetation along the current riverbanks is comprised mainly of Populus, Tamarix, and Phragmites [67] (Fig 2a). The surrounding landscape is dominated by extensively isolated composite desert dunes, among which settlements are scattered [68]. The ecosystem of the oasis is extremely fragile [63] and covered by sparse vegetation that does not recover easily if destroyed. In recent decades, mid-to lower-reach regions have experienced severe competition in water demand [69] due to a significant increase in population and large-scale land reclamation in middle reach areas [70]. Decreased river discharge to Daliyaboyi, combined with declining groundwater levels, has had a particularly devastating, and possibly irreversible, impact on the lower reach natural oasis. The oasis has also experienced serious desertification [59, 65, 71–73] (Fig 2c and 2d).
Fig 2. Photographs of Daliyaboyi natural oasis at the lower reaches of the Keriya River.
(a) The vegetation (consisting of Tamarix and Populus) that surrounds the isolated dunes; the settlements are scattered in the delta; (b) Observed intra-annual variations in precipitation and temperature between 1961 and 2019 at the Yutian meteorological station located along the middle reach of Keriya River catchment; (c) Photograph of large-scale degradation and the general lack of desert riparian forests; (d) Photographs showing abandoned dwellings in the hinterland of the Taklimakan Desert. The study area is open to Chinese scholars for observation, and permits are not required to enter. Because these photographs were acquired during field observations by the authors of this article, the copyright belongs to this article.
2.2. Remote-sensing data collection
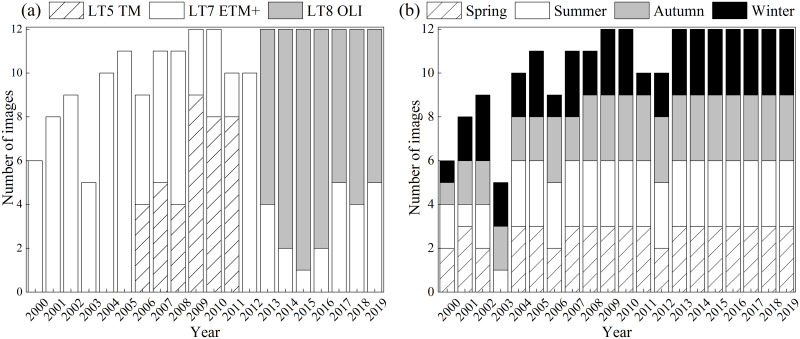
Remote sensing data (a total of 272 scenes) were obtained from Landsat images (240 scenes) (S1 Table), MODIS images (32 scenes), and Google Earth images (with a high-resolution of 0.47 m) (Table 1). More specifically, we used 45 Thematic Mapper (TM) images, 126 Enhanced Thematic Mapper Plus (ETM+) images, and 69 Operational Land Imager (OLI) images taken between January 1, 2000, and December 31, 2019. These images were obtained from the United States Geological Survey (USGS) (Fig 3). The study area is covered by two scenes (path/row 145/33 and 145/34) of the Landsat Worldwide Reference System (WRS-2). Landsat 5/7/8 Surface Reflectance (SR) products are standard level 1 Terrain-corrected (L1T) orthorectified Landsat images. A total of 32 Landsat images between 2000–2012 were unavailable. For these, we used MODIS images (MOD02QKM, Level 1B), which were obtained from NASA (National Aeronautics and Space Administration). The spatial resolution of MOD02QKM is 250 m. Thus, to cover the entire study area, one scene was required (horizontal/vertical 24/05), and these data were collected every 8 days.
Table 1. Summary of the remote-sensing data and data sources used in the analysis.
| Data type | Year | Resolution | Data source |
|---|---|---|---|
| Landsat (TM, ETM+, OLI) Path/Row: 145/33, 145/34 | 2000–2019 | 30 m | http://landsat.visibleearth.nasa.gov/ |
| MODIS (MOD02QKM) Tile ID: h24v05 | 2000–2012 | 250 m | http://earthobservatory.nasa.gov/ |
| Global land cover map | 2018 | 300 m | https://land.copernicus.eu/global/products/lc |
Fig 3.
(a) Number of annual Landsat images. (a) by sensor type (Landsat 4–5 TM, Landsat 7 ETM+, and Landsat 8 OLI) and (b) by season (spring, summer, autumn, and winter) for the study area between 2000–2019. Note: the blank area in the figure represents missing Landsat images.
2.3. Geometric correction
The mosaicked Landsat 8 OLI images of 26 April 2015 (path/row: 145/33 and 145/34) were first transformed to a common ground coordinate system (Universal Transverse Mercator (UTM), World Geodetic System (WGS 84) projection). The system is based on a 1:100,000 Standard Topographic Map of the People’s Republic of China and was created using the ENVI 5.1 image–processing software. Then we used a topographic map as the base image to geocorrect the mosaicked image (Landsat 8 OLI of 26 April 2015). Geocorrection used Ground Control Points (GCPs) of permanent features (such as settlements, dried channels, intersections of water bodies, and the interior of Daliyaboyi oasis) from the topographic map. The analysis used a second-order polynomial function with the nearest neighbor resampling method to produce an average Root Mean Square Error (RMSE) of less than 1 pixel [74, 75]. Approximately 100 GCPs were selected. The geometric corrected Landsat image (Landsat 8 OLI of 26 April 2015) was then used to rectify other Landsat images using GCPs (approximately 50–100). These images were also transformed using a second-order polynomial function and a nearest neighbor resampling method to produce an average RMSE of less than 1 pixel. The MODIS images were only used as a reference to distinguish the river end’s location on the corresponding geocorrected image (Landsat 8 OLI of 26 April 2015) for the river length calculation. Therefore, the MODIS images were not geometrically corrected.
2.4. Lower reach river length extraction, validation and statistical analysis
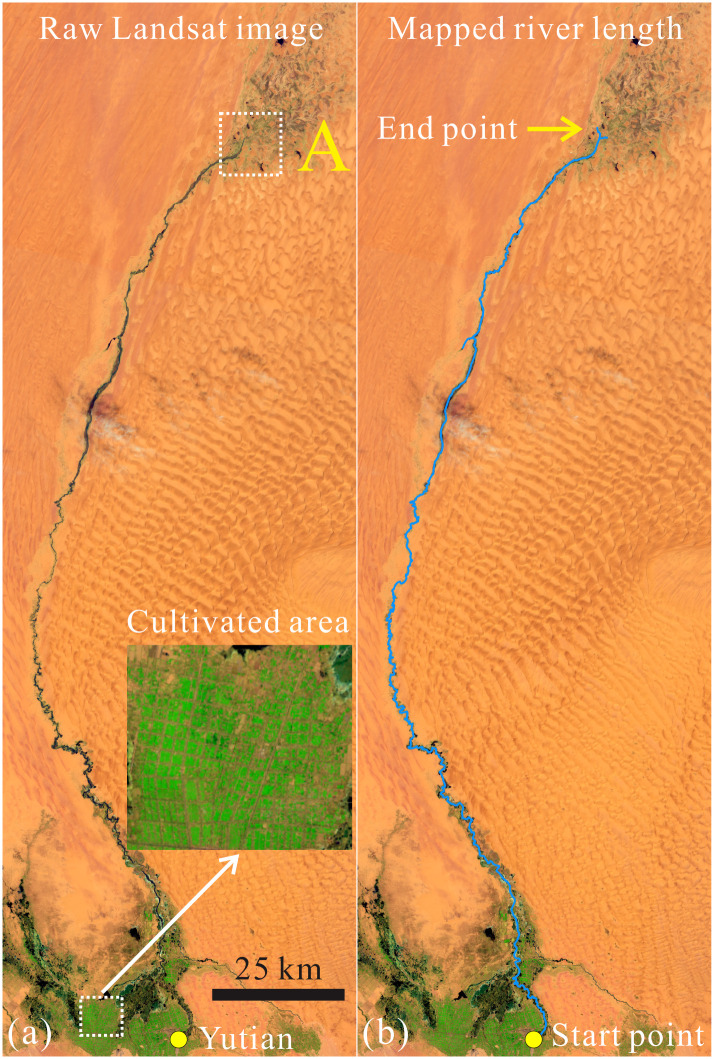
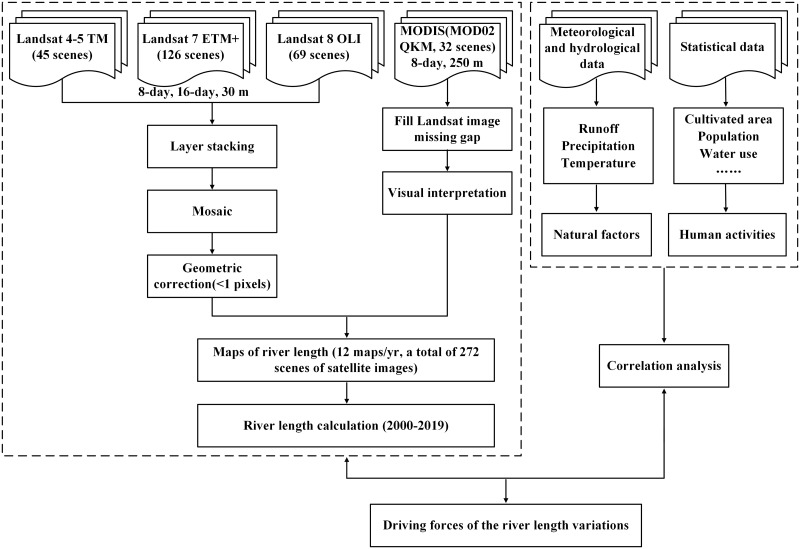
The location of the river’s end point (site of flow termination) was visually identified on each Landsat image. The interpreted end points on the MODIS images were also marked on the geometric corrected Landsat images. The distance (river length) between the center of Yutian County (81°40’39" E, 36°51’20" N) and the river’s end point on each image (Fig 4a and 4b) was then digitized and measured using ArcGIS 10.1 (ESRI) software. We also used two high-resolution (0.47 m) Google Earth images captured on 26 August 2009 and 16 March 2016 to ensure our interpretations of the river end point were correct. The results were consistent with the Google Earth images. We also calculated statistical descriptors of the variations in river length, such as departure, accumulative departure, moving average, and coefficient of variation and correlation coefficient (Table 2), for the analyses (Fig 5).
Fig 4. Measurement of river length and data validation process.
(a) Raw Landsat images (pre-processed); (b) Extracted of river length between the center of Yutian County (yellow dot) and the river’s end (yellow arrow); the blue line represents mapped river length. Landsat image was downloaded from the website http://landsat.visibleearth.nasa.gov/. Because the images downloaded from this website are free and open to scholars, our study does not need to supply a copyright notice.
Table 2. Description of the statistical indicators used in this study.
| Indicators | Formula | Description |
|---|---|---|
| Departure | xi is the value in i-th year, and is the average value during a specific period. | |
| Accumulative departure | LPi is the cumulative anomaly in i-th year, Ri is the value in i-th year, is the average value during a specific period. | |
| Coefficient of variation | CV is the coefficient of variation, μ is the standard deviation, σ is the mean value. | |
| Correlation coefficient | r is the Pearson product-moment correlation coefficient, is the covariance of variables x and y, and σx and σy is the standard deviation of x and y, respectively. | |
| Moving average | SMA is the simple moving average, where A is the average in period n; n is the number of time periods. |
Fig 5. Schematic diagram of overall workflow, including processing of the remote-sensing data, the mapping and measurement of river length, and the analyses of the collected data.
Due to the Landsat series of satellites having an 8-day or 16-day repeat cycle, up to three satellite images can be acquired for a given month but on different dates; although the longest interval between satellite images was 32-days, most images were taken at 16-day, 24-day intervals. Images with this temporal resolution are sufficient to capture the river length change in the lower part of the study area (Keriya River). Taking the data of Landsat imagery used in 2016 as an example (Table 3), the river length values digitized and measured from the three images in the same month are broadly continuous. In this paper, for those months with 2–3 image scenes, we used the mean value of river length; for the remaining months, one image scene was adopted. When both, one image and multiple scenes were used per month, actual variations in river length could be determined (Table 3). Therefore, our results of the visual interpretation and measurement of river length are reliable.
Table 3. Data information of Landsat imagery used and the results of river length in 2016.
| Acquisition date | Sensor type | River length (km) |
|---|---|---|
| 7-January-2016 | Landsat 8 OLI/TIRS | 315 |
| 31-January-2016 | Landsat 7 ETM+ | 253 |
| 8-February-2016 | Landsat 8 OLI/TIRS | 315 |
| 16-February-2016 | Landsat 7 ETM+ | 313 |
| 24-February-2016 | Landsat 8 OLI/TIRS | 323 |
| 3-March-2016 | Landsat 7 ETM+ | 332 |
| 11-March-2016 | Landsat 8 OLI/TIRS | 361 |
| 27-March-2016 | Landsat 8 OLI/TIRS | 312 |
| 12-April-2016 | Landsat 8 OLI/TIRS | 265 |
| 6-May-2016 | Landsat 7 ETM+ | 232 |
| 14-May-2016 | Landsat 8 OLI/TIRS | 244 |
| 22-May-2016 | Landsat 7 ETM+ | 209 |
| 15-June-2016 | Landsat 8 OLI/TIRS | 186 |
| 1-July-2016 | Landsat 8 OLI/TIRS | 248 |
| 17-July-2016 | Landsat 8 OLI/TIRS | 251 |
| 25-July-2016 | Landsat 7 ETM+ | 245 |
| 10-August-2016 | Landsat 7 ETM+ | 236 |
| 11-September-2016 | Landsat 7 ETM+ | 470 |
| 19-September-2016 | Landsat 8 OLI/TIRS | 468 |
| 5-October-2016 | Landsat 8 OLI/TIRS | 334 |
| 13-October-2016 | Landsat 7 ETM+ | 334 |
| 29-October-2016 | Landsat 7 ETM+ | 335 |
| 6-November-2016 | Landsat 8 OLI/TIRS | 319 |
| 14-November-2016 | Landsat 7 ETM+ | 339 |
| 8-December-2016 | Landsat 8 OLI/TIRS | 340 |
| 16-December-2016 | Landsat 8 OLI/TIRS | 266 |
2.5. Hydro-meteorological data and statistical analysis
Monthly and annual runoff and precipitation data (1958–2013), which were recorded at the Langan Hydrological Station in the upper sections of the Keriya River (Fig 1b), were provided by the Hotan Hydrology and Water Resource Survey Bureau of Xinjiang Uygur Autonomous Region, China. Monthly and annual temperature data, precipitation data, and relative humidity data (1961–2019) collected at the middle reach meteorological station, were downloaded from the China Meteorological Data Service Center (http://data.cma.cn/). The middle reach meteorological station is located about 40 km south of the Langan Hydrological Station (Fig 1b). The difference in elevation between the meteorological and hydrological stations is about 500 m. Given the limited elevation difference, the temperature data can be effectively used to represent upper reach areas.
Seven social and economic indicators were also obtained for the analysis of the impacts of anthropogenic disturbances. These data were obtained from the Xinjiang Statistical Yearbook (2001–2020) and included the total population (defined as the number of people in the area), the agricultural population (the total number of people engaged in agricultural activities such as farmers and herdsmen), as well as factors describing agricultural production (sown area of crops, or the total area of land used by the crops harvested during the year), cultivated area (the area of land for planting crops), total drive of agricultural machines (the total rated capacity of all agricultural machinery in the area), and descriptors of the regional economy (regional gross domestic product (GDP) and the value of total agricultural production) (the above definitions are from the Xinjiang Statistical Yearbook). The indices that represent water utilization at the Yutian oasis were also collected, including water usage from springs, wells, reservoirs, and river water (2000–2011) (provided by the Yutian Water Conservancy Bureau of Xinjiang Uygur Autonomous Region, China). Data pertaining to the agricultural water demand in 2009 in the middle reach of the basin were obtained from the Planning Report of Irrigation and Water Conservancy Construction in Yutian County (we only found data for 2009). Data regarding the area irrigated within the Yutian oasis from 2012 to 2017 were obtained from the Xinjiang Statistical Yearbook and the Hotan Statistical Yearbook. The middle reach human water use is defined in this study as the annual quantity of water withdrawn from surface- and groundwater resources.
3. Results
3.1. Inter-annual and intra-annual variations of river length within the lower reaches of the Keriya River
3.1.1. Inter-annual variations
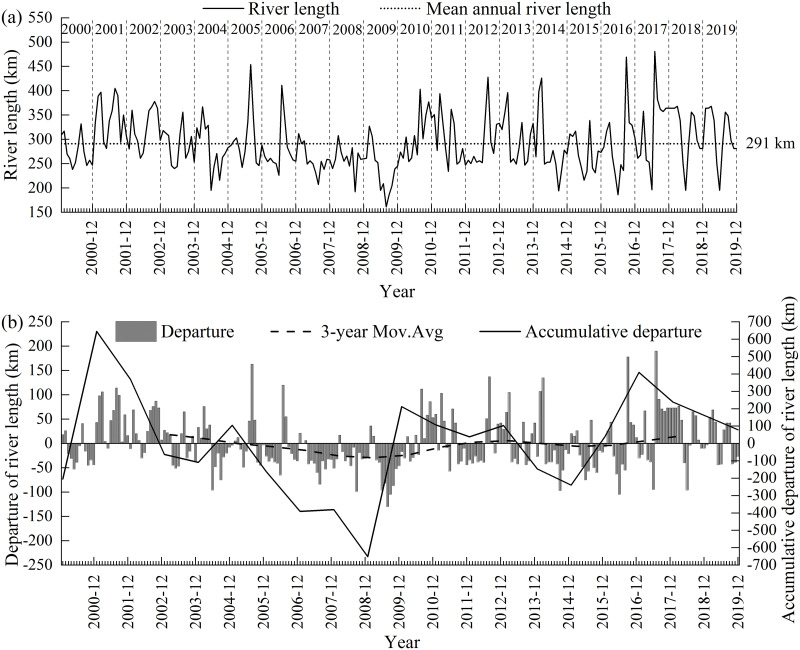
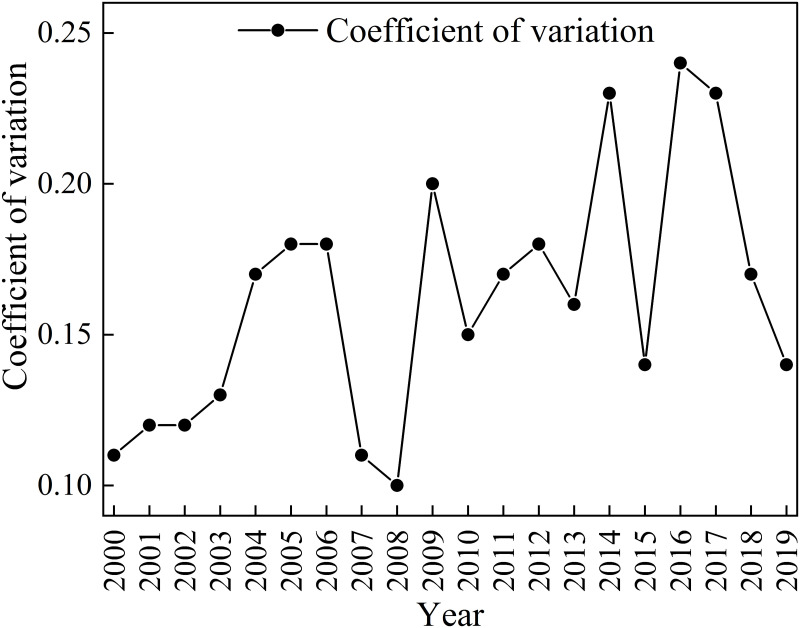
We obtained 240 monthly river length values from the lower reaches of the Keriya River over a period of 20 years. These values fluctuated around 291 km (the 20-year average between 2000–2019) (Fig 6a). Overall, there is a gradual increase in the amplitude of variations from 2000 to 2019 (Fig 6a). The river length of the Keriya River decreased from 2000 to 2009, before increasing to 2019 (Fig 6a). In 2009, there was a pronounce turning point (at a minimum value) in river length over the past 20 years (Fig 6a); the departure, cumulative departure, and the 3-year moving average all illustrate the nature and timing of the turning point (Fig 6b). The rise and fall around the zero value of departure in river length (Fig 6b) tended to increase toward 2019. However, the overall trend could be subdivided into different sections on either side of 2009. The frequency of years with a negative departure was significantly higher than those with a positive departure before 2009, whereas after 2009, the positive departure markedly increased. This indicates that length of the lower Keriya River was higher than the long-term average annual value (291 km) in most years after 2009. Thus, 2009 appears to represent a turning point in river length over the past 20 years (Fig 6b). The maximum value of departure from the mean occurred in 2001, whereas the minimum value occurred in 2009. The 3-year moving average shows a significant decrease from 2003 to 2009, and a mild increase from 2010 to 2017 (Fig 6b). The coefficient of variation fluctuated markedly between 2000–2019 and varied from 0.1 to 0.24 (Fig 7). The coefficients of variation were relatively high in 2009, 2014, 2016 and 2017, indicating a higher dispersion, which means that river length fluctuations intensified. The value of the coefficients of variation in 2000 and 2008 were relatively small, indicating slightly lower variations in the change in river length during these years.
Fig 6.
Observed changes in river length measured along the lower reaches of the Keriya River between 2000–2019 (a) and departures, accumulative departure and 3-year moving average of river length from 2000 to 2019 (b). The horizontal axis (X-axis) tick marks show months for each year.
Fig 7. Observed changes in the coefficient of variation of river length from 2000 to 2019.
3.1.2. Intra-annual variation
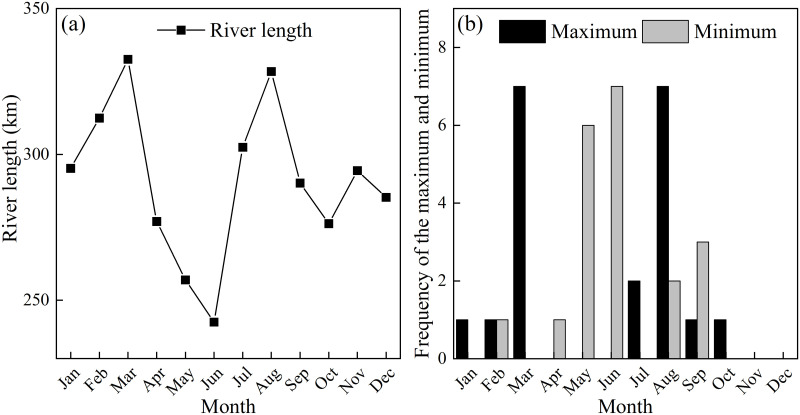
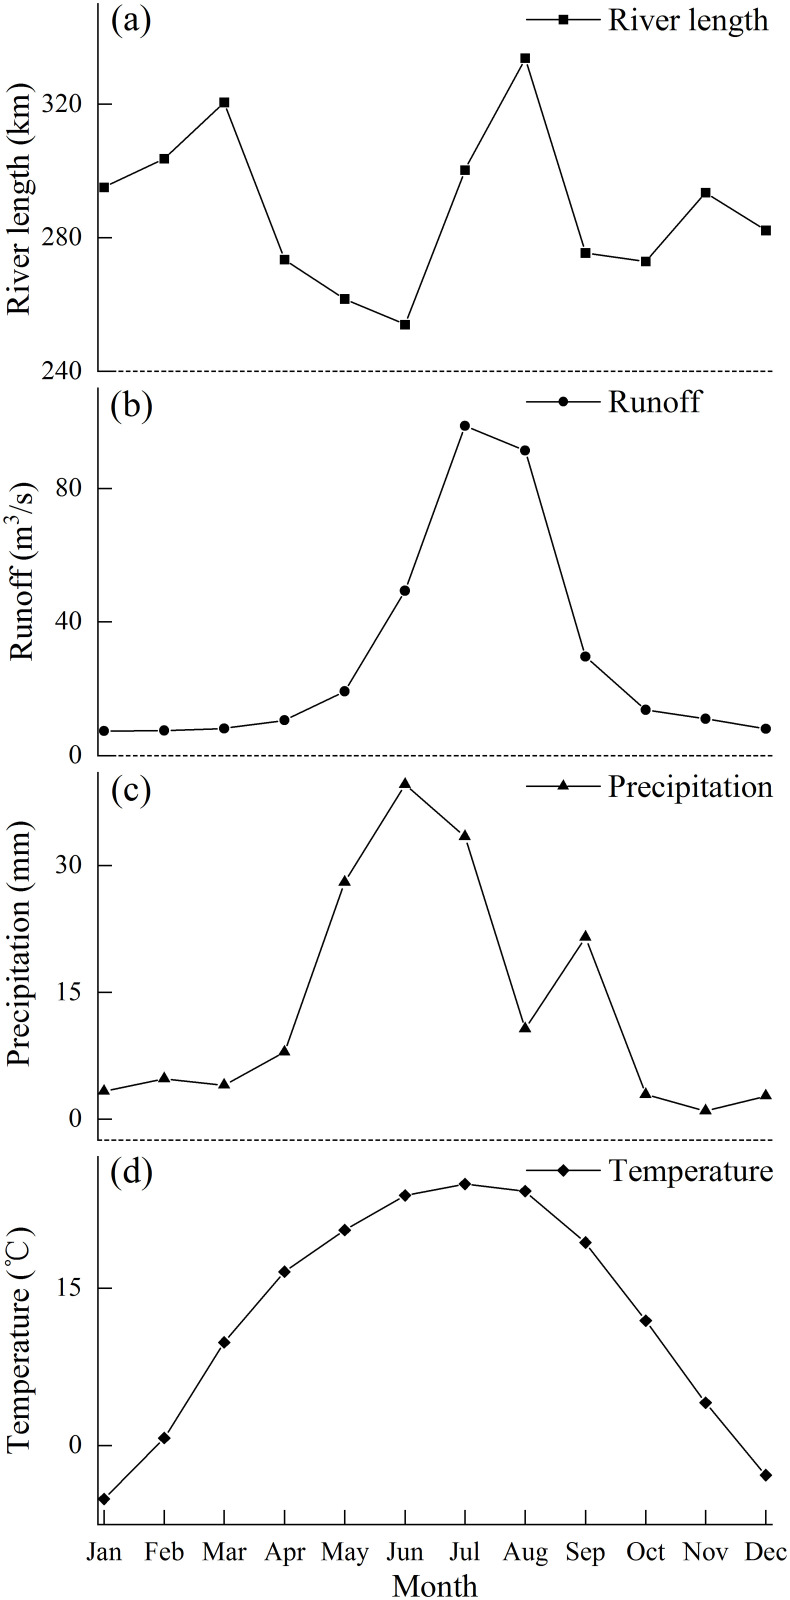
Intra-annual variations in the average river length over a 20-year period (from 2000 to 2019) along the lower reaches of the Keriya River also fluctuated (Fig 8a). Three peaks (occurring in March, August and November) and two lows (occurring in June and October) are apparent on the curve (Fig 8a). The annual maximum value of river length between 2000 and 2019 occurred 7 times in March and August, whereas the annual minimum value in river length appeared 6 times in May and 7 times in June. The peak in March was slightly higher than that in August. The lower reach river length weakly changed on the long-term time scale from November to December; no maximum or minimum values occurred during this period (Fig 8b).
Fig 8.
(a) Observed intra-annual changes of the 20-year average river length along the lower reaches of the Keriya River. (b) Occurrence frequency of the minimum and maximum lower reach river length stratified by month (based on data from 2000 to 2019).
3.2. Relationship between variations in river length and natural factors
3.2.1. Inter-annual variation analysis
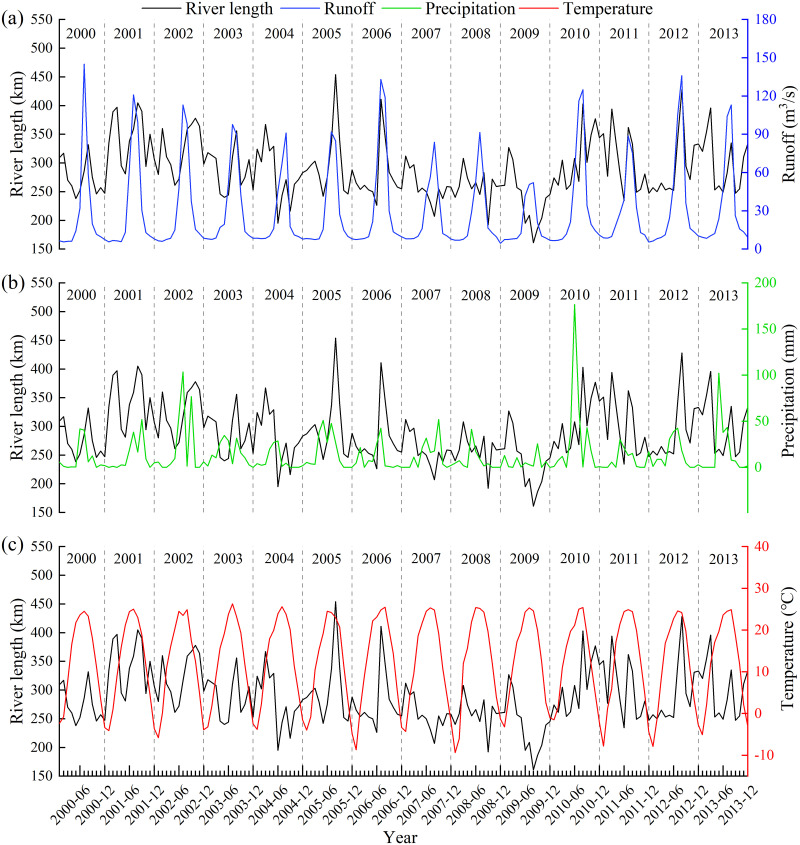
River length consistently increased with runoff (r = 0.70, p<0.01) during the periods of 2000–2006 and 2010–2013 when maximum values of each occurred. The opposite trend occurred between 2007–2009 (Fig 9a); river length reached a peak while upper reach runoff was relatively low. River length and precipitation were positively correlated (r = 0.55, p<0.05), especially during the periods of 2001–2003, 2005–2006 and 2010. However, in 2000, 2004, 2007–2009 and 2011–2013, precipitation and river length were negatively correlated, as the peak values of river length corresponded to lows in precipitation (Fig 9b). River length was negatively correlated to air temperature (r = −0.44), especially between 2001–2004 and 2007–2009, however, inconsistencies were identified in 2000, 2005–2006 and 2010–2013 (Fig 9c).
Fig 9. Observed changes between lower reach river length and hydro-meteorological data in the Keriya River Basin.
(a), (b) and (c) represent the dynamic changes between lower reach river length and upper reach runoff, precipitation, and temperature from 2000 to 2013, respectively.
3.2.2. Intra-annual variation analysis
Although the average (2000–2013) monthly lower reach river length, upper reach runoff, precipitation and temperature were calculated for a period of only 14 years, the intra-annual variations are clear. All four of these parameters fluctuated seasonally (Fig 10). More specifically, precipitation occurs primarily from May to September. Two peaks, one in June and one in September, were identified during these months, along with a minimum value in August (Fig 10c). The variations in upper reach runoff are characterized by a single peak in July (Fig 10b). Runoff was concentrated during the summer (from June to August). Temperature began to rise in March, and the highest peak formed in July (Fig 10d). River length was elevated from July to August (Fig 10a) and lagged approximately two months behind the peak in precipitation; runoff was also elevated during this time. The runoff peaks were consistent with temperature (both occurring in July) and lagged approximately one month behind the peak in precipitation.
Fig 10. Observed intra-annual changes between lower reach river length and natural upper reach factors in the Keriya River Basin.
(a), (b), (c) and (d) represent the seasonal changes in lower reach river length, upper reach runoff, precipitation and temperature, respectively.
3.3. Relationships between river length and anthropogenic disturbances
3.3.1. Inter-annual variation analysis
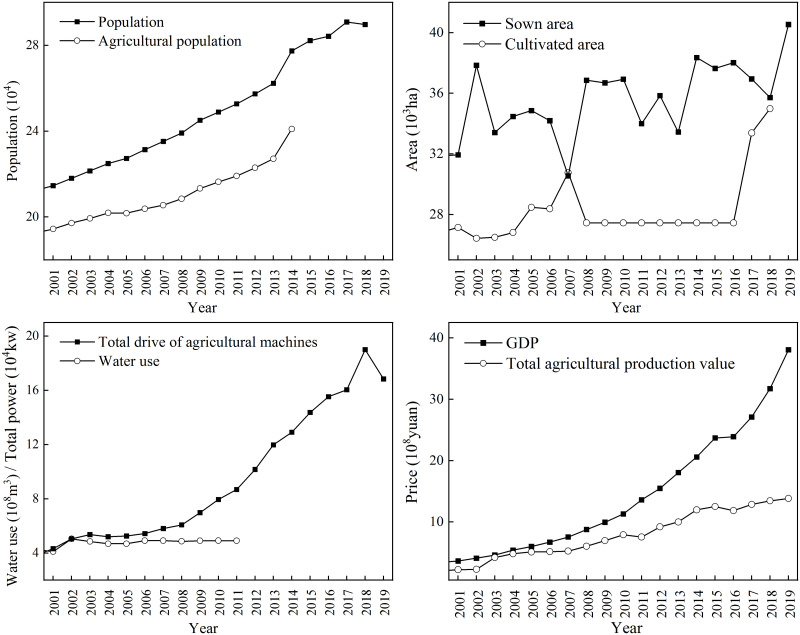
The indices we used to represent anthropogenic disturbances in the Yutian oasis included total population, agricultural population, cultivated area, sown area, total drive of agricultural machines, amount of water consumption, GDP and total agricultural production in the middle reaches of the Keriya River. The values of these parameters increased from 2000 to 2019, and most increased linearly (Fig 11), while the river length fluctuated significantly. Therefore, these indicators were inconsistent with the inter-annual variations in lower reach river length (Fig 6a); the correlation coefficients between them and lower reach river length were insignificant at the 95% confidence level (p<0.05) (Table 4).
Fig 11.
Social and economic changes in Yutian County, located within the middle reaches of the Keriya River from 2000 to 2019, including population (a), agricultural population (a), sown area (b), cultivated area (b), total drive of agricultural machines (c), water use (c), GDP (d), and total agricultural production (d).
Table 4. Correlation results between river length and anthropogenic disturbances in the Keriya River Basin.
| Parameter | Period | Correlation coefficient (r) |
|---|---|---|
| Population | 2000–2018 | 0.06 |
| Agricultural population | 2000–2014 | −0.16 |
| Sown area | 2000–2019 | 0.2 |
| Cultivated area | 2000–2019 | 0.03 |
| Total drive of agricultural machines | 2000–2019 | 0.2 |
| Water use | 2000–2011 | −0.35 |
| GDP | 2000–2019 | 0.16 |
| Total agricultural production value | 2000–2019 | 0.05 |
3.3.2. Intra-annual variation analysis
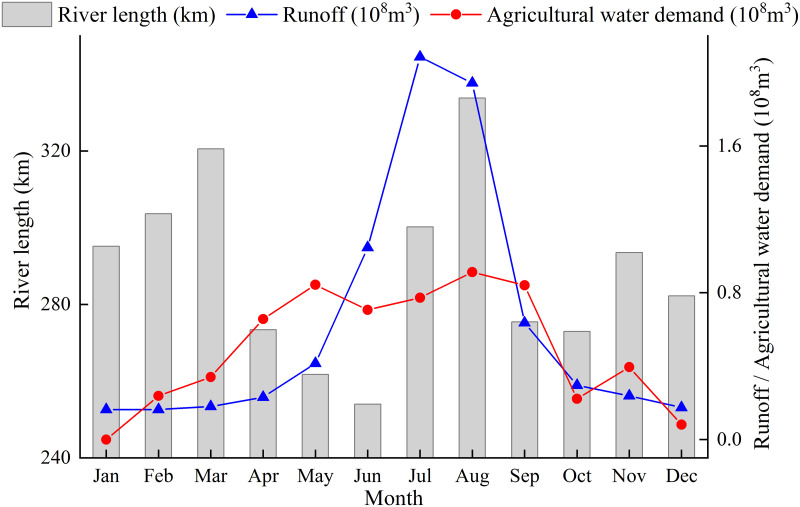
Intra-annual variations in the average lower reach river length during the 20-year study period (from 2000 to 2019) and the middle reach agricultural water demand in 2009 both fluctuated seasonally. Three peaks and two minimum values were both identified from the two curves (Fig 12). Peak values in river length occurred in March, August and November, whereas peak values in agricultural water demand occurred in May, August and November. The low values in river length and agricultural water demand both occurred in June and October. Agricultural water demand increased significantly from April to May, while the river length decreased sharply, before both reached a minimum value in June. They then increased from July to August, before declining from September to October. A small peak in both formed in November.
Fig 12. Observed intra-annual changes in lower reach river length (20-year average), upper reach runoff (14-year average) and middle reach agricultural water demand (in 2009) of the Keriya River.
4. Discussion
4.1. Factors influencing lower reach river length
The length changes in IRES in dryland regions mainly occur along their lower reaches [6], especially in extremely arid desert regions; these lower reach variations in river length should be directly related to the recharge in surface runoff (Fig 1c). Tang et al. [57] suggested that lower reach changes in flow are greatly affected by runoff in the headwaters. In the current study, a significant correlation between a change in length of the lower Keriya River and runoff in the upper reach mountains (r = 0.70, p<0.01), combined with the consistency between the inter-annual and intra-annual variations in river length and upper reach runoff in summer (Figs 9a and 12), supports the argument by Tang et al. [57]. In terms of runoff in mountainous headwater regions, the impact of humans is limited because of its low population density. Thus, runoff processes in the mountains are mostly controlled by natural factors such as climate change; the most important climatic factors are precipitation and temperature [62] (Fig 9). The intra-annual and inter-annual variations in runoff generally lag behind precipitation (Figs 9 and 10). This suggests precipitation should play an important recharge role in controlling runoff in the mountainous areas, which is consistent with a positive correlation (r = 0.66, p<0.05) in the inter-annual changes between them. The positive correlation between upper reach runoff and precipitation is broadly consistent with the results presented for the Tarim River Basin [76–78]. Regarding the impact of temperature on runoff, Chen [63] and Zhou et al. [62] believed that the rise in air temperature causes a significant increase in glacial and snowmelt runoff in mountainous areas; Ling et al. [78, 79] found that runoff was significantly positively correlated with temperature. Our data showed that the correlation between them was negatively correlated (r = −0.52), which may be related to an insufficient time series in this study. In conclusion, upper reach natural factors, including runoff, precipitation, and temperature, should affect lower reach variations in river length.
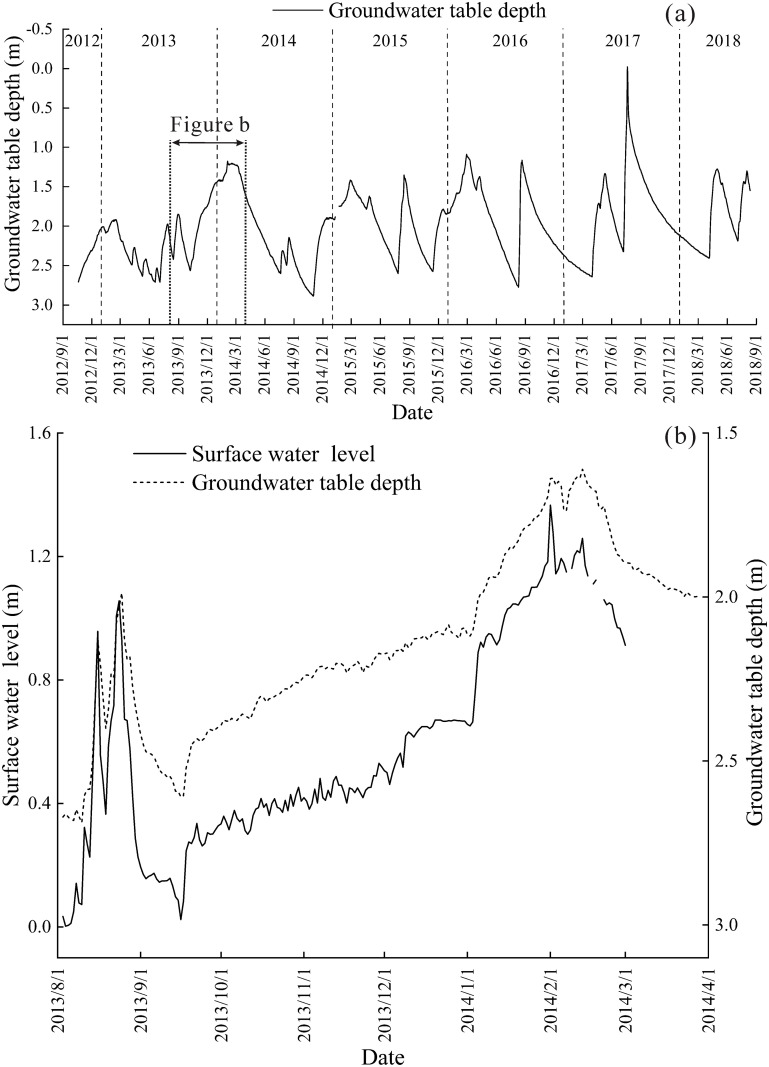
The artificial Yutian agricultural oasis in the middle reach area is the dominant zone of water consumption along the Keriya River Basin [72]. Agriculture in the Yutian oasis primarily consumes surface runoff that flows to lower reach areas, which affects variations in river length along the lower reaches. The total amount of irrigation water consumed in Yutian oasis reached 4.11–5.05×10⁸ m3 yr –1 between 2000–2011 (Fig 11). The removal of water for irrigation decreased about 63% of the water discharged to the lower reach area (Table 5). This indicates that variations in lower reach river length are mainly affected by natural headwater factors and middle reach anthropogenic disturbances. In addition, according to dynamic changes in water table depth, groundwater (discharged from the Yutian oasis in the middle reaches) replenished lower reach surface runoff [80, 81] (Fig 13) and the influx of melt-water from ice along lower reach river channels, which both affected changes in river length.
Table 5. Calculation and description of upper reach runoff and water use in the Yutian oasis.
| Parameter | Formula | Description |
|---|---|---|
| Percentage of total runoff consumed by the Yutian oasis | A is the percentage of total runoff consumed by the Yutian oasis; W1 is mean annual irrigation water consumed in the Yutian oasis, or 4.76×10⁸ m3 (2000–2011); R is the mean annual runoff (7.57×10⁸ m3) (1958–2013); B is the summer runoff in the upper reaches; W2 is the proportion total annual runoff by summer flows (66.4%); C is the summer water consumption in the Yutian oasis; W3 is the proportion of total annual water consumption during the summer in the Yutian oasis (53%). | |
| Summer runoff in the upper reaches | ||
| Summer water consumption in the Yutian oasis |
Note: calculations are based on Chen [63].
Fig 13.
(a) Dynamic variation in the depth to the groundwater table in the monitoring well in Daliyaboyi oasis (based on data from 2012 to 2018); (b) Dynamic variation of the surface water level and groundwater table depth in the monitoring well in the upstream section of the lower reach (based on data from 2013 to 2014) [80, 81].
4.2. Inter-annual variation analysis of river length
The minimum in length of the lower Keriya River occurred in 2009 (Fig 6a), which coincides with upper reach runoff along the Keriya River (Fig 9a). Upper reach runoff of other rivers in the Tarim Basin includes the Aksu River, the Yarkand River, the Hotan River, and the Qarqan River [46, 55, 56, 82–90], all of which exhibited similar variations in runoff and exhibited a minimum in 2009. It can be concluded that the rivers within the Tarim Basin generally experienced low runoff in 2009. We also compared runoff within the Keriya River Basin with the main rivers and lakes of Central Asia (including the Amu Darya, Syr Darya, Aral Sea, and Issyk-Kul Lake), and found the lowest value in 2009 in the Aral Sea (water surface area) [91–93]. The Amu Darya, Syr Darya (upstream runoff) and Issyk-Kul Lake (water surface area) exhibited a minimum in 2008 [94–97]. As mentioned above in section 4.1, large-scale agricultural irrigation in the middle reaches usually leads to lower reach decreases in runoff, which may have led to the low in 2009. However, the use of irrigation water along the middle reaches of the Keriya River (Fig 11) and other rivers in Tarim Basin [55] have increased slightly since 2000, in spite of an absence of an abrupt large increase in water abstractions. The agricultural economic indicators in the middle reach oasis are also inconsistent with the inter-annual variations in lower reach river length (Figs 6a and 11); the correlations between them and lower reach river length are surprisingly low (−0.35<r<0.03) and are not statistically significant (Table 4). These relations imply that middle reach anthropogenic disturbances have a limited impact on the variations in lower reach river length.
4.3. Intra-annual variation analysis on river length
Seasonal variations (Fig 10a) imply that there are different impacts between upper reach natural factors (Fig 10b–10d) and middle reach anthropogenic disturbances (Fig 12) on the length of the lower Keriya River. The upper reach runoff dropped to a low value in March (Fig 10b); in contrast, the lower reach river length increased to a peak value (Fig 10a). Two possible reasons for this inconsistency include: (1) the two highest peaks in groundwater levels occurred in February-March of the year during the monitoring period (from 2012 to 2018) in the Daliyaboyi oasis (Fig 13a) and during the monitoring period (from 2013 to 2014) in the upstream section of the lower reach (Fig 13b) respectively [80, 81], which suggests that groundwater may have recharged downstream runoff; and (2) air temperature begins to climb in March (Fig 10d), and therefore ice along the river will gradually melt begins in the lower reaches and continue continues into the middle reaches in accordance with elevation (Fig 1c). The approximately 200–400 m decrease in elevation from the south (middle reach Yutian oasis) to the north (lower reach Daliyaboyi oasis) (Fig 1c) should facilitate the influx of meltwater and groundwater to the channel. In summer, the marked rise in air temperature (Fig 10d) causes a significant increase in glacial and snowmelt runoff in the mountainous areas [63] (Fig 10b). Rainfall in mountainous areas also significantly contributes to upper reach runoff [63]. These two natural factors may cause the upper reach runoff to reach its maximum value of approximately 5.02×10⁸ m3 [63] (Table 5). Intra-annual variation in middle reach water consumption also reaches its highest peak (Fig 12) during the summer, which was approximately 4.01×10⁸ m3 (the peaks mainly occurred in August) [63] (Table 5). Agricultural water consumption in areas along the middle reach reduced the water discharge to lower reach areas by about 80%. The peak value in river length occurred in summer because (1) the peak values in upper reach runoff and middle reach water consumption both occurred in summer, and the former is higher than the latter by about 20% in summer; and (2) the inter-annual variation (12-year) in middle reach water use changed steadily (Fig 11). Although there are missing data on middle reach water consumption from 2012 to 2019, data on population, cultivated area, and effective irrigated area after 2011 show that the inter-annual variations in middle reach water consumption in recent years were not significant. Moreover, these trends show that seasonal variations in river length reflect the frequency and amplitude of fluctuations in upper reach runoff (Fig 12). Human water consumption affects the fluctuation magnitude of river length to a certain extent, which is well illustrated by the lowest value in river length occurring in June. The minimum value in June (Fig 10a) might be related to both the decrease in upper reach runoff (Fig 10b) and large-scale irrigation in the middle reach areas (Fig 12). The data show a small peak in river length in November of each year (Fig 10a). This minor increase in river length may be caused by decreasing truncation of autumn floods in the middle reach areas (Fig 12), which increases the amount of river water that flows to lower reach areas. Although there is only one year of agricultural water demand data, the inter-annual variations in water consumption are minor (Fig 11); thus, the data in this study is representative.
Natural factors in the upper reaches mainly control trends in the overall inter-annual and intra-annual variations in the magnitude of river length of the Keriya River (Figs 9, 11 and 12), though anthropogenic disturbances in the middle reaches contribute to the fluctuations. Nevertheless, with an increase in the development of water conservation technology, the anthropogenic impacts on lower reach runoff processes will increase [98], whereas the impact of natural factors will gradually weaken. These changes are well-illustrated by variations in length of the lower Keriya River after 2018, when the Jiyin Reservoir within the upper reach (Fig 1b) was put into use. The removal of the flood peak discharge during the summer within the lower reaches of the Keriya River from 2018 to 2019 (Fig 6a) is related to the regulation of river flow by the Jiyin Reservoir.
5. Conclusions
River length can be used as a novel indicator to reveal the dynamic variations in lower reach surface runoff in IRES in dryland areas. We digitized and measured the distance (river length) between the center of Yutian County and the river’s end point on 272 remote sensing images and then constructed monthly lower reach inter-annual and intra-annual variations in length of the lower Keriya River over a 20-year period (2000–2019). The results showed that: (1) upper reach runoff, the quantity of water consumed by humans along the middle reaches, and groundwater and meltwater influx along lower reach river channels all contribute to the intra-annual variations in length (20-year average) of the lower Keriya River. The minimum value in river length occurred in June, because of the increase in middle reach agricultural irrigation and a low in upper reach runoff. The peak in river length occurred in August because of increased upper reach runoff, despite the maximum values of agricultural water demand also occurring at the same time within the year. The former (upper reach runoff) is about 20% higher than the latter in summer. In March, the peak value in river length may be due to elevated lower reach groundwater levels and the influx of meltwater from ice along river channels; (2) the overall trends in inter-annual variations in river length, including the frequency and amplitude of its fluctuations, are closely correlated with upper reach changes in runoff as well as middle reach water consumption, which increased slightly during the study period. The inter-annual variations in the frequency and amplitude of fluctuations in river length are mainly controlled by upper reach runoff. In addition, the lowest value in river length occurred in 2009, consistent with the low value in upper reach runoff of the Keriya River and other rivers in the Tarim Basin. Collectively, natural factors control the inter-annual and intra-annual variations in length of the lower Keriya River. This research differs from previous studies that focused exclusively on the impacts of anthropogenic disturbances on surface runoff within the Tarim River Basin.
Supporting information
(DOCX)
Acknowledgments
We acknowledge the editors and two anonymous reviewers for improving the manuscript. We thank Dawei Wang and Xiuxiu Wen for their help with the collection and pre-processing of remote sensing images. We thank Qianqian Xia and Run Zhang for detailed comments on earlier drafts of the manuscript and analysis. We thank Xuan Li and Hongwei Bian for their help with the processing of the three figures. We also thank Bofei Li and Dilbar Tursun for their linguistic help.
Data Availability
All relevant data are within the paper and its Supporting information files.
Funding Statement
This study was supported by the National Natural Science Foundation of China (NSFC Grant Numbers U1178303, U1503381, and U1703237), and the Tianshan Cedar Project of Xinjiang Uygur Autonomous Region, China (Grant Number 2017XS21). The funders had no role in study design, data collection and analysis, decision to publish, or preparation of the manuscript.
References
- 1.Millennium Ecosystem Assessment. Ecosystems and Human Well-Being: Desertification Synthesis. Washington DC: Island Press; 2005. pp. 1. [Google Scholar]
- 2.Reynolds JF, Smith DMS, Lambin EF, Turner BL, Mortimore M, Batterbury SPJ, et al. Global Desertification: Building a Science for Dryland Development. Science. 2007; 316(5826): 847–851. doi: 10.1126/science.1131634 [DOI] [PubMed] [Google Scholar]
- 3.Huang JP, Yu HP, Guan XD, Wang GY, Guo RX. Accelerated dryland expansion under climate change. Nature Climate Change. 2016; 6: 166–171. doi: 10.1038/nclimate2837 [DOI] [Google Scholar]
- 4.Datry T, Bonada N, Boulton AJ. Intermittent Rivers and Ephemeral Streams: Ecology and Management. London: Academic Press; 2017. pp. 1–20. [Google Scholar]
- 5.Acuña V, Datry T, Marshall J, Barceló D, Dahm CN, Ginebreda A, et al. Why should we care about temporary waterways? Science. 2014; 343(6175): 1080–1081. doi: 10.1126/science.1246666 [DOI] [PubMed] [Google Scholar]
- 6.Messager ML, Lehner B, Cockburn C, Lamouroux N, Pella H, Snelder T, et al. Global prevalence of non-perennial rivers and streams. Nature. 2021; 594(7863): 391–397. doi: 10.1038/s41586-021-03565-5 [DOI] [PubMed] [Google Scholar]
- 7.Tooth S. Process, form and change in dryland rivers: a review of recent research. Earth-Science Reviews. 2000; 51(1–4): 67–107. doi: 10.1016/S0012-8252(00)00014-3 [DOI] [Google Scholar]
- 8.Larned ST, Datry T, Arscott DB, Tockner K. Emerging concepts in temporary-river ecology. Freshwater Biology. 2010; 55(4): 717–738. doi: 10.1111/j.1365-2427.2009.02322.x [DOI] [Google Scholar]
- 9.Datry T, Larned ST, Tockner K. Intermittent rivers: a challenge for freshwater ecology. Bioscience. 2014; 64(3): 229–235. doi: 10.1093/biosci/bit027 [DOI] [Google Scholar]
- 10.Busch MH, Costigan KH, Fritz KM, Datry T, Krabbenhoft CA, Hammond JC, et al. What’s in a name? Patterns, trends, and suggestions for defining non-perennial rivers and streams. Water. 2020; 12(7): 1980. doi: 10.3390/w12071980 [DOI] [PMC free article] [PubMed] [Google Scholar]
- 11.Bull WB. Discontinuous ephemeral streams. Geomorphology. 1997; 19(4): 227–276. doi: 10.1016/S0169-555X(97)00016-0 [DOI] [Google Scholar]
- 12.Hughes DA. Hydrological issues associated with the determination of environmental water requirements of ephemeral rivers. River Research and Applications. 2005; 21(8): 899–908. doi: 10.1002/rra.857 [DOI] [Google Scholar]
- 13.Bunn SE, Thoms MC, Hamilton SK, Capon SJ. Flow variability in dryland rivers: boom, bust and the bits in between. River Research and Applications. 2006; 22(2): 179–186. doi: 10.1002/rra.904 [DOI] [Google Scholar]
- 14.Costigan KH, Kennard MJ, Leigh C, Sauquet E, Datry T, Boulton AJ. Flow regimes in intermittent rivers and ephemeral streams. In Datry T, Bonada N, Boulton AJ. (Eds.), Intermittent Rivers and Ephemeral Streams: Ecology and Management. Academic Press; 2017. pp. 51–78. doi: 10.1016/B978-0-12-803835-2.00003-6 [DOI] [Google Scholar]
- 15.Acuña V, Jorda‐Capdevila D, Vezza P, Girolamo AMD, McClain ME, Stubbington R, et al. Accounting for flow intermittency in environmental flows design. Journal of Applied Ecology. 2020; 57(4): 742–753. doi: 10.1111/1365-2664.13590 [DOI] [Google Scholar]
- 16.Tramblay Y, Rutkowska A, Sauquet E, Sefton C, Laaha G, Osuch M, et al. Trends in flow intermittence for European rivers. Hydrological Sciences Journal. 2021; 66(1): 37–49. doi: 10.1080/02626667.2020.1849708 [DOI] [Google Scholar]
- 17.Costigan KH, Jaeger KL, Goss CW, Fritz KM, Goebel PC. Understanding controls on flow permanence in intermittent rivers to aid ecological research: integrating meteorology, geology and land cover. Ecohydrology. 2016; 9(7): 1141–1153. doi: 10.1002/eco.1712 [DOI] [Google Scholar]
- 18.Allen DC, Datry T, Boersma KS, Bogan MT, Boulton AJ, Bruno D, et al. River ecosystem conceptual models and non-perennial rivers: A critical review. WIREs Water. 2020; 7(5): e1473. doi: 10.1002/wat2.1473 [DOI] [PMC free article] [PubMed] [Google Scholar]
- 19.Döll P, Schmied HM. How is the impact of climate change on river flow regimes related to the impact on mean annual runoff? A global-scale analysis. Environmental Research Letters. 2012; 7(1): 014037. doi: 10.1088/1748-9326/7/1/014037 [DOI] [Google Scholar]
- 20.Jaeger KL, Olden JD, Pelland NA. Climate change poised to threaten hydrologic connectivity and endemic fishes in dryland streams. Proceedings of the National Academy of Sciences. 2014; 111(38): 13894–13899. doi: 10.1073/pnas.1320890111 [DOI] [PMC free article] [PubMed] [Google Scholar]
- 21.Hammond JC, Zimmer M, Shanafield M, Kaiser K, Godsey SE, Mims MC, et al. Spatial Patterns and Drivers of Nonperennial Flow Regimes in the Contiguous United States. Geophysical Research Letters. 2021; 48(2): e2020GL090794. doi: 10.1029/2020gl090794 [DOI] [Google Scholar]
- 22.Jaeger KL, Olden JD. Electrical resistance sensor arrays as a means to quantify longitudinal connectivity of rivers. River Research and Applications. 2012; 28(10): 1843–1852. doi: 10.1002/rra.1554 [DOI] [Google Scholar]
- 23.Pekel JF, Cottam A, Gorelick N, Belward AS. High-resolution mapping of global surface water and its long-term changes. Nature. 2016; 540(7633): 418–422. doi: 10.1038/nature20584 [DOI] [PubMed] [Google Scholar]
- 24.Grill G, Lehner B, Thieme M, Geenen B, Tickner D, Antonelli F, et al. Mapping the world’s free-flowing rivers. Nature. 2019; 569(7755): 215–221. doi: 10.1038/s41586-019-1111-9 [DOI] [PubMed] [Google Scholar]
- 25.Steward AL, Von Schiller D, Tockner K, Marshall JC, Bunn SE. When the river runs dry: human and ecological values of dry riverbeds. Frontiers in Ecology and the Environment. 2012; 10(4): 202–209. doi: 10.1890/110136 [DOI] [Google Scholar]
- 26.Boulton AJ. Conservation of ephemeral streams and their ecosystem services: what are we missing? Aquatic Conservation Marine and Freshwater Ecosystems. 2014; 24(6): 733–738. doi: 10.1002/aqc.2537 [DOI] [Google Scholar]
- 27.Datry T, Boulton AJ, Bonada N, Fritz K, Leigh C, Sauquet E, et al. Flow intermittence and ecosystem services in rivers of the Anthropocene. Journal of Applied Ecology. 2018; 55(1): 353–364. doi: 10.1111/1365-2664.12941 [DOI] [PMC free article] [PubMed] [Google Scholar]
- 28.Williams DL, Goward S, Arvidson T. Landsat: yesterday, today, and tomorrow. Photogramm. Photogrammetric Engineering and Remote Sensing. 2006; 72(10): 1171–1178. doi: 10.14358/pers.72.10.1171 [DOI] [Google Scholar]
- 29.Roy DP, Ju JC, Lewis P, Schaaf C, Gao F, Hansen M, et al. Multi-temporal MODIS–Landsat data fusion for relative radiometric normalization, gap filling, and prediction of Landsat data. Remote Sensing of Environment. 2008; 112(6): 3112–3130. doi: 10.1016/j.rse.2008.03.009 [DOI] [Google Scholar]
- 30.Roy DP, Wulder MA, Loveland TR, Woodcock CE, Allen RG, Anderson MC, et al. Landsat-8: Science and product vision for terrestrial global change research. Remote Sensing of Environment. 2014; 145: 154–172. doi: 10.1016/j.rse.2014.02.001 [DOI] [Google Scholar]
- 31.Chander G, Markham BL, Helder DL. Summary of current radiometric calibration coefficients for Landsat MSS, TM, ETM+, and EO-1 ALI sensors. Remote Sensing of Environment. 2009; 113(5): 893–903. doi: 10.1016/j.rse.2009.01.007 [DOI] [Google Scholar]
- 32.Wulder MA, Masek JG, Cohen WB, Loveland TR, Woodcock CE. Opening the archive: How free data has enabled the science and monitoring promise of Landsat. Remote Sensing of Environment. 2012; 122: 2–10. doi: 10.1016/j.rse.2012.01.010 [DOI] [Google Scholar]
- 33.Justice CO, Vermote EF, Townshend JRG, Defries R, Roy DP, Hall DK, et al. The Moderate Resolution Imaging Spectroradiometer (MODIS): land remote sensing for global change research. IEEE Transactions on Geoscience and Remote Sensing. 1998; 36(4): 1228–1249. doi: 10.1109/36.701075 [DOI] [Google Scholar]
- 34.Justice CO, Townshend JRG, Vermote EF, Masuoka E, Wolfe RE, Saleous N, et al. An overview of MODIS Land data processing and product status. Remote Sensing of Environment. 2002; 83(1–2): 3–15. doi: 10.1016/S0034-4257(02)00084-6 [DOI] [Google Scholar]
- 35.Guenther B, Xiong X, Salomonson VV, Barnes WL, Young J. On-orbit performance of the Earth Observing System Moderate Resolution Imaging Spectroradiometer; first year of data. Remote Sensing of Environment. 2002; 83(1–2): 16–30. doi: 10.1016/S0034-4257(02)00097-4 [DOI] [Google Scholar]
- 36.Zhu ZD, Wu Z, Liu S, Di XM. An outline of Chinese deserts. Beijing: Science Press; 1980. pp. 84–89 (in Chinese). [Google Scholar]
- 37.Sun JM, Liu TS. The Age of the Taklimakan Desert. Science. 2006; 312(5780): 1621–1621. doi: 10.1126/science.1124616 [DOI] [PubMed] [Google Scholar]
- 38.Tang QC. Water resource and oasis construction in Tarim Basin. Journal of Arid Land Resources and Environment. 1990; 4(3): 110–116 (in Chinese). [Google Scholar]
- 39.Haddeland I, Heinke J, Biemans H, Eisner S, Flörke M, Hanasaki N, et al. Global water resources affected by human interventions and climate change. Proceedings of the National Academy of Sciences. 2014; 111(9): 3251–3256. doi: 10.1073/pnas.1222475110 [DOI] [PMC free article] [PubMed] [Google Scholar]
- 40.Huang J, Li Y, Fu C, Chen F, Fu Q, Dai A, et al. Dryland climate change: Recent progress and challenges. Reviews of Geophysics. 2017; 55(3): 719–778. doi: 10.1002/2016RG000550 [DOI] [Google Scholar]
- 41.Huang JP, Zhang GL, Zhang YT, Guan XD, Wei Y, Guo RX. Global desertification vulnerability to climate change and human activities. Land Degradation Development. 2020; 31(11): 1380–1391. doi: 10.1002/ldr.3556 [DOI] [Google Scholar]
- 42.Fan ZL, Wu SX, Wu Y, Zhang P, Zhao XF, Zhang J. The Land Reclamation in Xinjiang since the Founding of New China. Journal of Natural Resources. 2013; 28(5): 713–720 (in Chinese). [Google Scholar]
- 43.Chen YN, Xu ZX. Plausible impact of global climate change on water resources in the Tarim River Basin. Science in China Ser. D Earth Sciences. 2005; 48(1): 65–73. doi: 10.1360/04yd0539 [DOI] [Google Scholar]
- 44.Hao XM, Chen YN, Xu CC, Li WH. Impacts of climate change and human activities on the surface runoff in the Tarim River basin over the last fifty years. Water Resources Management. 2008; 22: 1159–1171. doi: 10.1007/s11269-007-9218-4 [DOI] [Google Scholar]
- 45.Chen YN, Ye ZX, Shen YJ. Desiccation of the Tarim River, Xinjiang, China, and mitigation strategy. Quaternary International. 2011; 244(2): 264–271. doi: 10.1016/j.quaint.2011.01.039 [DOI] [Google Scholar]
- 46.Yu GA, Disse M, Huang HQ, Yu Y, Li ZW. River network evolution and fluvial process responses to human activity in a hyper-arid environment–Case of the Tarim River in Northwest China. Catena. 2016; 147: 96–109. doi: 10.1016/j.catena.2016.06.038 [DOI] [Google Scholar]
- 47.Chen YN, Ye ZX, Mao XH, Zhang X, Luo JY. Dried-up trend of Tarim River and the countermeasures for mitigation. Arid Land Geography. 2009; 32(6): 813–820 (in Chinese). [Google Scholar]
- 48.Hao XM, Chen YN, Li WH. The driving forces of environmental change during the last 50 years in the Tarim River Basin. Acta Geographica Sinica. 2006; 61(3): 262–272 (in Chinese). [Google Scholar]
- 49.Chen ZS, Chen YN, Cao ZC, Sun CJ, Fan YT. The change of annual runoff and its connectivity with human driving factors in the mainstream of Tarim River. Scientia Geographica Sinica. 2011; 31(12): 1506–1511 (in Chinese). [Google Scholar]
- 50.Chen ZS, Chen YN, Li WH, Chen YP. Changes of runoff consumption and its human influence intensity in the mainstream of Tarim River. Acta Geographica Sinica. 2011; 66(1): 89–98 (in Chinese). [Google Scholar]
- 51.Tao H, Gemmer M, Bai YG, Su BD, Mao WY. Trends of streamflow in the Tarim River basin during the past 50 years: Human impact or climate change? Journal of Hydrology. 2011; 400(1–2): 1–9. doi: 10.1016/j.jhydrol.2011.01.016 [DOI] [Google Scholar]
- 52.Xu CC, Chen YN, Li WH, Chen YP. Climate change and hydrologic process response in the Tarim River Basin over the past 50 years. Chinese Science Bulletin. 2006; 51: 25–36. doi: 10.1007/s11434-006-8204-1 [DOI] [Google Scholar]
- 53.Xu CC, Chen YN, Chen YP, Zhao RF, Ding H. Responses of surface runoff to climate change and human activities in the arid region of Central Asia: A case study in the Tarim River basin, China. Environmental Management. 2013; 51: 926–938. doi: 10.1007/s00267-013-0018-8 [DOI] [PubMed] [Google Scholar]
- 54.Zhou HY, Zhang XL, Xu HL, Ling HB, Yu PJ. Influences of climate change and human activities on Tarim River runoffs in China over the past half century. Environmental Earth Sciences. 2012; 67: 231–241. doi: 10.1007/s12665-011-1502-1 [DOI] [Google Scholar]
- 55.Yang P, Chen YN, Li WH, Wang HJ, Zhang SH. Analysis of changes in runoff and drying in the Tarim River from 2003 to 2012. Resources Science. 2015; 37(3): 485–493 (in Chinese). [Google Scholar]
- 56.Xue LQ, Yang F, Yang CB, Chen XF, Zhang LC, Chi YX, et al. Identification of potential impacts of climate change and anthropogenic activities on streamflow alterations in the Tarim River Basin, China. Scientific Reports. 2017; 7: 8254. doi: 10.1038/s41598-017-09215-z [DOI] [PMC free article] [PubMed] [Google Scholar]
- 57.Tang QH, Lan C, Su FG, Liu XC, Sun H, Ding J, et al. Streamflow change on the Qinghai-Tibet Plateau and its impacts. Chinese Science Bulletin. 2019; 64(27): 2807–2821 (in Chinese). [Google Scholar]
- 58.Fan ZL, Alishir K, Xu HL, Zhang QQ, Abdumijiti. Changes of Tarim River and evolution of Lop Nur. Quaternary Sciences. 2009; 29(2): 232–240 (in Chinese). [Google Scholar]
- 59.Fan ZL, Ji F. The changes of natural environment and the green corridor protection in middle-lower reaches of the Keliya River. Arid Zone Research. 1989; (3): 16–24 (in Chinese). [Google Scholar]
- 60.Yang XP. The relationship between oases evolution and natural as well as human factors–evidences from the low reaches of the Keriya River, Southern Xinjiang, China. Earth Science Frontiers (China University of Geosciences, Beijing). 2001; 8(1): 83–89 (in Chinese). [Google Scholar]
- 61.Zhu ZD, Lu JH, Jiang WZ. Study on formation and development of aeolian landform and trend of environmental change at lower reach of the Keriya River, Taklimakan Desert. Journal of Desert Research. 1988; 8(2): 1–10 (in Chinese). [Google Scholar]
- 62.Zhou XJ, Li BS, Zhu F, Wang Y. The research on the development and evolution of the oasis of Keriya River in the Tarim Basin of Xinjiang. Yunnan Geographic Environment Research. 1996; 8(2): 44–57 (in Chinese). [Google Scholar]
- 63.Chen HS. Effect of water in eco-geographic environment of the Keriya River Valley. Journal of Desert Research. 1988; 8(2): 38–53 (in Chinese). [Google Scholar]
- 64.Yutian County Annals. Urumqi: Xinjiang People’s Publishing House; 2006. pp. 301–308 (in Chinese).
- 65.Ni PR. History, present situation and evolution prospect of Daliyaboyi Oasis. Arid Zone Research. 1993; 10(4): 12–18 (in Chinese). [Google Scholar]
- 66.Huang JJ, Zhang F, Shi QD, Jin LL. Variation characteristics for temperature and relative humidity of the natural oasis in the hinterland of the Taklimakan Desert for 2015–2016. Journal of Xinjiang University (Natural Science Edition). 2019; 36(3): 267–275 (in Chinese). [Google Scholar]
- 67.Tian YZ. Tugayi in the delta the lower reaches of the Keriya River—A natural complex reflecting ecological degradation. Journal of Desert Research. 1988; 8(2): 11–25 (in Chinese). [Google Scholar]
- 68.Yang YC. Formation and evolution on Keliya River landforms. Arid Land Geography. 1990; 13(1): 37–45 (in Chinese). [Google Scholar]
- 69.Yang XP, Zhu ZD, Jaekel D, Owen LA, Han JM. Late Quaternary palaeoenvironment change and landscape evolution along the Keriya River, Xinjiang, China: the relationship between high mountain glaciation and landscape evolution in foreland desert regions. Quaternary International. 2002; 97–98: 155–166. doi: 10.1016/S1040-6182(02)00061-7 [DOI] [Google Scholar]
- 70.Zubaida M, Xia JX, Polat M, Shi QD, Zhang R. Spatiotemporal changes of land use/cover from 1995 to 2015 in an oasis in the middle reaches of the Keriya River, southern Tarim Basin, Northwest China. Catena. 2018; 171: 416–425. doi: 10.1016/j.catena.2018.07.038 [DOI] [Google Scholar]
- 71.Hu WK, Zhang LY. History present condition and prospects of desert vegetation in the lower reaches of Keliya River. Arid Land Geography. 1990; 13(1): 46–51 (in Chinese). [Google Scholar]
- 72.Zhou XJ, Zhu F, Li SQ. The formation and evolution of oasis in the Keriya River Valley. Quaternary Sciences. 1994; (3): 249–255 (in Chinese). [Google Scholar]
- 73.Shi QD, Guo YC, Zhou XL, Dai Y, Yiliyasijiang M, Li CZ. Mechanism of the influence of surface water and groundwater on vegetation pattern in Daliyaboyi oasis at the tail of Keriya River in Taklimakan Desert. Journal of Xinjiang University (Natural Science Edition). 2019; 36(3): 253–259 (in Chinese). [Google Scholar]
- 74.Leys KF, Werritty A. River channel planform change: software for historical analysis. Geomorphology. 1999; 29(1–2): 107–120. doi: 10.1016/S0169-555X(99)00009-4 [DOI] [Google Scholar]
- 75.Hughes ML, Mcdowell PF, Marcus WA. Accuracy assessment of georectified aerial photographs: Implications for measuring lateral channel movement in a GIS. Geomorphology. 2006; 74(1–4): 1–16. doi: 10.1016/j.geomorph.2005.07.001 [DOI] [Google Scholar]
- 76.Xu HL, Ye M, Song YD. Relationship between climate changes and annual runoff of headstreams of Tarim River. Scientia Geographica Sinica. 2007; 27(2): 219–224 (in Chinese). [Google Scholar]
- 77.Lu F, Xu JH, Chen YN, Li WH, Zhang LJ. Annual runoff change and its response to climate change in the headwater area of the Yarkand River in the recent 50 years. Quaternary Sciences. 2010; 30(1): 152–158 (in Chinese). [Google Scholar]
- 78.Ling HB, Xu HL, Zhang QQ. Nonlinear analysis of runoff change and climate factors in the headstream of Keriya River, Xinjiang. Geographical Research. 2012; 31(5): 792–802 (in Chinese). [Google Scholar]
- 79.Ling HB, Xu HL, Fu JY. High -and low-flow variations in annual runoff and their response to climate change in the headstreams of the Tarim River, Xinjiang, China. Hydrological Processes. 2013; 27(7): 975–988. doi: 10.1002/hyp.9274 [DOI] [Google Scholar]
- 80.Tang M, Zhang F, Shi QD. Variations in groundwater table depth at Daliyaboyi Oasis, Keriya River, China. Arid Land Geography. 2021; 44(1): 80–88 (in Chinese). [Google Scholar]
- 81.Wang J, Zhang F, Shi QD. In situ Dataset of Surface and Groundwater in Lower reaches of Keriya River (2013–2014). Digital Journal of Global Change Data Repository. 2022; doi: 10.3974/geodb.2022.01.08.V1 (in Chinese). [DOI] [Google Scholar]
- 82.Gong WH, Wang YG, Zhao CY, Liu X, Gou SS, Gao QZ, et al. The Hydrological Characteristics in Aksu River in Lowflow Year of 2009 and Its Effects on the Ecological Environment of the Tarim River Mainstream. Journal of Glaciology and Geocryology. 2010; 32(3): 602–608 (in Chinese). [Google Scholar]
- 83.Yang F, Xue LQ, Wei GH, Chi YX, Yang G. Study on the dominant causes of streamflow alteration and effects of the current water diversion in the Tarim River Basin, China. Hydrological Processes. 2018; 32(22): 3391–3401. doi: 10.1002/hyp.13268 [DOI] [Google Scholar]
- 84.Liu J, Long AH, Li J, Yu JW, Zhang J. Analysis on runoff evolution laws and trends of three source-streams of Tarim River in recent 60 years. Water Resources and Hydropower Engineering. 2019; 50(12): 10–17 (in Chinese). [Google Scholar]
- 85.Huang GQ. Analysis on the Evolution Characteristics of Runoff in the Aksu River in the Past 50 Years. Ground Water. 2019; 41(5): 132–135 (in Chinese). [Google Scholar]
- 86.Li ZH, Shi XG, Tang QH, Zhang YQ, Gao HL, Pan XC, et al. Partitioning the contributions of glacier melt and precipitation to the 1971–2010 runoff increases in a headwater basin of the Tarim River. Journal of Hydrology. 2020; 583: 124579. doi: 10.1016/j.jhydrol.2020.124579 [DOI] [Google Scholar]
- 87.Li WW, Huang F, Shi FZ, Wei XR, Zamanian K, Zhao XN. Human and climatic drivers of land and water use from 1997 to 2019 in Tarim River basin, China. International Soil and Water Conservation Research. 2021; 9(4): 532–543. doi: 10.1016/j.iswcr.2021.05.001 [DOI] [Google Scholar]
- 88.Yu QY, Zhang JH, Bai YG, Wang S, Jiang Z, Cao B, et al. Evolution characteristics of the headstream of the Hotan River headstream from 1957 to 2018. Arid Zone Research. 2021; 38(2): 494–503 (in Chinese). [Google Scholar]
- 89.Da W, Wang SF, Shen YP, Chen AA, Mao WY, Zhang W. Hydrological response to the climatic changes in the Qarqan River basin at the northern slope of Kunlun Mountains during 1957–2019. Journal of Glaciology and Geocryology. 2021; 43(4): 1–10 (in Chinese). [Google Scholar]
- 90.Chen S, Duan WL, Li XY. Runoff changes of the Aksu River under different exploitation scenarios in the upper river. Arid Land Geography. 2021; 44(5): 1365–1372 (in Chinese). [Google Scholar]
- 91.Shi W, Wang MH, Guo W. Long-term hydrological changes of the Aral Sea observed by satellites. Journal of Geophysical Research: Oceans. 2014; 119(6): 3313–3326. doi: 10.1002/2014JC009988 [DOI] [Google Scholar]
- 92.Yang XW, Wang NL, Chen AA, He J, Hua T, Qie YF. Changes in area and water volume of the Aral Sea in the arid Central Asia over the period of 1960–2018 and their causes. Catena. 2020; 191: 104566. doi: 10.1016/j.catena.2020.104566 [DOI] [Google Scholar]
- 93.Wang XX, Chen YN, Li Z, Fang GH, Wang F, Liu HJ. The impact of climate change and human activities on the Aral Sea Basin over the past 50 years. Atmospheric Research. 2020; 245: 105125. doi: 10.1016/j.atmosres.2020.105125 [DOI] [Google Scholar]
- 94.Conrad C, Schönbrodt-Stitt S, Löw F, Sorokin D, Paeth H. Cropping Intensity in the Aral Sea Basin and Its Dependency from the Runoff Formation 2000–2012. Remote Sensing. 2016; 8(8): 630. doi: 10.3390/rs8080630 [DOI] [Google Scholar]
- 95.Zan CJ, Huang Y, Li JL, Liu T, Bao AM, Xing W, et al. Analysis of water balance in Aral Sea and the influencing factors from 1990 to 2019. Journal of Lake Sciences. 2021; 33(4): 1265–1275 (in Chinese). [Google Scholar]
- 96.Yilinuer A, Jilili A, Ma L, Samat A, Groll M. System Dynamics Modeling of Water Level Variations of Lake Issyk-Kul, Kyrgyzstan. Water. 2017; 9(12): 989. doi: 10.3390/w9120989 [DOI] [Google Scholar]
- 97.Yilinuer A, Jilili A, Groll M, Issanova G, Balati M. Changes in intra-annual runoff and its response to climate variability and anthropogenic activity in the Lake Issyk-Kul Basin, Kyrgyzstan. Catena. 2021; 198: 104974. doi: 10.1016/j.catena.2020.104974 [DOI] [Google Scholar]
- 98.Fan ZL, Ma YJ, Ji F, Wang RH. Relations between exploitation-utilization of water resources and oasis evolution and ecological balance in Tarim Basin. Journal of Natural Resources. 2001; 16(1): 22–27 (in Chinese). [Google Scholar]
Associated Data
This section collects any data citations, data availability statements, or supplementary materials included in this article.
Supplementary Materials
(DOCX)
Data Availability Statement
All relevant data are within the paper and its Supporting information files.


