

Keywords: area-specific tissue analysis (ASTA), CA1 hippocampus, entorhinal cortex, NMDA receptor GluN3 subunit gradients, TLE pathology
Abstract
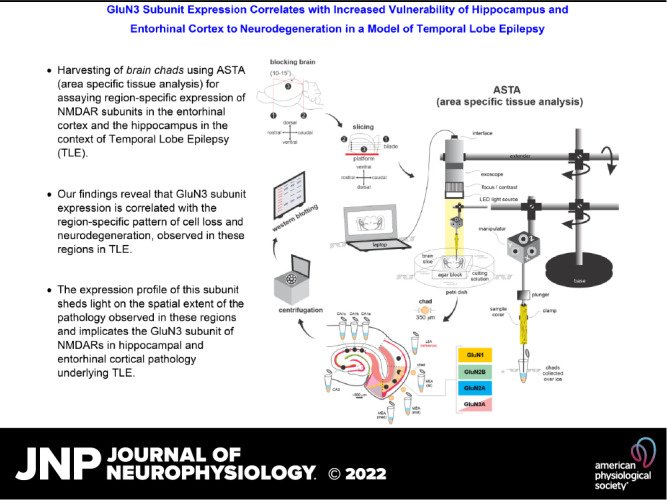
Temporal lobe epilepsy (TLE) is the most common type of epilepsy in adults that is often refractory to antiepileptic medication therapy. Neither the pathology nor the etiology of TLE is fully characterized, although recent studies have established that the two are causally related. TLE pathology entails a stereotypic pattern of neuron loss in hippocampal and parahippocampal regions, predominantly in CA1 subfield of the hippocampus and layer 3 of the medial entorhinal area (MEA), deemed hallmark pathological features of the disease. Through this work, we address the contribution of glutamatergic N-methyl-d-aspartate receptors (NMDARs) to the pathology (vulnerability and pattern of neuronal loss), and by extension to the pathophysiology (Ca2+-induced excitotoxicity), by assaying the spatial expression of their subunit proteins (GluN1, GluN2A, GluN2B, and GluN3A) in these regions using area-specific tissue analysis (ASTA), a novel methodology for harvesting brain chads from hard-to-reach regions within brain slices for Western blotting. Our data suggest gradient expression of the GluN3A subunit along the mid-lateral extent of layer 3 MEA and along the CA1-subicular axis in the hippocampus, unlike GluN1 or GluN2 subunits that are uniformly distributed. Incorporation of GluN3A in the subunit composition of conventional diheteromeric (d-) NMDARs yield triheteromeric (t-) NMDARs which by virtue of their increased selectivity for Ca2+ render neurons vulnerable to excitotoxic damage. Thus, the expression profile of this subunit sheds light on the spatial extent of the pathology observed in these regions and implicates the GluN3 subunit of NMDARs in hippocampal and entorhinal cortical pathology underlying TLE.
NEW & NOTEWORTHY The role of the GluN3 subunit in NMDAR-mediated pathophysiology underlying TLE is not known. Here, we demonstrate using ASTA (area-specific tissue analysis) that its expression in specific regions of the entorhinal cortex and the hippocampus is correlated with significant cell loss and neurodegeneration, hallmark features of the disease.
INTRODUCTION
Protein gradients are a common strategy in biology to compartmentalize cellular functions or restrict cellular activities in space, such as the regulation of cell size and cell differentiation (1, 2). They may even participate in pathophysiology of neurodegenerative diseases by dictating the vulnerability of select neuronal populations and by defining the spatial extent of the pathology. This is exemplified in temporal lobe epilepsy (TLE), where stereotypic patterns of neuron loss in layer (L) 3 of the medial entorhinal area (MEA) and in CA1 hippocampus have come to define its hallmark pathological features. Indeed, protein gradients, despite being hard to assay, are seen throughout the mammalian central nervous system (CNS), within specific regions of the brain, including the entorhinal cortex (EC). Neurons have been categorized by their expression of specific proteins, such as reelin, calbindin, calretinin, parvalbumin, somatostatin, cholecystokinin, and neuropeptide Y, that also manifest in gradient form within the EC and specifically, within the individual layers of the EC (3). Calbindin-positive cells, for example, are more numerous farther away from the rhinal sulcus in a dorsal ventral direction in L3 MEA of the rat (3), and parvalbumin-positive cells appear to become less numerous moving in a lateral-to-medial direction from lateral entorhinal area (LEA) to MEA (4). Through this work, we sought to assay the spatial expression pattern and gradient profiles, if any, for GluN1, GluN2A, GluN2B, and GluN3A, subunit proteins that compose the N-methyl-d-aspartate receptors (NMDARs). NMDAR subunit composition and Ca2+ permeability appears to vary within these regions giving rise to zones of vulnerability in which certain neuronal populations expressing these receptors are predisposed to Ca2+-induced excitotoxicity. Previous studies have highlighted that antagonism of these receptors facilitates their rescue in certain sectors of the pathology but not others; for example, intervention with d-serine that blocks Ca2+ selective, GluN3A-containing triheteromeric (t-) NMDARs recues L3 neurons in the mid-to-lateral MEA but not in the medial portion, suggesting the expression of subunit-specific protein gradients in these regions. Until recently, it has been difficult to assay and appreciate the subtleties of this differential expression because of the difficulty of accessing tissue specific to these regions. Consequently, it has proven difficult to reconcile receptor function assayed through electrophysiology, for example, with region-specific cell biology. We solve this problem using area-specific tissue analysis (ASTA), a newly developed methodology for assaying potential contribution of NMDAR subtypes to the vulnerability and patterns of neuron loss in MEA and hippocampus, and to better define the pathophysiology in these regions. This work builds upon our previous characterization of TLE-related pathology in control and epileptic animals (5), but we restricted ourselves here to just the control group for determining NMDAR subunit protein gradients because of the massive loss of neurons and circuit disruption in the MEA and CA1 hippocampus.
The EC has been a well-studied part of the parahippocampal region for over a century, yet saw a resurgence of interest with the discovery of grid cells (6), border cells, speed cells, and directionality cells (7, 8). Traditionally referred to as Brodmann’s Area 28a (MEA) and 28b (LEA) in primates, the EC comprises six identifiable layers (9) that can be distinguished based on cytoarchitecture and differing projections to the dentate gyrus (10, 11). In rodents, the EC borders multiple structures such as the parasubiculum, piriform cortex, post-rhinal cortex, and the peri-amygdaloid cortex (10). The MEA and LEA project to all subfields of the hippocampus (12–14) and while the MEA projects to both contralateral and ipsilateral sides (15, 16), the LEA projects to the contralateral side, piriform cortex, and olfactory bulb (17). In mammals, L1 contains few cells but has dense horizontal neuropil; L2 contains mainly stellate cells and few large and medium-sized pyramidal cells, bi- and multipolar neurons, basket and chandelier cells (9); pyramidal neurons are predominant in L3 with few bi- and multipolar neurons (3); L4 (lamina dissecans) separates the deep from the superficial layers and is often regarded as acellular, although there are some neurons observed; L5 and L6 comprise the deeper layers of the EC, with L5 containing medium and large pyramidal neurons in the more superficial aspect and smaller pyramidal neurons in the deeper aspect, and L6 containing mainly pyramidal and multipolar neurons (3, 18). Connections between the hippocampus and EC have been well-detailed. The perforant pathway connects L2 stellate neurons with the dentate gyrus (DG) and CA3 (11). However, the lesser-studied temporoammonic pathway (TAP) (19) connects the neurons in L3 MEA with the stratum lacunosum moleculare of CA1. The CA1 can be divided into three sections of approximately equal length: CA1a, CA1b, and CA1c (20–22) with CA1a located distally bordering the subiculum, CA1b forming the middle portion, and CA1c bordering CA2 (22, 23). Projections from EC form a gradient with distinct regions of the MEA and LEA projecting to distinct regions of the CA1. L3 cells in MEA project to CA1c, whereas L3 cells in LEA project to the CA1a region (19). We showed recently that this pattern of connectivity is of particular importance in TLE given that intervention aimed at preventing neurodegeneration in the MEA can also rescue neuron loss and neuroinflammation within subregions of CA1 (5).
Glutamate is the major excitatory neurotransmitter in the central nervous system (CNS) working through either metabotropic or ionotropic receptors (m- or i-GluRs, respectively). iGluRs are ligand-gated channels permeable to varying amounts of K+, Na+, and/or Ca2+ ions depending on their selectivities (24). There are three functionally distinct iGluR subclasses: the α-amino-3-hydroxy-5-methyl-4-isoxasolepropionic acid (AMPA), kainate receptors, and N-methyl-d-aspartate (NMDA) receptors (25, 26). The NMDARs are comprised of a combination of subunits from three gene families: GRIN1 (GluN1; obligatory subunit), GRIN2A-2D (GluN2A-2D), and GRIN3A-3B (GluN3A-3B). They assemble as tetramers comprising various combinations of four subunits. All NMDARs contain one or more of the obligatory glycine-binding GluN1 subunits, which when assembled with glutamate-binding GluN2 (GluN2A-GluN2D) subunits of the same type (e.g., GluN1-2B-1-2B) give rise to diheteromeric NMDARs (d-NMDARs) that are selective for and permeable to both Na+ and Ca2+. When assembled with glycine-binding GluN3 (GluN3A or GluN3B) subunits (e.g., GluN1-3A-1-3A), d-NMDARs are no longer activatable by glutamate and are no longer permeable to Ca2+. Triheteromeric NMDARs, on the other hand, contain three different types of subunits (27–32) and depend on the regulatory GluN3 subunit for their ion-selective properties. Receptors assembled without GluN3 (e.g., GluN1-2A-1-2B) are selective for and permeable to both Na+ and Ca2+, whereas those assembled with GluN3, designated as t-NMDARs (e.g., GluN1-2B-3A-2B), are selective for Ca2+ over Na+ for permeation and inward current (33–36). These NMDAR subtypes can also be distinguished based on their distinct current-voltage relationship profiles (35). Note that GluN3B has limited expression in the adult brain (37, 38) and therefore GluN3 predominantly refers to the GluN3A subunit henceforth in this study. The GluN3A subunit is bound by the endogenous agonists glycine and d-serine; however, there is growing evidence that d-serine can act as an antagonist, particularly when it forms t-NMDARs (5, 33, 39). We have recently shown that GluN3A containing t-NMDARs contribute significantly to the loss of neurons in L3 MEA in an animal model of TLE (35, 36, 40), and that focal application of d-serine significantly reduces neurodegeneration and epileptogenesis (5). However, our analysis has suggested that this rescue is only applicable to neurons in mid and lateral MEA (bordering the LEA) but not the medial regions (bordering the parasubiculum). We tested the hypothesis of gradient expression of NMDAR subunit protein across L3 MEA and CA1 hippocampus through precision harvesting of minute quantities of tissue (brain chads) specifically from these regions and laminae.
MATERIAL AND METHODS
All experiments were carried out in accordance with the National Institutes of Health Guide for Care and Use of Laboratory Animals and were approved by the Florida State University Institutional Animal Care Committee.
Tissue Collection
Male Sprague-Dawley rats were deeply anesthetized with urethane (1.5 g/kg ip) and decapitated. Horizontal slices (600-µm thick) were cut from the excised brains in ice-cold low-Ca2+, low-Na+ “cutting solution” (in mM): 230 sucrose, 10 d-glucose, 26 NaHCO3, 2.5 KCl, 1.25 NaH2PO4, 10 MgSO4, and 0.5 CaCl2 (equilibrated with 95% O2-5% CO2) using a vibratome (Leica VT1000S). The cut slices were transferred one at a time from the vibratome to the ASTA rig and carefully placed on a 3% agar block (made with 0.9% saline and adhered to a Petri dish using cyanoacrylate) for tissue harvesting. Brain slices were held in place atop the agar block using a platinum harp with nylon meshing and partially submerged in preoxygenated cutting solution. Brain chads were harvested from individual brain slices via hole punches using a sample corer (Fine Science Tools; 350-µm diameter) under visual guidance of an exoscope (Dino-Lite AM4917) in L3 MEA: medial MEA—close to the parasubiculum, middle MEA and lateral MEA—close to LEA; LEA proper (used as reference), CA1a, CA1b, CA1c, DG (dentate gyrus), and CA3 subfields of the hippocampus. Brain chads were collected individually in Eppendorf tubes (1.5 mL) containing cutting solution (to maintain consistency) and stored over ice until processed further (see Protein Extraction). The order of tissue collection (MEA regions first, followed by hippocampal subfields next) was maintained in all brain slices used for tissue harvesting. It typically took 3–4 min to collect brain chads from the regions of interest in a brain slice and the oxygenated cutting solution minimized rundown in tissue health. Although possible, it is unlikely that subunit expression changed during this period because GluN1, GluN2A, and GluN2B expression remained unchanged in our assays. Note that the artificial cerebrospinal fluid (aCSF) used in bringing up the pilocarpine model of TLE [comprising (in mM): 126 NaCl, 26 NaHCO3, 3 KCl, 1.25 NaH2PO4, 2 MgSO4, 2 CaCl2, and 10 d-glucose, pH 7.4] is different in composition from the cutting solution used for tissue harvesting.
Brain Fixation and Slicing
Rat brains were collected as previously described (5, 40). Briefly, rats were deeply anesthetized with urethane (1.5 mg/kg ip) before intra-aortal fixation with 4% paraformaldehyde (PFA). Brains were removed and postfixed overnight in PFA before being transferred to a 30% sucrose solution in phosphate buffer (PB; 0.1 M) until equilibration. Semi-horizontal slices (50-µm thick) were cut on a cryostat and the sections (6 series comprising 12 sections per series) collected in a cryoprotectant solution consisting of 30% ethylene glycol and 25% glycerol in 50 mM PB. The cut sections were stored at −20°C until processed or analyzed.
Protein Extraction
Brain chads were collected in ice-cold cutting solution and processed on ice or at 4°C. The roughly 12–16, 350-µm (diameter) brain chads collected simultaneously from two animals provided sufficient material for protein extraction even though it was difficult to estimate their mass individually. Following collection, the cutting solution was removed, and the tissue was washed once with wash buffer before extraction of the cytoplasmic and membrane fractions as per the Mem-PER Plus Membrane Protein Extraction Kit (Thermo Fisher Scientific, Cat. No.: 89842) instructions. Briefly, following removal of wash buffer, 30 µL of the permeabilization buffer was added along with protease inhibitors (MilliporeSigma, Cat. No.: S8820) and the tissue was homogenized using a motorized pestle homogenizer (VWR International). Samples were briefly centrifuged for 10 min at 4°C to fully lyse the cells. Following this step, samples were centrifuged for 15 min at 16,000 g at 4°C and the resulting supernatant (cytoplasmic fraction) was removed and mixed with 10 mL 4× SDS sample buffer (in mM): 200 Tris (pH 6.8), 40% glycerol, 10 EDTA (pH 8), 8% SDS, 10% β-mercaptoethanol, 8 mg of bromophenol blue, and boiled for 3 min at 100°C. A small amount of supernatant was taken for protein quantification before mixing with the sample buffer e.g., for a bicinchoninic acid (BCA) assay. The tissue pellet was then rehomogenized using the motorized pestle in 30 µL of membrane buffer with protease inhibitors added in and centrifuged for 30 min at 4°C for the membrane protein fraction. The samples were recentrifuged for 15 additional minutes at 16,000 g at 4°C. The resulting supernatant (membrane fraction) was removed and mixed with 10 mL 4× SDS sample buffer and boiled for 3 min at 100°C. As with the cytoplasmic fraction, a small volume of supernatant was removed before the addition of sample buffer for protein quantification. All samples were stored at −80°C until further use.
The BCA Assay
BCA solution (VWR) was added to a 96-well plate and 0.5, 1, 1.5, and 2 µg of bovine serum albumin were added to the BCA solution (in duplicate) to obtain a standard curve. For BCA quantification, 2 µL of the sample was added to the BCA solution. The plate was briefly shaken to stir and left at room temperature for 20–30 min before reading at 595 nm.
Immunoblotting
Polyacrylamide gels were made according to the size of the protein of interest. To detect NMDAR subunits, a 6% polyacrylamide gel was used. The membrane protein fraction was added to the gel and allowed to migrate in running buffer (in mM: 25 Tris, 191 glycine, 0.1% SDS) at 180 V for ∼75 min, or until the dye front ran off the gel. The gel was then transferred to polyvinylidene difluoride (PVDF) membrane using transfer buffer (in mM: 25 Tris, 191 glycine) at 75 V for 90 min at 4°C. The membrane was blocked for 30 min in 5% fat-free milk following which the primary antibody was added and left to incubate overnight at room temperature under gentle agitation. The following primary antibodies (Millipore, unless stated otherwise) were used (diluted 1:1,000 unless otherwise indicated): anti-NMDAR1 (rabbit, clone 1.17.2.6); anti-NR2B (mouse, clone BWJHL); anti-NR2A (rabbit, clone A12W); and anti-NR3A (rabbit) and Na+/K+ ATPase (dilution: 1:3,000, rabbit, Lot 5, Cell Signaling Technologies). The primary antibodies were washed out the following day in three 5-min rinses with Tris-buffered saline with Tween-20 (TBST; in mM: 50 Tris, 150 NaCl pH 7.4–7.6, 0.05% Tween-20). Secondary antibody (goat anti-rabbit IRDye 800CW or donkey anti-mouse IRDye 680LT, LI-COR; concentration: 1 mg/mL; dilution: 1:15,000) was then added and allowed to incubate in the dark for 1 h under gentle agitation. Membranes were rewashed three times for 5 min in TBST and imaged on the Li-Cor Odyssey CFX imager. Molecular weights were determined using a standardized high-range protein ladder (GTX50875, GeneTex Inc., Irvine, CA). The antibodies used were validated for specificity by the manufacturer and have been used by us in prior studies (35).
Immunofluorescence
Cryoprotected brain slices fixed in PFA were washed in PB (3, 5-min rinses) and main rinse solution (MRS: 0.1 M PB, 0.1 M glycine, 0.5% Triton X-100; 3, 20-min rinses) before being exposed to a blocking solution (0.1 M PB, 0.5% Triton X-100, 2% goat serum, 2% bovine serum albumin) for a minimum of 1 h on a shaker. Slices were then exposed to the anti-NeuN Alexa-555, clone A60 (Millipore, mouse; MAB377A5) primary antibody in blocking solution overnight at room temperature. As this antibody is a primary conjugate, there was no need for a secondary antibody, therefore, slices were washed in MRS (6, 10-min rinses), then mounted on slides using Vectashield mounting media with DAPI (Vector Laboratories, CA). Slices were imaged on a confocal laser-scanning microscope (Zeiss LSM 880) using an EC Plan-Neofluar ×10/0.30 WD = 5.2 M27 objective with appropriate excitation/emission filters.
Cell Counting
Images were imported from ZEN Black (imaging software, Zeiss) into ImageJ (NIH, 64-bit version) and scaled according to the pixel information. The area of interest (L3 MEA) was separated from the rest of the image so that neurons only in the region of interest could be counted. An area ∼0.36–0.4 mm2 was used for L3 MEA cell counts. Each image was converted to 16-bit gray scale and background noise reduced. The area and circularity [4π × (area)/(perimeter)2] parameters of the particle analyzer function in ImageJ were set to 209 µm2 and 0.01 to 1 (default, 0 being a straight line and 1 being a perfect circle), respectively. Any particle falling within these parameters was counted as a cell, with majority of neurons being circular in profile. Cells identified/counted by ImageJ were checked manually to ensure that all cells were accounted for, including those with overlapping profiles. Positional coordinates for neurons counted by ImageJ were used to group the data into three equal bins, 400 µm wide, comprising the mid, medial, and lateral MEA.
Statistical Analysis
Statistical analysis was performed using GraphPad Prism (v.9). For neuron counting, either a nested one-way ANOVA with a Dunnett’s multiple comparison test (MEA) or a nested t test (CA1) was used. For immunoblot analysis, a nonparametric Kruskal–Wallis test (one-way ANOVA, on ranks) with Dunn’s multiple correction (≥3 groups) and the unpaired Mann–Whitney test (2 groups) was used. Indicated data sets were also analyzed using a parametric unpaired t test with Welch’s correction (2 groups: not assuming equal standard deviations) following confirmation of normality.
RESULTS
TLE Pathology in the MEA Varies across Layer 3
We previously described the effectiveness of focal d-serine (a GluN3A-containing t-NMDAR-specific antagonist) application to the MEA in reducing astrogliosis (astrocytes and microglia) and preventing epileptogenesis and neuron loss in a rat model of TLE (5, 40). However, we noted that these gains could be realized predominantly in mid-to-lateral aspects of the MEA closer to LEA (schematic, Fig. 1B), but not in the medial portions (schematic, Fig. 1A). Electrophysiological and pharmacological characterization of NMDARs in this region (Fig. 1A, a–c, medial; Fig. 1B, a–c, lateral) suggested differential expression of conventional d-serine insensitive d-NMDARs in the medial aspects of MEA in contrast with the d-serine sensitive t-NMDARs in the mid-to-lateral aspects (Fig. 1A, d and e, medial; Fig. 1B, d and e, lateral). Note the differences in current-voltage relationships of GluN3 negative (left insets)/positive (right insets) NMDAR-mediated excitatory postsynaptic currents (middle inset) evoked in these neurons and their rescue following an epileptogenic insult (pilocarpine induced status epilepticus, Fig. 1, A and B) using d-serine (35, 40). Indeed, confocally acquired images of L3 MEA revealed a distribution of neurons across the layer in control animals (average neuron counts per section: 86 ± 8 medial, 124 ± 9 middle, 88 ± 6 lateral MEA; n = 15 slices, 3 animals; P = 0.07, one-way ANOVA with Dunnett’s multiple comparison test; Fig. 1C) that is severely disrupted in the epileptic animals (average neuron counts per section: 38 ± 4 medial, 58 ± 7 middle, 73 ± 7 lateral MEA; n = 15 slices, 5 animals; P = 0.15, one-way ANOVA with Dunnett’s multiple comparison test; Fig. 1D). Note the conspicuous reductions in neuron counts in the medial and mid MEA under epileptic conditions compared with control (P ≤ 0.01 for both; nested one-way ANOVA with a Tukey’s multiple comparison test). Focal infusion of d-serine to the MEA rescued neurons in the mid-to-lateral, but not medial, aspects of the MEA (average neuron counts per section: 41 ± 3 medial, 105 ± 7 middle, 103 ± 5 lateral MEA; n = 28 slices, 6 animals; P < 0.001, one-way ANOVA with Dunnett’s multiple comparison test; Fig. 1E). Note that neurons continue to perish in the medial portions of the MEA even with d-serine onboard, unlike the middle and lateral MEA where neuron counts are like those seen in controls. These data suggest differential expression of GluN3-containing NMDARs extending from the medial-to-lateral aspects of L3 MEA that correlates with neuron loss.
Figure 1.

Temporal lobe epilepsy (TLE) pathology in layer (L)3 medial entorhinal area (MEA). Summary of neuro-glia changes characterizing TLE pathology in the medial (A) and mid-to-lateral (B) MEA (L3) brought about by an initial precipitating injury (status epilepticus), followed by focal application of either artificial cerebrospinal fluid (aCSF, left) or d-serine (right) to the MEA. See Ref. 40 for more details. Insets (lowercase letters in red): pharmacologically isolated N-methyl-d-aspartate receptor (NMDAR)-mediated excitatory postsynaptic currents (EPSCs) (a, cocktail: 50-μM picrotoxin and 10 μM NBQX in aCSF; HP, holding potential) evoked in L3 neurons by minimal stimulation of local afferents and their current-voltage (I-V) profiles (b). Brain slices depicting placement of stimulating (S) and recording (R) electrodes (c). Note the expression of conventional, non-GluN3 containing, diheteromeric (d)-NMDARs in pyramidal neurons in the medial portions of MEA (left) and GluN3 containing triheteromeric (t)-NMDARs in the lateral portions (right) (d). d-serine-mediated antagonism, or lack thereof, of NMDAR-mediated EPSCs evoked in these regions (e). For more on electrophysiological methods see Ref. 35. Immunofluorescence images of the MEA (top) and neuron counts (bottom) in brain slices from control (C; inset, schematic highlighting the region imaged), epileptic (D) and poststatus rats treated with d-serine (E), highlighting neuronal pathology immunoassayed with fluorescently-tagged antibodies against NeuN (red). Bottom panels are histograms of averaged neuronal density (red bars) across the mid, medial, and lateral MEA (yellow arrows) under the indicated conditions. Each data point represents neuron density in a brain slice and error bars indicate SE. Statistical significance (P values) was determined using a nested one-way ANOVA with Dunnett’s multiple comparison test. ***P ≤ 0.001, ns, not significant. Statistical significance of cross comparisons between control and epileptic or d-serine treatment (red stars) in the mid, medial, and lateral MEA was assessed using a nested one-way ANOVA with a Tukey’s multiple comparison test. *P ≤ 0.05, **P ≤ 0.01.
TLE Pathology in the Hippocampus Varies across CA1 Stratum Pyramidale
Previous work also established that d-serine application to the MEA also rescues TLE pathology and neuron loss in CA1 hippocampus within subregions, CA1c, CA1b, and CA1a (5). This action-at-a-distance effect of d-serine infusion into the entorhinal cortex is believed to be mediated by the temporoammonic pathway (TAP), one of two pathways (the other being the perforant pathway) that couple both regions. Interestingly, stratum pyramidale in CA1 is most severely disrupted in CA1c compared with CA1b or CA1a, which is the least affected of all CA1 subregions following an epileptogenic insult (pilocarpine induced status epilepticus, Fig. 2A). Thus, while the stratum pyramidale is thinned out in all three subregions [Fig. 2B; CA1 combined, control: 3,159 ± 185 vs. epileptic: 1,740 ± 76 cells/mm2, P < 0.0001, nonparametric (np) one-way ANOVA], neuron loss appears to be most conspicuous in CA1c (neuronal density; control: 3,413 ± 378 vs. epileptic: 1,356 ± 52 cells/mm2) followed by CA1b (control: 3,203 ± 333 vs. epileptic: 1,835 ± 89 cells/mm2) and CA1a (control: 2,861 ± 247 vs. epileptic: 1,871 ± 110 cells/mm2). As demonstrated previously, neuronal density was significantly higher in d-serine-treated animals compared with epileptic animals only in CA1c (control: 1,356 ± 52 vs. d-serine: 1,571 ± 83, P < 0.05, t test with Welch’s correction; Fig. 2C, left) and no other region (CA1b, control: 1,835 ± 89 vs. d-serine: 1,878 ± 110; CA1a, control: 1,871 ± 110 vs. d-serine: 1,739 ± 72, P = 0.55 and 0.64 for CA1b and CA1a, respectively, t test with Welch’s correction; Fig. 2C, middle and right). Taken together, these data suggest that region CA1c is the most severely affected of all subdivisions of CA1 in terms of neuron loss, and application of d-serine to the MEA is efficacious in rescuing this loss specifically in the CA1c subfield but not the adjacent CA1b or CA1a subfields in epileptic animals. Given the regional specificity of neuron loss under epileptic conditions and its rescue with d-serine, this suggests differential expression of GluN3A along the CA1-subicular axis, like in the MEA, except with more GluN3A expressed in subregion CA1c compared with CA1b or CA1a.
Figure 2.

Temporal lobe epilepsy (TLE) pathology in CA1 hippocampus. Portions of this figure (A and B) are taken from Ref. 5 (Fig. 5) for purposes of illustration and comparison. A: high magnification images of stratum pyramidale in the CA1 subfields of nonstatus controls (top), epileptic (middle), and poststatus rats treated with d-serine (bottom) immunostained with fluorescently tagged antibodies against NeuN (red) to showcase the significant neurodegeneration in CA1c (*) and its rescue with d-serine intervention in the MEA. Inset is a schematic highlighting the region imaged. B: representative examples of density grams for neurons, generated by plotting the precise location of cells counted on a grid in various subdivisions of CA1 (c, blue; b, red; and a, black) under the indicated conditions. Note the thinning out of stratum pyramidale in CA1c in epileptic animals. C: average neuronal density (blue and red bars) across individual subdivisions of the CA1 subfield under the indicated conditions (numerator: number of animals used; denominator: total number of sections assayed for each condition). Each data point (overlapping data points are occluded form view) represents neuron density in a brain section and error bars indicate SE. Statistical significance (P values) was determined with a nested t test. *P < 0.05.
Area-Specific Tissue Analysis
Testing the expression of NMDAR subunit protein gradients necessitated the assessment of lamina-specific differences in their abundance through precise sampling of brain tissue and Western blotting. Currently available approaches for sampling live tissue from hard-to-reach regions of a brain cut acutely into sections, including laser dissection (more suited for a monolayer of cells), are inapplicable given the thickness of slices used (typically around 100–500 µm). ASTA was therefore developed as a novel methodology to fulfill the need for precision harvesting of brain chads from specific regions of a slice (akin to a biopsy), under visual guidance of an exoscope using a sample corer (350–500 µm diameter), for cell biological analysis of the membrane and cytoplasmic components (Fig. 3). ASTA enables access to multiple areas of the sectioned brain simultaneously, irrespective of their orientation (Fig. 3, A–F, insets), while circumventing the known complications arising from section thickness. This method is reliable, efficient, and especially suited for CNS work where tissues need to be handled delicately to maintain neuronal integrity.
Figure 3.

Area-specific tissue analysis (ASTA). Outline of the approach used in our investigation—from harvesting to processing brain chads from within regions of interest in acute slices. Insets: blocked brains being sliced on a vibratome (A) into horizontal (B) or coronal (C) sections before being transferred to the ASTA rig for tissue harvesting (D) from specific regions within slices visualized under the high magnification of an exoscope (E) or separately under a microscope with DIC optics (F, laminar location of punches in the medial entorhinal area (MEA) relative to lamina dissecans (L4, yellow arrowheads) that separates layer (L)3 from deeper layers L5/6). See the methods for further details. LEA, lateral entorhinal area.
Brain chads extracted from regions of interest using ASTA (see Protein Extraction in methods) were processed for protein content via Western blot analysis. We typically used two brains per experiment or repeat such that enough protein could be extracted for this purpose (protein yields were on the lower end of the detection limit with a single brain). Each brain yielded 3–4 slices (600 µm thick) and roughly 12–16 chads from both hemispheres were combined per region (Fig. 4, inset). A protein concentration assay was performed on the membrane fraction to determine total amount of starting protein for Western blot loading and to identify differences in total protein across the various regions assayed (Fig. 4). Total protein yield was consistent across different regions of the MEA, averaging slightly over 1 µg per repeat, although it was much lower in the hippocampus, with some regions i.e., CA3 and DG yielding as little as 0.5 µg. Although we cannot fully explain these region-specific differences, factors such as cell density might influence the total amount of membrane protein that can be harvested from the brain chads per experiment or repeat. Nonetheless, these data confirm that even these low amounts of starting material are sufficient to run a Western blot analysis successfully using ASTA.
Figure 4.

Quantitation of membrane protein harvested. Average of total membrane protein (µg, red bars) in brain chads harvested from various brain regions that was used for Western blotting. Each data point on the plot represents an experiment or repeat comprising of 12 to 16 brain chads from two animals processed simultaneously (inset). Note the consistency in protein yield across medial entorhinal area (MEA) and lateral entorhinal area (LEA). Protein yield varied across hippocampal subfields but was sufficient for Western blot analysis. DG, dentate gyrus.
Expression Profiles of NMDAR Subunits in the MEA Assayed Using ASTA
A Western blot analysis of NMDAR subunit proteins in the membrane fraction of pooled chads from the medial, mid, and lateral aspects of L3 MEA was performed with LEA, an area not subjected to neuron loss or neuroinflammatory response with the pilocarpine model of TLE, serving as reference (Fig. 5, inset). The representative Western blots for GluN1, GluN2B, GluN2A, and Glun3A show their relative abundance within various subdivisions of MEA, with Na,K-ATPase used as loading control (Fig. 5). The protein levels for each subunit within these subdivisions were quantified and plotted relative to the LEA (Fig. 6). Average expression levels relative to LEA (100%) were not significantly different across the MEA for GluN1 (means ± SE %; medial: 170 ± 60, mid: 257 ± 125, lateral: 155 ± 72; n = 5 repeats; P = 0.87, np one-way ANOVA; Fig. 6A), GluN2A (medial: 126 ± 42, mid: 252 ± 80, lateral: 122 ± 26; n = 7 repeats; P = 0.47, np one-way ANOVA; Fig. 6B), and GluN2B (medial: 97 ± 20, mid: 193 ± 75, lateral: 145 ± 44; n = 7 repeats; P = 0.67, np one-way ANOVA; Fig. 6C). However, the average expression levels for GluN3A were significantly different across various subdivisions of the MEA (medial: 91 ± 13, mid: 181 ± 33, lateral: 218 ± 28; n = 8 repeats; P < 0.002, np one-way ANOVA; Fig. 6D1), and the estimation plots show significant increases in mean expression levels for this subunit between medial and mid MEA (P < 0.05, unpaired t test assuming unequal SDs with Welch’s correction; Fig. 6D2), medial and lateral MEA (P < 0.005; Fig. 6D3), but not between mid and lateral MEA (P = 0.39; data not shown). Although the greatest increase in GluN3A expression is between the medial and mid segments of MEA, the locus of TLE-mediated neurodegeneration, the overall trend in the abundance of this subunit, relative to LEA, points to a GluN3A protein gradient in which its expression ramps up from medial-to-lateral MEA across layer 3.
Figure 5.

Regional differences in N-methyl-d-aspartate receptor (NMDAR) subunit protein expression in medial entorhinal area (MEA). Region-specific expression of GluN1, GluN2A, GluN2B, and GluN3A subunit protein in purified membrane fractions of brain chads harvested from mid, medial, and lateral MEA using area-specific tissue analysis (ASTA) and Western blot analysis with Na/K ATPase used as a control for membrane expression and lateral entorhinal area (LEA) as a non-MEA reference (red). Arrowheads indicate molecular weight as assessed using a standard molecular weight marker/protein ladder (bottom-most).
Figure 6.

Quantitation of N-methyl-d-aspartate receptor (NMDAR) subunit protein expression in medial entorhinal area (MEA). A–D: histograms of the average abundance (red bars) of GluN1 (A), GluN2A (B), GluN2B (C), and GluN3A (D1) in the mid, medial, and lateral MEA relative to lateral entorhinal area (LEA) (100%, reference). Each data point represents an experiment or a repeat, and error bars indicate SE. Unless otherwise indicated, in this and subsequent figures, P values are determined using the nonparametric (np) Kruskal–Wallis test (np one- or two-way ANOVA, on ranks) with Dunn’s multiple correction (≥3 groups). *P < 0.05, **P ≤ 0.005. Estimation plots showing % differences between means of GluN3 expression in medial and mid MEA (D2) and between medial and lateral MEA (D3). Error bars indicate SE and P values are determined using unpaired t test (assuming unequal SDs) with Welch’s correction. *P < 0.05, **P ≤ 0.005
Expression Profiles of NMDAR Subunits in Hippocampus Assayed Using ASTA
We previously described the mitigating effects of d-serine intervention in the MEA on TLE pathology and neuron loss in hippocampal CA1c, CA1b, and CA1a that suggested differential expression of NMDAR subunits, particularly GluN3A, in these subregions (5). Consequently, d-serine reduced neuroinflammation and rescued neurons preferentially in CA1c compared with CA1a or CA1b (Fig. 2). To confirm this, we assayed GluN3A protein levels in these subregions using ASTA (Fig. 7). As in MEA, a Western blot analysis of NMDAR subunit proteins GluN3A, GluN2A, and GluN1 in the membrane fraction of chads pooled from hippocampal CA1a, CA1b, CA1c, CA3, and dentate gyrus (DG) was performed with LEA as reference (Fig. 7, inset). GluN2B expression levels in these regions were below the threshold of detection (data not shown) and were therefore not pursued further. The representative Western blots for these subunits show their relative abundance within the various subdivisions of CA1, CA3, and DG of hippocampus, with Na,K-ATPase used as loading control (Fig. 7). The protein levels for each subunit within these regions (GluN1 expression was assayed only in CA1a and CA1c) were quantified and plotted relative to those in LEA (Fig. 8).
Figure 7.

Regional differences in N-methyl-d-aspartate receptor (NMDAR) subunit protein expression in hippocampus. Region-specific expression of GluN3, GluN2A, GluN1 subunit protein in purified membrane fractions of brain chads harvested from CA1a, CA1b, CA1c, CA3, and dentate gyrus (DG) using area-specific tissue analysis (ASTA) and Western blot analysis with Na/K ATPase used as a control for membrane expression and lateral entorhinal area (LEA) as a nonhippocampal universal reference (red). Arrowheads indicate molecular weight.
Figure 8.

Quantitation of N-methyl-d-aspartate receptor (NMDAR) subunit protein expression in hippocampus. A–C: histograms of the average abundance (red bars) of GluN3A (A1 and A2), GluN2A (B) and GluN1 (C) in CA1a, CA1b, CA1c, CA3, and dentate gyrus (DG, inset) relative to lateral entorhinal area (LEA) (100%, reference). Each data point represents a repeat, or an experiment and error bars indicate SE. ***P ≤ 0.001. A2: estimation plot showing % difference between means of GluN3 expression between CA1c and CA1a. Error bars indicate SE and P value is determined using unpaired t test (assuming unequal SDs) with Welch’s correction. **P ≤ 0.005.
Average expression levels relative to LEA (100%) were significantly different across CA1 for GluN3A (means ± SE %; CA1a: 134 ± 16, CA1b: 259 ± 65, CA1c: 216 ± 24; n = 10, 4, and 12 repeats respectively; P < 0.0001, np one-way ANOVA; Fig. 8A1), and pairwise comparisons with the LEA showed significant elevation in protein levels in CA1b and CA1c (P < 0.007, Dunn’s multiple comparisons test), but not CA1a (P = 0.422). The estimation plot shows a significant increase in mean expression levels for this subunit between CA1a and CA1c (P < 0.05, unpaired t test assuming unequal SDs with Welch’s correction; Fig. 8A2) with the greatest GluN3 expression in CA1c, the locus of TLE-mediated neurodegeneration. Thus, the overall trend in the abundance of this subunit, relative to LEA, points to a GluN3A gradient in which its expression ramps up across CA1 from subregion CA1a to CA1c. Interestingly, GluN3A expression in other regions of the hippocampus, namely, CA3 and the DG, was at trace levels just above the threshold of detectability but significantly below levels observed in the LEA (means ± SE %; CA3: 20 ± 6, DG: 17 ± 12; n = 4 repeats each; P < 0.0001, np one-way ANOVA; Fig. 8A1). Pairwise comparisons with the LEA show significantly lower protein levels in CA3 and DG (P < 0.006, Dunn’s multiple comparisons test for both), suggesting a CA1-specific expression.
To determine if expression of the GluN3A protein gradient also applied to other subunits of the NMDAR, we assayed for GluN2A abundance (GluN2B expression was below the threshold for detection) in chads from the same locations used for the GluN3A analysis (Fig. 8B). Average expression levels relative to LEA (100%) were similar across CA1 (means ± SE %; CA1a: 83 ± 15, CA1b: 176.1 ± 120, CA1c: 219 ± 52; n = 5, 4, 12 repeats respectively; P = 0.23, np one-way ANOVA; Fig. 8B), despite a wider spread in CA1c compared with CA1a. Consequently, pairwise comparisons revealed no significant differences between LEA and any of these subdivisions (P > 0.9, Dunn’s multiple comparisons test for CA1a, b, or c). Average expression levels relative to LEA were also not significantly different across CA3 and DG (means ± SE %; CA3: 101 ± 29, DG: 114 ± 32; n = 4 repeats each; P = 0.87, np one-way ANOVA; Fig. 8B). Even though average GluN2A expression in CA1 (CA1a, CA1b, and CA1c subdivisions combined: 163 ± 33, n = 25 repeats) was higher than in non-CA1 regions (CA3 and DG combined: 108 ± 20, n = 8 repeats), it was not different enough to reach statistical significance (P = 0.85, unpaired np Mann–Whitney test).
Finally, to determine if GluN3 subunits in various subdivisions of CA1 can combine with GluN2 and GluN1 to give rise to t-NMDARs, we assayed for the expression of GluN1, the mandatory subunit for NMDA receptor synthesis. ASTA analysis of GluN1 protein in brain chads from CA1a and CA1c revealed expression levels like those in LEA (means ± SE %; CA1a: 220 ± 93, CA1c: 225 ± 56; n = 5 repeats each; P = 0.38, np 1-way ANOVA; Fig. 8C). Together, these data confirm the gradient expression of GluN3 subunit protein within CA1 hippocampus, just as in L3 MEA.
DISCUSSION
TLE pathology manifests in characteristic patterns of neuron loss in hippocampal (e.g., CA1 subfield) and parahippocampal regions (e.g., L3 MEA), deemed as hallmark features of the disease. Through this work, we assessed the contribution of glutamatergic NMDARs to the vulnerability and pattern of TLE-related neurodegeneration by assaying the spatial expression profiles of their subunit proteins (GluN1, GluN2A, GluN2B, and GluN3A) in these regions using a newly developed methodology (ASTA, area-specific tissue analysis) for harvesting brain chads from specific locations within acute slices for cell biological analysis (e.g., Western blotting). Assaying the expression profiles of NMDAR subunits informs us about the putative subunit composition of receptors in these regions and together with all that is known of their function, about the pathophysiology underlying TLE. This work is focused particularly on the GluN3 subunit because of the potential for GluN3-containing t-NMDARs to bring about Ca2+-induced excitotoxicity, a major driver of TLE-mediated neurodegeneration. Our data suggest hitherto unknown upward and downward gradients for GluN3 subunit expression along the mid-lateral extent of L3 MEA and along the CA1-subicular axis in the hippocampus (Fig. 9A). The expression profile of the GluN3 subunit corresponds with the spatial extent of the pathology observed in these regions well enough to implicate it in hippocampal and entorhinal cortical pathology underlying TLE (Fig. 9B).
Figure 9.

Summary of N-methyl-d-aspartate receptor (NMDAR) subunit protein expression in medial entorhinal area (MEA) and hippocampus in the context of temporal lobe epilepsy (TLE). A: schematic of NMDAR subunit protein expression gradients assayed in the hippocampal entorhinal cortical slice preparation using area-specific tissue analysis (ASTA). GluN3 subunit protein expression levels in MEA and hippocampus are correlated with neurodegeneration underlying TLE pathology (B) and d-serine-mediated rescue of neurons (C) in these regions. Arrows on table in C are meant to encourage comparison across regions (rows, yellow) and across the indicated conditions (columns, blue). Note that high GluN3A expression levels are correlated with moderate to severe neuron loss (compare the magenta vs. green- or purple-colored columns) and are amenable to d-serine mediated rescue in all regions assayed except medial MEA (yellow-colored column), where TLE-mediated neurodegeneration seems to be non-GluN3 dependent. *Ref. 40. LEA, lateral entorhinal area.
Role of GluN3 in TLE Pathology
GluN3 has remained a largely understudied NMDAR subunit, ever since its cloning back in 1995 (41, 42). Initially thought to be regulated developmentally, with limited to no expression in the adult CNS, recent explorations at the transcript level have revealed that GRIN3A (mRNA) is strongly expressed in the adult mouse brain, particularly in the entorhinal cortex and in hippocampal CA1 (43). Furthermore, there is ample electrophysiological and pharmacological evidence to support GluN3A expression in adult rat brains, particularly in the entorhinal and somatosensory cortices, in the form of t-NMDARs (GluN1:GluN2:GluN3A) (5, 33–35) or as an unconventional GluN1:GluN3A receptor in the habenula and hippocampus (44, 45) that provide sufficient evidence for GluN3A subunit expression and function in the adult CNS.
We previously showed that GluN3-containing t-NMDARs are specifically antagonized by d-serine, an endogenous amino acid (33, 35), and more importantly, are four- to fivefold more selective for Ca2+ over Na+ compared with non-GluN3 containing d-NMDARs (33, 36) making them prime mediators of Ca2+-induced excitotoxic cell death. Thus, focal application of d-serine to the MEA prevented neuron loss and neuroinflammation within L3 and CA1 hippocampus, thereby reducing seizure severity and curtailing epileptogenesis in the rat pilocarpine model of TLE (5, 40). These studies revealed an inverse relationship between neuron loss and glial (astrocytes and microglia) expression; yet, more conspicuously, pilocarpine-treated animals showed greater neuron loss and enhanced glial expression in the mid-to-medial MEA compared with mid-to-lateral aspects of the MEA with similar trends observed between CA1c-CA1b versus CA1b-CA1a. Interestingly, and rather surprisingly, d-serine-mediated rescue of neurons and neuroinflammation was most effective in the mid-to-lateral but not the medial aspects of MEA (Fig. 9C, yellow-colored column). These observations together with electrophysiological recordings of NMDAR mediated EPSCs and their current-voltage relationships allowed us to hypothesize: 1) the existence of a GluN3A protein gradient in which its expression changes from trace levels in medial MEA to highest levels in the mid-to-lateral MEA such that medial aspects of MEA exhibit a non-GluN3A- mediated pathology and 2) d-serine-mediated rescue of TLE pathology is attributable to the expression of GluN3A-containing t-NMDARs that are also responsible for neuron loss and astrogliosis in these regions. To test these hypotheses, we needed to sample protein levels in these regions precisely, given that little is known about lamina specific-expression of the GluN3A subunit or GluN3A-containing NMDARs barring their relatively recent discovery in the adult CNS (33, 35, 46). Development of the ASTA methodology filled this niche, enabling assessments of GluN3A protein gradients in these regions while confirming the uniform expression of other (GluN2A, GluN2B, and/or GluN1) NMDAR subunits in the MEA, and for the first time, to associate GluN3A expression with TLE-mediated pathology. In the hippocampus, we were able to confirm that region-specific (CA1 but not CA3 or DG) GluN3A subunit protein expression is directly correlated with vulnerability of neurons in TLE-mediated neurodegeneration (Fig. 9C, non-yellow columns). These findings are of significance in better defining the spatial extent of the pathology underlying this disease in critical regions of memory consolidation and navigation and in the identification of areas for therapeutic intervention.
The obtaining of suitable quantities of area-specific tissue to isolate and assay the membrane fraction for NMDAR subunit expression has enabled us to present direct evidence for the gradient expression of GluN3A in medial-to-lateral L3 MEA and within the subregions of CA1 hippocampus. Neurochemical gradients within the entorhinal cortex have been well established (3) although this is the first time, to the best of our knowledge, that gradients in NMDAR subunit expression have been demonstrated within the MEA and hippocampus, facilitated by the serendipitous discovery that focal application of d-serine in MEA reduces pathological markers of TLE in these regions. Gradients in the other subunits (GluN1, GluN2A, or GluN2B) were not detected in either the MEA or CA1, likely due to GluN2A or GluN2B replacing GluN3A in the more medial portion of the MEA or within the CA1a compared with CA1c.
Protein Gradients in Adult CNS
A pertinent question is why GluN3A expressed in a gradient within L3 MEA? The spatial heterogeneity of the mammalian cerebral cortex is widely acknowledged; pyramidal cell size, neuron density, cortical thickness, laminar differentiation, and local circuit wiring all vary across the cerebral cortex (47). Numerous studies (48–51) have suggested that the heterogeneous nature of the mammalian cerebral cortex is not random but manifests as spatially ordered changes giving rise to characteristic patterns with sensory areas at one end and associational areas at the other (48, 52). Efforts on this front have discerned a negative correlation between metabotropic and ionotropic receptors, with metabotropic receptors (e.g., mGluRs) increasing in density moving from sensory to association areas, whereas ionotropic receptors (e.g., NMDARs) decreasing in density moving from sensory to association areas. These broader principles of receptor expression and distribution appear to be laminar-specific and underscore the need to further elucidate details of their organization and function with higher spatial resolution (48). The work presented in this manuscript was undertaken in this spirit. Primary sensory areas are required to operate on rapid temporal scales and the greater density of ionotropic receptors in these areas likely serves this purpose. Furthermore, the ratio of T1w (weighted) to T2w MRI signal, reflective of myelin content of gray matter, correlates negatively with layer-dependent hierarchical position (53–55) and GluN1, GluN2A, GluN2B, and GluN3A expression all increase as the ratio of T1w to T2w decreases toward higher hierarchical positions (47). However, it remains to be seen whether this macro view of cortical receptor expression distills down to individual lamina as it appears to do for interlaminar differences in receptor expression.
GluN3A-containing t-NMDAR-mediated EPSCs in L5 pyramidal neurons of the whisker sensorimotor cortex were shown to potentiate with δ burst stimulation (0.1–4 Hz) of L1 primary whisker motor cortex synaptic inputs but θ, α, and γ burst stimulation of the same pathway either produced no change or depressed the synapses. Conversely, non-GluN3 containing d-NMDAR-mediated EPSCs in the same neurons were shown to potentiate with θ, α, or γ burst stimulation of L5 thalamic/striatal synaptic inputs but not with δ burst stimulation (34). These findings suggest that GluN3A expression is layer-specific and that these neurons are geared to respond differently to specific inputs depending on the behavioral state of the animal such as slow wave, non-rapid eye movement (REM) sleep (56).
We can only hypothesize regarding the gradient expression of GluN3A in L3 MEA and CA1 hippocampus at the present time and that there may be other brain regions where such gradients might exist. Identification of these regions and elucidation of their biological function(s) will obviously require further study including the use of animals in which GluN3 is knocked out. We do however know now that GluN3A expression is correlated with increased vulnerability to TLE-mediated neurodegeneration and neuroinflammation and this information might be of use in the development of novel therapeutics to combat the disease.
GRANTS
This work was supported in part by a grant from the National Institute of Neurological Disorders and Stroke R01NS097802 (to S. S. Kumar).
DISCLOSURES
No conflicts of interest, financial or otherwise, are declared by the authors.
AUTHOR CONTRIBUTIONS
S.B., T.S., and S.S.K. conceived and designed research; S.B., T.S., and S.S.K. performed experiments; S.B., T.S., C.L., and S.S.K. analyzed data; S.B., T.S., and S.S.K. interpreted results of experiments; S.B. and S.S.K. prepared figures; S.B. and S.S.K. drafted manuscript; S.B. and S.S.K. edited and revised manuscript; S.B., T.S., C.L., and S.S.K. approved final version of manuscript.
REFERENCES
- 1.Kiekebusch D, Thanbichler M. Spatiotemporal organization of microbial cells by protein concentration gradients. Trends Microbiol 22: 65–73, 2014. doi: 10.1016/j.tim.2013.11.005. [DOI] [PubMed] [Google Scholar]
- 2.Wartlick O, Kicheva A, Gonzalez-Gaitan M. Morphogen gradient formation. Cold Spring Harb Perspect Biol 1: a001255, 2009. doi: 10.1101/cshperspect.a001255. [DOI] [PMC free article] [PubMed] [Google Scholar]
- 3.Kobro-Flatmoen A, Witter MP. Neuronal chemo-architecture of the entorhinal cortex: a comparative review. Eur J Neurosci 50: 3627–3662, 2019. doi: 10.1111/ejn.14511. [DOI] [PubMed] [Google Scholar]
- 4.Wouterlood FG, Hartig W, Bruckner G, Witter MP. Parvalbumin-immunoreactive neurons in the entorhinal cortex of the rat: localization, morphology, connectivity and ultrastructure. J Neurocytol 24: 135–153, 1995. doi: 10.1007/BF01181556. [DOI] [PubMed] [Google Scholar]
- 5.Beesley S, Sullenberger T, Ailani R, D'Orio C, Crockett MS, Kumar SS. d-Serine intervention in the medial entorhinal area alters TLE-related pathology in CA1 hippocampus via the temporoammonic pathway. Neuroscience 453: 168–186, 2021. doi: 10.1016/j.neuroscience.2020.10.025. [DOI] [PMC free article] [PubMed] [Google Scholar]
- 6.Fyhn M, Molden S, Witter MP, Moser EI, Moser MB. Spatial representation in the entorhinal cortex. Science 305: 1258–1264, 2004. doi: 10.1126/science.1099901. [DOI] [PubMed] [Google Scholar]
- 7.Kropff E, Carmichael JE, Moser MB, Moser EI. Speed cells in the medial entorhinal cortex. Nature 523: 419–424, 2015. doi: 10.1038/nature14622. [DOI] [PubMed] [Google Scholar]
- 8.Rowland DC, Roudi Y, Moser MB, Moser EI. Ten years of grid cells. Annu Rev Neurosci 39: 19–40, 2016. doi: 10.1146/annurev-neuro-070815-013824. [DOI] [PubMed] [Google Scholar]
- 9.Canto CB, Wouterlood FG, Witter MP. What does the anatomical organization of the entorhinal cortex tell us? Neural Plast 2008: 381243, 2008. doi: 10.1155/2008/381243. [DOI] [PMC free article] [PubMed] [Google Scholar]
- 10.Kjonigsen LJ, Leergaard TB, Witter MP, Bjaalie JG. Digital atlas of anatomical subdivisions and boundaries of the rat hippocampal region. Front Neuroinform 5: 2, 2011. doi: 10.3389/fninf.2011.00002. [DOI] [PMC free article] [PubMed] [Google Scholar]
- 11.Witter MP. The perforant path: projections from the entorhinal cortex to the dentate gyrus. Prog Brain Res 163: 43–61, 2007. doi: 10.1016/S0079-6123(07)63003-9. [DOI] [PubMed] [Google Scholar]
- 12.Kitamura T, Pignatelli M, Suh J, Kohara K, Yoshiki A, Abe K, Tonegawa S. Island cells control temporal association memory. Science 343: 896–901, 2014. doi: 10.1126/science.1244634. [DOI] [PMC free article] [PubMed] [Google Scholar]
- 13.Ray S, Naumann R, Burgalossi A, Tang Q, Schmidt H, Brecht M. Grid-layout and theta-modulation of layer 2 pyramidal neurons in medial entorhinal cortex. Science 343: 891–896, 2014. doi: 10.1126/science.1243028. [DOI] [PubMed] [Google Scholar]
- 14.Witter MP, Doan TP, Jacobsen B, Nilssen ES, Ohara S. Architecture of the entorhinal cortex—a review of entorhinal anatomy in rodents with some comparative notes. Front Syst Neurosci 11: 46, 2017. doi: 10.3389/fnsys.2017.00046. [DOI] [PMC free article] [PubMed] [Google Scholar]
- 15.Varga C, Lee SY, Soltesz I. Target-selective GABAergic control of entorhinal cortex output. Nat Neurosci 13: 822–824, 2010. doi: 10.1038/nn.2570. [DOI] [PMC free article] [PubMed] [Google Scholar]
- 16.Zutshi I, Fu ML, Lilascharoen V, Leutgeb JK, Lim BK, Leutgeb S. Recurrent circuits within medial entorhinal cortex superficial layers support grid cell firing. Nat Commun 9: 3701, 2018. doi: 10.1038/s41467-018-06104-5. [DOI] [PMC free article] [PubMed] [Google Scholar]
- 17.Leitner FC, Melzer S, Lutcke H, Pinna R, Seeburg PH, Helmchen F, Monyer H. Spatially segregated feedforward and feedback neurons support differential odor processing in the lateral entorhinal cortex. Nat Neurosci 19: 935–944, 2016. doi: 10.1038/nn.4303. [DOI] [PubMed] [Google Scholar]
- 18.Pilli J, Abbasi S, Richardson M, Kumar SS. Diversity and excitability of deep-layer entorhinal cortical neurons in a model of temporal lobe epilepsy. J Neurophysiol 108: 1724–1738, 2012. doi: 10.1152/jn.00364.2012. [DOI] [PubMed] [Google Scholar]
- 19.Steward O, Scoville SA. Cells of origin of entorhinal cortical afferents to the hippocampus and fascia dentata of the rat. J Comp Neurol 169: 347–370, 1976. doi: 10.1002/cne.901690306. [DOI] [PubMed] [Google Scholar]
- 20.Masurkar AV, Srinivas KV, Brann DH, Warren R, Lowes DC, Siegelbaum SA. Medial and lateral entorhinal cortex differentially excite deep versus superficial CA1 pyramidal neurons. Cell Rep 18: 148–160, 2017. doi: 10.1016/j.celrep.2016.12.012. [DOI] [PMC free article] [PubMed] [Google Scholar]
- 21.Tamamaki N, Nojyo Y. Preservation of topography in the connections between the subiculum, field CA1, and the entorhinal cortex in rats. J Comp Neurol 353: 379–390, 1995. doi: 10.1002/cne.903530306. [DOI] [PubMed] [Google Scholar]
- 22.Lorente de No R. Studies on the structure of the cerebral cortex ii continuation of the studies of the ammonic system. J Psychol Neurol 46: 113–177, 1934. [Google Scholar]
- 23.Naber PA, Lopes da Silva FH, Witter MP. Reciprocal connections between the entorhinal cortex and hippocampal fields CA1 and the subiculum are in register with the projections from CA1 to the subiculum. Hippocampus 11: 99–104, 2001. doi: 10.1002/hipo.1028. [DOI] [PubMed] [Google Scholar]
- 24.Kumar S, Kumar SS. A model for predicting cation selectivity and permeability in AMPA and NMDA receptors based on receptor subunit composition. Front Synaptic Neurosci 13: 779759, 2021. doi: 10.3389/fnsyn.2021.779759. [DOI] [PMC free article] [PubMed] [Google Scholar]
- 25.Hansen KB, Yi F, Perszyk RE, Furukawa H, Wollmuth LP, Gibb AJ, Traynelis SF. Structure, function, and allosteric modulation of NMDA receptors. J Gen Physiol 150: 1081–1105, 2018. doi: 10.1085/jgp.201812032. [DOI] [PMC free article] [PubMed] [Google Scholar]
- 26.Traynelis SF, Wollmuth LP, McBain CJ, Menniti FS, Vance KM, Ogden KK, Hansen KB, Yuan H, Myers SJ, Dingledine R. Glutamate receptor ion channels: structure, regulation, and function. Pharmacol Rev 62: 405–496, 2010. doi: 10.1124/pr.109.002451. [DOI] [PMC free article] [PubMed] [Google Scholar]
- 27.Sheng M, Cummings J, Roldan LA, Jan YN, Jan LY. Changing subunit composition of heteromeric NMDA receptors during development of rat cortex. Nature 368: 144–147, 1994. doi: 10.1038/368144a0. [DOI] [PubMed] [Google Scholar]
- 28.Kumar SS, Huguenard JR. Pathway-specific differences in subunit composition of synaptic NMDA receptors on pyramidal neurons in neocortex. J Neurosci 23: 10074–10083, 2003. doi: 10.1523/JNEUROSCI.23-31-10074.2003. [DOI] [PMC free article] [PubMed] [Google Scholar]
- 29.Chazot PL, Stephenson FA. Molecular dissection of native mammalian forebrain NMDA receptors containing the NR1 C2 exon: direct demonstration of NMDA receptors comprising NR1, NR2A, and NR2B subunits within the same complex. J Neurochem 69: 2138–2144, 1997. doi: 10.1046/j.1471-4159.1997.69052138.x. [DOI] [PubMed] [Google Scholar]
- 30.Luo J, Wang Y, Yasuda RP, Dunah AW, Wolfe BB. The majority of N-methyl-d-aspartate receptor complexes in adult rat cerebral cortex contain at least three different subunits (NR1/NR2A/NR2B). Mol Pharmacol 51: 79–86, 1997. doi: 10.1124/mol.51.1.79. [DOI] [PubMed] [Google Scholar]
- 31.Hatton CJ, Paoletti P. Modulation of triheteromeric NMDA receptors by N-terminal domain ligands. Neuron 46: 261–274, 2005. doi: 10.1016/j.neuron.2005.03.005. [DOI] [PubMed] [Google Scholar]
- 32.Tovar KR, McGinley MJ, Westbrook GL. Triheteromeric NMDA receptors at hippocampal synapses. J Neurosci 33: 9150–9160, 2013. doi: 10.1523/JNEUROSCI.0829-13.2013. [DOI] [PMC free article] [PubMed] [Google Scholar]
- 33.Pilli J, Kumar SS. Triheteromeric N-methyl-d-aspartate receptors differentiate synaptic inputs onto pyramidal neurons in somatosensory cortex: involvement of the GluN3A subunit. Neuroscience 222: 75–88, 2012. doi: 10.1016/j.neuroscience.2012.07.020. [DOI] [PubMed] [Google Scholar]
- 34.Pilli J, Kumar SS. Potentiation of convergent synaptic inputs onto pyramidal neurons in somatosensory cortex: dependence on brain wave frequencies and NMDA receptor subunit composition. Neuroscience 272: 271–285, 2014. doi: 10.1016/j.neuroscience.2014.04.062. [DOI] [PubMed] [Google Scholar]
- 35.Beesley S, Sullenberger T, Pilli J, Abbasi S, Gunjan A, Kumar SS. Colocalization of distinct NMDA receptor subtypes at excitatory synapses in the entorhinal cortex. J Neurophysiol 121: 238–254, 2019. doi: 10.1152/jn.00468.2018. [DOI] [PMC free article] [PubMed] [Google Scholar]
- 36.Beesley S, Sullenberger T, Kumar SS. The GluN3 subunit regulates ion selectivity within native N-methyl-d-aspartate receptors. IBRO Rep 9: 147–156, 2020. doi: 10.1016/j.ibror.2020.07.009. [DOI] [PMC free article] [PubMed] [Google Scholar]
- 37.Kumar SS. Functional detection of novel triheteromeric NMDA receptors. In: Ionotropic Glutamate Receptor Technologies, edited by Popescu GK. New York: Springer, 2016, p. 71–80. [Google Scholar]
- 38.Lein ES, Hawrylycz MJ, Ao N, Ayres M, Bensinger A, Bernard A, et al. Genome-wide atlas of gene expression in the adult mouse brain. Nature 445: 168–176, 2007. doi: 10.1038/nature05453. [DOI] [PubMed] [Google Scholar]
- 39.Chatterton JE, Awobuluyi M, Premkumar LS, Takahashi H, Talantova M, Shin Y, Cui J, Tu S, Sevarino KA, Nakanishi N, Tong G, Lipton SA, Zhang D. Excitatory glycine receptors containing the NR3 family of NMDA receptor subunits. Nature 415: 793–798, 2002. doi: 10.1038/nature715. [DOI] [PubMed] [Google Scholar]
- 40.Beesley S, Sullenberger T, Crotty K, Ailani R, D'Orio C, Evans K, Ogunkunle EO, Roper MG, Kumar SS. d-Serine mitigates cell loss associated with temporal lobe epilepsy. Nat Commun 11: 4966, 2020. doi: 10.1038/s41467-020-18757-2. [DOI] [PMC free article] [PubMed] [Google Scholar]
- 41.Sucher NJ, Akbarian S, Chi CL, Leclerc CL, Awobuluyi M, Deitcher DL, Wu MK, Yuan JP, Jones EG, Lipton SA. Developmental and regional expression pattern of a novel NMDA receptor-like subunit (NMDAR-L) in the rodent brain. J Neurosci 15: 6509–6520, 1995. doi: 10.1523/JNEUROSCI.15-10-06509.1995. [DOI] [PMC free article] [PubMed] [Google Scholar]
- 42.Ciabarra AM, Sullivan JM, Gahn LG, Pecht G, Heinemann S, Sevarino KA. Cloning and characterization of chi-1: a developmentally regulated member of a novel class of the ionotropic glutamate receptor family. J Neurosci 15: 6498–6508, 1995. doi: 10.1523/JNEUROSCI.15-10-06498.1995. [DOI] [PMC free article] [PubMed] [Google Scholar]
- 43.Murillo A, Navarro AI, Puelles E, Zhang Y, Petros TJ, Perez-Otano I. Temporal dynamics and neuronal specificity of Grin3a expression in the mouse forebrain. Cereb Cortex 31: 1914–1926, 2021. doi: 10.1093/cercor/bhaa330. [DOI] [PMC free article] [PubMed] [Google Scholar]
- 44.Otsu Y, Darcq E, Pietrajtis K, Matyas F, Schwartz E, Bessaih T, Abi Gerges S, Rousseau CV, Grand T, Dieudonne S, Paoletti P, Acsady L, Agulhon C, Kieffer BL, Diana MA. Control of aversion by glycine-gated GluN1/GluN3A NMDA receptors in the adult medial habenula. Science 366: 250–254, 2019. doi: 10.1126/science.aax1522. [DOI] [PMC free article] [PubMed] [Google Scholar]
- 45.Zhu Z, Yi F, Epplin MP, Liu D, Summer SL, Mizu R, Shaulsky G, XiangWei W, Tang W, Burger PB, Menaldino DS, Myers SJ, Liotta DC, Hansen KB, Yuan H, Traynelis SF. Negative allosteric modulation of GluN1/GluN3 NMDA receptors. Neuropharmacology 176: 108117, 2020. doi: 10.1016/j.neuropharm.2020.108117. [DOI] [PMC free article] [PubMed] [Google Scholar]
- 46.Tong G, Takahashi H, Tu S, Shin Y, Talantova M, Zago W, Xia P, Nie Z, Goetz T, Zhang D, Lipton SA, Nakanishi N. Modulation of NMDA receptor properties and synaptic transmission by the NR3A subunit in mouse hippocampal and cerebrocortical neurons. J Neurophysiol 99: 122–132, 2008. doi: 10.1152/jn.01044.2006. [DOI] [PMC free article] [PubMed] [Google Scholar]
- 47.Wang XJ. Macroscopic gradients of synaptic excitation and inhibition in the neocortex. Nat Rev Neurosci 21: 169–178, 2020. doi: 10.1038/s41583-020-0262-x. [DOI] [PMC free article] [PubMed] [Google Scholar]
- 48.Goulas A, Changeux JP, Wagstyl K, Amunts K, Palomero-Gallagher N, Hilgetag CC. The natural axis of transmitter receptor distribution in the human cerebral cortex. Proc Natl Acad Sci USA 118, 2021. doi: 10.1073/pnas.2020574118. [DOI] [PMC free article] [PubMed] [Google Scholar]
- 49.Goulas A, Zilles K, Hilgetag CC. Cortical gradients and laminar projections in mammals. Trends Neurosci 41: 775–788, 2018. doi: 10.1016/j.tins.2018.06.003. [DOI] [PubMed] [Google Scholar]
- 50.Margulies DS, Ghosh SS, Goulas A, Falkiewicz M, Huntenburg JM, Langs G, Bezgin G, Eickhoff SB, Castellanos FX, Petrides M, Jefferies E, Smallwood J. Situating the default-mode network along a principal gradient of macroscale cortical organization. Proc Natl Acad Sci USA 113: 12574–12579, 2016. doi: 10.1073/pnas.1608282113. [DOI] [PMC free article] [PubMed] [Google Scholar]
- 51.Wagstyl K, Larocque S, Cucurull G, Lepage C, Cohen JP, Bludau S, Palomero-Gallagher N, Lewis LB, Funck T, Spitzer H, Dickscheid T, Fletcher PC, Romero A, Zilles K, Amunts K, Bengio Y, Evans AC. BigBrain 3D atlas of cortical layers: cortical and laminar thickness gradients diverge in sensory and motor cortices. PLoS Biol 18: e3000678, 2020. doi: 10.1371/journal.pbio.3000678. [DOI] [PMC free article] [PubMed] [Google Scholar]
- 52.Hilgetag CC, Beul SF, van Albada SJ, Goulas A. An architectonic type principle integrates macroscopic cortico-cortical connections with intrinsic cortical circuits of the primate brain. Netw Neurosci 3: 905–923, 2019. doi: 10.1162/netn_a_00100. [DOI] [PMC free article] [PubMed] [Google Scholar]
- 53.Glasser MF, Van Essen DC. Mapping human cortical areas in vivo based on myelin content as revealed by T1- and T2-weighted MRI. J Neurosci 31: 11597–11616, 2011. doi: 10.1523/JNEUROSCI.2180-11.2011. [DOI] [PMC free article] [PubMed] [Google Scholar]
- 54.Huntenburg JM, Bazin PL, Goulas A, Tardif CL, Villringer A, Margulies DS. A systematic relationship between functional connectivity and intracortical myelin in the human cerebral cortex. Cereb Cortex 27: 981–997, 2017. doi: 10.1093/cercor/bhx030. [DOI] [PMC free article] [PubMed] [Google Scholar]
- 55.Burt JB, Demirtaş M, Eckner WJ, Navejar NM, Ji JL, Martin WJ, Bernacchia A, Anticevic A, Murray JD. Hierarchy of transcriptomic specialization across human cortex captured by structural neuroimaging topography. Nat Neurosci 21: 1251–1259, 2018. doi: 10.1038/s41593-018-0195-0. [DOI] [PMC free article] [PubMed] [Google Scholar]
- 56.Moroni F, Nobili L, Curcio G, De Carli F, Fratello F, Marzano C, De Gennaro L, Ferrillo F, Cossu M, Francione S, Lo Russo G, Bertini M, Ferrara M. Sleep in the human hippocampus: a stereo-EEG study. PLoS One 2: e867, 2007. doi: 10.1371/journal.pone.0000867. [DOI] [PMC free article] [PubMed] [Google Scholar]